SuperMA 4hr STRATThis script seems to find a trend change fairy well on the 4hr with the default settings. It is adjustable for other time frames, though it seems that 4hr seems the most profitable. Enjoy.
The long/short logic is the same as the study, though the strat plots yellow while the price is inside the MA range.
Tip: 1AseP4EbtAdoGa9jKv691XC5oiNMrLwire
In den Scripts nach "range" suchen

STARC Bands Backtest A type of technical indicator that is created by plotting two bands around
a short-term simple moving average (SMA) of an underlying asset's price.
The upper band is created by adding a value of the average true range
(ATR) - a popular indicator used by technical traders - to the moving average.
The lower band is created by subtracting a value of the ATR from the SMA.
STARC is an acronym for Stoller Average Range Channels. The indicator is
named after its creator, Manning Stoller.
You can change long to short in the Input Settings
WARNING:
- For purpose educate only
- This script to change bars colors.

The Falcon - My BTC/USDT Strategy 5 min UTHello,
I made a custom indicator, I called it The Falcon because it reacts quickly and knows how to take perspective of the market.
This kind of indicator can be used for manual trading or bots.
About the indicator
In short, it will help you :
Make profit when the market is in trading range
Get in/Get out when a rally begins
Never go against the trend
I based my algorithm on several technical tools such as RSI , emas , for a total of 3 boolean conditions mixed together with AND and OR gates, resulting in those entry/exit points (arrows).
About the Strategy
I only used long entries and exits. No shorting.
It is tested on the last 18 days (the maximum TradingView allows for a 5 min range)
I set a 0.05% commission on each order.
I will grant access to people willing to make a small donation.
Here is my BTC address : 19sVQvCDmVfEACq7BiMnWSMqFPZ8qfSQ2K
If you prefer ETH : 0xc8a5d3a63a05db0c2363ea1c08b37a01cce9ebfb
Send me a Private Message with the ID of the transaction
If you want to do some forward testing first, send me a message.
This script comes with an Alert Setup.
I am also taking commissions if you want me to code something for you, or do some reverse engineering.
Also you can ask me anything in the comments.
Thanks and see you next time !

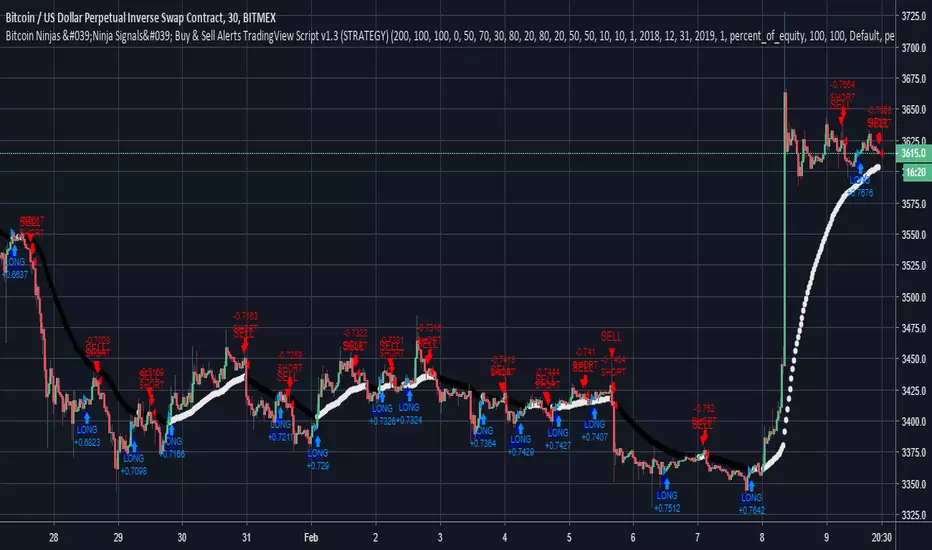
Bitcoin Ninjas 'Ninja Signals' Buy & Sell Alert Trading StrategyBitcoin Ninjas 'Ninja Signals' Buy/Sell Alerts & Backtesting TradingView Script
(for Cryptocurrencies, Forex, GunBot, ProfitTrailer, automatic trading software, and more)
Main Script:
-Allows users to easily set automated buy and sell alerts on TradingView for use with automatic and manual trading of cryptocurrencies, Forex securities, and more (alerts are compatible with automatic trading software such as GunBot, ProfitTrailer, and more).
-Synthesizes many powerful indicators [e.g. Relative Strength Index (RSI), stochastic RSI, Money Flow Index (MFI), Moving Average Convergence Divergence (MACD), etc.) into one super script to generate very precise buy and sell signals in almost any market condition.
-Buy arrows (blue) and sell arrows (red) can be changed or hidden for ease of viewing.
-No lag EMA trendline featuring trend-reversal color-coding (white uptrend, black downtrend).
-Adjustable ‘calibration’ setting allows users to customize the script to work for any currency or security available through TradingView, on any exchange, simply by adjusting a number.
-Complete with backtesting strategy version of script which allows users to test various buy and sell strategies based on the alerts the script generates (see info and screenshots below).
-Backtesting strategy incorporates a user-defined adjustable date range, so users can estimate the script’s performance over specific periods of time, such as the last day, week, or month.
-Backtesting strategy utilizes a minimum protective gain setting to help you never sell for a loss. Simply adjust your minimum profit (%) per trade, and the test results will update.
-Backtesting strategy allows for pyramid buying to test various average down / double up buying strategies. Simply adjust the number of pyramid buys and the quantity of each buy.
-Free 7-day trial available for TradingView users who join our free BitcoinNinjas community.
-Free 24/7 support via BitcoinNinjas Telegram GunBot support group with script purchase.
-Fully compatible with GunBot automatic trading software (TradingView plugin is required).
-Special discount available for traders who purchase GunBot automatic trading software and the GunBot TradingView plugin from BitcoinNinjas, allowing for fully automatic trading.
-Contact us via Email or Telegram for more information, to request additional / custom screenshots, or to start your free trial.
Screenshot (Script)
Screenshot (Backtesting Strategy)
Screenshot (Adjustable Calibration, Minimum Profit Per Trade, & Date Range)
Screenshot (Optional Pyramid / Average Down Buying)
Screenshot (Customizable Buy/Sell Arrows & Trend Reversal Line)
DISCLAIMER: By viewing and/or using this TradingView script, you agree to the BitcoinNinjas 'Terms of Use', as presented on our website ( BitcoinNinjas.org ) and as stated here. No sharing, copying, reselling, modifying, or any other forms of use, are authorized for this document. This document is strictly for individual use and informational purposes only. This is not financial or investment advice. Investments are always made at your own risk, and are based on yo
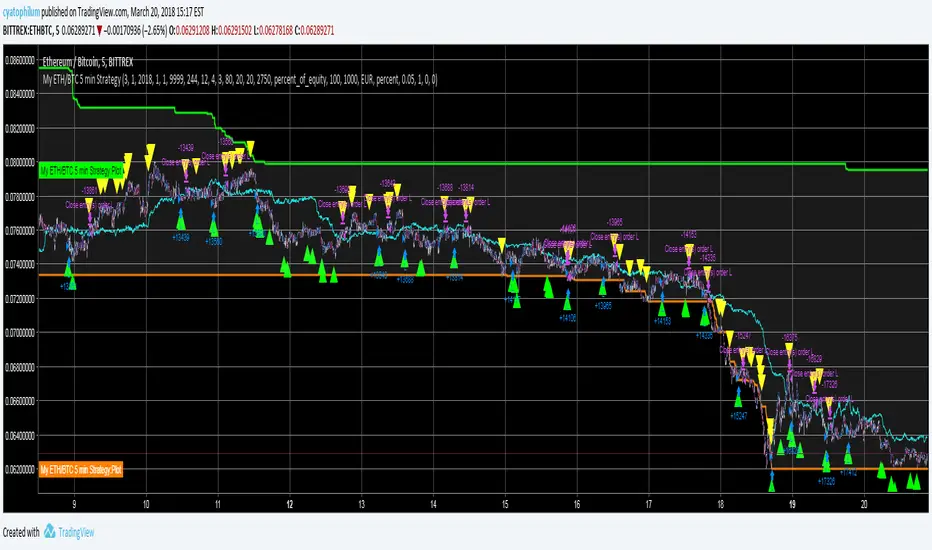
My ETH/BTC 5 min StrategyHello, beginner in trading here. Use this at your own risk.
Commission : 0.05%
Time Unit : 5 min
Backtest range : 15 days (looking like that is the maximum in 5 min UT)
Initial capital : 1000€
How it works :
Long entries and exits. That's all, no pyramiding, no shorting.
It takes the first buy signal (green triangle) and the first sell signal (yellow triangle)
The idea is to scalp while in range using stochastic, and to get out / in when a big trend appears (that is what the tunnel is for).
See the code for details.
I think those are pretty good result when we look at hueg negative buy and hold returns of this month of March. What do you think?
Kaufman Moving Average Adaptive (KAMA) Backtest Everyone wants a short-term, fast trading trend that works without large
losses. That combination does not exist. But it is possible to have fast
trading trends in which one must get in or out of the market quickly, but
these have the distinct disadvantage of being whipsawed by market noise
when the market is volatile in a sideways trending market. During these
periods, the trader is jumping in and out of positions with no profit-making
trend in sight. In an attempt to overcome the problem of noise and still be
able to get closer to the actual change of the trend, Kaufman developed an
indicator that adapts to market movement. This indicator, an adaptive moving
average (AMA), moves very slowly when markets are moving sideways but moves
swiftly when the markets also move swiftly, change directions or break out of
a trading range.
You can change long to short in the Input Settings
Please, use it only for learning or paper trading. Do not for real trading.

3-Bar-Reversal-Pattern Strategy Backtest This startegy based on 3-day pattern reversal described in "Are Three-Bar
Patterns Reliable For Stocks" article by Thomas Bulkowski, presented in
January, 2000 issue of Stocks&Commodities magazine.
That pattern conforms to the following rules:
- It uses daily prices, not intraday or weekly prices;
- The middle day of the three-day pattern has the lowest low of the three days, with no ties allowed;
- The last day must have a close above the prior day's high, with no ties allowed;
- Each day must have a nonzero trading range.
Please, use it only for learning or paper trading. Do not for real trading.

[STRATEGY][RS]The Illusion Strategy V0EXPERIMENTAL:
WARNING: this strategy does not work!!
one of the fallacy's of backtesting, renko chars signals usually will give signals when price is allready out of range.
Deviation Burn + Pivots + Advanced stop + Midpoint CancelA session-based range strategy that places buy and sell orders at the session high and low, expecting price reactions from these levels.
Additional filters help avoid low-probability trades.

MNO_2Step_Strategy_MOU_KAKU (Publish-Clear)//@version=5
strategy("MNO_2Step_Strategy_MOU_KAKU (Publish-Clear)", overlay=true, pyramiding=0,
max_labels_count=500, max_lines_count=500,
initial_capital=100000,
default_qty_type=strategy.percent_of_equity, default_qty_value=10)
// =========================
// Inputs
// =========================
emaSLen = input.int(5, "EMA Short (5)")
emaMLen = input.int(13, "EMA Mid (13)")
emaLLen = input.int(26, "EMA Long (26)")
macdFast = input.int(12, "MACD Fast")
macdSlow = input.int(26, "MACD Slow")
macdSignal = input.int(9, "MACD Signal")
macdZeroTh = input.float(0.2, "MOU: MACD near-zero threshold", step=0.05)
volLookback = input.int(5, "Volume MA days", minval=1)
volMinRatio = input.float(1.3, "MOU: Volume ratio min", step=0.1)
volStrong = input.float(1.5, "Strong volume ratio (Breakout/KAKU)", step=0.1)
volMaxRatio = input.float(3.0, "Volume ratio max (filter)", step=0.1)
wickBodyMult = input.float(2.0, "Pinbar: lowerWick >= body*x", step=0.1)
pivotLen = input.int(20, "Resistance lookback", minval=5)
pullMinPct = input.float(5.0, "Pullback min (%)", step=0.1)
pullMaxPct = input.float(15.0, "Pullback max (%)", step=0.1)
breakLookbackBars = input.int(5, "Pullback route: valid bars after break", minval=1)
// --- Breakout route (押し目なし初動ブレイク) ---
useBreakoutRoute = input.bool(true, "Enable MOU Breakout Route (no pullback)")
breakConfirmPct = input.float(0.3, "Break confirm: close > R*(1+%)", step=0.1)
bigBodyLookback = input.int(20, "Break candle body MA length", minval=5)
bigBodyMult = input.float(1.2, "Break candle: body >= MA*mult", step=0.1)
requireCloseNearHigh = input.bool(true, "Break candle: close near high")
closeNearHighPct = input.float(25.0, "Close near high threshold (% of range)", step=1.0)
allowMACDAboveZeroInstead = input.bool(true, "Breakout route: allow MACD GC above zero instead")
// 表示
showEMA = input.bool(true, "Plot EMAs")
showMouLabels = input.bool(true, "Show MOU/MOU-B labels")
showKakuLabels = input.bool(true, "Show KAKU labels")
showDebugTbl = input.bool(true, "Show debug table (last bar)")
showStatusLbl = input.bool(true, "Show status label (last bar always)")
locChoice = input.string("Below Bar", "Label location", options= )
lblLoc = locChoice == "Below Bar" ? location.belowbar : location.abovebar
// =========================
// 必ず決済が起きる設定(投稿クリア用)
// =========================
enableTPSL = input.bool(true, "Enable TP/SL")
tpPct = input.float(2.0, "Take Profit (%)", step=0.1, minval=0.1) // ←投稿クリア向けに近め
slPct = input.float(1.0, "Stop Loss (%)", step=0.1, minval=0.1) // ←投稿クリア向けに近め
maxHoldBars = input.int(30, "Max bars in trade (force close)", minval=1)
entryMode = input.string("MOU or KAKU", "Entry trigger", options= )
// ✅ 保険:トレード0件を避ける(投稿クリア用)
// 1回でもクローズトレードができたら自動で沈黙
publishAssist = input.bool(true, "Publish Assist (safety entry if 0 trades)")
// =========================
// EMA
// =========================
emaS = ta.ema(close, emaSLen)
emaM = ta.ema(close, emaMLen)
emaL = ta.ema(close, emaLLen)
plot(showEMA ? emaS : na, color=color.new(color.yellow, 0), title="EMA 5")
plot(showEMA ? emaM : na, color=color.new(color.blue, 0), title="EMA 13")
plot(showEMA ? emaL : na, color=color.new(color.orange, 0), title="EMA 26")
emaUpS = emaS > emaS
emaUpM = emaM > emaM
emaUpL = emaL > emaL
goldenOrder = emaS > emaM and emaM > emaL
above26_2days = close > emaL and close > emaL
baseTrendOK = (emaUpS and emaUpM and emaUpL) and goldenOrder and above26_2days
// =========================
// MACD
// =========================
= ta.macd(close, macdFast, macdSlow, macdSignal)
macdGC = ta.crossover(macdLine, macdSig)
macdUp = macdLine > macdLine
macdNearZero = math.abs(macdLine) <= macdZeroTh
macdGCAboveZero = macdGC and macdLine > 0 and macdSig > 0
macdMouOK = macdGC and macdNearZero and macdUp
macdBreakOK = allowMACDAboveZeroInstead ? (macdMouOK or macdGCAboveZero) : macdMouOK
// =========================
// Volume
// =========================
volMA = ta.sma(volume, volLookback)
volRatio = volMA > 0 ? (volume / volMA) : na
volumeMouOK = volRatio >= volMinRatio and volRatio <= volMaxRatio
volumeStrongOK = volRatio >= volStrong and volRatio <= volMaxRatio
// =========================
// Candle patterns
// =========================
body = math.abs(close - open)
upperWick = high - math.max(open, close)
lowerWick = math.min(open, close) - low
pinbar = (lowerWick >= wickBodyMult * body) and (lowerWick > upperWick) and (close >= open)
bullEngulf = close > open and close < open and close >= open and open <= close
bigBull = close > open and open < emaM and close > emaS and (body > ta.sma(body, 20))
candleOK = pinbar or bullEngulf or bigBull
// =========================
// Resistance / Pullback route
// =========================
res = ta.highest(high, pivotLen)
pullbackPct = res > 0 ? (res - close) / res * 100.0 : na
pullbackOK = pullbackPct >= pullMinPct and pullbackPct <= pullMaxPct
brokeRes = ta.crossover(close, res )
barsSinceBreak = ta.barssince(brokeRes)
afterBreakZone = (barsSinceBreak >= 0) and (barsSinceBreak <= breakLookbackBars)
pullbackRouteOK = afterBreakZone and pullbackOK
// =========================
// Breakout route (押し目なし初動ブレイク)
// =========================
breakConfirm = close > res * (1.0 + breakConfirmPct / 100.0)
bullBreak = close > open
bodyMA = ta.sma(body, bigBodyLookback)
bigBodyOK = bodyMA > 0 ? (body >= bodyMA * bigBodyMult) : false
rng = math.max(high - low, syminfo.mintick)
closeNearHighOK = not requireCloseNearHigh ? true : ((high - close) / rng * 100.0 <= closeNearHighPct)
mou_breakout = useBreakoutRoute and baseTrendOK and breakConfirm and bullBreak and bigBodyOK and closeNearHighOK and volumeStrongOK and macdBreakOK
mou_pullback = baseTrendOK and volumeMouOK and candleOK and macdMouOK and pullbackRouteOK
mou = mou_pullback or mou_breakout
// =========================
// KAKU (Strict): 8条件 + 最終三点
// =========================
cond1 = emaUpS and emaUpM and emaUpL
cond2 = goldenOrder
cond3 = above26_2days
cond4 = macdGCAboveZero
cond5 = volumeMouOK
cond6 = candleOK
cond7 = pullbackOK
cond8 = pullbackRouteOK
all8_strict = cond1 and cond2 and cond3 and cond4 and cond5 and cond6 and cond7 and cond8
final3 = pinbar and macdGCAboveZero and volumeStrongOK
kaku = all8_strict and final3
// =========================
// Entry (strategy)
// =========================
entrySignal = entryMode == "KAKU only" ? kaku : (mou or kaku)
canEnter = strategy.position_size == 0
newEntryKaku = canEnter and kaku and entrySignal
newEntryMouB = canEnter and (not kaku) and mou_breakout and entrySignal
newEntryMou = canEnter and (not kaku) and mou_pullback and entrySignal
// --- Publish Assist(保険エントリー) ---
// 条件が厳しすぎて「トレード0件」だと投稿時に警告が出る。
// closedtradesが0の間だけ、軽いEMAクロスで1回だけ拾う(その後は沈黙)。
assistFast = ta.ema(close, 5)
assistSlow = ta.ema(close, 20)
assistEntry = publishAssist and strategy.closedtrades == 0 and canEnter and ta.crossover(assistFast, assistSlow)
// 実エントリー
if newEntryKaku or newEntryMouB or newEntryMou or assistEntry
strategy.entry("LONG", strategy.long)
// ラベル(視認)
if showMouLabels and newEntryMou
label.new(bar_index, low, "猛(IN)", style=label.style_label_up, color=color.new(color.lime, 0), textcolor=color.black)
if showMouLabels and newEntryMouB
label.new(bar_index, low, "猛B(IN)", style=label.style_label_up, color=color.new(color.lime, 0), textcolor=color.black)
if showKakuLabels and newEntryKaku
label.new(bar_index, low, "確(IN)", style=label.style_label_up, color=color.new(color.yellow, 0), textcolor=color.black)
if assistEntry
label.new(bar_index, low, "ASSIST(IN)", style=label.style_label_up, color=color.new(color.aqua, 0), textcolor=color.black)
// =========================
// Exit (TP/SL + 強制クローズ)
// =========================
inPos = strategy.position_size > 0
tpPx = inPos ? strategy.position_avg_price * (1.0 + tpPct/100.0) : na
slPx = inPos ? strategy.position_avg_price * (1.0 - slPct/100.0) : na
if enableTPSL
strategy.exit("TP/SL", from_entry="LONG", limit=tpPx, stop=slPx)
// 最大保有バーで強制決済(これが「レポート無し」回避の最後の保険)
var int entryBar = na
if strategy.position_size > 0 and strategy.position_size == 0
entryBar := bar_index
if strategy.position_size == 0
entryBar := na
forceClose = inPos and not na(entryBar) and (bar_index - entryBar >= maxHoldBars)
if forceClose
strategy.close("LONG")
// =========================
// 利確/損切/強制クローズのラベル
// =========================
closedThisBar = (strategy.position_size > 0) and (strategy.position_size == 0)
avgPrev = strategy.position_avg_price
tpPrev = avgPrev * (1.0 + tpPct/100.0)
slPrev = avgPrev * (1.0 - slPct/100.0)
hitTP = closedThisBar and high >= tpPrev
hitSL = closedThisBar and low <= slPrev
// 同一足TP/SL両方は厳密に判断できないので、表示は「TP優先」で簡略(投稿ギリギリ版)
if hitTP
label.new(bar_index, high, "利確", style=label.style_label_down, color=color.new(color.lime, 0), textcolor=color.black)
else if hitSL
label.new(bar_index, low, "損切", style=label.style_label_up, color=color.new(color.red, 0), textcolor=color.white)
else if closedThisBar and forceClose
label.new(bar_index, close, "時間決済", style=label.style_label_left, color=color.new(color.gray, 0), textcolor=color.white)
// =========================
// Signals (猛/猛B/確)
// =========================
plotshape(showMouLabels and mou_pullback and not kaku, title="MOU_PULLBACK", style=shape.labelup, text="猛",
color=color.new(color.lime, 0), textcolor=color.black, location=lblLoc, size=size.tiny)
plotshape(showMouLabels and mou_breakout and not kaku, title="MOU_BREAKOUT", style=shape.labelup, text="猛B",
color=color.new(color.lime, 0), textcolor=color.black, location=lblLoc, size=size.tiny)
plotshape(showKakuLabels and kaku, title="KAKU", style=shape.labelup, text="確",
color=color.new(color.yellow, 0), textcolor=color.black, location=lblLoc, size=size.small)
// =========================
// Alerts
// =========================
alertcondition(mou, title="MNO_MOU", message="MNO: MOU triggered")
alertcondition(mou_breakout, title="MNO_MOU_BREAKOUT", message="MNO: MOU Breakout triggered")
alertcondition(mou_pullback, title="MNO_MOU_PULLBACK", message="MNO: MOU Pullback triggered")
alertcondition(kaku, title="MNO_KAKU", message="MNO: KAKU triggered")
alertcondition(assistEntry, title="MNO_ASSIST_ENTRY", message="MNO: ASSIST ENTRY (publish safety)")
// =========================
// Status label(最終足に必ず表示)
// =========================
var label status = na
if showStatusLbl and barstate.islast
label.delete(status)
statusTxt =
"MNO RUNNING\n" +
"ClosedTrades: " + str.tostring(strategy.closedtrades) + "\n" +
"BaseTrend: " + (baseTrendOK ? "OK" : "NO") + "\n" +
"MOU: " + (mou ? "YES" : "no") + " (猛=" + (mou_pullback ? "Y" : "n") + " / 猛B=" + (mou_breakout ? "Y" : "n") + ")\n" +
"KAKU: " + (kaku ? "YES" : "no") + "\n" +
"VolRatio: " + (na(volRatio) ? "na" : str.tostring(volRatio, format.mintick)) + "\n" +
"Pull%: " + (na(pullbackPct) ? "na" : str.tostring(pullbackPct, format.mintick)) + "\n" +
"Pos: " + (inPos ? "IN" : "OUT")
status := label.new(bar_index, high, statusTxt, style=label.style_label_left, textcolor=color.white, color=color.new(color.black, 0))
// =========================
// Debug table(最終足のみ)
// =========================
var table t = table.new(position.top_right, 2, 14, border_width=1, border_color=color.new(color.white, 60))
fRow(_name, _cond, _r) =>
bg = _cond ? color.new(color.lime, 70) : color.new(color.red, 80)
tx = _cond ? "OK" : "NO"
table.cell(t, 0, _r, _name, text_color=color.white, bgcolor=color.new(color.black, 0))
table.cell(t, 1, _r, tx, text_color=color.white, bgcolor=bg)
if showDebugTbl and barstate.islast
table.cell(t, 0, 0, "MNO Debug", text_color=color.white, bgcolor=color.new(color.black, 0))
table.cell(t, 1, 0, "", text_color=color.white, bgcolor=color.new(color.black, 0))
fRow("BaseTrend", baseTrendOK, 1)
fRow("MOU Pullback", mou_pullback, 2)
fRow("MOU Breakout", mou_breakout, 3)
fRow("Break confirm", breakConfirm, 4)
fRow("Break big body", bigBodyOK, 5)
fRow("Break close high", closeNearHighOK, 6)
fRow("Break vol strong", volumeStrongOK, 7)
fRow("Break MACD", macdBreakOK, 8)
fRow("KAKU all8", all8_strict, 9)
fRow("KAKU final3", final3, 10)
fRow("AssistEntry", assistEntry, 11)
fRow("ClosedTrades>0", strategy.closedtrades > 0, 12)

just takesi TimeMNO_2Step_Strategy_MOU_KAKU (Publish-Clear)//@version=5
strategy("MNO_2Step_Strategy_MOU_KAKU (Publish-Clear)", overlay=true, pyramiding=0,
max_labels_count=500, max_lines_count=500,
initial_capital=100000,
default_qty_type=strategy.percent_of_equity, default_qty_value=10)
// =========================
// Inputs
// =========================
emaSLen = input.int(5, "EMA Short (5)")
emaMLen = input.int(13, "EMA Mid (13)")
emaLLen = input.int(26, "EMA Long (26)")
macdFast = input.int(12, "MACD Fast")
macdSlow = input.int(26, "MACD Slow")
macdSignal = input.int(9, "MACD Signal")
macdZeroTh = input.float(0.2, "MOU: MACD near-zero threshold", step=0.05)
volLookback = input.int(5, "Volume MA days", minval=1)
volMinRatio = input.float(1.3, "MOU: Volume ratio min", step=0.1)
volStrong = input.float(1.5, "Strong volume ratio (Breakout/KAKU)", step=0.1)
volMaxRatio = input.float(3.0, "Volume ratio max (filter)", step=0.1)
wickBodyMult = input.float(2.0, "Pinbar: lowerWick >= body*x", step=0.1)
pivotLen = input.int(20, "Resistance lookback", minval=5)
pullMinPct = input.float(5.0, "Pullback min (%)", step=0.1)
pullMaxPct = input.float(15.0, "Pullback max (%)", step=0.1)
breakLookbackBars = input.int(5, "Pullback route: valid bars after break", minval=1)
// --- Breakout route (押し目なし初動ブレイク) ---
useBreakoutRoute = input.bool(true, "Enable MOU Breakout Route (no pullback)")
breakConfirmPct = input.float(0.3, "Break confirm: close > R*(1+%)", step=0.1)
bigBodyLookback = input.int(20, "Break candle body MA length", minval=5)
bigBodyMult = input.float(1.2, "Break candle: body >= MA*mult", step=0.1)
requireCloseNearHigh = input.bool(true, "Break candle: close near high")
closeNearHighPct = input.float(25.0, "Close near high threshold (% of range)", step=1.0)
allowMACDAboveZeroInstead = input.bool(true, "Breakout route: allow MACD GC above zero instead")
// 表示
showEMA = input.bool(true, "Plot EMAs")
showMouLabels = input.bool(true, "Show MOU/MOU-B labels")
showKakuLabels = input.bool(true, "Show KAKU labels")
showDebugTbl = input.bool(true, "Show debug table (last bar)")
showStatusLbl = input.bool(true, "Show status label (last bar always)")
locChoice = input.string("Below Bar", "Label location", options= )
lblLoc = locChoice == "Below Bar" ? location.belowbar : location.abovebar
// =========================
// 必ず決済が起きる設定(投稿クリア用)
// =========================
enableTPSL = input.bool(true, "Enable TP/SL")
tpPct = input.float(2.0, "Take Profit (%)", step=0.1, minval=0.1) // ←投稿クリア向けに近め
slPct = input.float(1.0, "Stop Loss (%)", step=0.1, minval=0.1) // ←投稿クリア向けに近め
maxHoldBars = input.int(30, "Max bars in trade (force close)", minval=1)
entryMode = input.string("MOU or KAKU", "Entry trigger", options= )
// ✅ 保険:トレード0件を避ける(投稿クリア用)
// 1回でもクローズトレードができたら自動で沈黙
publishAssist = input.bool(true, "Publish Assist (safety entry if 0 trades)")
// =========================
// EMA
// =========================
emaS = ta.ema(close, emaSLen)
emaM = ta.ema(close, emaMLen)
emaL = ta.ema(close, emaLLen)
plot(showEMA ? emaS : na, color=color.new(color.yellow, 0), title="EMA 5")
plot(showEMA ? emaM : na, color=color.new(color.blue, 0), title="EMA 13")
plot(showEMA ? emaL : na, color=color.new(color.orange, 0), title="EMA 26")
emaUpS = emaS > emaS
emaUpM = emaM > emaM
emaUpL = emaL > emaL
goldenOrder = emaS > emaM and emaM > emaL
above26_2days = close > emaL and close > emaL
baseTrendOK = (emaUpS and emaUpM and emaUpL) and goldenOrder and above26_2days
// =========================
// MACD
// =========================
= ta.macd(close, macdFast, macdSlow, macdSignal)
macdGC = ta.crossover(macdLine, macdSig)
macdUp = macdLine > macdLine
macdNearZero = math.abs(macdLine) <= macdZeroTh
macdGCAboveZero = macdGC and macdLine > 0 and macdSig > 0
macdMouOK = macdGC and macdNearZero and macdUp
macdBreakOK = allowMACDAboveZeroInstead ? (macdMouOK or macdGCAboveZero) : macdMouOK
// =========================
// Volume
// =========================
volMA = ta.sma(volume, volLookback)
volRatio = volMA > 0 ? (volume / volMA) : na
volumeMouOK = volRatio >= volMinRatio and volRatio <= volMaxRatio
volumeStrongOK = volRatio >= volStrong and volRatio <= volMaxRatio
// =========================
// Candle patterns
// =========================
body = math.abs(close - open)
upperWick = high - math.max(open, close)
lowerWick = math.min(open, close) - low
pinbar = (lowerWick >= wickBodyMult * body) and (lowerWick > upperWick) and (close >= open)
bullEngulf = close > open and close < open and close >= open and open <= close
bigBull = close > open and open < emaM and close > emaS and (body > ta.sma(body, 20))
candleOK = pinbar or bullEngulf or bigBull
// =========================
// Resistance / Pullback route
// =========================
res = ta.highest(high, pivotLen)
pullbackPct = res > 0 ? (res - close) / res * 100.0 : na
pullbackOK = pullbackPct >= pullMinPct and pullbackPct <= pullMaxPct
brokeRes = ta.crossover(close, res )
barsSinceBreak = ta.barssince(brokeRes)
afterBreakZone = (barsSinceBreak >= 0) and (barsSinceBreak <= breakLookbackBars)
pullbackRouteOK = afterBreakZone and pullbackOK
// =========================
// Breakout route (押し目なし初動ブレイク)
// =========================
breakConfirm = close > res * (1.0 + breakConfirmPct / 100.0)
bullBreak = close > open
bodyMA = ta.sma(body, bigBodyLookback)
bigBodyOK = bodyMA > 0 ? (body >= bodyMA * bigBodyMult) : false
rng = math.max(high - low, syminfo.mintick)
closeNearHighOK = not requireCloseNearHigh ? true : ((high - close) / rng * 100.0 <= closeNearHighPct)
mou_breakout = useBreakoutRoute and baseTrendOK and breakConfirm and bullBreak and bigBodyOK and closeNearHighOK and volumeStrongOK and macdBreakOK
mou_pullback = baseTrendOK and volumeMouOK and candleOK and macdMouOK and pullbackRouteOK
mou = mou_pullback or mou_breakout
// =========================
// KAKU (Strict): 8条件 + 最終三点
// =========================
cond1 = emaUpS and emaUpM and emaUpL
cond2 = goldenOrder
cond3 = above26_2days
cond4 = macdGCAboveZero
cond5 = volumeMouOK
cond6 = candleOK
cond7 = pullbackOK
cond8 = pullbackRouteOK
all8_strict = cond1 and cond2 and cond3 and cond4 and cond5 and cond6 and cond7 and cond8
final3 = pinbar and macdGCAboveZero and volumeStrongOK
kaku = all8_strict and final3
// =========================
// Entry (strategy)
// =========================
entrySignal = entryMode == "KAKU only" ? kaku : (mou or kaku)
canEnter = strategy.position_size == 0
newEntryKaku = canEnter and kaku and entrySignal
newEntryMouB = canEnter and (not kaku) and mou_breakout and entrySignal
newEntryMou = canEnter and (not kaku) and mou_pullback and entrySignal
// --- Publish Assist(保険エントリー) ---
// 条件が厳しすぎて「トレード0件」だと投稿時に警告が出る。
// closedtradesが0の間だけ、軽いEMAクロスで1回だけ拾う(その後は沈黙)。
assistFast = ta.ema(close, 5)
assistSlow = ta.ema(close, 20)
assistEntry = publishAssist and strategy.closedtrades == 0 and canEnter and ta.crossover(assistFast, assistSlow)
// 実エントリー
if newEntryKaku or newEntryMouB or newEntryMou or assistEntry
strategy.entry("LONG", strategy.long)
// ラベル(視認)
if showMouLabels and newEntryMou
label.new(bar_index, low, "猛(IN)", style=label.style_label_up, color=color.new(color.lime, 0), textcolor=color.black)
if showMouLabels and newEntryMouB
label.new(bar_index, low, "猛B(IN)", style=label.style_label_up, color=color.new(color.lime, 0), textcolor=color.black)
if showKakuLabels and newEntryKaku
label.new(bar_index, low, "確(IN)", style=label.style_label_up, color=color.new(color.yellow, 0), textcolor=color.black)
if assistEntry
label.new(bar_index, low, "ASSIST(IN)", style=label.style_label_up, color=color.new(color.aqua, 0), textcolor=color.black)
// =========================
// Exit (TP/SL + 強制クローズ)
// =========================
inPos = strategy.position_size > 0
tpPx = inPos ? strategy.position_avg_price * (1.0 + tpPct/100.0) : na
slPx = inPos ? strategy.position_avg_price * (1.0 - slPct/100.0) : na
if enableTPSL
strategy.exit("TP/SL", from_entry="LONG", limit=tpPx, stop=slPx)
// 最大保有バーで強制決済(これが「レポート無し」回避の最後の保険)
var int entryBar = na
if strategy.position_size > 0 and strategy.position_size == 0
entryBar := bar_index
if strategy.position_size == 0
entryBar := na
forceClose = inPos and not na(entryBar) and (bar_index - entryBar >= maxHoldBars)
if forceClose
strategy.close("LONG")
// =========================
// 利確/損切/強制クローズのラベル
// =========================
closedThisBar = (strategy.position_size > 0) and (strategy.position_size == 0)
avgPrev = strategy.position_avg_price
tpPrev = avgPrev * (1.0 + tpPct/100.0)
slPrev = avgPrev * (1.0 - slPct/100.0)
hitTP = closedThisBar and high >= tpPrev
hitSL = closedThisBar and low <= slPrev
// 同一足TP/SL両方は厳密に判断できないので、表示は「TP優先」で簡略(投稿ギリギリ版)
if hitTP
label.new(bar_index, high, "利確", style=label.style_label_down, color=color.new(color.lime, 0), textcolor=color.black)
else if hitSL
label.new(bar_index, low, "損切", style=label.style_label_up, color=color.new(color.red, 0), textcolor=color.white)
else if closedThisBar and forceClose
label.new(bar_index, close, "時間決済", style=label.style_label_left, color=color.new(color.gray, 0), textcolor=color.white)
// =========================
// Signals (猛/猛B/確)
// =========================
plotshape(showMouLabels and mou_pullback and not kaku, title="MOU_PULLBACK", style=shape.labelup, text="猛",
color=color.new(color.lime, 0), textcolor=color.black, location=lblLoc, size=size.tiny)
plotshape(showMouLabels and mou_breakout and not kaku, title="MOU_BREAKOUT", style=shape.labelup, text="猛B",
color=color.new(color.lime, 0), textcolor=color.black, location=lblLoc, size=size.tiny)
plotshape(showKakuLabels and kaku, title="KAKU", style=shape.labelup, text="確",
color=color.new(color.yellow, 0), textcolor=color.black, location=lblLoc, size=size.small)
// =========================
// Alerts
// =========================
alertcondition(mou, title="MNO_MOU", message="MNO: MOU triggered")
alertcondition(mou_breakout, title="MNO_MOU_BREAKOUT", message="MNO: MOU Breakout triggered")
alertcondition(mou_pullback, title="MNO_MOU_PULLBACK", message="MNO: MOU Pullback triggered")
alertcondition(kaku, title="MNO_KAKU", message="MNO: KAKU triggered")
alertcondition(assistEntry, title="MNO_ASSIST_ENTRY", message="MNO: ASSIST ENTRY (publish safety)")
// =========================
// Status label(最終足に必ず表示)
// =========================
var label status = na
if showStatusLbl and barstate.islast
label.delete(status)
statusTxt =
"MNO RUNNING\n" +
"ClosedTrades: " + str.tostring(strategy.closedtrades) + "\n" +
"BaseTrend: " + (baseTrendOK ? "OK" : "NO") + "\n" +
"MOU: " + (mou ? "YES" : "no") + " (猛=" + (mou_pullback ? "Y" : "n") + " / 猛B=" + (mou_breakout ? "Y" : "n") + ")\n" +
"KAKU: " + (kaku ? "YES" : "no") + "\n" +
"VolRatio: " + (na(volRatio) ? "na" : str.tostring(volRatio, format.mintick)) + "\n" +
"Pull%: " + (na(pullbackPct) ? "na" : str.tostring(pullbackPct, format.mintick)) + "\n" +
"Pos: " + (inPos ? "IN" : "OUT")
status := label.new(bar_index, high, statusTxt, style=label.style_label_left, textcolor=color.white, color=color.new(color.black, 0))
// =========================
// Debug table(最終足のみ)
// =========================
var table t = table.new(position.top_right, 2, 14, border_width=1, border_color=color.new(color.white, 60))
fRow(_name, _cond, _r) =>
bg = _cond ? color.new(color.lime, 70) : color.new(color.red, 80)
tx = _cond ? "OK" : "NO"
table.cell(t, 0, _r, _name, text_color=color.white, bgcolor=color.new(color.black, 0))
table.cell(t, 1, _r, tx, text_color=color.white, bgcolor=bg)
if showDebugTbl and barstate.islast
table.cell(t, 0, 0, "MNO Debug", text_color=color.white, bgcolor=color.new(color.black, 0))
table.cell(t, 1, 0, "", text_color=color.white, bgcolor=color.new(color.black, 0))
fRow("BaseTrend", baseTrendOK, 1)
fRow("MOU Pullback", mou_pullback, 2)
fRow("MOU Breakout", mou_breakout, 3)
fRow("Break confirm", breakConfirm, 4)
fRow("Break big body", bigBodyOK, 5)
fRow("Break close high", closeNearHighOK, 6)
fRow("Break vol strong", volumeStrongOK, 7)
fRow("Break MACD", macdBreakOK, 8)
fRow("KAKU all8", all8_strict, 9)
fRow("KAKU final3", final3, 10)
fRow("AssistEntry", assistEntry, 11)
fRow("ClosedTrades>0", strategy.closedtrades > 0, 12)

Daily Dynamic Grid StrategyHi everyone,
This strategy is built around a dynamic daily grid concept, using an upper and lower daily range that is automatically divided into multiple grid levels.
The idea is to take advantage of daily volatility by executing DCA entries on specific grid levels, based on predefined conditions.
Key points of the strategy & feature:
I recommend using 1H or 2H timeframe for this strategy
Take profit by grid
When DCA is active (>1 entry), the exit condition switches to close above the average price
A hard stop loss is applied
Includes an optional Trailing TP / SL to help maximize profit during strong moves
Like most DCA-based strategies, it tends to have a high win rate, but during strong market dumps, losses can become relatively large
Can also be used for backtest on Forex markets such as Gold, where using the trailing option is generally more effective
And still trial for the webhook, may continue to improve and update this strategy in future versions.

[Backtest Crypto] Cross MAThis script is designed for testing the moving average crossover strategy.
Script settings:
Select testing range
Indicator settings: Select moving average type (EMA, SMA, WMA, SMMA, HMA) and period
Trade management: Select risk-to-reward ratio, stop-loss defined as min/max for a certain number of candles (you can set a desired number), option to partially lock in a position by moving the stop-loss to breakeven, trailing stop, or close a position on an opposite signal.
Option to limit the stop-loss by ATR to prevent it from becoming too large during volatile movements.
===============================================================
Скрипт предназначен для тестирования стратегии пересечение скользящих средних.
Настройки скрипта:
Выбор диапазона тестирования
Настройки индикатора: выбор типа скользящей (EMA, SMA, WMA, SMMA, HMA) и периода
Сопровождение сделки: выбор соотношения риска к прибыли, стоп-лосс определяется как мин/мах за определенное количество свечей (можно устанавливать желаемое количество), возможность частичной фиксации позиции с переносом стоп-лосса в безубыток, трейлинг-стоп, или закрытие позиции по противоположному сигналу.
Возможность ограничения стоп-лосса по ATR, чтобы при волатильных движениях он не был слишком большим.

Macro-Filtered Volatility Breakout (MVB)策略簡介:
這是一套專門針對高 Beta 值資產(如 ETH, SOL 等山寨幣)設計的趨勢跟隨系統。我們解決了傳統突破策略在山寨幣市場中「假突破(False Breakout)」過多的痛點。
核心邏輯:
市場體制過濾(Regime Filtering): 加密貨幣市場具有高度的相關性。本策略引入比特幣(BTC)作為**「宏觀市場指標」**,只有當 BTC 處於確立的多頭趨勢時,才允許執行山寨幣的做多信號。這有效規避了「大盤崩盤時,小幣假突破」的系統性風險。
動態波動率通道: 我們不使用固定價格止損,而是採用肯特納通道(Keltner Channels)。這利用 ATR(平均真實波幅)動態調整進出場區間:在市場平靜時通道收窄以敏銳捕捉啟動點,在劇烈波動時通道放寬以避免被雜訊洗出場。
風控特徵:
系統性避險: 透過 BTC 趨勢濾網,在熊市或大盤回調期間自動空手,降低回撤。
獲利奔跑(Let Profits Run): 採用基於波動率的移動止損(Volatility Trailing Stop),在大趨勢中能吃到完整的魚身。
免責聲明:
以上策略分享僅供學術研究、回測實驗與邏輯參考,並不代表對未來獲利的保證。 過往的回測績效不代表未來的行情表現。本文內容不構成任何投資建議。加密貨幣交易具有高度風險,使用者應自行評估風險承受能力並自負盈虧,本人不承擔任何因使用此策略而產生的資金損失。
Strategy Overview
This is a trend-following system specifically designed for high-beta assets, such as altcoins like ETH, SOL, and similar cryptocurrencies. The strategy addresses a key weakness of traditional breakout systems in altcoin markets—the high frequency of false breakouts.
Core Logic
Market Regime Filtering
The cryptocurrency market exhibits strong cross-asset correlation. This strategy uses Bitcoin (BTC) as a macro market indicator. Long signals on altcoins are only allowed when BTC is in a confirmed bullish trend, effectively avoiding the systemic risk of altcoin false breakouts during broader market downturns.
Dynamic Volatility Channels
Instead of fixed-price stop losses, the strategy employs Keltner Channels, which adapt dynamically using ATR (Average True Range).
During low-volatility conditions, the channel narrows to sensitively capture early trend initiation.
During high-volatility environments, the channel widens to prevent premature exits caused by market noise.
Risk Management Features
Systematic Risk Avoidance
By applying BTC trend filtering, the strategy automatically stays in cash during bear markets or major market pullbacks, significantly reducing drawdowns.
Let Profits Run
A volatility-based trailing stop is used to maximize profit capture during strong directional trends, allowing positions to benefit from the full trend structure.
Disclaimer
The strategy presented above is for academic research, backtesting experiments, and logical reference only. It does not constitute a guarantee of future performance. Past backtest results are not indicative of future outcomes. This content does not represent any investment advice. Cryptocurrency trading involves substantial risk, and users should assess their own risk tolerance and assume full responsibility for any gains or losses. The author bears no liability for any financial losses incurred from the use of this strategy.

Buy-Dip / Sell-Pullback Buy the Dip / Sell the Pullback – Trend-Following Strategy (EOD → Next Day Execution)
Overview
This is a trend-following futures strategy designed to participate in pullbacks within established trends, not to predict reversals.
It works on End-of-Day (EOD) confirmation and executes trades on the next trading session, making it suitable for positional and swing traders.
The strategy combines momentum, trend direction, volatility, and price location to filter for high-quality setups while avoiding overtrading.
🔍 Core Philosophy
Trade only in the direction of the prevailing trend
Buy dips in uptrends
Sell pullbacks in downtrends
Avoid chasing price after extended gaps
Use volatility-adjusted risk management (ATR-based SL & targets)
📊 Indicators Used
RSI (20)
Measures underlying momentum strength
Stochastic Oscillator (55, 34, 21)
Confirms pullback exhaustion within a trend
Supertrend (10, 2)
Defines primary trend direction
Bollinger Bands (20, 2)
Provides structural trend bias
ATR (5)
Used for:
Entry gap filter
Stop-loss
Profit target
Supertrend buffer
✅ Long (Buy) Setup – Evaluated at EOD
A long setup is generated when all of the following conditions are satisfied at the close of the trading day:
RSI(20) is above the bullish threshold (default: 48)
Stochastic %K is above %D (confirming pullback momentum)
Supertrend direction is bullish
Price is near or above Supertrend, allowing a volatility-adjusted buffer (ATR-based)
Price is above the Bollinger Band middle line
This combination ensures:
The market is trending up
Momentum supports continuation
The pullback is controlled, not a breakdown
❌ Short (Sell) Setup – Evaluated at EOD
A short setup is generated when:
RSI(20) is below the bearish threshold (default: 52)
Stochastic %K is below %D
Supertrend direction is bearish
Price is near or below Supertrend, with an ATR buffer
Price is below the Bollinger Band middle line
This filters for pullbacks within sustained downtrends.
⏰ Trade Execution Logic (Next Day Rule)
Once a setup is confirmed at EOD, a trade is attempted on the next trading session
To avoid chasing gaps:
Long trades are allowed only if price does not move more than a defined multiple of the previous day’s True Range
Short trades follow the same logic in reverse
This is implemented via limit orders, ensuring realistic backtesting and execution behavior
🛑 Risk Management
All exits are volatility-adjusted using ATR:
Stop-Loss:
1.1 × ATR(5) from entry price
Target:
2.2 × ATR(5) from entry price
This results in a risk–reward ratio of approximately 1:2
ATR is frozen at entry to avoid forward-looking bias.
🧠 Why This Strategy Works
Avoids low-quality trades during consolidation
Participates only when trend + momentum align
Prevents emotional gap-chasing
Adapts automatically to changing volatility
Suitable for index futures and liquid stocks
📌 Recommended Usage
Timeframe: Daily
Instruments:
Index Futures (e.g. NIFTY, BANKNIFTY)
Highly liquid stocks
Market Type: Trending markets
Not ideal for: Sideways or low-volatility environments
⚙️ Customization Tips
You can control trade frequency and aggressiveness by adjusting:
RSI thresholds
Supertrend buffer (ATR multiple)
Gap filter multiplier
Stochastic edge parameter
Looser settings → more trades
Stricter settings → higher selectivity
⚠️ Disclaimer
This strategy is for educational and research purposes only.
Backtest results do not guarantee future performance.
Always validate with paper trading before deploying real capital.

Combined Signal + Auto Day Plan + Volume📘 TradingView Description — Combined Signal + Auto Day Plan + Volume
Strategy Overview
This strategy combines trend-following signals, daily context levels, and volume confirmation to generate high-probability intraday trading setups.
It is designed to filter noise, identify trend direction early, and avoid trades during low-quality market conditions.
🔷 1. Combined Signal Logic
The strategy merges multiple indicators to produce a single, cleaner signal:
Long Signal
Trend bias is bullish
Momentum histogram (MACD/Custom) shows upward pressure
Price crosses above the midline (WMA/EMA/etc.)
Volume supports the move
Short Signal
Trend bias is bearish
Momentum histogram shows downward pressure
Price crosses below the midline
Volume supports the move
This reduces false breakouts and ensures signals appear only during strong directional moves.
🔶 2. Auto Day Plan Levels (D-1 → D)
The script automatically reads previous day levels and displays them on today’s session:
Previous Day High (PDH)
Previous Day Low (PDL)
Previous Day Close (PDC)
Previous Day Mid / Range Zones
Optional FIB levels or custom zones
These levels act as intraday support/resistance, helping identify breakout, reversal, and retest opportunities.
Behavior:
D-1 levels are plotted from today’s open until today’s close.
Levels do not overlap into the wrong day.
Optional: extend lines to next day (D+1) for planning.
🔷 3. Volume Confirmation
To improve entry accuracy, the script checks for strength in volume:
Volume > X-period average
Volume spike detection
Relative Volume (RVOL) filter
Optional low-volume avoidance
A trade is taken only when the market shows real participation, reducing traps and sideways chop trades.
🔶 4. Entry & Exit Logic
Entry
Long Entry: Combined bull signal + volume confirmation
Short Entry: Combined bear signal + volume confirmation
Exit
Long Exit → Histogram turns down (hist < hist )
Short Exit → Histogram turns up (hist > hist )
Optional:
Auto SL at PDL/PDH
Trailing based on midline
Take profit using FIB or volatility levels
💠 5. Visuals
The chart plots:
Buy/Sell markers
D-1 support/resistance lines
Trend direction midline
Volume confirmation label
Combined signal status
Colors and styles can be customized from the input panel.
🎯 6. Purpose of the Strategy
This is a complete intraday automation tool combining:
✔ Trend
✔ Momentum
✔ Volume strength
✔ Key day levels
The goal is to provide structured, mechanical, rule-based trading — reducing emotional decisions and improving consistency.

StrategyScript77 Is a rule-based strategy built on top of an Ichimoku based engine.
Ichimoku concepts are used as the backbone for trend and momentum filtering, so the strategy tends to stay on the side of the dominant move instead of fighting it.
The name “Super77” comes from the behavior I consistently observed in testing because the win rate tends to hover around the 70–80% range, often clustering around ~77% when used as intended.
It’s not a promise or guarantee, but it reflects the core design philosophy: frequent, relatively small but steady wins, with controlled and manageable losses.
Trading Style – Built for Conservative Traders
Super77 is intentionally designed for traders who prefer a conservative and calm approach:
Entries only at bar close
The strategy waits for bar close confirmation before entering a position. No intrabar guessing, no chasing half-formed signals. If the signal is still valid at close, only then will it enter.
Exits automated on bar close
Exits are also managed on bar close, which makes the logic transparent, easy to review on the chart, and more robust in backtesting compared to tick-based or intrabar hacks.
Semi-auto friendly
If you like to keep some discretion, you can treat it as semi-automatic:
Let the strategy generate entry signals
Manually cancel or skip certain trades if market context changes (news, extreme volatility, etc.)
This combination makes Super77 suitable for traders who don’t want to stare at the screen all day but still want structure and automation.
How to Use
Works best with bar-close execution (avoid trying to simulate intrabar fills if you want consistent behavior).
Designed for conservative, trend-aligned trading, not for hyper-scalping or news gambling.
Can be used as:
Fully automated (let all entries/exits trigger on bar close), or
Semi-automated (use alerts/signals but manually cancel some entries).
Step-by-Step: Automation with Cornix (Webhook Setup)
You can automate Super77 using Cornix by connecting TradingView alerts to your Cornix group via webhook.
Note: Exact button names may differ slightly depending on Cornix / TradingView updates, but the flow is always the same:
Cornix group → get webhook URL & mapping → TradingView alerts → signals sent to Cornix.
(Optional) Map specific pairs / directions
If you use UUID / signal mapping per symbol and per side (long/short), set them up in Cornix according to your own template.
Super77 can be used either:
On a single pair (simple setup), or
On multiple pairs if your alert / webhook structure supports that. So you can pick many pairs with 1 script.
Final Notes & Disclaimer
Super77 is an educational and experimental trading tool, not financial advice.
Past performance in back tests does not guarantee future results.
Always:
Test on demo or paper first
Adjust risk to match your own profile
Accept that losses and drawdowns are a natural part of any strategy
If you’re looking for a strategy that reflects a conservative, confirmation-based trading style with a focus on steady win rate and smoother equity behavior, Super77 was built exactly with that mindset in mind.

BTC DCA Risk Metric StrategyBTC DCA Risk Strategy - Automated Dollar Cost Averaging with 3Commas Integration
Overview
This strategy combines the proven Oakley Wood Risk Metric with an intelligent tiered Dollar Cost Averaging (DCA) system, designed to help traders systematically accumulate Bitcoin during periods of low risk and take profits during high-risk conditions.
Key Features
📊 Multi-Component Risk Assessment
4-Year SMA Deviation: Measures Bitcoin's distance from its long-term mean
20-Week MA Analysis: Tracks medium-term momentum shifts
50-Day/50-Week MA Ratio: Captures short-to-medium term trend strength
All metrics are normalized by time to account for Bitcoin's maturing market dynamics
💰 3-Tier DCA Buy System
Level 1 (Low Risk): Conservative entry with base allocation
Level 2 (Lower Risk): Increased allocation as opportunity improves
Level 3 (Extreme Low Risk): Maximum allocation during rare buying opportunities
Buys execute every bar while risk remains below thresholds, enabling true DCA accumulation
📈 Progressive Profit Taking
Sell Level 1: Take initial profits as risk increases
Sell Level 2: Scale out further positions during elevated risk
Sell Level 3: Final exit during extreme market conditions
Sell levels automatically reset when new buy signals occur, allowing flexible re-entry
🤖 3Commas Integration
Fully automated webhook alerts for Custom Signal Bots
JSON payloads formatted per 3Commas API specifications
Supports multiple exchanges (Binance, Coinbase, Kraken, Gemini, Bybit)
Configurable quote currency (USD, USDT, BUSD)
How It Works
The strategy calculates a composite risk metric (0-1 scale):
0.0-0.2: Extreme buying opportunity (green zone)
0.2-0.5: Favorable accumulation range (yellow zone)
0.5-0.8: Neutral to cautious territory (orange zone)
0.8-1.0+: High risk, profit-taking zone (red zone)
Buy Logic: As risk decreases, position sizes increase automatically. If risk drops from L1 to L3 threshold, the strategy combines all three tier allocations for maximum exposure.
Sell Logic: Sequential profit-taking ensures you capture gains progressively. The system won't advance to Sell L2 until L1 completes, preventing premature full exits.
Configuration
Risk Metric Parameters:
All calculations use Bitcoin price data (any BTC chart works)
Time-normalized formulas adapt to market maturity
No manual parameter tuning required
Buy Settings:
Set risk thresholds for each tier (default: 0.20, 0.10, 0.00)
Define dollar amounts per tier (default: $10, $15, $20)
Fully customizable to your risk tolerance and capital
Sell Settings:
Configure risk thresholds for profit-taking (default: 1.00, 1.50, 2.00)
Set percentage of position to sell at each level (default: 25%, 35%, 40%)
3Commas Setup:
Create a Custom Signal Bot in 3Commas
Copy Bot UUID and Secret Token into strategy inputs
Enable 3Commas Alerts checkbox
Create TradingView alert: Condition → "alert() function calls only", Webhook → api.3commas.io
Backtesting Results
Strengths:
Systematically buys dips without emotion
Averages down during extended bear markets
Captures explosive bull run profits through tiered exits
Pyramiding (1000 max orders) allows true DCA behavior
Considerations:
Requires sufficient capital for multiple buys during prolonged downtrends
Backtest on Daily timeframe for most reliable signals
Past performance does not guarantee future results
Visual Design
The indicator pane displays:
Color-coded risk metric line: Changes from white→red→orange→yellow→green as risk decreases
Background zones: Green (buy), yellow (hold), red (sell) areas
Dashed threshold lines: Clear visual markers for each buy/sell level
Entry/Exit labels: Green buy labels and orange/red sell labels mark all trades
Credits
Original Risk Metric: Oakley Wood
Strategy Development & 3Commas Integration: Claude AI (Anthropic)
Modifications: pommesUNDwurst
Disclaimer
This strategy is for educational and informational purposes only. Cryptocurrency trading carries substantial risk of loss. Always conduct your own research and never invest more than you can afford to lose. The authors are not financial advisors and assume no responsibility for trading decisions made using this tool.

Gyspy Bot Trade Engine - V1.2B - Strategy 12-7-25 - SignalLynxGypsy Bot Trade Engine (MK6 V1.2B) - Ultimate Strategy & Backtest
Brought to you by Signal Lynx | Automation for the Night-Shift Nation 🌙
1. Executive Summary & Architecture
Gypsy Bot (MK6 V1.2B) is not merely a strategy; it is a massive, modular Trade Engine built specifically for the TradingView Pine Script environment. While most strategies rely on a single dominant indicator (like an RSI cross or a MACD flip) to generate signals, Gypsy Bot functions as a sophisticated Consensus Algorithm.
The engine calculates data from up to 12 distinct Technical Analysis Modules simultaneously on every bar closing. It aggregates these signals into a "Vote Count" and only executes a trade entry when a user-defined threshold of concurring signals is met. This "Voting System" acts as a noise filter, requiring multiple independent mathematical models—ranging from volume flow and momentum to cyclical harmonics and trend strength—to agree on market direction before capital is committed.
Beyond entries, Gypsy Bot features a proprietary Risk Management suite called the Dump Protection Team (DPT). This logic layer operates independently of the entry modules, specifically scanning for "Moon" (Parabolic) or "Nuke" (Crash) volatility events to force-exit positions, overriding standard stops to preserve capital during Black Swan events.
2. ⚠️ The Philosophy of "Curve Fitting" (Must Read)
One must be careful when applying Gypsy Bot to new pairs or charts.
To be fully transparent: Gypsy Bot is, by definition, a very advanced curve-fitting engine. Because it grants the user granular control over 12 modules, dozens of thresholds, and specific voting requirements, it is extremely easy to "over-fit" the data. You can easily toggle switches until the backtest shows a 100% win rate, only to have the strategy fail immediately in live markets because it was tuned to historical noise rather than market structure.
To use this engine successfully, you must adopt a specific optimization mindset:
Ignore Raw Net Profit: Do not tune for the highest dollar amount. A strategy that makes $1M in the backtest but has a 40% drawdown is useless.
Prioritize Stability: Look for a high Profit Factor (1.5+), a high Percent Profitable, and a smooth equity curve.
Regular Maintenance is Mandatory: Markets shift regimes (e.g., from Bull Trend to Crab Range). Parameters that worked perfectly in 2021 may fail in 2024. Gypsy Bot settings should be reviewed and adjusted at regular intervals (e.g., quarterly) to ensure the voting logic remains aligned with current market volatility.
Timeframe Recommendations:
Gypsy Bot is optimized for High Time Frame (HTF) trend following. It generally produces the most reliable results on charts ranging from 1-Hour to 12-Hours, with the 4-Hour timeframe historically serving as the "sweet spot" for most major cryptocurrency assets.
3. The Voting Mechanism: How Entries Are Generated
The heart of the Gypsy Bot engine is the ActivateOrders input (found in the "Order Signal Modifier" settings).
The engine constantly monitors the output of all enabled Modules.
Long Votes: GoLongCount
Short Votes: GoShortCount
If you have 10 Modules enabled, and you set ActivateOrders to 7:
The engine will ONLY trigger a Buy Entry if 7 or more modules return a valid "Buy" signal on the same closed candle.
If only 6 modules agree, the trade is rejected.
This allows you to mix "Leading" indicators (Oscillators) with "Lagging" indicators (Moving Averages) to create a high-probability entry signal that requires momentum, volume, and trend to all be in alignment.
4. Technical Deep Dive: The 12 Modules
Gypsy Bot allows you to toggle the following modules On/Off individually to suit the asset you are trading.
Module 1: Modified Slope Angle (MSA)
Logic: Calculates the geometric angle of a moving average relative to the timeline.
Function: It filters out "lazy" trends. A trend is only considered valid if the slope exceeds a specific steepness threshold. This helps avoid entering trades during weak drifts that often precede a reversal.
Module 2: Correlation Trend Indicator (CTI)
Logic: Based on John Ehlers' work, this measures how closely the current price action correlates to a straight line (a perfect trend).
Function: It outputs a confidence score (-1 to 1). Gypsy Bot uses this to ensure that we are not just moving up, but moving up with high statistical correlation, reducing fake-outs.
Module 3: Ehlers Roofing Filter
Logic: A sophisticated spectral filter that combines a High-Pass filter (to remove long-term drift) with a Super Smoother (to remove high-frequency noise).
Function: It attempts to isolate the "Roof" of the price action. It is excellent at catching cyclical turning points before standard moving averages react.
Module 4: Forecast Oscillator
Logic: Uses Linear Regression forecasting to predict where price "should" be relative to where it is.
Function: When the Forecast Oscillator crosses its zero line, it indicates that the regression trend has flipped. We offer both "Aggressive" and "Conservative" calculation modes for this module.
Module 5: Chandelier ATR Stop
Logic: A volatility-based trend follower that hangs a "leash" (ATR multiple) from the highest high (for longs) or lowest low (for shorts).
Function: Used here as an entry filter. If price is above the Chandelier line, the trend is Bullish. It also includes a "Bull/Bear Qualifier" check to ensure structural support.
Module 6: Crypto Market Breadth (CMB)
Logic: This is a macro-filter. It pulls data from multiple major tickers (BTC, ETH, and Perpetual Contracts) across different exchanges.
Function: It calculates a "Market Health" percentage. If Bitcoin is rising but the rest of the market is dumping, this module can veto a trade, ensuring you don't buy into a "fake" rally driven by a single asset.
Module 7: Directional Index Convergence (DIC)
Logic: Analyzes the convergence/divergence between Fast and Slow Directional Movement indices.
Function: Identifies when trend strength is expanding. A buy signal is generated only when the positive directional movement overpowers the negative movement with expanding momentum.
Module 8: Market Thrust Indicator (MTI)
Logic: A volume-weighted breadth indicator. It uses Advance/Decline data and Up/Down Volume data.
Function: This is one of the most powerful modules. It confirms that price movement is supported by actual volume flow. We recommend using the "SSMA" (Super Smoother) MA Type for the cleanest signals on the 4H chart.
Module 9: Simple Ichimoku Cloud
Logic: Traditional Japanese trend analysis using the Tenkan-sen and Kijun-sen.
Function: Checks for a "Kumo Breakout." Price must be fully above the Cloud (for longs) or below it (for shorts). This is a classic "trend confirmation" module.
Module 10: Simple Harmonic Oscillator
Logic: Analyzes the harmonic wave properties of price action to detect cyclical tops and bottoms.
Function: Serves as a counter-trend or early-reversal detector. It tries to identify when a cycle has bottomed out (for buys) or topped out (for sells) before the main trend indicators catch up.
Module 11: HSRS Compression / Super AO
Logic: Two options in one.
HSRS: Hirashima Sugita Resistance Support. Detects volatility compression (squeezes) relative to dynamic support/resistance bands.
Super AO: A combination of the Awesome Oscillator and SuperTrend logic.
Function: Great for catching explosive moves that result from periods of low volatility (consolidation).
Module 12: Fisher Transform (MTF)
Logic: Converts price data into a Gaussian normal distribution.
Function: Identifies extreme price deviations. This module uses Multi-Timeframe (MTF) logic to look at higher-timeframe trends (e.g., looking at the Daily Fisher while trading the 4H chart) to ensure you aren't trading against the major trend.
5. Global Inhibitors (The Veto Power)
Even if 12 out of 12 modules vote "Buy," Gypsy Bot performs a final safety check using Global Inhibitors. If any of these are triggered, the trade is blocked.
Bitcoin Halving Logic:
Hardcoded dates for past and projected future Bitcoin halvings (up to 2040).
Trading is inhibited or restricted during the chaotic weeks immediately surrounding a Halving event to avoid volatility crushes.
Miner Capitulation:
Uses Hash Rate Ribbons (Moving averages of Hash Rate).
If miners are capitulating (Shutting down rigs due to unprofitability), the engine flags a "Bearish" regime and can flip logic to Short-only or flat.
ADX Filter (Flat Market Protocol):
If the Average Directional Index (ADX) is below a specific threshold (e.g., 20), the market is deemed "Flat/Choppy." The bot will refuse to open trend-following trades in a flat market.
CryptoCap Trend:
Checks the total Crypto Market Cap chart. If the broad market is in a downtrend, it can inhibit Long entries on individual altcoins.
6. Risk Management & The Dump Protection Team (DPT)
Gypsy Bot separates "Entry Logic" from "Risk Management Logic."
Dump Protection Team (DPT)
This is a specialized logic branch designed to save the account during Black Swan events.
Nuke Protection: If the DPT detects a volatility signature consistent with a flash crash, it overrides all other logic and forces an immediate exit.
Moon Protection: If a parabolic pump is detected that violates statistical probability (Bollinger deviations), DPT can force a profit take before the inevitable correction.
Advanced Adaptive Trailing Stop (AATS)
Unlike a static trailing stop (e.g., "trail by 5%"), AATS is dynamic.
Penthouse Level: If price is at the top of the HSRS channel (High Volatility), the stop loosens to allow for wicks.
Dungeon Level: If price is compressed at the bottom, the stop tightens to protect capital.
Staged Take Profits
TP1: Scalp a portion (e.g., 10%) to cover fees and secure a win.
TP2: Take the bulk of profit.
TP3: Leave a "Runner" position with a loose trailing stop to catch "Moon" moves.
7. Recommended Setup Guide
When applying Gypsy Bot to a new chart, follow this sequence:
Set Timeframe: 4 Hours (4H).
Reset: Turn OFF Trailing Stop, Stop Loss, and Take Profits. (We want to see raw entry performance first).
Tune DPT: Adjust "Dump/Moon Protection" inputs first. These have the highest impact on net performance.
Tune Module 8 (MTI): This module is a heavy filter. Experiment with the MA Type (SSMA is recommended).
Select Modules: Enable/Disable modules 1-12 based on the asset's personality (Trending vs. Ranging).
Voting Threshold: Adjust ActivateOrders. A lower number = More Trades (Aggressive). A higher number = Fewer, higher conviction trades (Conservative).
Final Polish: Re-enable Stop Losses, Trailing Stops, and Staged Take Profits to smooth the equity curve and define your max risk per trade.
8. Technical Specs
Engine Version: Pine Script V6
Repainting: This strategy uses Closed Candle data for all Risk Management and Entry decisions. This ensures that Backtest results align closely with real-time behavior (no repainting of historical signals).
Alerts: This script generates Strategy alerts. If you require visual-only alerts, see the source code header for instructions on switching to "Study" (Indicator) mode.
Disclaimer:
This script is a complex algorithmic tool for market analysis. Past performance is not indicative of future results. Use this tool to assist your own decision-making, not to replace it.
9. About Signal Lynx
Automation for the Night-Shift Nation 🌙
Signal Lynx focuses on helping traders and developers bridge the gap between indicator logic and real-world automation. The same RM engine you see here powers multiple internal systems and templates, including other public scripts like the Super-AO Strategy with Advanced Risk Management.
We provide this code open source under the Mozilla Public License 2.0 (MPL-2.0) to:
Demonstrate how Adaptive Logic and structured Risk Management can outperform static, one-layer indicators
Give Pine Script users a battle-tested RM backbone they can reuse, remix, and extend
If you are looking to automate your TradingView strategies, route signals to exchanges, or simply want safer, smarter strategy structures, please keep Signal Lynx in your search.
License: Mozilla Public License 2.0 (Open Source).
If you make beneficial modifications, please consider releasing them back to the community so everyone can benefit.

VWolf – Pivot VumanSkewOVERVIEW
This strategy blends a lightweight trend scaffold (EMA/DEMA) with a skew-of-volatility filter and VuManchu/WaveTrend momentum signals. It’s designed to participate only when trending structure, momentum alignment, and volatility asymmetry converge, while delegating execution management to either a standard SuperTrend or a Pivot-based SuperTrend. Position sizing is risk‑based, with optional two‑step profit taking and automatic stop movement once price confirms in favor.
RECOMMENDED USE
Markets: Designed for Forex and equities, and readily adaptable to indices or liquid futures.
Timeframes: Performs best from 15m to 4h where momentum and trend layers both matter; daily can be used for confirmation/context.
Conditions: Trending or range‑expansion phases with clear volatility asymmetry. Avoid extremely compressed sessions unless thresholds are relaxed.
Strengths
Multi‑layer confluence (trend + skew + momentum) reduces random signals.
Dual SuperTrend modes provide flexible trailing and regime control.
Built‑in hygiene (ADX/DMI, lockout after loss, ATR gap) curbs over‑trading.
Risk‑% sizing and two‑step exits support consistent, plan‑driven execution.
Precautions
Over‑tight thresholds can lead to missed opportunities; start from defaults and tune gradually.
High sensitivity in momentum settings may overfit to a single instrument/timeframe.
In very low volatility, ATR‑gap or skew filters may block entries—consider adaptive thresholds.
CONCLUSION
VWolf – Pivot VumanSkew is a disciplined trend‑participation strategy that waits for directional structure, volatility asymmetry, and synchronized momentum before acting. Its execution layer—selectable between Normal and Pivot SuperTrend—keeps management pragmatic: scale out early when appropriate, trail intelligently, and defend capital with volatility‑aware stops. For users building a diversified playbook, Pivot VumanSkew serves as a trend‑continuation workhorse that can be tightened for precision or relaxed for higher participation depending on the market’s rhythm.

5-Min Range Breakout (09:30 NY on MNQ)This is a 5 - min orb strat that a youtuber mentioned and i had a manual look for a while and thought it was actually pretty good but my results are bad. Feel free to look yourself with this code.
Basically this strat is using the 5min orb then go down to 1min timeframe and wait for a breakout with FVG confirmation. So candle after breaking candle is our entry only if FVG is formed.
However i do notice if you dump this code onto 5min timefraem and above you start consistently making money but it is a very small amount for me so you all can have it. Good starter strat on 5min or 10min timeframe

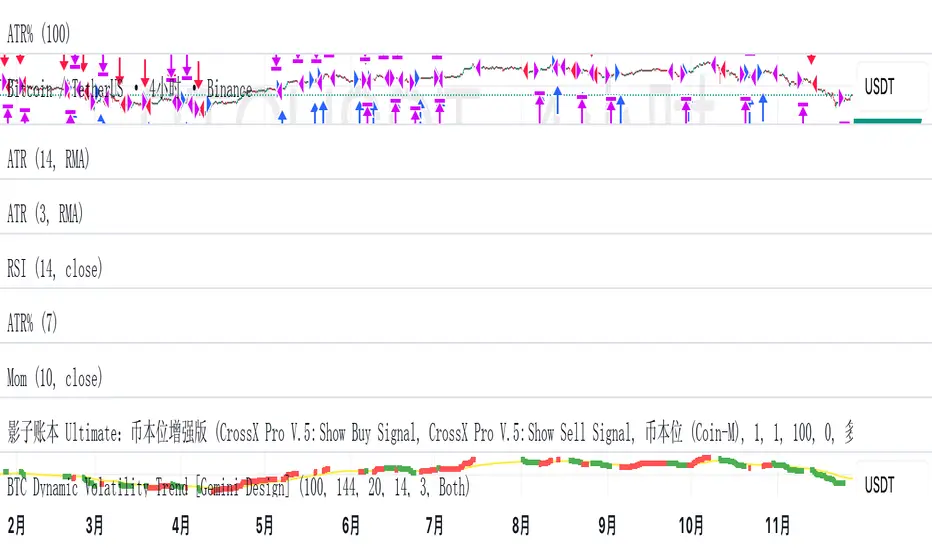
BTC Dynamic Volatility Trend Backtested from 2017 to present, this strategy has delivered a staggering 7100%+ cumulative return. It doesn't just track the market; it dominates it. By capturing major trends and strictly limiting drawdowns, it has significantly outperformed the standard 'Buy & Hold' BTC strategy, proving its ability to generate massive alpha across multiple bull and bear cycles.
自 2017 年至今,本策略实现了惊人的 7100%+ 累计收益率。它不仅仅是跟随市场,更是超越了市场。通过精准捕捉主升浪并严格控制回撤,该策略在穿越多轮牛熊周期后,大幅度跑赢了比特币‘买入持有’(Buy & Hold)的基准收益,展现了极致的阿尔法(Alpha)捕捉能力。"
Introduction :Simplicity is the ultimate sophistication. This strategy is designed specifically for Bitcoin (BTC), capturing its unique characteristics: high volatility, frequent fakeouts, and massive trend persistence. It abandons complex indicators in favor of a robust logic: "Follow the Trend, Filter the Noise, Let Profits Run."
Core Logic
Trend Filter (Fibonacci EMA 144): We use the 144-period Exponential Moving Average as the baseline. Longs are only taken above this line, and shorts only below. This keeps you on the right side of the major trend.
Volatility Breakout (Donchian Channel 20): Entries are triggered only when price breaks the 20-day high (for longs) or low (for shorts). This confirms momentum and avoids trading in chop.
Dynamic Risk Management (ATR Chandelier Exit):
Instead of fixed % stops, we use Average True Range (ATR) to calculate stop losses.
The Ratchet Mechanism: The stop loss moves up with the price but never moves down (for longs). This locks in profits automatically as the trend develops and exits immediately when volatility turns against you.
Why Use This Strategy?
Zero Repainting: All signals are confirmed.
No Curve Fitting: Uses classic parameters (144, 20) that have worked for decades.
Mental Peace: The strategy handles the exit. You don't need to guess where to sell. It holds through minor corrections and exits only when the trend truly reverses.
Settings
Leverage %: Adjust your position size based on equity (default 100% = 1x).
Timeframe: Recommended for 4H charts.
中文版 (Chinese Version)
简介 :大道至简。本策略专为 比特币 (BTC) 设计,针对其高波动、假突破多但趋势爆发力强的特点,摒弃了复杂的过度拟合指标,回归交易本质:“顺大势,滤噪音,截断亏损,让利润奔跑”。
核心逻辑
趋势过滤器 (斐波那契 EMA 144): 使用 144 周期指数移动平均线作为多空分水岭。价格在均线之上只做多,之下只做空。这能有效过滤掉大部分震荡市的噪音。
波动率突破 (唐奇安通道 20): 只有当价格突破过去 20 根 K 线的最高价(做多)或最低价(做空)时才进场。这确保了我们只在趋势确立的瞬间入场。
动态风控 (ATR 吊灯止损):
拒绝固定点数止损,使用 ATR(平均真实波幅)根据市场热度动态计算安全距离。
棘轮机制: 止损线会跟随价格上涨而上移,但绝不会下移(做多时)。这实现了自动化的“利润锁定”,既能扛住正常的波动回调,又能在大势反转时果断离场。
策略优势
绝不重绘: 所有信号均为收盘确认或实时触价。
拒绝拟合: 使用经过数十年市场验证的经典参数组合。
心态管理: 策略全自动管理出场。你不需要纠结何时止盈,它会帮你吃到完整的鱼身,直到趋势结束。
使用建议
资金管理: 可通过参数调整仓位占比(默认 100% = 1倍杠杆)。
推荐周期: 建议在4小时 图表上运行效果最佳。
US Market Long Horizon Momentum Summary in one paragraph
US Market Long Horizon Momentum is a trend following strategy for US index ETFs and futures built around a single eighteen month time series momentum measure. It helps you stay long during persistent bull regimes and step aside or flip short when long term momentum turns negative.
Scope and intent
• Markets. Large cap US equity indices, liquid US index ETFs, index futures
• Timeframes. 4h/ Daily charts
• Default demo used in the publication. SPY on 4h timeframe chart
• Purpose. Provide a minimal long bias index timing model that can reduce deep drawdowns and capture major cycles without parameter mining
• Limits. This is a strategy. Orders are simulated on standard candles only
Originality and usefulness
• Unique concept or fusion. One unscaled multiple month log return of an external benchmark symbol drives all entries and exits, with optional volatility targeting as a single risk control switch.
• Failure mode addressed. Fully passive buy and hold ignores the sign of long horizon momentum and can sit through multi year drawdowns. This script offers a way to step down risk in prolonged negative momentum without chasing short term noise.
• Testability. All parameters are visible in Inputs and the momentum series is plotted so users can verify every regime change in the Tester and on price history.
• Portable yardstick. The log return over a fixed window is a unit that can be applied to any liquid symbol with daily data.
Method overview in plain language
The method looks at how far the benchmark symbol has moved in log return terms over an eighteen month window in our example. If that long horizon return is positive the strategy allows a long stance on the traded symbol. If it is negative and shorts are enabled the strategy can flip short, otherwise it goes flat. There is an optional realised volatility estimate on the traded symbol that can scale position size toward a target annual volatility, but in the default configuration the model uses unit leverage and only the sign of momentum matters.
Base measures
Return basis. The core yardstick is the natural log of close divided by the close eighteen months ago on the benchmark symbol. Daily log returns of the traded symbol feed the realised volatility estimate when volatility targeting is enabled.
Components
• Component one Momentum eighteen months. Log of benchmark close divided by its close mom_lookback bars ago. Its sign defines the trend regime. No extra smoothing is applied beyond the long window itself.
• Component two Realised volatility optional. Standard deviation of daily log returns on the traded symbol over sixty three days. Annualised by the square root of 252. Used only when volatility targeting is enabled.
• Optional component Volatility targeting. Converts target annual volatility and realised volatility into a leverage factor clipped by a maximum leverage setting.
Fusion rule
The model uses a simple gate. First compute the sign of eighteen month log momentum on the benchmark symbol. Optionally compute leverage from volatility. The sign decides whether the strategy wants to be long, short, or flat. Leverage only rescales position size when enabled and does not change direction.
Signal rule
• Long suggestion. When eighteen month log momentum on the benchmark symbol is greater than zero, the strategy wants to be long.
• Short suggestion. When that log momentum is less than zero and shorts are allowed, the strategy wants to be short. If shorts are disabled it stays flat instead.
• Wait state. When the log momentum is exactly zero or history is not long enough the strategy stays flat.
• In position. In practice the strategy sits IN LONG while the sign stays positive and flips to IN SHORT or flat only when the sign changes.
Inputs with guidance
Setup
• Momentum Lookback (months). Controls the horizon of the log return on the benchmark symbol. Typical range 6 to 24 months. Raising it makes the model slower and more selective. Lowering it makes it more reactive and sensitive to medium term noise.
• Symbol. External symbol used for the momentum calculation, SPY by default. Changing it lets you time other indices or run signals from a benchmark while trading a correlated instrument.
Logic
• Allow Shorts. When true the strategy will open short positions during negative momentum regimes. When false it will stay flat whenever momentum is negative. Practical setting is tied to whether you use a margin account or an ETF that supports shorting.
Internal risk parameters (not exposed as inputs in this version) are:
• Target Vol (annual). Target annual volatility for volatility targeting, default 0.2.
• Vol Lookback (days). Window for realised volatility, default 63 trading days.
• Max Leverage. Cap on leverage when volatility targeting is enabled, default 2.
Usage recipes
Swing continuation
• Signal timeframe. Use the daily chart.
• Benchmark symbol. Leave at SPY for US equity index exposure.
• Momentum lookback. Eighteen months as a default, with twelve months as an alternative preset for a faster swing bias.
Properties visible in this publication
• Initial capital. 100000
• Base currency. USD
• Default order size method. 5% of the total capital in this example
• Pyramiding. 0
• Commission. 0.03 percent
• Slippage. 3 ticks
• Process orders on close. On
• Bar magnifier. Off
• Recalculate after order is filled. Off
• Calc on every tick. Off
• All request.security calls use lookahead = barmerge.lookahead_off
Realism and responsible publication
The strategy is for education and research only. It does not claim any guaranteed edge or future performance. All results in Strategy Tester are hypothetical and depend on the data vendor, costs, and slippage assumptions. Intrabar motion is not modeled inside daily bars so extreme moves and gaps can lead to fills that differ from live trading. The logic is built for standard candles and should not be used on synthetic chart types for execution decisions.
Performance is sensitive to regime structure in the US equity market, which may change over time. The strategy does not protect against single day crash risk inside bars and does not model gap risk explicitly. Past behavior of SPY and the momentum effect does not guarantee future persistence.
Honest limitations and failure modes
• Long sideways regimes with small net change over eighteen months can lead to whipsaw around the zero line.
• Very sharp V shaped reversals after deep declines will often be missed because the model waits for momentum to turn positive again.
• The sample size in a full SPY history is small because regime changes are infrequent, so any test must be interpreted as indicative rather than statistically precise.
• The model is highly dependent on the chosen lookback. Users should test nearby values and validate that behavior is qualitatively stable.
Legal
Education and research only. Not investment advice. You are responsible for your own decisions. Always test on historical data and in simulation with realistic costs before any live use.
