Adaptive Range Breakout (UPDATED RBVC)RBVC UPDATED WITH TIGHTER RANGE TIMELY BREAKOUT. This as an updated version for range breakout with volume as the earlier indicator had delayed response time
In den Scripts nach "range" suchen
TTM Squeeze Range Lines (with Forward Extension) By Gautam KumarThis TTM Squeeze Range Lines script helps visualize breakout levels by marking the recent squeeze’s high and low, making it easier to identify potential trade setups. Each signal line is extended for visibility, showing possible entry levels after a squeeze.
Interpreting the LinesLight blue background marks periods when the TTM squeeze is active (tight volatility).
Green line is drawn at the highest price during the squeeze, extended forward—this is commonly used as the breakout level for long entries.
Red line shows the lowest price during the squeeze, indicating the bottom of the range—potential stop loss positioning or an invalidation level.
When the squeeze background disappears, the horizontal lines will have just appeared and extended forward for several bars after the squeeze ends.
If the price breaks above the green line (the squeeze high), it signals a possible momentum breakout, which traders often use as a long entry.
The red line can be used for placing stop losses or monitoring failed breakouts if price falls below this level.
Best Practices
Combine these levels with volume and momentum confirmation for strong entries.
Adjust the extension length (number of bars forward) from the settings menu to fit your preference.
For systematic trading, use these breakout signals alongside chart pattern or histogram confirmation.
This makes it easy to visualize strong entry zones based on the end of squeeze compression, supporting both discretionary and automated swing trading approaches

% Change & Range (With SMA)- Calculates the % range and change for each candle
- uses SMA over "n" bars to show the average % range and the average % change for green days and red days
- optional standard deviation line (k bands)

Trend/Range Composite (Single-Line) v1.4🔹 Step 1: Add it to your chart
Copy the whole script.
In TradingView → Pine Editor → paste it.
Click Add to chart.
It will show a white line in a subwindow, plus thresholds at 40 and 60, and a colored background.
Optional: You’ll see a status box (top-right of chart) with details like ADX, ATR, slope, etc.
🔹 Step 2: Understand the Score
The indicator compresses all signals into a 0–100 “Trend Strength Score”:
≥ 60 = TREND (teal background)
→ Market is trending, consider trend strategies like vertical spreads, runners, breakouts.
≤ 40 = RANGE (orange background)
→ Market is choppy/sideways, consider range strategies like butterflies, condors, mean-reversion fades.
40–60 = MIXED (gray background)
→ Indecision / chop. Best to reduce size or wait for clarity.
🔹 Step 3: Use with Your Trading Plan
Intraday (5m, 15m, 30m)
Score < 40 → play support/resistance bounces, fade extremes.
Score > 60 → play momentum breakouts or pullback continuations.
Daily chart
Good for swing context (is this month trending or just chopping?).
🔹 Step 4: Alerts
You can set TradingView alerts:
Cross above 60 → market entering trend mode.
Cross below 40 → market entering range mode.
Useful if you don’t want to watch constantly.
🔹 Step 5: Confirm with Price Levels
The score tells you “trend vs range”, but you still need levels:
If score < 40 → mark PDH / PDL (previous day high/low), VAH/VAL, VWAP. Expect rejections/fades.
If score > 60 → watch for breakouts beyond PDH/PDL or supply/demand zones.

Fixed-Range Volume-Profile ZonesFixed Range Volume Profile Zones (with Dynamic Percentile Buffers)
This indicator calculates a fixed‑range volume profile over a user‑defined lookback period and identifies three key zones:
– VAL (Value Area Low)
– POC (Point of Control)
– VAH (Value Area High)
Volume is grouped into user‑selected price bins to create a profile of where the most trading activity occurred.
The script then splits the distribution into three zones and highlights the extremes (VAL/VAH) and the highest‑volume price (POC).
Dynamic Percentile Buffers
Instead of static offsets, this version computes the 10th and 90th percentile prices (user‑adjustable) of recent closes over the same lookback window.
These percentiles are used to create adaptive buffers above VAH and below VAL.
The buffers automatically expand or contract with market volatility and recent price distribution, filtering out weak or noisy touches.
Visual Elements:
– Green/orange/red horizontal lines = VAL / VAH / POC
– Green shading below VAL = buy zone
– Red shading above VAH = sell zone
– Down arrows above bars = closes above VAH + buffer
– Up arrows below bars = closes below VAL – buffer
Inputs:
– Lookback Days: number of bars used to build the profile
– Number of Bins: controls resolution of the volume profile
– VAH Percentile and VAL Percentile: choose which percentile levels to use for dynamic buffers
Use Cases:
– Quickly identify areas of high participation (POC) and potential support/resistance (VAL/VAH)
– Filter out weak breakouts using dynamic buffers
– Combine with other signals to improve entries/exits
⚠️ Disclaimer:
This script is for educational and informational purposes only.
It does not constitute financial advice or a recommendation to buy or sell any security.
Past performance or historical data does not guarantee future results.
Always perform your own analysis and use risk management when trading.

Opening Candle Zone with ATR Bands by nkChartsThis indicator highlights the opening range of each trading session and projects dynamic ATR-based zones around it.
Key Features
Plots high and low levels of the opening candle for each new daily session.
Extends these levels across the session, providing clear intraday support and resistance zones.
Adds ATR-based offset bands above and below the opening range for volatility-adjusted levels.
Customizable colors, ATR length, and multiplier for flexible use across markets and timeframes.
Adjustable session history limit to control how many past levels remain on the chart.
How to Use:
The opening range high/low often acts as strong intraday support or resistance.
The ATR bands give an adaptive volatility buffer, useful for breakout or mean-reversion strategies.
Works on any market with clear session opens.
This tool is designed for traders who want to combine session-based price action with volatility insights, helping identify potential breakouts, reversals, or consolidation areas throughout the day.
⚠️ Disclaimer: This indicator is for educational purposes only. It does not provide financial advice or guarantee profits. Always perform your own analysis before making trading decisions.

VWAP + Range Breakout (Pre-Signal for Manual Entry)WHAT IT DOES
This tool highlights potential breakout opportunities when price sweeps the previous day’s high or low and aligns with VWAP and short-term range levels. It provides both pre-signals (early warnings) and confirmed signals (breakout closed) so traders can prepare before momentum accelerates.
Works on all timeframes and across markets (indices, forex, crypto). Especially useful during active London and New York sessions.
---
KEY FEATURES
Daily sweep logic: previous day high/low as liquidity reference
VWAP with cumulative calculation
Adjustable range breakout levels
Optional SMA trend filter
Session filter (London / NY trading hours)
Pre-Signal markers (early alert before breakout)
Confirmed LONG/SHORT signals after breakout close
Alerts for Pre-Long, Pre-Short, and Confirmed entries
---
HOW TO USE
1. Wait for price to sweep the previous day high/low.
2. Look for alignment with VWAP and the defined range breakout levels.
3. Use trend/session filters for higher accuracy.
4. Combine with your own risk management rules.
---
SETTINGS TIPS
Adjust range lookback for different timeframes (shorter for fast intraday, longer for higher timeframes).
Enable/disable session filters depending on your market.
Use SMA trend filter to stay aligned with higher-timeframe bias.
---
WHO IT’S FOR
Scalpers, intraday, and swing traders who want early signals when liquidity is taken and price is preparing for a breakout.
---
NOTES
For educational purposes only. No financial advice.
This script is open-source; redistribution follows TradingView rules.

EMA ± ATR Channel (True Range)EMA ± ATR Channel (True Range)
Tagline: Adaptive EMA channel with ATR-based volatility bands — perfect for swing trading, intraday setups, and managing risk on high-volatility stocks.
This script plots a dynamic price channel around a configurable EMA using the Average True Range (ATR, Wilder’s True Range) as a volatility buffer.
Upper band = EMA + (ATR × multiplier)
Lower band = EMA – (ATR × multiplier)
📊 Features:
Adjustable EMA length, ATR length, and ATR multiplier
Visual channel fill between upper and lower bands
Optional on-chart help panel with practical combos
⚡ Practical Combos for Volatile Stocks:
EMA 20 + ATR 14 × 2.0 → most common swing trading setup
EMA 10 + ATR 14 × 1.5 → very responsive, good for intraday/high-beta names
EMA 20 + ATR 20 × 2.5 → smoother, wider channel, avoids whipsaws in chaotic stocks
✅ Use cases:
Identify dynamic support/resistance zones
Volatility-based stop-loss & take-profit placement
Spot overextensions from the trend midline
🔖 Tags:
ema, atr, channel, volatility, trend, support resistance, stop loss, swing trading, intraday, risk management, indicator

Daily/Weekly Wick (Shadow) Range📈 Detailed Guide to the Daily/Weekly Wick (Shadow) Range Indicator
This indicator is a powerful visualization tool designed to map the key price levels established during the previous trading period (either the previous day or the previous week). Instead of just showing a single line for the high and low, it highlights the entire range of the upper and lower wicks (shadows), representing the "battleground" where buyers and sellers were most active.
How It Works
The Wick (Shadow) Range indicator fetches the Open, High, Low, and Close data from the last completed daily or weekly candle and projects those levels onto your current chart. This creates two distinct colored zones.
Upper Wick (Green Zone): This area spans from the Previous High down to the top of the Previous Candle's Body. It visually represents the territory where sellers successfully pushed the price down from its peak. This entire zone can be considered a resistance area.
Lower Wick (Red Zone): This area spans from the bottom of the Previous Candle's Body down to the Previous Low. It shows where buyers stepped in to defend a price level and push it back up. This entire zone can be considered a support area.
How to Use It in Your Trading
This indicator isn't meant to give direct buy or sell signals on its own. Instead, it provides crucial context about market structure. Here are several ways to incorporate it into your strategy:
1. Identifying Key Support & Resistance
This is the indicator's primary function. The most significant levels are:
Key Resistance: The top edge of the green zone (the previous period's high).
Key Support: The bottom edge of the red zone (the previous period's low).
Look for the current price to react when it approaches these boundaries. These are high-probability areas for price to pause or reverse.
2. Watching for Price Rejection (Reversal Trading)
The colored zones are perfect for spotting rejection signals.
Bearish Rejection 📉: If the current price enters the green zone but fails to stay there, closing back below it (often forming a new wick), it's a strong sign that sellers are still in control at that level. This can be an excellent entry signal for a short position.
Bullish Rejection 📈: If the current price dips into the red zone and is quickly bought back up, it shows that buyers are actively defending that area. This can be a great entry signal for a long position.
3. Confirming Breakouts (Trend Trading)
The zones also help validate breakouts.
Bullish Breakout: If the price pushes decisively through the entire green zone and closes above the previous high, it signals that the previous resistance has been broken and the trend may continue upward.
Bearish Breakdown: If the price falls decisively through the entire red zone and closes below the previous low, it confirms that support has failed and the price may continue downward.
4. Setting Context with Timeframes
Weekly Setting: Use the "Weekly" option to identify major, significant support and resistance levels that can influence the market for the entire week. These are powerful levels for swing trading.
Daily Setting: Use the "Daily" option for intraday trading. The previous day's high and low are critical pivot points that many day traders watch.
⚙️ Indicator Settings
The indicator has one simple setting, which you can access by clicking the gear icon ⚙️ next to its name on the chart.
Select Wick Timeframe: This dropdown menu allows you to switch the indicator's calculation between the Daily and Weekly timeframe instantly.

Tristan's Box: Pre-Market Range Breakout + RetestMarket Context:
This is designed for U.S. stocks, focusing on pre-market price action (4:00–9:30 AM ET) to identify key support/resistance levels before the regular session opens.
Built for 1 min and 5 min timelines, and is intended for day trading / scalping.
Core Idea:
Pre-market range (high/low) often acts as a magnet for price during regular hours.
The first breakout outside this range signals potential strong momentum in that direction.
Retest of the breakout level confirms whether the breakout is valid, avoiding false moves.
Step-by-Step Logic:
Pre-Market Range Identification:
Track high and low from 4:00–9:30 AM ET.
Draw a box spanning this range for visual reference and calculation.
Breakout Detection:
When the first candle closes above the pre-market high → long breakout.
When the first candle closes below the pre-market low → short breakout.
The first breakout candle is highlighted with a “YOLO” label for visual confirmation.
Retest Confirmation:
Identify the first candle whose wick touches the pre-market box (high touches top for short, low touches bottom for long).
Wait for the next candle: if it closes outside the box, it confirms the breakout.
Entry Execution:
Long entry: on the confirming candle after a wick-touch above the pre-market high.
Short entry: on the confirming candle after a wick-touch below the pre-market low.
Only the first valid entry per direction per day is taken.
Visuals & Alerts:
Box represents pre-market high/low.
Top/bottom box border lines show the pre-market high / low levels cleanly.
BUY/SELL markers are pinned to the confirming candle.
Added a "YOLO" marker on breakout candle.
Alert conditions trigger when a breakout is confirmed by the retest.
Strategy Type:
Momentum breakout strategy with confirmation retest.
Combines pre-market structure and risk-managed entries.
Designed to filter false breakouts by requiring confirmation on the candle after the wick-touch.
In short, it’s a pre-market breakout momentum strategy: it uses the pre-market high/low as reference, waits for a breakout, and then enters only after a confirmation retest, reducing the chance of entering on a false spike.
Always use good risk management.

Rolling Range Bands by tvigRolling Range Bands
Plots two dynamic price envelopes that track the highest and lowest prices over a Short and Long lookback. Use them to see near-term vs. broader market structure, evolving support/resistance, and volatility changes at a glance.
What it shows
• Short Bands: recent trading range (fast, more reactive).
• Long Bands: broader range (slow, structural).
• Optional step-line style and shaded zones for clarity.
• Option to use completed bar values to avoid intrabar jitter (no repaint).
How to read
• Price pressing the short high while the long band rises → short-term momentum in a larger uptrend.
• Price riding the short low inside a falling long band → weakness with trend alignment.
• Band squeeze (narrowing) → compression; watch for breakout.
• Band expansion (widening) → rising volatility; expect larger swings.
• Repeated touches/rejections of long bands → potential areas of support/resistance.
Inputs
• Short Window, Long Window (bars)
• Use Close only (vs. High/Low)
• Use completed bar values (stability)
• Step-line style and Band shading
Tips
• Works on any symbol/timeframe; tune windows to your market.
• For consistent scaling, pin the indicator to the same right price scale as the chart.
Not financial advice; combine with trend/volume/RSI or your system for entries/exits.

EMA Range OscillatorEMA Range Oscillator (ERO) - User Guide
Overview
The EMA Range Oscillator (ERO) is a technical indicator that measures the distance between two Exponential Moving Averages (EMAs) and the distance between price and EMA. It normalizes these distances into a 0-100 range, helping traders identify trend strength, market momentum, and potential reversal points.
Components
Main Line
Green Line: EMA20 > EMA50 (Uptrend)
Red Line: EMA20 < EMA50 (Downtrend)
Histogram
White Histogram: Price distance from EMA20
Key Levels
Upper Level (80): High divergence zone
Middle Level (50): Neutral zone
Lower Level (20): Low divergence zone
Parameters
ParameterDefaultDescriptionFast EMA20Short-term EMA periodSlow EMA50Long-term EMA periodNormalization Period100Lookback period for scalingUpper80Upper threshold levelLower20Lower threshold level
How to Read the Indicator
High Values (Above 80)
Strong trend in progress
EMAs are widely separated
High momentum
Potential overbought/oversold conditions
Watch for possible trend exhaustion
Low Values (Below 20)
Consolidation phase
EMAs are close together
Low volatility
Potential breakout setup
Range-bound market conditions
Middle Zone (20-80)
Normal market conditions
Moderate trend strength
Balanced momentum
Look for directional clues from color changes

Trend dealing rangeHi all!
This indicator will help you find the current dealing range according to the trend. If the trend is bullish the indicator will look for a range between the latest low pivot to the latest high pivot. Vice versa in a bearish trend. The code uses my new library 'FibonacciRetracement' () that has the same code as my other indicator 'Fibonacci retracement' ().
It plots 5 lines from the low to the high and labels them 0 %, 25 %, 50 %, 75 % and 100 %. A trendline can be drawn between the two pivots (dashed and gray by default). Firstly you can define the pivot lengths used, this setting is in the 'Market structure' section but it also applies to the dealing range (it defaults to 5 (left) and 2 (right)). You can show prices if you want to (shown in parantheses, off by default). You can change the default labels position (from left) and the font size (12 by default and higher up it's 7 for market structure text). Lastly you can change the alert frequency (defaults to once per bar close) and the price that has to enter a zone for alert to be sent. 'Close' means that the closing price (or current price if you change the alert frequency to all or once per bar) has to be inside the zone and 'Wick' means that the entire candle needs to be inside the zone.
It's very useful for traders to find the current dealing range and this indicator will help you to do so.
So, this indicator will give you the dealing range and basic market structure through break of structures and change of characters.
If you have any input or suggestions on future features or bugs, don't hesitate to let me know!
Best of trading luck!

Time Based Range CandleThis indicator creates a visual candle representation from price action during a specified time period.
Key Features:
Configurable Sessions: Set any calculation period (when range is measured) and display period (when visualization appears)
Candle Visualization: Draws a large candle showing open, close, high, low with proper body coloring
Wick/Tail Analysis: Displays wicks and tails with quarter-level subdivisions based on candle type (bullish vs bearish)
End Marker: Vertical line marks exactly when the calculation period ends
Quarter Lines: Optional dotted/dashed lines showing 25%, 50%, 75% levels within body, wicks, and tails
Common Use Cases:
Overnight range analysis (18:00 - 6:00 ET) displayed during regular hours
Session-based range trading (Asian, London, NY sessions)
Custom time period analysis for any market
The indicator follows proper candle terminology where wicks and tails are measured differently for bullish vs bearish candles, making it useful for precise level analysis and range trading strategies.

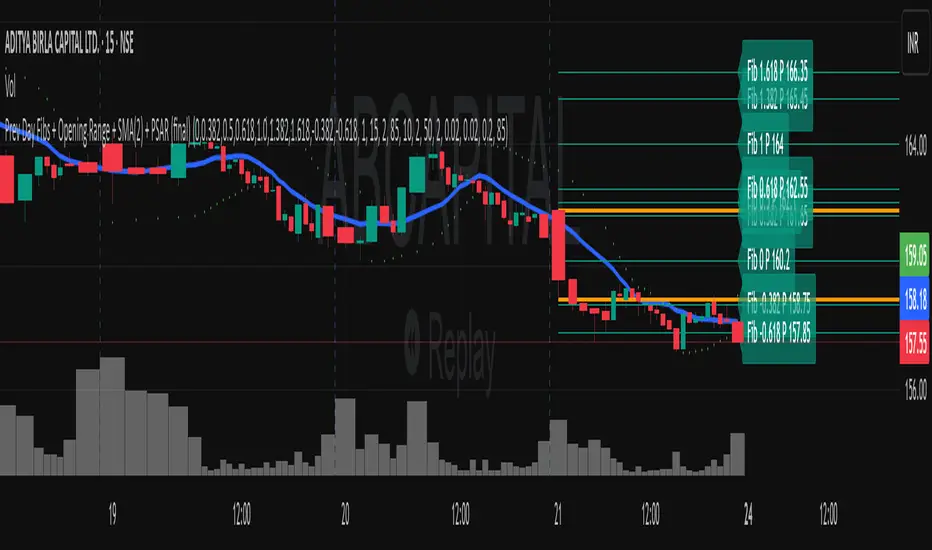
Previous Day Fibonacci + Opening RangePrev Day Fibonacci & Opening Range Levels
This indicator is designed for professional traders who want to combine yesterday’s market structure with today’s intraday levels.
🔹 Features:
Automatic Fibonacci Retracements: Draws customizable Fibonacci retracement/extension levels based on the previous day’s High & Low.
Full Customization: Users can adjust the Fibonacci ratios and colors directly in settings.
Opening Range Levels: Plots today’s first candle High & Low (user-selectable timeframe for OR).
Clear Visuals: Helps identify key reversal zones, breakout levels, and confluence areas between higher timeframe structure and intraday moves.
🔹 Usage Ideas:
Spot potential reversal zones when price reacts to previous-day Fib levels.
Combine Opening Range breakout strategies with daily Fib levels for high-probability setups.
Use as confluence levels with your existing price action or indicator-based strategy.
⚡ Pro Tip: Look for overlaps between the Opening Range and Fibonacci retracements — these zones often act as strong support/resistance areas.
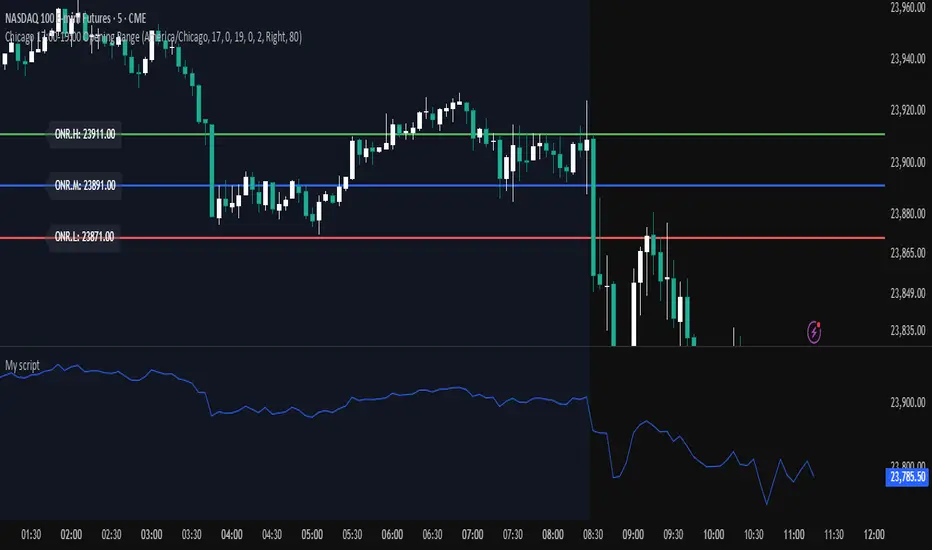
Chicago 17:00-19:00 Overnight RangeThis indicator will map out range high and range low of previous 17:00 - 19:00 of the chart. It can also display mid range if needed
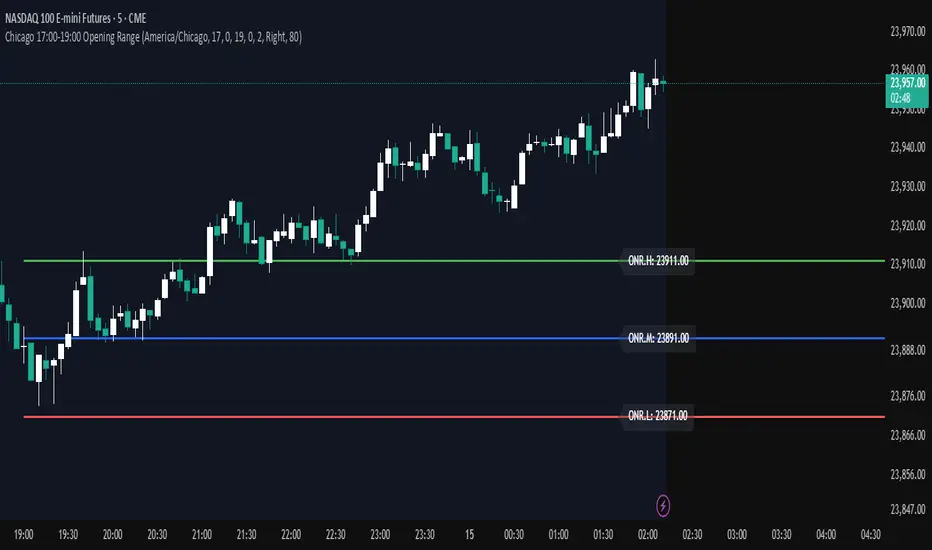
Opening Range — Chicago 17:00-19:00 (Customizable)Maps opening 2 hour range of Chicago timezone with the range high range low and medium zone. It can be customized to fit your needs
CP Strat ORBnew york opening range breakout and retest allows you to enter a trade with a better clarity if the price comes back and retest the range

Closing RangeFInd the closing range, This script used to find the closing range of a stock in bar chart

Opening Range Breakout (9:30 - 9:45 EST)Here's a Pine Script (v5) for TradingView that plots the Opening Range Breakout (ORB) lines from 9:30 AM to 9:45 AM EST on a 15-minute chart.
It draws a green line at the high of the opening range and a red line at the low, both extending through the rest of the day.

Modular Range-Trading Strategy (V9.2)# 模块化震荡行情策略 (V9.2)
# Modular Range-Trading Strategy (V9.2)
## 策略简介 | Strategy Overview
该策略基于布林带 (Bollinger Bands)、RSI、MACD、ADX 等经典指标的组合,通过多逻辑模块化结构识别震荡区间的价格反转机会,支持多空双向操作,并在相同逻辑下允许智能加仓,适用于震荡市场的回测和研究。
This strategy combines classic indicators such as Bollinger Bands, RSI, MACD, and ADX to identify price reversal opportunities within ranging markets. It features a modular multi-logic structure, allowing both long and short trades with intelligent pyramiding under the same logic. It is designed for backtesting and research in range-bound conditions.
---
## 功能特点 | Key Features
- **多逻辑结构**:支持多套震荡逻辑(动能确认均值回归、布林带极限反转等)。
- **加仓与仓位互斥**:同逻辑下可智能加仓,不同逻辑间自动互斥,避免冲突。
- **回测可调时间范围**:可自定义回测起止时间,精准评估策略表现。
- **指标可视化**:布林带、RSI、MACD 及动态 ATR 止损线实时绘图。
- **K线收盘确认信号**:通过 `barstate.isconfirmed` 控制信号,避免未收盘的虚假信号。
- **Multi-logic structure**: Supports multiple range-trading logics (e.g., momentum-based mean reversion, Bollinger Band reversals).
- **Pyramiding with mutual exclusion**: Allows intelligent pyramiding within the same logic while preventing conflicts between different logics.
- **Adjustable backtesting range**: Customizable start and end dates for accurate performance evaluation.
- **Visual indicators**: Real-time plotting of Bollinger Bands, RSI, MACD, and dynamic ATR stop lines.
- **Close-bar confirmation**: Uses `barstate.isconfirmed` to avoid false signals before bar close.
---
## 使用说明 | Usage
1. 将该脚本添加到 TradingView 图表。
2. 在参数中设置回测时间段和指标参数。
3. 仅用于学习与策略研究,请勿直接用于实盘交易。
1. Add this script to your TradingView chart.
2. Configure backtesting dates and indicator parameters as needed.
3. For educational and research purposes only. **Not for live trading.**
---
## ⚠️ 免责声明 | Disclaimer
本策略仅供学习和研究使用,不构成任何形式的投资建议。
作者不参与任何实盘交易、资金管理或收益分成,也不保证策略盈利能力。
严禁将本脚本用于任何非法集资、私募募资或与虚拟货币相关的金融违法活动。
使用本策略即表示您自行承担所有风险与法律责任。
This strategy is for educational and research purposes only and does not constitute investment advice.
The author does not participate in live trading, asset management, or profit sharing, nor guarantee profitability.
The use of this script in illegal fundraising, private placements, or cryptocurrency-related financial activities is strictly prohibited.
By using this strategy, you accept all risks and legal responsibilities.
---

Breakout Range Signal with Quality Analysis [Dova Lazarus]📌 Breakout Range Signal with Quality Analysis
🎓 Training-focused indicator for breakout logic, SL & TP behavior and signal quality assessment
🔷 PURPOSE
This tool identifies breakout candles from a calculated channel range and visually simulates entries, stop losses, and take profits, providing live and historical performance metrics.
⚙️ MAIN SETTINGS
1️⃣ Channel Setup
channel_length = 10 → how many candles are averaged to form channel boundaries
channel_multiplier = 0.0 → adds expansion above/below the base channel
channel_smoothing_type = SMA → smoothing method for high/low averaging
📊 The channel consists of two moving averages: one from highs, the other from lows. When expanded (via multiplier), it creates a buffer range for breakout validation.
2️⃣ Signal Detection
Body > Channel % = 50 → a breakout candle's body must exceed 150% of the channel width
Signal Mode:
• Weak → every valid breakout candle is highlighted
• Strong → only the first signal in a sequence is shown (helps reduce noise)
🟦 Bullish signals (blue):
• Candle opens inside the channel
• Closes above the channel
• Body is large enough
• Optional: confirms with trend (if enabled)
🟨 Bearish signals (yellow):
• Candle opens inside the channel
• Closes below the channel
• Body is large enough
• Optional: confirms with trend
3️⃣ Trend Filter (optional)
Enabled via checkbox
Uses a higher timeframe MA to filter signals
Bullish signals are allowed only if price is below the trend MA
Bearish signals only if price is above it
⏱️ trend_timeframe = 1D (typically set higher than the chart's timeframe)
🟢 Trend line is plotted if enabled
🎯 ENTRY, STOP LOSS & TAKE PROFIT LOGIC
SL and TP are based on channel width, not fixed pip/tick size:
📍 Entry Price = close of the breakout candle
🛑 Stop Loss:
• Bullish → below the lower channel border (minus offset)
• Bearish → above the upper channel border (plus offset)
🎯 Take Profit:
• Bullish → entry + channel width × profit multiplier
• Bearish → entry − channel width × profit multiplier
You can control:
Profit Target Multiplier (e.g., 1.0 → TP = 1×channel width)
Stop Loss Target Multiplier (e.g., 0.5 → SL = 0.5×channel width)
Signals to Show = how many historical SL/TP setups to display
📈 Lines and labels ("TP", "SL") are drawn on the chart for clarity.
🧪 QUALITY ANALYSIS MODULE
If enabled, the indicator will:
Track each new signal (entry, SL, TP)
Analyze outcomes:
• Win = TP hit before SL
• Loss = SL hit before TP
• Expired = signal unresolved after N bars
Display statistics in a table (top-right corner):
📋 Table fields:
✅ Overall win rate
📈 Bullish win rate
📉 Bearish win rate
🔢 Total signals
🕓 Pending (still active trades)
Maximum bars to wait for outcome is customizable (max_bars_to_analyze).
📐 VISUALIZATION TOOLS
TP / SL lines per signal
Labels “TP” and “SL”
Optional channel lines and trendline for better context
Colored bars for valid signals (blue/yellow)
📌 BEST USE CASES
Understand how breakout signals are formed
Learn SL/TP logic based on dynamic range
Test how volatility affects trade outcomes
Use as a visual simulation of trade behavior over time

Twin Range Filter – Buy/Sell SignalsThe Twin Range Filter is a trend-following indicator that combines two adaptive volatility filters to identify potential market reversals and trend continuations. It uses two configurable smoothing periods (fast and slow) to calculate a dynamic range around price, filtering out market noise and highlighting meaningful shifts in direction.
This indicator plots BUY and SELL signals based on price action in relation to the range filter, as well as internal trend conditions.
✅ How It Works:
Long Signal (BUY) is triggered when:
Price is above the filtered range (showing strength), and
Short-term upward momentum is confirmed.
Short Signal (SELL) is triggered when:
Price is below the filtered range (showing weakness), and
Short-term downward momentum is confirmed.
The signals are highlighted using green "Long" and red "Short" labels on the chart.
Background colors reinforce the current directional bias.
🔔 Alerts:
Long Signal – A new BUY condition has been detected.
Short Signal – A new SELL condition has been detected.
📌 Use Cases:
Entry timing for swing or intraday trades
Trend confirmation filter
Signal generator in automated strategies (when paired with a strategy script)