90D High % Pullback Lines (Hybrid 10 Lines)90D High % Pullback Lines (Hybrid 10 Lines) visualizes drawdown levels from the 90-day high, with up to 10 fully customizable percentage-based lines.
This tool makes it easy to identify pullbacks, dip-buy zones, trend continuation points, and discount regions in any market.
🔍 Features
✅ Up to 10 customizable pullback levels
Each line has its own % drop setting
Turn any line ON/OFF individually
Example presets: −10%, −20%, −30%, … −95%
✅ Two rendering modes
1. Hybrid Fixed Line Mode (Stable / Anti-Shift)
Prevents line drift caused by chart updates
Keeps horizontal levels synchronized on every bar
Best stability for intraday & real-time use
2. Lightweight plot (stepline) Mode
Ideal for backtesting
Fully compatible with alerts
Clean and fast rendering
✅ Supports daily-based 90-day high
Even on lower timeframes, the indicator can use the daily 90-day high
Ideal for MTF (multi-timeframe) analysis
🎯 Use Cases
Instantly see how far price has pulled back (%) from the 90-day high
Build systematic dip-buy / trend-follow setups
Identify discount zones during volatility
Monitor recovery signals after strong sell-offs
Works great for crypto, FX, indices, and stocks
🚨 Alerts Included
Alerts trigger when closing price crosses any selected pullback line
Useful for automated dip-buy alerts, breakout alerts, etc.
📌 Notes
Due to internal TradingView behavior, public indicators may behave slightly differently from real-time script editing mode.
The Hybrid Line Mode is designed to provide the most stable and drift-free line display.
In den Scripts nach "pullback" suchen

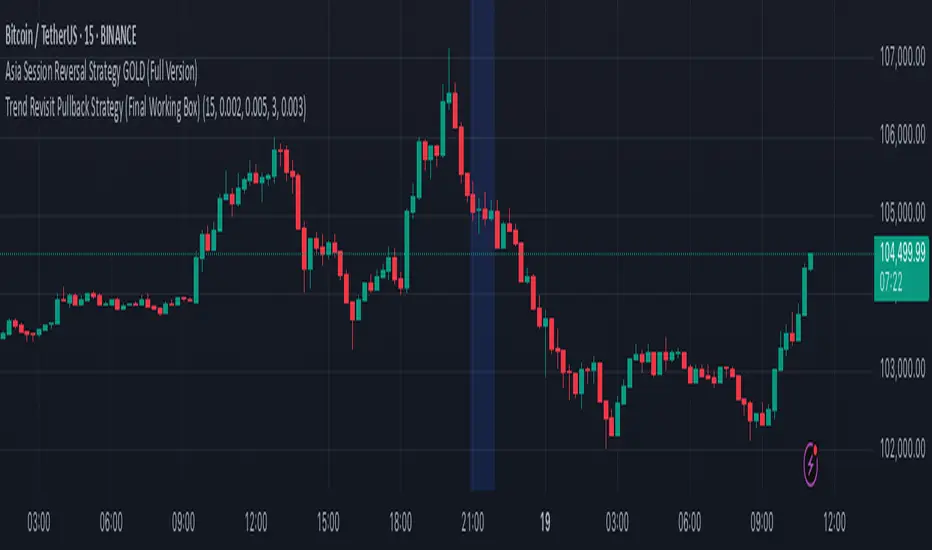
Trend Revisit Pullback Strategy (Final Working Box)📈 Trend Revisit Pullback Strategy
This TradingView Pine Script strategy identifies strong trend breakouts and accounts for natural pullbacks by:
Entering long or short on strong 1-bar breakouts
Allowing for pullback averaging if price retraces after entry
Expecting a revisit to the original entry price within 15 bars
Automatically exiting at break-even or using a custom TP/SL
Drawing a visual trade zone (entry → SL → revisit window) for easy reference
Optional labels and color-coded boxes to track each trade’s lifecycle
Ideal for trend traders who anticipate a pullback and prefer to manage risk with break-even exits or reward-to-risk parameters.
Smart Grid Scalping (Pullback) Strategy[BullByte]The Smart Grid Scalping (Pullback) Strategy is a high-frequency trading strategy designed for short-term traders who seek to capitalize on market pullbacks. This strategy utilizes a dynamic ATR-based grid system to define optimal entry points, ensuring precise trade execution. It integrates volatility filtering and an RSI-based confirmation mechanism to enhance signal accuracy and reduce false entries.
This strategy is specifically optimized for scalping by dynamically adjusting trade levels based on current market conditions. The grid-based system helps capture retracement opportunities while maintaining strict trade management through predefined profit targets and trailing stop-loss mechanisms.
Key Features :
1. ATR-Based Grid System :
- Uses a 10-period ATR to dynamically calculate grid levels for entry points.
- Prevents chasing trades by ensuring price has reached key levels before executing entries.
2. No Trade Zone Protection :
- Avoids low-volatility zones where price action is indecisive.
- Ensures only high-momentum trades are executed to improve success rate.
3. RSI-Based Entry Confirmation :
- Long trades are triggered when RSI is below 30 (oversold) and price is in the lower grid zone.
- Short trades are triggered when RSI is above 70 (overbought) and price is in the upper grid zone.
4. Automated Trade Execution :
- Long Entry: Triggered when price drops below the first grid level with sufficient volatility.
- Short Entry: Triggered when price exceeds the highest grid level with sufficient volatility.
5. Take Profit & Trailing Stop :
- Profit target set at a customizable percentage (default 0.2%).
- Adaptive trailing stop mechanism using ATR to lock in profits while minimizing premature exits.
6. Visual Trade Annotations :
- Clearly labeled "LONG" and "SHORT" markers appear at trade entries for better visualization.
- Grid levels are plotted dynamically to aid decision-making.
Strategy Logic :
- The script first calculates the ATR-based grid levels and ensures price action has sufficient volatility before allowing trades.
- An additional RSI filter is used to ensure trades are taken at ideal market conditions.
- Once a trade is executed, the script implements a trailing stop and predefined take profit to maximize gains while reducing risks.
---
Disclaimer :
Risk Warning :
This strategy is provided for educational and informational purposes only. Trading involves significant risk, and past performance is not indicative of future results. Users are advised to conduct their own due diligence and risk management before using this strategy in live trading.
The developer and publisher of this script are not responsible for any financial losses incurred by the use of this strategy. Market conditions, slippage, and execution quality can affect real-world trading outcomes.
Use this script at your own discretion and always trade responsibly.

Custom Percent Pullback LevelThis script takes a stock's current day low and current day high and lets you set a custom pullback level (line and label on the chart) that you can then set an alert for or use as an indicator if the stock is still bullish or bearish.
Pullbacks can be useful for momentum runners to identify potential continuation. As a rule of thumb many people want to see that stock hold onto at least 33% of it's daily gain to continue a bullish look. Some people may want it to hold 50%, and others may want to see a certain amount of gains held through new highs.
This tool allows you to set a custom pullback level for that day so you can easily spot on the chart if the stock is nearing or falling below those levels. You can also set an alert for that level in order to get your attention.

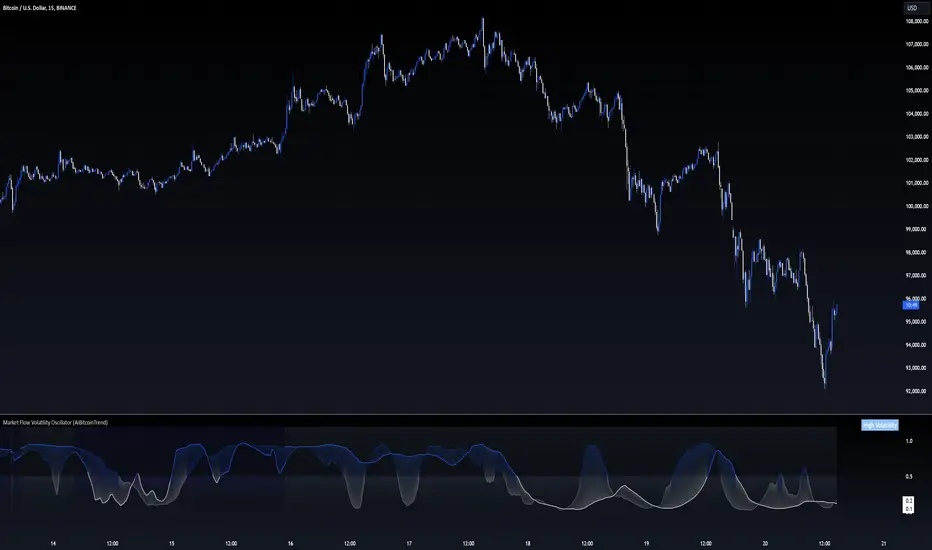
Market Flow Volatility Oscillator (AiBitcoinTrend)The Market Flow Volatility Oscillator (AiBitcoinTrend) is a cutting-edge technical analysis tool designed to evaluate and classify market volatility regimes. By leveraging Gaussian filtering and clustering techniques, this indicator provides traders with clear insights into periods of high and low volatility, helping them adapt their strategies to evolving market conditions. Built for precision and clarity, it combines advanced mathematical models with intuitive visual feedback to identify trends and volatility shifts effectively.
👽 How the Indicator Works
👾 Volatility Classification with Gaussian Filtering
The indicator detects volatility levels by applying Gaussian filters to the price series. Gaussian filters smooth out noise while preserving significant price movements. Traders can adjust the smoothing levels using sigma parameters, enabling greater flexibility:
Low Sigma: Emphasizes short-term volatility.
High Sigma: Captures broader trends with reduced sensitivity to small fluctuations.
👾 Clustering Algorithm for Regime Detection
The core of this indicator is its clustering model, which classifies market conditions into two distinct regimes:
Low Volatility Regime: Calm periods with reduced market activity.
High Volatility Regime: Intense periods with heightened price movements.
The clustering process works as follows:
A rolling window of data is analyzed to calculate the standard deviation of price returns.
Two cluster centers are initialized using the 25th and 75th percentiles of the data distribution.
Each price volatility value is assigned to the nearest cluster based on its distance to the centers.
The cluster centers are refined iteratively, providing an accurate and adaptive classification.
👾 Oscillator Generation with Slope R-Values
The indicator computes Gaussian filter slopes to generate oscillators that visualize trends:
Oscillator Low: Captures low-frequency market behavior.
Oscillator High: Tracks high-frequency, faster-changing trends.
The slope is measured using the R-value of the linear regression fit, scaled and adjusted for easier interpretation.
👽 Applications
👾 Trend Trading
When the oscillator rises above 0.5, it signals potential bullish momentum, while dips below 0.5 suggest bearish sentiment.
👾 Pullback Detection
When the oscillator peaks, especially in overbought or oversold zones, provide early warnings of potential reversals.
👽 Indicator Settings
👾 Oscillator Settings
Sigma Low/High: Controls the smoothness of the oscillators.
Smaller Values: React faster to price changes but introduce more noise.
Larger Values: Provide smoother signals with longer-term insights.
👾 Window Size and Refit Interval
Window Size: Defines the rolling period for cluster and volatility calculations.
Shorter windows: adapt faster to market changes.
Longer windows: produce stable, reliable classifications.
Disclaimer: This information is for entertainment purposes only and does not constitute financial advice. Please consult with a qualified financial advisor before making any investment decisions.
Davin's 10/200MA Pullback on SPY Strategy v2.0Strategy:
Using 10 and 200 Simple moving averages, we capitalize on price pullbacks on a general uptrend to scalp 1 - 5% rebounds. 200 MA is used as a general indicator for bullish sentiment, 10 MA is used to identify pullbacks in the short term for buy entries.
An optional bonus: market crash of 20% from 52 days high is regarded as a buy the dip signal.
An optional bonus: can choose to exit on MA crossovers using 200 MA as reference MA (etc. Hard stop on 50 cross 200)
Recommended Ticker: SPY 1D (I have so far tested on SPY and other big indexes only, other stocks appear to be too volatile to use the same short period SMA parameters effectively) + AAPL 4H
How it works:
Buy condition is when:
- Price closes above 200 SMA
- Price closes below 10 SMA
- Price dumps at least 20% (additional bonus contrarian buy the dip option)
Entry is on the next opening market day the day after the buy condition candle was fulfilled.
Sell Condition is when:
- Prices closes below 10 SMA
- Hard stop at 15% drawdown from entry price (adjustable parameter)
- Hard stop at medium term and long term MA crossovers (adjustable parameters)
So far this strategy has been pretty effective for me, feel free to try it out and let me know in the comments how you found :)
Feel free to suggest new strategy ideas for discussion and indicator building

Mini-Pullbacks SupertrendThis WOP script is trying to check the pullbacks in a trend and open a position when the pullback is finishing
EMA deviation & Range with barcolor changeThis indicator includes an EMA, a range and outer lines similar to the Bollinger Bands, but with a different calculation (which also becomes apparent once you compare the two). This indicator fits very well with the EMA pullback strategy.
The color of the candles changes depending on where it is located.
Above the EMA - green
Below it - red
Inside the range - black
All colors as well as lines are customizable under the Style tab.
The "Deviation" can be set to 0, here there are only slight deviations.
The EMA range can be adjusted in 0.1 steps to achieve the highest possible accuracy of the pullbacks.
If you have any questions, please don't hesitate to contact me.

EMA21 Pullback BuyEMA21 Pullback Buy is a tool designed to identify constructive pullbacks to the 21-period EMA in strong uptrends.
It highlights candles where:
• The previous close was above EMA21
• The current low touches or dips below EMA21
• The candle closes back above EMA21
These candles are considered potential “support tests” in a trending stock.
You can configure a maximum number of valid tests to avoid late-stage entries.
The script:
• Colors the test candles (optional)
• Marks them with a small circle
• Triggers a buy signal (green triangle) on the first bullish candle that breaks above the test candle’s high
Optional alerts are included for both:
• New EMA21 test
• Buy trigger after valid test
The goal is to help traders find low-risk entries in clean, trending stocks — without chasing breakouts or reacting emotionally. Best used with strong RS names and proper trend context.

BTC 4H — No-3% Pullback Moves (>=7%, wick-to-wick)4h candles move without pullbacks 3%
in settings you can set a pullback %
and i try to got middle % of such moves

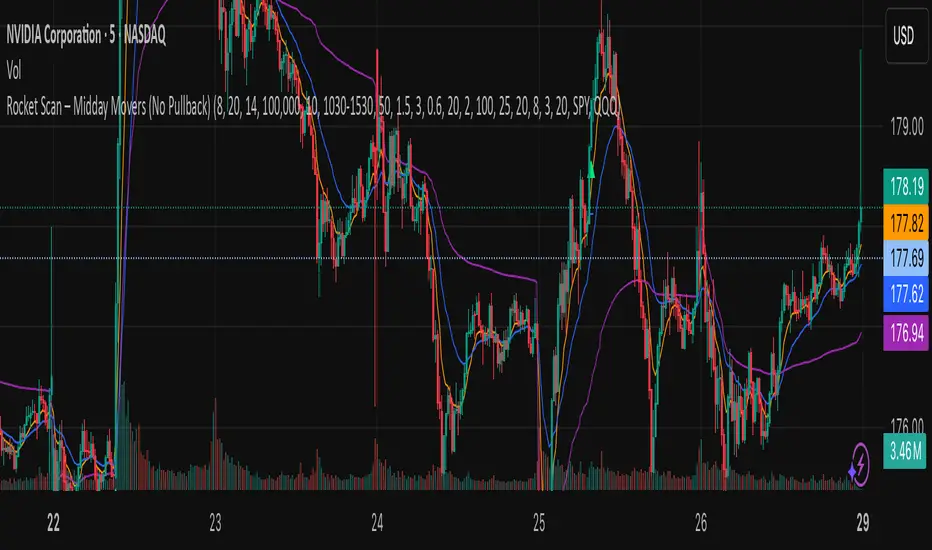
Rocket Scan – Midday Movers (No Pullback)This indicator is designed to spot intraday breakout movers that often appear after the market open — the ones that rip out of nowhere and cause FOMO if you’re late.
🔑 Core Logic
• Momentum Burst: Detects sudden price pops (ROC) with confirming relative volume.
• Squeeze → Breakout: Finds low-volatility compressions (tight Bollinger bandwidth) and flags the first breakout move.
• VWAP Reclaims: Highlights strong reversals when price reclaims VWAP on volume.
• Relative Volume (RVOL): Filters for unusual activity vs. recent averages.
• Gap Filter: Skips large overnight gappers, focuses on fresh intraday movers.
• Relative Strength: Optional filter requiring the symbol to outperform SPY (and sector ETF if chosen).
• Session Window: Default 10:30–15:30 ET to ignore noisy open action and catch true midday moves.
🎯 Use Case
• Built for traders who want early alerts on midday runners without waiting for pullbacks.
• Helps identify potential entry points before FOMO kicks in.
• Works best on liquid tickers (stocks, ETFs, crypto) with reliable intraday volume.
📊 Visuals
• Plots fast EMA, slow EMA, and VWAP for trend context.
• Paints green ▲ for long signals and red ▼ for short signals on the chart.
• Info label shows RVOL, ROC, RS filter status, and gap conditions.
🚨 Alerts
Two alert conditions included:
• Rocket: Midday LONG → Fires when bullish conditions align.
• Rocket: Midday SHORT → Fires when bearish conditions align.
⸻
⚠️ Disclaimer:
This tool is for educational and research purposes only. It is not financial advice. Trading involves risk; always do your own research or consult a licensed professional.
RSI Trail [UAlgo]The RSI Trail indicator is a technical analysis tool designed to assist traders in making informed decisions by utilizing the Relative Strength Index (RSI) and various moving average calculations. This indicator dynamically plots support and resistance levels based on RSI values, providing visual cues for potential bullish and bearish signals. The inclusion of a trailing stop mechanism allows traders to adapt to market volatility, ensuring optimal entry and exit points.
🔶 Key Features
Multiple Moving Average Types: Choose from Simple Moving Average (SMA), Exponential Moving Average (EMA), Weighted Moving Average (WMA), Running Moving Average (RMA), and McGinley Dynamic for diverse analytical approaches.
Configurable RSI Bounds: Tailor the RSI lower and upper bounds to your specific trading preferences, with default settings at 40 and 60.
Signals: The indicator determines bullish and bearish market states and plots corresponding signals on the chart.
Customizable Visualization: Options to display the midline and color candles based on market state enhance visual analysis.
Alerts: Integrated alert conditions notify you of bullish and bearish signals.
🔶 Calculations
The RSI Trail indicator calculates dynamic support and resistance levels using a combination of moving averages and the Relative Strength Index (RSI). It starts by computing a chosen moving average (SMA, EMA, WMA, RMA, or McGinley) over a period of 27 using the typical price (ohlc4).
The indicator then defines upper and lower bounds based on customizable RSI levels (default 40 and 60) and adjusts these bounds using the Average True Range (ATR) to account for market volatility. The upper bound is calculated by adding a volatility-adjusted value to the moving average, while the lower bound is found by subtracting this value. Bullish signals occur when the price crosses above the upper bound, and bearish signals when it falls below the lower bound.
The RSI Trail indicator also can be used to identify pullback opportunities. When the price high/low crosses above/below the calculated upper/lower bound, it indicates a potential pullback, suggesting a favorable point to enter a trade during a pullback.
🔶 Disclaimer
This indicator is for informational purposes only and should not be considered financial advice.
Always conduct your own research and due diligence before making any trading decisions. Past performance is not necessarily indicative of future results.

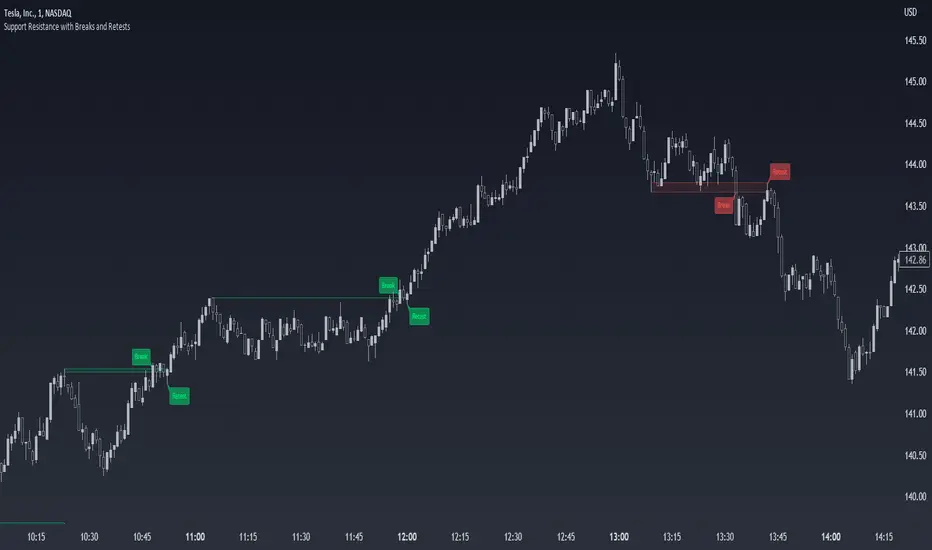
Support Resistance with Breaks and RetestsThe Break and Retest indicator strives to provide a visual aid for spotting areas of continuation and pullbacks. Support and resistance levels are drawn out automatically and have sequential conditions in place to determine a breakout following an eventual retest. Additionally, there are methods in place that try and detect liquidation events and still output a retest.
Although there are options to adjust repaint settings, "potential labels" are structured in a way to detect live ongoing retest events and therefore will be the only thing in the script that will be forced to repaint.
🔳 Settings
Lookback Range: Lookback period to trigger a new support/resistance level when pivot conditions are met.
Bars Since Breakout: How many bars since breakout in order to detect a retest.
Retest Detection Limiter: Whenever a potential retest is detected, the indicator knows that a retest is about to happen. In that given situation, this input grants the ability to raise the limit on how many bars are allowed to be actively checked while a potential retest event is active. For example, if you see the potential retest label, how many bars do you want that potential retest label to be active for to eventually confirm a retest?
🔳 Repaint Options
By default, the break and retest system uses the current close value to determine a condition. (Repaints by default)
On: Allows repainting
Off - Bar Confirmation: Prevents repainting and generates alerts when the bar closes. (1 candle later)
Off - High & Low: Prevents repainting, but in return utilizes both the high and low values instead of the close which may yield a higher outcome and inaccurate results.
🔳 How it works
In the background, calculations aren't searching for the perfect retest within the zone but instead focuses its attention towards price fluctuation around the zones. This allows the indicator to yield more results than it would otherwise.
The chart below provides an example of how potential retests are established. These are updated constantly until a retest is confirmed, and deleted if not. If a potential retest is active and the next candle drops below the value when the potential retest was detected, a retest is placed..
🔳 Alerts
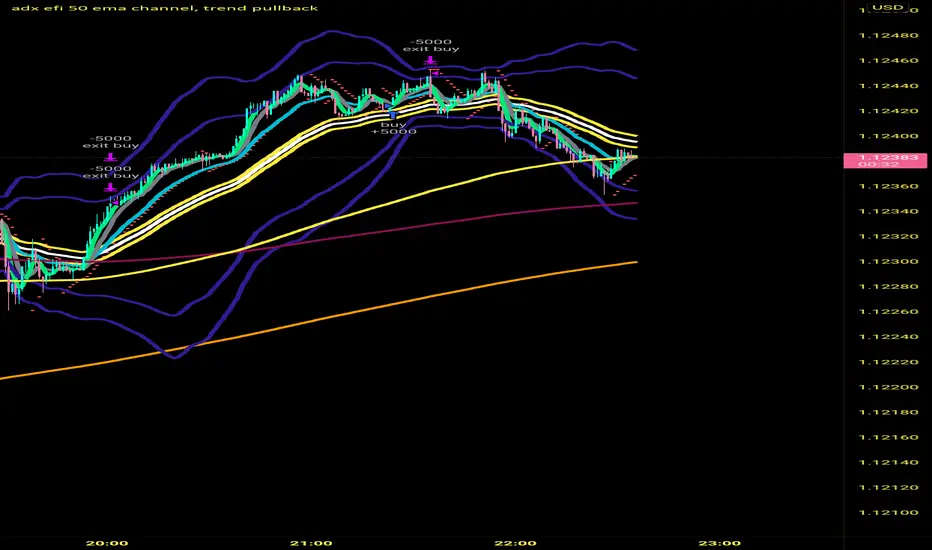
adx efi 50 ema channel, trend pullbackHi so this strategy is based off 50 ema channel and the 15 ma crossing it to generate signals. But with my adjusted strategy it's a 10 rma crossing 50 ema channels and a 5 and 9 wma to help see pullbacks. 50 period bollinger bands to gage volatility a0nd help during range markets. The strategy signals are generated when longer period efi is above 0 and shorter period efi is below zero and price has pulled back near 50 ema to buy long. And the reverse for shorts, I made this to help me trade more mechanically and to trade 1 minute time frame, that's where the strategy seems to Excell the most, I developed it on eur usd but a brief check seems like it still is profitable on gbp usd aud usd usd jpy I only trade the forex market so not sure about stocks and crypto. If you get signals I would place buy stops and sell stops above high and low of respective signal candle and let price take you into trade. Also adx 20 has to be greater than 20 to take trades. Let me know if this is helpful. I've only been coding for a month so it might look sloppy the way it's coded also there are a few other buy and sell conditions left in the source code if you want to switch between different buy and sell triggers, they all produce good results on 1 min timeframe
W%R Pullback+EMA Trend [TS_Indie]🔰 Core Concept of the Strategy
The main idea is “Trend-Following with Momentum Pullback.”
This means trading in the direction of the main trend (defined by EMA) while using Williams %R to identify pullback entries (buying the dip or selling the rally) where momentum returns to the trend direction.
📊 Indicators Used
1. EMA Fast – Defines the short-term trend.
2. EMA Slow – Defines the long-term trend (used as a trend filter).
3. Williams %R
• Overbought zone: above -20
• Oversold zone: below -80
⚙️ Entry Rules
🔹 Buy Setup
1. EMA Fast > EMA Slow → Uptrend condition.
2. Williams %R on the previous candle dropped below -80, and on the current candle, it crosses back above -80 → indicates momentum returning to the upside.
3. Current close is above EMA Fast.
4. Entry Buy at the close of the candle where %R crosses above -80.
🎯 Entry, Stop Loss, and Take Profit
1. Entry : At the candle close where the signal occurs.
2. Stop Loss : At the lowest low between the current and previous candles.
3. Take Profit : Calculated based on entry price and stop loss distance multiplied by the Risk/Reward Ratio.
🔹 Sell Setup
1. EMA Fast < EMA Slow → Downtrend condition.
2. Williams %R on the previous candle went above -20, and on the current candle, it crosses back below -20 → indicates renewed selling momentum.
3. Current price is below EMA Fast.
4. Entry Sell at the close of the candle where %R crosses below -20.
🎯 Entry, Stop Loss, and Take Profit
1. Entry : At the candle close where the signal occurs.
2. Stop Loss : At the highest high between the current and previous candles.
3. Take Profit : Calculated based on entry price and stop loss distance multiplied by the Risk/Reward Ratio.
⚙️ Optional Parameters
• Custom Risk/Reward Ratio for Take Profit.
• Option to add ATR buffer to Stop Loss.
• Adjustable EMA Fast period.
• Adjustable EMA Slow period.
• Adjustable Williams %R period.
• Option to enable Long only / Short only positions.
• Customizable Backtest start and end date.
• Customizable trading session time.
⏰ Alert Function
Alerts display:
• Entry price
• Stop Loss price
• Take Profit price
Guys, try adjusting the parameters yourselves!
I’ve been tweaking the settings for several days and managed to get great results on XAU/USD in the 5-minute timeframe.
I think this strategy is quite interesting and could potentially deliver good results on other instruments as well.
⚠️ Disclaimer
This indicator is designed for educational and research purposes only.
It does not guarantee profits and should not be considered financial advice.
Trading in financial markets involves significant risk, including the potential loss of capital.

Retracement Strategy [OmegaTools]Retracement Strategy is a systematic trend–retracement framework designed to identify directional opportunities after a confirmed momentum shift, and to manage exits using either trend reversals or overextension conditions. It is built around a smoothed RSI regime filter and a simple, price-based retracement trigger, making it applicable across a wide range of markets and timeframes while remaining transparent and easy to interpret.
The strategy begins by defining the underlying trend through a two-stage RSI signal. A standard RSI is computed over the user-defined Length input, then smoothed with a short moving average to reduce noise. Two symmetric thresholds are derived from the Threshold parameter: an upper band at 100 minus the threshold and a lower band at the threshold itself. When the smoothed RSI crosses above the upper band, the environment is classified as bullish and the internal trend state is set to uptrend. When the smoothed RSI crosses below the lower band, the environment is classified as bearish and the trend state becomes downtrend. When RSI moves back into the central zone between the two bands, the trend is considered neutral. In addition to the current trend, the strategy tracks the last non-neutral trend direction, which is used to detect genuine trend changes rather than transient oscillations.
Once a trend is established, the strategy looks for retracement entries in the direction of that trend. For long setups in an uptrend, it computes the lowest low over the previous Length minus one bars, excluding the current bar. A long signal is generated when price dips below this recent low while the trend state remains bullish. Symmetrically, for short setups in a downtrend, it computes the highest high over the previous Length minus one bars and enters short when price spikes above this recent high while the trend state remains bearish. This logic is designed to capture pullbacks against the prevailing RSI-defined trend, entering when the market tests or slightly violates recent extremes, rather than chasing breakouts. The candles are visually coloured to reflect the detected trend, highlighting bullish and bearish environments while keeping neutral phases distinguishable on the chart. An ATR-based measure is used solely to position the “UP” and “DN” labels on the chart for clearer visualisation of entry points; it does not directly influence position sizing or stop calculation in this implementation.
Take profit and stop loss behaviour are fully parameterized through the “Take Profit” and “Stop Loss” inputs, each offering three modes: None, Trend Change and Extension. When “Trend Change” is selected for the take profit, the strategy will only exit profitable positions when a confirmed trend reversal occurs. For a long position, this means that the strategy will close the trade when the trend state flips from uptrend to downtrend, and the last recorded trend direction validates that this is a genuine reversal rather than a neutral fluctuation; the same logic applies symmetrically for short positions. When “Extension” is selected as the take profit mode, the strategy closes profitable long trades when the smoothed RSI reaches or exceeds the upper threshold, interpreted as an overbought extension within the bullish regime, and closes profitable short trades when the smoothed RSI falls to or below the lower threshold, interpreted as an oversold extension within the bearish regime. When “None” is chosen, the strategy does not apply any explicit take profit logic, leaving trades to be managed by the stop loss settings or by user discretion in backtesting.
The stop loss parameter works in a parallel way. With “Trend Change” selected as stop loss, any open long position is closed when the trend flips from uptrend to downtrend, regardless of whether the trade is currently in profit or loss, and any open short is closed when the trend flips from downtrend to uptrend. This turns the RSI trend regime into a hard invalidation rule: once the underlying momentum structure reverses, the position is exited. With “Extension” selected for stop loss, long positions are closed when RSI falls back below the upper band and moves towards the opposite side of the range, while short positions are closed when RSI rises above the lower band and moves towards the upper side. In practice, this acts as a dynamic exit based on the oscillator moving out of a favourable context for the existing trade. Selecting “None” for stop loss disables these automatic exits, leaving only the take profit logic, if any, to manage the position. Because take profit and stop loss configuration are independent, the user can construct different profiles, such as pure trend-change exits on both sides, pure overextension exits, or a mix (for example, take profit on overextension and stop loss on trend reversal).
This strategy is designed as an analytical and backtesting framework rather than a finished plug-and-play trading system. It does not include position sizing, risk-per-trade controls, multi-timeframe confirmation, volatility filters or instrument-specific fine-tuning. Its primary purpose is to provide a clear, rule-based structure for testing retracement logic within RSI-defined trends, and to allow users to explore how different exit regimes (trend-change based versus extension based) affect performance on their instruments and timeframes of interest.
Nothing in this script or its description should be interpreted as financial advice, investment recommendation or solicitation to buy or sell any financial instrument. Past performance on backtests does not guarantee future results. The behaviour of this strategy can vary significantly across symbols, timeframes and market conditions, and correlations, volatility and liquidity can change without warning. Before considering any live application, users should thoroughly backtest and forward test the strategy on their own data, adjust parameters to their risk profile and instrument characteristics, and integrate proper money management and trade management rules. Use of this script is entirely at the user’s own risk.


Three-Year Pullback Indicator根據 VOO (Vanguard S&P 500 ETF) 和 0050 (元大台灣50) 的歷史數據,製作了一個 「回檔百分比」 指標,幫助大家在市場回調時,有更明確的底部加碼參考依據!
📌 指標特色與設計概念:
觀察過去走勢,像 VOO 和 0050 這種追蹤大盤的 ETF,自歷史高點回檔通常極少超過 30%。
分批加碼策略: 30% 以下的回檔區間,分為三個等份級距
30% 回檔 (紅色線): 第一筆加碼區
20% 回檔 (橘色線): 第二筆加碼區
10% 回檔 (綠色線): 第三筆加碼區
兩種回檔計算:
指標同時顯示兩種回檔百分比 (黑色/藍色線),讓您對價格所處位置一目瞭然:
黑色線表式從「歷史高點」 的回檔
藍色線表示從「自定義期間高點」 (預設 3 年/720 根 K 棒) 的回檔
請注意: 本指標僅供技術參考與研究交流。指標非投資建議! 投資人仍須根據自身的資金狀況、風險承受度及獨立判斷進行調整與決策。
Based on the historical data of VOO (Vanguard S&P 500 ETF) and 0050 (Yuanta Taiwan 50), I've created a practical "Drawdown Percentage" indicator. It aims to provide a clearer reference point for dollar-cost averaging (DCA) during market pullbacks!
📌 Indicator Features and Design Concept:
Historical Basis: Observing past trends, broad market tracking ETFs like VOO and 0050 have historically experienced very few drawdowns exceeding 30% from their all-time highs.Staged Accumulation Strategy: The drawdown range below 30% is divided into three equal tiers, serving as a reference for investors to deploy funds in stages:
30% Drawdown (Red Line): First Accumulation Zone
20% Drawdown (Orange Line): Second Accumulation Zone
10% Drawdown (Green Line): Third Accumulation Zone
🔍 Two Drawdown Calculations:
The indicator simultaneously displays two drawdown percentages (Black/Blue lines) for a clear view of the price's current position:
Black Line: Represents the drawdown from the "All-Time High".
Blue Line: Represents the drawdown from the "User-Defined Period High" (default is 3 years / 720 bars).
Please note: This indicator is provided for technical reference and educational purposes only. It is NOT investment advice! Investors must make adjustments and decisions based on their own financial condition, risk tolerance, and independent judgment.

8/30 SMA Pullback + ATR Exits (Crypto)A tryout using LLM to see if it can apply to bots using SMA pullbacks with ATR exits for crypto

[CUSTOM] Valid Pullbacks with pendingTrendFollow the approach of Valid Pullback & Trend indicator, but I have customized to have a pending line waiting for confirmation of the root source code
Draws the pending line to the developing internal high/low
Once a new pivot is confirmed:
- The pendingTrend line is cleared
- The direction is remembered
- No additional blue lines are drawn until the next internal pivot forms in the opposite direction
Retracer Barcolor With LuckyNickVaFibonacci Input Preset Retracer. This for highlighting your favorite Fibonacci retracement levels. Before using this indicator you should already have knowledge of what Fibonacci is & how to use it. These are levels where it said to be that the market may or may not reverse at. This is more used for anticipation, confluence & should be used in combination with other tools to confirm price action & your own analysis of your expectations. But quickly explained Fibonacci levels are Price Reversal levels that are self fulfilled due to mass trading at these price reversal levels. So the correct way to find opportunity with this script is to use these levels to analyze price action for Pullbacks in the market.

ADX Tide ZonesADX Tide Zones – Adaptive Momentum & Trend Strength Framework
Overview
ADX Tide Zones – Professional is a dynamic trend-strength visualizer designed for traders who want to interpret momentum with precision and context. By combining the Average Directional Index (ADX) with adaptive threshold logic, the indicator segments price action into distinct “tide zones” that reflect varying levels of market strength: Calm, Rising, Strong, and Falling Tides. These zones transform raw ADX readings into an interpretable framework that highlights when markets are consolidating, building momentum, trending strongly, or losing strength.
Unlike standard ADX readings, which can be difficult to interpret in real time, ADX Tide Zones translate momentum shifts into a continuous, color-coded system that traders can instantly read. Whether applied to scalping, intraday, or swing trading, the indicator offers a consistent methodology for identifying actionable opportunities across assets and timeframes.
How It Works
The foundation of ADX Tide Zones lies in momentum analysis via the ADX. By measuring the strength (not direction) of a trend, ADX provides an objective read on when markets are gaining or losing energy. ADX Tide Zones enhances this by applying threshold logic to classify ADX values into four distinct states:
Calm Tide : Low ADX values indicate sideways or consolidating conditions.
Rising Tide : ADX increases past a threshold, signaling momentum building.
Strong Tide : ADX remains elevated, confirming robust and sustained trend strength.
Falling Tide : ADX declines after strength, hinting at exhaustion or early reversal setups.
These states are displayed on the chart through adaptive visualizations (zones, bar colors, or overlays), offering real-time clarity on when to expect expansion, continuation, or contraction in price action.
Interpretation
Trend Analysis : By mapping transitions between tides, traders can instantly gauge whether markets are in accumulation, expansion, or exhaustion phases. Rising/Strong Tides reinforce trend continuation, while Falling Tides highlight weakening conditions.
Volatility & Risk Assessment : Shifts between Calm → Rising Tide often precede volatility expansions. Falling Tides can signal a period of compression or corrective moves, warning traders to manage risk proactively.
Market Context : The indicator does not dictate direction; instead, it overlays strength on top of price action, allowing traders to combine it with directional tools such as moving averages, order blocks, or liquidity zones for confirmation.
Strategy Integration
ADX Tide Zones adapts seamlessly to a wide range of trading strategies by translating momentum dynamics into actionable frameworks:
Trend Following : Traders can align with dominant flows by entering positions when the indicator confirms a Rising Tide or Strong Tide. These conditions signal persistent directional strength, making them ideal for continuation setups. Combining directional bias with ADX confirmation reduces the risk of trading against prevailing momentum.
Breakout Trading : When the market transitions from Calm Tide into a Rising Tide, it often precedes a volatility expansion. This shift highlights breakout conditions where accumulation gives way to impulsive price movement. Traders can use this transition as a timing tool to catch early entries into new momentum phases.
Exhaustion Reversals : Strong Tide phases don’t last forever—when they begin to fade into Falling Tide, it can mark trend fatigue or liquidity exhaustion. This offers contrarian traders an early edge in spotting overextended moves and positioning for corrective pullbacks or full reversals.
Multi-Timeframe Analysis : By overlaying higher timeframe tide zones on intraday or scalping charts, traders can filter noise and trade in alignment with larger flows. For example, combining a daily Rising Tide bias with a 15-minute breakout confirmation can significantly improve entry precision while reducing exposure to false signals.
Advanced Techniques
For traders seeking an extra edge, ADX Tide Zones can be pushed further with advanced methods:
Volume & Liquidity Confirmation : Pair the tide transitions with volume spikes, order flow, or liquidity sweep tools. When directional strength confirmed by the ADX coincides with institutional activity, it validates setups and increases probability of follow-through.
Cross-Asset Synchronization : Momentum rarely exists in isolation. Monitoring tide shifts across correlated instruments (e.g., majors vs. USD, or indices vs. risk assets) can uncover synchronized volatility events. These correlations help traders identify whether a move is isolated noise or part of a broader systemic trend.
Threshold Optimization : The sensitivity of ADX Tide Zones can be fine-tuned for different trading objectives. Lower thresholds heighten responsiveness, capturing micro-moves suitable for scalpers. Higher thresholds filter minor fluctuations, isolating major structural swings that align with swing or position trading.
Contextual Trade Management : Instead of using static stops or targets, traders can adapt risk management dynamically by tracking tide progression. For example, a trade initiated during Rising Tide may remain valid as long as conditions sustain, but partial profits or tighter stops can be applied once the zone shifts to Calm Tide.
Inputs & Customization
ADX Length : Define the lookback period for ADX calculation.
Threshold Levels : Adjust sensitivity for Calm, Rising, Strong, and Falling Tides.
Zone Visualization : Choose between bar coloring, background shading, or overlays.
Color Customization : Configure bullish, bearish, neutral, and tide-specific colors.
Multi-Timeframe Options : Enable tide readings from higher timeframes for confirmation.
Why Use ADX Tide Zones
ADX Tide Zones turns the complexity of momentum analysis into a visual system that highlights when markets are gearing up for moves, trending with conviction, or running out of steam. By combining adaptive ADX interpretation with customizable thresholds, traders can:
Anticipate breakouts before volatility expands.
Confirm the strength behind price trends.
Spot exhaustion phases early to secure profits or prepare for reversals.
Adapt strategies seamlessly between scalping, intraday, and swing trading.
With its balance of simplicity and depth, ADX Tide Zones provides a structured lens for reading market momentum, equipping traders with the clarity needed to execute with discipline and confidence.

Crypto Mean Reversion System (Pullback & Bounce)Mean Reversion Theory
The indicator operates on the principle that extreme price movements in crypto markets tend to revert toward their mean over time.
Consider this a valuable aid for your dollar-cost averaging strategy, effectively identifying periods ripe for accumulating or divesting from the market.
Research shows that:
Short-term momentum often persists briefly after surges, but extreme moves trigger mean reversion
Sharp drops exhibit strong bounce patterns, especially after capitulation events
Longer timeframes (7-day) show stronger mean reversion tendencies than shorter ones (1-day)
Timeframe Analysis
1-Day Timeframe
Pullback probabilities: 45-85% depending on surge magnitude
Bounce probabilities: 55-95% depending on drop severity
Captures immediate overextension and panic selling
More volatile but faster signal generation
7-Day Timeframe
Pullback probabilities: 50-90% (higher confidence)
Bounce probabilities: 50-90% (slightly moderated)
Filters out noise and identifies sustained trends
Stronger mean reversion signals due to extended moves
Probability Tiers
Pullback Risk (After Surges)
Moderate (45-60%): 5-10% surge → Expected -3% to -12% pullback
High (55-70%): 10-15% surge → Expected -5% to -18% pullback
Very High (65-80%): 15-25% surge → Expected -10% to -25% pullback
Extreme (75-90%): 25%+ surge → Expected -15% to -40% pullback
Bounce Probability (After Drops)
Moderate (55-65%): -5% to -10% drop → Expected +3% to +10% bounce
High (65-75%): -10% to -15% drop → Expected +6% to +18% bounce
Very High (75-85%): -15% to -25% drop → Expected +10% to +30% bounce
Extreme (85-95%): -25%+ drop → Expected +18% to +45% bounce
The probability ranges are derived from:
Crypto volatility patterns: Higher volatility than traditional assets creates stronger mean reversion
Behavioral finance: Extreme moves trigger emotional trading (FOMO/panic) that reverses
Historical backtesting: Probability estimates based on typical reversion patterns in crypto markets
Timeframe correlation: Longer timeframes show increased reversion probability due to reduced noise
Key Features
Dual-direction signals: Identifies both overbought (pullback) and oversold (bounce) conditions
Multi-timeframe confirmation: 1D and 7D analysis for different trading styles
Customizable thresholds: Adjust sensitivity based on asset volatility
Visual alerts: Color-coded labels and table for quick assessment
Risk categorization: Clear severity levels for position sizing
