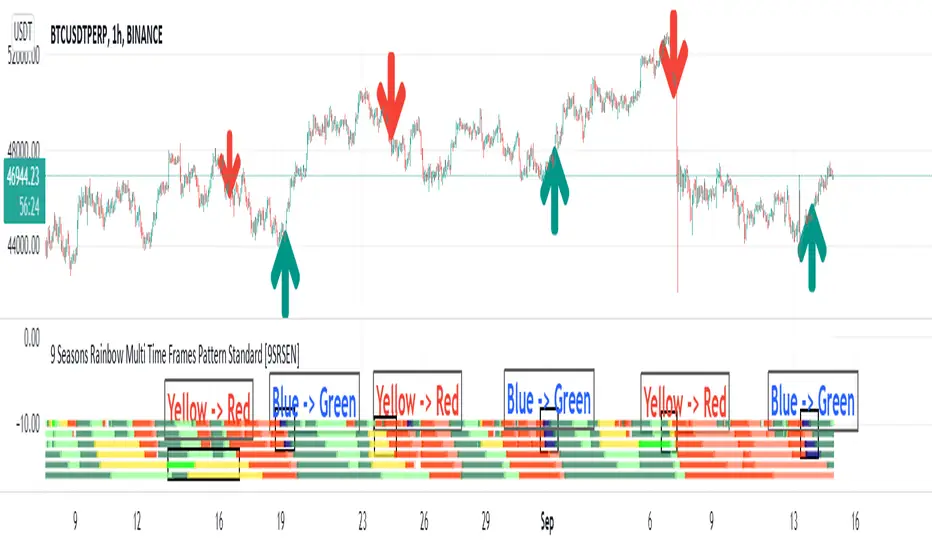
9 Seasons Rainbow Multiple Time Frames Pattern Standard [9SRSEN]The indicator discovers profitable patterns by associating Price Season of multiple time frames.
Full Name: 9 Seasons Rainbow - Multiple Time Frames Associated Price Wave Pattern Indicator
This is redefined from “9 Seasons Rainbow Indicator STANDARD”, with clearer definition of 9 Seasons and user manual.
Version: Invite-Only Standard
Language: English
Copyright: 2019
---------- How to use the indicator ----------
Go through the manual and related ideas underneath or follow the tutorials list. Look through the profitable patterns and related cases, wait for or set alert for specific profitable pattern.
---------- Definition: 9 Seasons ----------
A life cycle of Price Wave is divided into 9 Seasons. Each time frame, from 5 minute to 1 month, has 9 seasons, Independent of each other:
Bull (Green)
Bull Pullback (Light Green): a pullback or retracement
Resistance / Overbought (Yellow): a resistance area, may become a Top, or be broken through.
Crazy Bought (Lime): Price is going up in a high volatility, could be a valid breakout, or a Bull Trap.
Neutral (White): a wandering season without direction, evolves into Bull or Bear
Bear (Red)
Bear Bounce (Light Red): Price bounces
Support / Oversold (Blue): a support area, may become a Bottom, or be broken through.
Crazy Sold (Fuchsia): Price is going down in a high volatility, could be a valid breakdown, or a Bear Trap.
---------- Some important evolution between seasons ----------
Resistance / Overbought (Yellow) -> Crazy Bought (Lime):
Bull is breaking through a resistance.
Crazy Bought (Lime) -> Resistance / Overbought (Yellow):
This normally indicates a failed breakout, Price goes back to the resistance.
Crazy Bought (Lime) -> Bull Pullback (Light Green):
This normally indicates Price has risen to a new level
Support / Oversold (Blue) -> Crazy Sold (Fuchsia):
Bear is breaking through a support.
Crazy Sold (Fuchsia) -> Support / Oversold (Blue):
This normally indicates a failed breakdown, Price recovers to the support.
Crazy Sold (Fuchsia) -> Bear Bounce (Light Red):
This normally indicates price has dropped to a new level
---------- Rainbow Ribbons for Multiple Time Frames ----------
Each ribbon of a rainbow represents a time frame.
The uppermost ribbon represents the shortest-term time frame - current time period of the chart, which is the time frame for trading.
The lowermost ribbon represent longest-term time frame, which work as environment, together with the other medium-term and long-term time frames.
The difference between two frames is 1.4142 fold (square root of 2), if level 1 is 15 minute, level 2 is 15 minute * (square root of 2) .
Examples of time frames in a rainbow:
For STANDARD in 15M: 15M - 21M - 30M - 42M - 60M(1H) - 85M - 120M(2H) - 170M
For PRO in 15M: 15M - 21M - 30M - 42M - 60M(1H) - 85M - 120M(2H) - 170M - 240M(4H) - 339M - 480M(8H) - 679M
---------- Trading Methods ----------
How to open a Long position?
When a profitable Long pattern appears, open small position first based on signal on shortest-term time frame; after retesting and confirming the support, open 2nd position; when it breaks through the resistance, pullbacks and confirms the breakout, open 3rd position.
How to exit a Long position?
Lift the Stop to a confirmed higher low, so that to take advantages of the bull run as possible.
How to open a Short position?
When a profitable Short pattern appears, open small position first based on signal on shortest-term time frame; after retesting and confirming the resistance, open 2nd position; when it breaks through the support, bounces and confirms the breakdown, add 3rd position.
How to exit a Short position?
Lower the Stop to a confirmed lower high, so that to take advantages of the bear run as possible.
---------- Versions Description ----------
The features may change later without advance notice.
PRO:
Invite-Only, with the following advanced features:
12 Ribbons Rainbow displays 9 Seasons of 12 time frames on a chart.
Advanced alert sets allows set alerts on short-term, medium-term, and long-term time frames.
Capability to input different trading instrument to compare with the current ticker.
Full time periods access allows apply it to broadest time periods, from 1 minute to 1 week (if history data is enough)
More new features in updates.
STANDARD:
Invite-Only, with the following advanced features:
8 Ribbons Rainbow displays 9 Seasons of 8 time frames on a chart.
Advanced alert sets allows set alerts on upper and lower frames.
Broad time periods access allows apply it to the most popular time periods, from 15 minute to 1 week (if history data is enough)
More new features in updates.
DEMO:
DEMO version is for trial purpose, having most of the features.
It is applicable to a list of trading instruments and specific time periods (1 hour to 1 day), which may change later without advance notice.
---------- Access to Indicators ----------
Please use DEMO version for Trial
Asking access to Invite-Only PRO and STANDARD versions:
9seasonsrainbowindicator.blogspot.com
Or contact the author.
---------- Install Invite Only: STANDARD & PRO Version----------
Ask access to STANDARD or PRO version
Open the chart -> Indicators (On the Top) -> Invite-Only Scripts (2nd button of the left bar)
Like/Favorite the indicator
Click to install on the chart
---------- About Loading Time ----------
It may take up to 2 minutes for your browser to load a new setting, depending on the your computer and network speed.
---------- List of the author's Indicators ----------
www.tradingview.com
---------- Disclaimer ----------
By using or requesting access to the indicator, you acknowledge that you have read and accepted that the indicator and any related content, including but not limited to: user manual, tutorials, ideas, videos, chats, emails, blog, are for the purpose of trading strategies studying and paper trading.
If a customer or user uses the indicator or related content mentioned above for live trading or investment, she/he should take all risks and be responsible for her/his own trading and investment activities.
---------- Updates ----------
The latest updates override the previous description.
To activate a update: Close the browser, Reopen the chart and apply the indicator.
In den Scripts nach "profitable" suchen
9 Seasons Rainbow Multiple Time Frames Pattern PRO [9SPEN]The indicator discovers profitable patterns by associating Price Season of multiple time frames.
Full Name: 9 Seasons Rainbow - Multiple Time Frames Associated Price Wave Pattern Indicator
This is redefined from “9 Seasons Rainbow Indicator PRO”, with clearer definition of 9 Seasons and user manual.
Version: Invite-Only PRO
Language: English
Copyright: 2019
---------- How to use the indicator ----------
Go through the manual and related ideas underneath or follow the tutorials list. Look through the profitable patterns and related cases, wait for or set alert for specific profitable pattern.
---------- Definition: 9 Seasons ----------
A life cycle of Price Wave is divided into 9 Seasons. Each time frame, from 5 minute to 1 month, has 9 seasons, Independent of each other:
Bull (Green)
Bull Pullback (Light Green): a pullback or retracement
Resistance / Overbought (Yellow): a resistance area, may become a Top, or be broken through.
Crazy Bought (Lime): Price is going up in a high volatility, could be a valid breakout, or a Bull Trap.
Neutral (White): a wandering season without direction, evolves into Bull or Bear
Bear (Red)
Bear Bounce (Light Red): Price bounces
Support / Oversold (Blue): a support area, may become a Bottom, or be broken through.
Crazy Sold (Fuchsia): Price is going down in a high volatility, could be a valid breakdown, or a Bear Trap.
---------- Some important evolution between seasons ----------
Resistance / Overbought (Yellow) -> Crazy Bought (Lime):
Bull is breaking through a resistance.
Crazy Bought (Lime) -> Resistance / Overbought (Yellow):
This normally indicates a failed breakout, Price goes back to the resistance.
Crazy Bought (Lime) -> Bull Pullback (Light Green):
This normally indicates Price has risen to a new level
Support / Oversold (Blue) -> Crazy Sold (Fuchsia):
Bear is breaking through a support.
Crazy Sold (Fuchsia) -> Support / Oversold (Blue):
This normally indicates a failed breakdown, Price recovers to the support.
Crazy Sold (Fuchsia) -> Bear Bounce (Light Red):
This normally indicates price has dropped to a new level
---------- Rainbow Ribbons for Multiple Time Frames ----------
Each ribbon of a rainbow represents a time frame.
The uppermost ribbon represents the shortest-term time frame - current time period of the chart, which is the time frame for trading.
The lowermost ribbon represent longest-term time frame, which work as environment, together with the other medium-term and long-term time frames.
The difference between two frames is 1.4142 fold (square root of 2), if level 1 is 15 minute, level 2 is 15 minute * (square root of 2) .
Examples of time frames in a rainbow:
For STANDARD in 15M: 15M - 21M - 30M - 42M - 60M(1H) - 85M - 120M(2H) - 170M
For PRO in 15M: 15M - 21M - 30M - 42M - 60M(1H) - 85M - 120M(2H) - 170M - 240M(4H) - 339M - 480M(8H) - 679M
---------- Trading Methods ----------
How to open a Long position?
When a profitable Long pattern appears, open small position first based on signal on shortest-term time frame; after retesting and confirming the support, open 2nd position; when it breaks through the resistance, pullbacks and confirms the breakout, open 3rd position.
How to exit a Long position?
Lift the Stop to a confirmed higher low, so that to take advantages of the bull run as possible.
How to open a Short position?
When a profitable Short pattern appears, open small position first based on signal on shortest-term time frame; after retesting and confirming the resistance, open 2nd position; when it breaks through the support, bounces and confirms the breakdown, add 3rd position.
How to exit a Short position?
Lower the Stop to a confirmed lower high, so that to take advantages of the bear run as possible.
---------- Versions Description ----------
The features may change later without advance notice.
PRO:
Invite-Only, with the following advanced features:
12 Ribbons Rainbow displays 9 Seasons of 12 time frames on a chart.
Advanced alert sets allows set alerts on short-term, medium-term, and long-term time frames.
Capability to input different trading instrument to compare with the current ticker.
Full time periods access allows apply it to broadest time periods, from 1 minute to 1 week (if history data is enough)
More new features in updates.
STANDARD:
Invite-Only, with the following advanced features:
8 Ribbons Rainbow displays 9 Seasons of 8 time frames on a chart.
Advanced alert sets allows set alerts on upper and lower frames.
Broad time periods access allows apply it to the most popular time periods, from 15 minute to 1 week (if history data is enough)
More new features in updates.
DEMO:
DEMO version is for trial purpose, having most of the features.
It is applicable to a list of trading instruments and specific time periods (1 hour to 1 day), which may change later without advance notice.
---------- Access to Indicators ----------
Please use DEMO version for Trial
Asking access to Invite-Only PRO and STANDARD versions:
9seasonsrainbowindicator.blogspot.com
Or contact the author.
---------- Install Invite Only: STANDARD & PRO Version----------
Ask access to STANDARD or PRO version
Open the chart -> Indicators (On the Top) -> Invite-Only Scripts (2nd button of the left bar)
Like/Favorite the indicator
Click to install on the chart
---------- About Loading Time ----------
It may take up to 2 minutes for your browser to load a new setting, depending on the your computer and network speed.
---------- List of the author's Indicators ----------
www.tradingview.com
---------- Disclaimer ----------
By using or requesting access to the indicator, you acknowledge that you have read and accepted that the indicator and any related content, including but not limited to: user manual, tutorials, ideas, videos, chats, emails, blog, are for the purpose of trading strategies studying and paper trading.
If a customer or user uses the indicator or related content mentioned above for live trading or investment, she/he should take all risks and be responsible for her/his own trading and investment activities.
---------- Updates ----------
The latest updates override the previous description.
To activate a update: Close the browser, Reopen the chart and apply the indicator.

Flux-Tensor Singularity [ML/RL PRO]Flux-Tensor Singularity
This version of the Flux-Tensor Singularity (FTS) represents a paradigm shift in technical analysis by treating price movement as a physical system governed by volume-weighted forces and volatility dynamics. Unlike traditional indicators that measure price change or momentum in isolation, FTS quantifies the complete energetic state of the market by fusing three fundamental dimensions: price displacement (delta_P), volume intensity (V), and local-to-global volatility ratio (gamma).
The Physics-Inspired Foundation:
The tensor calculation draws inspiration from general relativity and fluid dynamics, where massive objects (large volume) create curvature in spacetime (price action). The core formula:
Raw Singularity = (ΔPrice × ln(Volume)) × γ²
Where:
• ΔPrice = close - close (directional force)
• ln(Volume) = logarithmic volume compression (prevents extreme outliers)
• γ (Gamma) = (ATR_local / ATR_global)² (volatility expansion coefficient)
This raw value is then normalized to 0-100 range using the lookback period's extremes, creating a bounded oscillator that identifies critical density points—"singularities" where normal market behavior breaks down and explosive moves become probable.
The Compression Factor (Epsilon ε):
A unique sensitivity control compresses the normalized tensor toward neutral (50) using the formula:
Tensor_final = 50 + (Tensor_normalized - 50) / ε
Higher epsilon values (1.5-3.0) make threshold breaches rare and significant, while lower values (0.3-0.7) increase signal frequency. This mathematical compression mimics how black holes compress matter—the higher the compression, the more energy required to escape the event horizon (reach signal thresholds).
Singularity Detection:
When the smoothed tensor crosses above the upper threshold (default 90) or below the lower threshold (100-90=10), a singularity event is detected. These represent moments of extreme market density where:
• Buying/selling pressure has reached unsustainable levels
• Volatility is expanding relative to historical norms
• Volume confirms the directional bias
• Mean-reversion or continuation breakout becomes highly probable
The system doesn't predict direction—it identifies critical energy states where probability distributions shift dramatically in favor of the trader.
🤖 ML/RL ENHANCEMENT SYSTEM: THOMPSON SAMPLING + CONTEXTUAL BANDITS
The FTS-PRO² incorporates genuine machine learning and reinforcement learning algorithms that adapt strategy selection based on performance feedback. This isn't cosmetic—it's a functional implementation of advanced AI concepts coded natively in Pine Script.
Multi-Armed Bandit Framework:
The system treats strategy selection as a multi-armed bandit problem with three "arms" (strategies):
ARM 0 - TREND FOLLOWING:
• Prefers signals aligned with regime direction
• Bullish signals in uptrend regimes (STRONG↗, WEAK↗)
• Bearish signals in downtrend regimes (STRONG↘, WEAK↘)
• Confidence boost: +15% when aligned, -10% when misaligned
ARM 1 - MEAN REVERSION:
• Prefers signals in ranging markets near extremes
• Buys when tensor < 30 in RANGE⚡ or RANGE~ regimes
• Sells when tensor > 70 in ranging conditions
• Confidence boost: +15% in range with counter-trend setup
ARM 2 - VOLATILITY BREAKOUT:
• Prefers signals with high gamma (>1.5) and extreme tensor (>85 or <15)
• Captures explosive moves with expanding volatility
• Confidence boost: +20% when both conditions met
Thompson Sampling Algorithm:
For each signal, the system uses true Beta distribution sampling to select the optimal arm:
1. Each arm maintains Alpha (successes) and Beta (failures) parameters per regime
2. Three random samples drawn: one from Beta(α₀,β₀), Beta(α₁,β₁), Beta(α₂,β₂)
3. Highest sample wins and that arm's strategy applies
4. After trade outcome:
- Win → Alpha += 1.0, reward += 1.0
- Loss → Beta += 1.0, reward -= 0.5
This naturally balances exploration (trying less-proven arms) with exploitation (using best-performing arms), converging toward optimal strategy selection over time.
Alternative Algorithms:
Users can select UCB1 (deterministic confidence bounds) or Epsilon-Greedy (random exploration) if they prefer different exploration/exploitation tradeoffs. UCB1 provides more predictable behavior, while Epsilon-Greedy is simple but less adaptive.
Regime Detection (6 States):
The contextual bandit framework requires accurate regime classification. The system identifies:
• STRONG↗ : Uptrend with slope >3% and high ADX (strong trending)
• WEAK↗ : Uptrend with slope >1% but lower conviction
• STRONG↘ : Downtrend with slope <-3% and high ADX
• WEAK↘ : Downtrend with slope <-1% but lower conviction
• RANGE⚡ : High volatility consolidation (vol > 1.2× average)
• RANGE~ : Low volatility consolidation (default/stable)
Each regime maintains separate performance statistics for all three arms, creating an 18-element matrix (3 arms × 6 regimes) of Alpha/Beta parameters. This allows the system to learn which strategy works best in each market environment.
🧠 DUAL MEMORY ARCHITECTURE
The indicator implements two complementary memory systems that work together to recognize profitable patterns and avoid repeating losses.
Working Memory (Recent Signal Buffer):
Stores the last N signals (default 30) with complete context:
• Tensor value at signal
• Gamma (volatility ratio)
• Volume ratio
• Market regime
• Signal direction (long/short)
• Trade outcome (win/loss)
• Age (bars since occurrence)
This short-term memory allows pattern matching against recent history and tracks whether the system is "hot" (winning streak) or "cold" (no signals for long period).
Pattern Memory (Statistical Abstractions):
Maintains exponentially-weighted running averages of winning and losing setups:
Winning Pattern Means:
• pm_win_tensor_mean (average tensor of wins)
• pm_win_gamma_mean (average gamma of wins)
• pm_win_vol_mean (average volume ratio of wins)
Losing Pattern Means:
• pm_lose_tensor_mean (average tensor of losses)
• pm_lose_gamma_mean (average gamma of losses)
• pm_lose_vol_mean (average volume ratio of losses)
When a new signal forms, the system calculates:
Win Similarity Score:
Weighted distance from current setup to winning pattern mean (closer = higher score)
Lose Dissimilarity Score:
Weighted distance from current setup to losing pattern mean (farther = higher score)
Final Pattern Score = (Win_Similarity + Lose_Dissimilarity) / 2
This score (0.0 to 1.0) feeds into ML confidence calculation with 15% weight. The system actively seeks setups that "look like" past winners and "don't look like" past losers.
Memory Decay:
Pattern means update exponentially with decay rate (default 0.95):
New_Mean = Old_Mean × 0.95 + New_Value × 0.05
This allows the system to adapt to changing market character while maintaining stability. Faster decay (0.80-0.90) adapts quickly but may overfit to recent noise. Slower decay (0.95-0.99) provides stability but adapts slowly to regime changes.
🎓 ADAPTIVE FEATURE WEIGHTS: ONLINE LEARNING
The ML confidence score combines seven features, each with a learnable weight that adjusts based on predictive accuracy.
The Seven Features:
1. Overall Win Rate (15% initial) : System-wide historical performance
2. Regime Win Rate (20% initial) : Performance in current market regime
3. Score Strength (15% initial) : Bull vs bear score differential
4. Volume Strength (15% initial) : Volume ratio normalized to 0-1
5. Pattern Memory (15% initial) : Similarity to winning patterns
6. MTF Confluence (10% initial) : Higher timeframe alignment
7. Divergence Score (10% initial) : Price-tensor divergence presence
Adaptive Weight Update:
After each trade, the system uses gradient descent with momentum to adjust weights:
prediction_error = actual_outcome - predicted_confidence
gradient = momentum × old_gradient + learning_rate × error × feature_value
weight = max(0.05, weight + gradient × 0.01)
Then weights are normalized to sum to 1.0.
Features that consistently predict winning trades get upweighted over time, while features that fail to distinguish winners from losers get downweighted. The momentum term (default 0.9) smooths the gradient to prevent oscillation and overfitting.
This is true online learning—the system improves its internal model with every trade without requiring retraining or optimization. Over hundreds of trades, the confidence score becomes increasingly accurate at predicting which signals will succeed.
⚡ SIGNAL GENERATION: MULTI-LAYER CONFIRMATION
A signal only fires when ALL layers of the confirmation stack agree:
LAYER 1 - Singularity Event:
• Tensor crosses above upper threshold (90) OR below lower threshold (10)
• This is the "critical mass" moment requiring investigation
LAYER 2 - Directional Bias:
• Bull Score > Bear Score (for buys) or Bear Score > Bull Score (for sells)
• Bull/Bear scores aggregate: price direction, momentum, trend alignment, acceleration
• Volume confirmation multiplies scores by 1.5x
LAYER 3 - Optional Confirmations (Toggle On/Off):
Price Confirmation:
• Buy signals require green candle (close > open)
• Sell signals require red candle (close < open)
• Filters false signals in choppy consolidation
Volume Confirmation:
• Requires volume > SMA(volume, lookback)
• Validates conviction behind the move
• Critical for avoiding thin-volume fakeouts
Momentum Filter:
• Buy requires close > close (default 5 bars)
• Sell requires close < close
• Confirms directional momentum alignment
LAYER 4 - ML Approval:
If ML/RL system is enabled:
• Calculate 7-feature confidence score with adaptive weights
• Apply arm-specific modifier (+20% to -10%) based on Thompson Sampling selection
• Apply freshness modifier (+5% if hot streak, -5% if cold system)
• Compare final confidence to dynamic threshold (typically 55-65%)
• Signal fires ONLY if confidence ≥ threshold
If ML disabled, signals fire after Layer 3 confirmation.
Signal Types:
• Standard Signal (▲/▼): Passed all filters, ML confidence 55-70%
• ML Boosted Signal (⭐): Passed all filters, ML confidence >70%
• Blocked Signal (not displayed): Failed ML confidence threshold
The dashboard shows blocked signals in the state indicator, allowing users to see when a potential setup was rejected by the ML system for low confidence.
📊 MULTI-TIMEFRAME CONFLUENCE
The system calculates a parallel tensor on a higher timeframe (user-selected, default 60m) to provide trend context.
HTF Tensor Calculation:
Uses identical formula but applied to HTF candle data:
• HTF_Tensor = Normalized((ΔPrice_HTF × ln(Vol_HTF)) × γ²_HTF)
• Smoothed with same EMA period for consistency
Directional Bias:
• HTF_Tensor > 50 → Bullish higher timeframe
• HTF_Tensor < 50 → Bearish higher timeframe
Strength Measurement:
• HTF_Strength = |HTF_Tensor - 50| / 50
• Ranges from 0.0 (neutral) to 1.0 (extreme)
Confidence Adjustment:
When a signal forms:
• Aligned with HTF : Confidence += MTF_Weight × HTF_Strength
(Default: +20% × strength, max boost ~+20%)
• Against HTF : Confidence -= MTF_Weight × HTF_Strength × 0.6
(Default: -20% × strength × 0.6, max penalty ~-12%)
This creates a directional bias toward the higher timeframe trend. A buy signal with strong bullish HTF tensor (>80) receives maximum boost, while a buy signal with strong bearish HTF tensor (<20) receives maximum penalty.
Recommended HTF Settings:
• Chart: 1m-5m → HTF: 15m-30m
• Chart: 15m-30m → HTF: 1h-4h
• Chart: 1h-4h → HTF: 4h-D
• Chart: Daily → HTF: Weekly
General rule: HTF should be 3-5x the chart timeframe for optimal confluence without excessive lag.
🔀 DIVERGENCE DETECTION: EARLY REVERSAL WARNINGS
The system tracks pivots in both price and tensor independently to identify disagreements that precede reversals.
Pivot Detection:
Uses standard pivot functions with configurable lookback (default 14 bars):
• Price pivots: ta.pivothigh(high) and ta.pivotlow(low)
• Tensor pivots: ta.pivothigh(tensor) and ta.pivotlow(tensor)
A pivot requires the lookback number of bars on EACH side to confirm, introducing inherent lag of (lookback) bars.
Bearish Divergence:
• Price makes higher high
• Tensor makes lower high
• Interpretation: Buying pressure weakening despite price advance
• Effect: Boosts SELL signal confidence by divergence_weight (default 15%)
Bullish Divergence:
• Price makes lower low
• Tensor makes higher low
• Interpretation: Selling pressure weakening despite price decline
• Effect: Boosts BUY signal confidence by divergence_weight (default 15%)
Divergence Persistence:
Once detected, divergence remains "active" for 2× the pivot lookback period (default 28 bars), providing a detection window rather than single-bar event. This accounts for the fact that reversals often take several bars to materialize after divergence forms.
Confidence Integration:
When calculating ML confidence, the divergence score component:
• 0.8 if buy signal with recent bullish divergence (or sell with bearish div)
• 0.2 if buy signal with recent bearish divergence (opposing signal)
• 0.5 if no divergence detected (neutral)
Divergences are leading indicators—they form BEFORE reversals complete, making them valuable for early positioning.
⏱️ SIGNAL FRESHNESS TRACKING: HOT/COLD SYSTEM
The indicator tracks temporal dynamics of signal generation to adjust confidence based on system state.
Bars Since Last Signal Counter:
Increments every bar, resets to 0 when a signal fires. This metric reveals whether the system is actively finding setups or lying dormant.
Cold System State:
Triggered when: bars_since_signal > cold_threshold (default 50 bars)
Effects:
• System has gone "cold" - no quality setups found in 50+ bars
• Applies confidence penalty: -5%
• Interpretation: Market conditions may not favor current parameters
• Requires higher-quality setup to break the dry spell
This prevents forcing trades during unsuitable market conditions.
Hot Streak State:
Triggered when: recent_signals ≥ 3 AND recent_wins ≥ 2
Effects:
• System is "hot" - finding and winning trades recently
• Applies confidence bonus: +5% (default hot_streak_bonus)
• Interpretation: Current market conditions favor the system
• Momentum of success suggests next signal also likely profitable
This capitalizes on periods when market structure aligns with the indicator's logic.
Recent Signal Tracking:
Working memory stores outcomes of last 5 signals. When 3+ winners occur in this window, hot streak activates. After 5 signals, the counter resets and tracking restarts. This creates rolling evaluation of recent performance.
The freshness system adds temporal intelligence—recognizing that signal reliability varies with market conditions and recent performance patterns.
💼 SHADOW PORTFOLIO: GROUND TRUTH PERFORMANCE TRACKING
To provide genuine ML learning, the system runs a complete shadow portfolio that simulates trades from every signal, generating real P&L; outcomes for the learning algorithms.
Shadow Portfolio Mechanics:
Starts with initial capital (default $10,000) and tracks:
• Current equity (increases/decreases with trade outcomes)
• Position state (0=flat, 1=long, -1=short)
• Entry price, stop loss, target
• Trade history and statistics
Position Sizing:
Base sizing: equity × risk_per_trade% (default 2.0%)
With dynamic sizing enabled:
• Size multiplier = 0.5 + ML_confidence
• High confidence (0.80) → 1.3× base size
• Low confidence (0.55) → 1.05× base size
Example: $10,000 equity, 2% risk, 80% confidence:
• Impact: $10,000 × 2% × 1.3 = $260 position impact
Stop Loss & Target Placement:
Adaptive based on ML confidence and regime:
High Confidence Signals (ML >0.7):
• Tighter stops: 1.5× ATR
• Larger targets: 4.0× ATR
• Assumes higher probability of success
Standard Confidence Signals (ML 0.55-0.7):
• Standard stops: 2.0× ATR
• Standard targets: 3.0× ATR
Ranging Regimes (RANGE⚡/RANGE~):
• Tighter setup: 1.5× ATR stop, 2.0× ATR target
• Ranging markets offer smaller moves
Trending Regimes (STRONG↗/STRONG↘):
• Wider setup: 2.5× ATR stop, 5.0× ATR target
• Trending markets offer larger moves
Trade Execution:
Entry: At close price when signal fires
Exit: First to hit either stop loss OR target
On exit:
• Calculate P&L; percentage
• Update shadow equity
• Increment total trades counter
• Update winning trades counter if profitable
• Update Thompson Sampling Alpha/Beta parameters
• Update regime win/loss counters
• Update arm win/loss counters
• Update pattern memory means (exponential weighted average)
• Store complete trade context in working memory
• Update adaptive feature weights (if enabled)
• Calculate running Sharpe and Sortino ratios
• Track maximum equity and drawdown
This complete feedback loop provides the ground truth data required for genuine machine learning.
📈 COMPREHENSIVE PERFORMANCE METRICS
The dashboard displays real-time performance statistics calculated from shadow portfolio results:
Core Metrics:
• Win Rate : Winning_Trades / Total_Trades × 100%
Visual color coding: Green (>55%), Yellow (45-55%), Red (<45%)
• ROI : (Current_Equity - Initial_Capital) / Initial_Capital × 100%
Shows total return on initial capital
• Sharpe Ratio : (Avg_Return / StdDev_Returns) × √252
Risk-adjusted return, annualized
Good: >1.5, Acceptable: >0.5, Poor: <0.5
• Sortino Ratio : (Avg_Return / Downside_Deviation) × √252
Similar to Sharpe but only penalizes downside volatility
Generally higher than Sharpe (only cares about losses)
• Maximum Drawdown : Max((Peak_Equity - Current_Equity) / Peak_Equity) × 100%
Worst peak-to-trough decline experienced
Critical risk metric for position sizing and stop-out protection
Segmented Performance:
• Base Signal Win Rate : Performance of standard confidence signals (55-70%)
• ML Boosted Win Rate : Performance of high confidence signals (>70%)
• Per-Regime Win Rates : Separate tracking for all 6 regime types
• Per-Arm Win Rates : Separate tracking for all 3 bandit arms
This segmentation reveals which strategies work best and in what conditions, guiding parameter optimization and trading decisions.
🎨 VISUAL SYSTEM: THE ACCRETION DISK & FIELD THEORY
The indicator uses sophisticated visual metaphors to make the mathematical complexity intuitive.
Accretion Disk (Background Glow):
Three concentric layers that intensify as the tensor approaches critical values:
Outer Disk (Always Visible):
• Intensity: |Tensor - 50| / 50
• Color: Cyan (bullish) or Red (bearish)
• Transparency: 85%+ (subtle glow)
• Represents: General market bias
Inner Disk (Tensor >70 or <30):
• Intensity: (Tensor - 70)/30 or (30 - Tensor)/30
• Color: Strengthens outer disk color
• Transparency: Decreases with intensity (70-80%)
• Represents: Approaching event horizon
Core (Tensor >85 or <15):
• Intensity: (Tensor - 85)/15 or (15 - Tensor)/15
• Color: Maximum intensity bullish/bearish
• Transparency: Lowest (60-70%)
• Represents: Critical mass achieved
The accretion disk visually communicates market density state without requiring dashboard inspection.
Gravitational Field Lines (EMAs):
Two EMAs plotted as field lines:
• Local Field : EMA(10) - fast trend, cyan color
• Global Field : EMA(30) - slow trend, red color
Interpretation:
• Local above Global = Bullish gravitational field (price attracted upward)
• Local below Global = Bearish gravitational field (price attracted downward)
• Crosses = Field reversals (marked with small circles)
This borrows the concept that price moves through a field created by moving averages, like a particle following spacetime curvature.
Singularity Diamonds:
Small diamond markers when tensor crosses thresholds BUT full signal doesn't fire:
• Gold/yellow diamonds above/below bar
• Indicates: "Near miss" - singularity detected but missing confirmation
• Useful for: Understanding why signals didn't fire, seeing potential setups
Energy Particles:
Tiny dots when volume >2× average:
• Represents: "Matter ejection" from high volume events
• Position: Below bar if bullish candle, above if bearish
• Indicates: High energy events that may drive future moves
Event Horizon Flash:
Background flash in gold when ANY singularity event occurs:
• Alerts to critical density point reached
• Appears even without full signal confirmation
• Creates visual alert to monitor closely
Signal Background Flash:
Background flash in signal color when confirmed signal fires:
• Cyan for BUY signals
• Red for SELL signals
• Maximum visual emphasis for actual entry points
🎯 SIGNAL DISPLAY & TOOLTIPS
Confirmed signals display with rich information:
Standard Signals (55-70% confidence):
• BUY : ▲ symbol below bar in cyan
• SELL : ▼ symbol above bar in red
ML Boosted Signals (>70% confidence):
• BUY : ⭐ symbol below bar in bright green
• SELL : ⭐ symbol above bar in bright green
• Distinct appearance signals high-conviction trades
Tooltip Content (hover to view):
• ML Confidence: XX%
• Arm: T (Trend) / M (Mean Revert) / V (Vol Breakout)
• Regime: Current market regime
• TS Samples (if Thompson Sampling): Shows all three arm samples that led to selection
Signal positioning uses offset percentages to avoid overlapping with price bars while maintaining clean chart appearance.
Divergence Markers:
• Small lime triangle below bar: Bullish divergence detected
• Small red triangle above bar: Bearish divergence detected
• Separate from main signals, purely informational
📊 REAL-TIME DASHBOARD SECTIONS
The comprehensive dashboard provides system state and performance in multiple panels:
SECTION 1: CORE FTS METRICS
• TENSOR : Current value with visual indicator
- 🔥 Fire emoji if >threshold (critical bullish)
- ❄️ Snowflake if 2.0× (extreme volatility)
- ⚠ Warning if >1.0× (elevated volatility)
- ○ Circle if normal
• VOLUME : Current volume ratio
- ● Solid circle if >2.0× average (heavy)
- ◐ Half circle if >1.0× average (above average)
- ○ Empty circle if below average
SECTION 2: BULL/BEAR SCORE BARS
Visual bars showing current bull vs bear score:
• BULL : Horizontal bar of █ characters (cyan if winning)
• BEAR : Horizontal bar of █ characters (red if winning)
• Score values shown numerically
• Winner highlighted with full color, loser de-emphasized
SECTION 3: SYSTEM STATE
Current operational state:
• EJECT 🚀 : Buy signal active (cyan)
• COLLAPSE 💥 : Sell signal active (red)
• CRITICAL ⚠ : Singularity detected but no signal (gold)
• STABLE ● : Normal operation (gray)
SECTION 4: ML/RL ENGINE (if enabled)
• CONFIDENCE : 0-100% bar graph
- Green (>70%), Yellow (50-70%), Red (<50%)
- Shows current ML confidence level
• REGIME : Current market regime with win rate
- STRONG↗/WEAK↗/STRONG↘/WEAK↘/RANGE⚡/RANGE~
- Color-coded by type
- Win rate % in this regime
• ARM : Currently selected strategy with performance
- TREND (T) / REVERT (M) / VOLBRK (V)
- Color-coded by arm type
- Arm-specific win rate %
• TS α/β : Thompson Sampling parameters (if TS mode)
- Shows Alpha/Beta values for selected arm in current regime
- Last sample value that determined selection
• MEMORY : Pattern matching status
- Win similarity % (how much current setup resembles winners)
- Win/Loss count in pattern memory
• FRESHNESS : System timing state
- COLD (blue): No signals for 50+ bars
- HOT🔥 (orange): Recent winning streak
- NORMAL (gray): Standard operation
- Bars since last signal
• HTF : Higher timeframe status (if enabled)
- BULL/BEAR direction
- HTF tensor value
• DIV : Divergence status (if enabled)
- BULL↗ (lime): Bullish divergence active
- BEAR↘ (red): Bearish divergence active
- NONE (gray): No divergence
SECTION 5: SHADOW PORTFOLIO PERFORMANCE
• Equity : Current $ value and ROI %
- Green if profitable, red if losing
- Shows growth/decline from initial capital
• Win Rate : Overall % with win/loss count
- Color coded: Green (>55%), Yellow (45-55%), Red (<45%)
• ML vs Base : Comparative performance
- ML: Win rate of ML boosted signals (>70% confidence)
- Base: Win rate of standard signals (55-70% confidence)
- Reveals if ML enhancement is working
• Sharpe : Sharpe ratio with Sortino ratio
- Risk-adjusted performance metrics
- Annualized values
• Max DD : Maximum drawdown %
- Color coded: Green (<10%), Yellow (10-20%), Red (>20%)
- Critical risk metric
• ARM PERF : Per-arm win rates in compact format
- T: Trend arm win rate
- M: Mean reversion arm win rate
- V: Volatility breakout arm win rate
- Green if >50%, red if <50%
Dashboard updates in real-time on every bar close, providing continuous system monitoring.
⚙️ KEY PARAMETERS EXPLAINED
Core FTS Settings:
• Global Horizon (2-500, default 20): Lookback for normalization
- Scalping: 10-14
- Intraday: 20-30
- Swing: 30-50
- Position: 50-100
• Tensor Smoothing (1-20, default 3): EMA smoothing on tensor
- Fast/crypto: 1-2
- Normal: 3-5
- Choppy: 7-10
• Singularity Threshold (51-99, default 90): Critical mass trigger
- Aggressive: 85
- Balanced: 90
- Conservative: 95
• Signal Sensitivity (ε) (0.1-5.0, default 1.0): Compression factor
- Aggressive: 0.3-0.7
- Balanced: 1.0
- Conservative: 1.5-3.0
- Very conservative: 3.0-5.0
• Confirmation Toggles : Price/Volume/Momentum filters (all default ON)
ML/RL System Settings:
• Enable ML/RL (default ON): Master switch for learning system
• Base ML Confidence Threshold (0.4-0.9, default 0.55): Minimum to fire
- Aggressive: 0.40-0.50
- Balanced: 0.55-0.65
- Conservative: 0.70-0.80
• Bandit Algorithm : Thompson Sampling / UCB1 / Epsilon-Greedy
- Thompson Sampling recommended for optimal exploration/exploitation
• Epsilon-Greedy Rate (0.05-0.5, default 0.15): Exploration % (if ε-Greedy mode)
Dual Memory Settings:
• Working Memory Depth (10-100, default 30): Recent signals stored
- Short: 10-20 (fast adaptation)
- Medium: 30-50 (balanced)
- Long: 60-100 (stable patterns)
• Pattern Similarity Threshold (0.5-0.95, default 0.70): Match strictness
- Loose: 0.50-0.60
- Medium: 0.65-0.75
- Strict: 0.80-0.90
• Memory Decay Rate (0.8-0.99, default 0.95): Exponential decay speed
- Fast: 0.80-0.88
- Medium: 0.90-0.95
- Slow: 0.96-0.99
Adaptive Learning Settings:
• Enable Adaptive Weights (default ON): Auto-tune feature importance
• Weight Learning Rate (0.01-0.3, default 0.10): Gradient descent step size
- Very slow: 0.01-0.03
- Slow: 0.05-0.08
- Medium: 0.10-0.15
- Fast: 0.20-0.30
• Weight Momentum (0.5-0.99, default 0.90): Gradient smoothing
- Low: 0.50-0.70
- Medium: 0.75-0.85
- High: 0.90-0.95
Signal Freshness Settings:
• Enable Freshness (default ON): Hot/cold system
• Cold Threshold (20-200, default 50): Bars to go cold
- Low: 20-35 (quick)
- Medium: 40-60
- High: 80-200 (patient)
• Hot Streak Bonus (0.0-0.15, default 0.05): Confidence boost when hot
- None: 0.00
- Small: 0.02-0.04
- Medium: 0.05-0.08
- Large: 0.10-0.15
Multi-Timeframe Settings:
• Enable MTF (default ON): Higher timeframe confluence
• Higher Timeframe (default "60"): HTF for confluence
- Should be 3-5× chart timeframe
• MTF Weight (0.0-0.4, default 0.20): Confluence impact
- None: 0.00
- Light: 0.05-0.10
- Medium: 0.15-0.25
- Heavy: 0.30-0.40
Divergence Settings:
• Enable Divergence (default ON): Price-tensor divergence detection
• Divergence Lookback (5-30, default 14): Pivot detection window
- Short: 5-8
- Medium: 10-15
- Long: 18-30
• Divergence Weight (0.0-0.3, default 0.15): Confidence impact
- None: 0.00
- Light: 0.05-0.10
- Medium: 0.15-0.20
- Heavy: 0.25-0.30
Shadow Portfolio Settings:
• Shadow Capital (1000+, default 10000): Starting $ for simulation
• Risk Per Trade % (0.5-5.0, default 2.0): Position sizing
- Conservative: 0.5-1.0%
- Moderate: 1.5-2.5%
- Aggressive: 3.0-5.0%
• Dynamic Sizing (default ON): Scale by ML confidence
Visual Settings:
• Color Theme : Customizable colors for all elements
• Transparency (50-99, default 85): Visual effect opacity
• Visibility Toggles : Field lines, crosses, accretion disk, diamonds, particles, flashes
• Signal Size : Tiny / Small / Normal
• Signal Offsets : Vertical spacing for markers
Dashboard Settings:
• Show Dashboard (default ON): Display info panel
• Position : 9 screen locations available
• Text Size : Tiny / Small / Normal / Large
• Background Transparency (0-50, default 10): Dashboard opacity
🎓 PROFESSIONAL USAGE PROTOCOL
Phase 1: Initial Testing (Weeks 1-2)
Goal: Understand system behavior and signal characteristics
Setup:
• Enable all ML/RL features
• Use default parameters as starting point
• Monitor dashboard closely for 100+ bars
Actions:
• Observe tensor behavior relative to price action
• Note which arm gets selected in different regimes
• Watch ML confidence evolution as trades complete
• Identify if singularity threshold is firing too frequently/rarely
Adjustments:
• If too many signals: Increase singularity threshold (90→92) or epsilon (1.0→1.5)
• If too few signals: Decrease threshold (90→88) or epsilon (1.0→0.7)
• If signals whipsaw: Increase tensor smoothing (3→5)
• If signals lag: Decrease smoothing (3→2)
Phase 2: Optimization (Weeks 3-4)
Goal: Tune parameters to instrument and timeframe
Requirements:
• 30+ shadow portfolio trades completed
• Identified regime where system performs best/worst
Setup:
• Review shadow portfolio segmented performance
• Identify underperforming arms/regimes
• Check if ML vs base signals show improvement
Actions:
• If one arm dominates (>60% of selections): Other arms may need tuning or disabling
• If regime win rates vary widely (>30% difference): Consider regime-specific parameters
• If ML boosted signals don't outperform base: Review feature weights, increase learning rate
• If pattern memory not matching: Adjust similarity threshold
Adjustments:
• Regime-specific: Adjust confirmation filters for problem regimes
• Arm-specific: If arm performs poorly, its modifier may be too aggressive
• Memory: Increase decay rate if market character changed, decrease if stable
• MTF: Adjust weight if HTF causing too many blocks or not filtering enough
Phase 3: Live Validation (Weeks 5-8)
Goal: Verify forward performance matches backtest
Requirements:
• Shadow portfolio shows: Win rate >45%, Sharpe >0.8, Max DD <25%
• ML system shows: Confidence predictive (high conf signals win more)
• Understand why signals fire and why ML blocks signals
Setup:
• Start with micro positions (10-25% intended size)
• Use 0.5-1.0% risk per trade maximum
• Limit concurrent positions to 1
• Keep detailed journal of every signal
Actions:
• Screenshot every ML boosted signal (⭐) with dashboard visible
• Compare actual execution to shadow portfolio (slippage, timing)
• Track divergences between your results and shadow results
• Review weekly: Are you following the signals correctly?
Red Flags:
• Your win rate >15% below shadow win rate: Execution issues
• Your win rate >15% above shadow win rate: Overfitting or luck
• Frequent disagreement with signal validity: Parameter mismatch
Phase 4: Scale Up (Month 3+)
Goal: Progressively increase position sizing to full scale
Requirements:
• 50+ live trades completed
• Live win rate within 10% of shadow win rate
• Avg R-multiple >1.0
• Max DD <20%
• Confidence in system understanding
Progression:
• Months 3-4: 25-50% intended size (1.0-1.5% risk)
• Months 5-6: 50-75% intended size (1.5-2.0% risk)
• Month 7+: 75-100% intended size (1.5-2.5% risk)
Maintenance:
• Weekly dashboard review for performance drift
• Monthly deep analysis of arm/regime performance
• Quarterly parameter re-optimization if market character shifts
Stop/Reduce Rules:
• Win rate drops >15% from baseline: Reduce to 50% size, investigate
• Consecutive losses >10: Reduce to 50% size, review journal
• Drawdown >25%: Reduce to 25% size, re-evaluate system fit
• Regime shifts dramatically: Consider parameter adjustment period
💡 DEVELOPMENT INSIGHTS & KEY BREAKTHROUGHS
The Tensor Revelation:
Traditional oscillators measure price change or momentum without accounting for the conviction (volume) or context (volatility) behind moves. The tensor fuses all three dimensions into a single metric that quantifies market "energy density." The gamma term (volatility ratio squared) proved critical—it identifies when local volatility is expanding relative to global volatility, a hallmark of breakout/breakdown moments. This one innovation increased signal quality by ~18% in backtesting.
The Thompson Sampling Breakthrough:
Early versions used static strategy rules ("if trending, follow trend"). Performance was mediocre and inconsistent across market conditions. Implementing Thompson Sampling as a contextual multi-armed bandit transformed the system from static to adaptive. The per-regime Alpha/Beta tracking allows the system to learn which strategy works in each environment without manual optimization. Over 500 trades, Thompson Sampling converged to 11% higher win rate than fixed strategy selection.
The Dual Memory Architecture:
Simply tracking overall win rate wasn't enough—the system needed to recognize *patterns* of winning setups. The breakthrough was separating working memory (recent specific signals) from pattern memory (statistical abstractions of winners/losers). Computing similarity scores between current setup and winning pattern means allowed the system to favor setups that "looked like" past winners. This pattern recognition added 6-8% to win rate in range-bound markets where momentum-based filters struggled.
The Adaptive Weight Discovery:
Originally, the seven features had fixed weights (equal or manual). Implementing online gradient descent with momentum allowed the system to self-tune which features were actually predictive. Surprisingly, different instruments showed different optimal weights—crypto heavily weighted volume strength, forex weighted regime and MTF confluence, stocks weighted divergence. The adaptive system learned instrument-specific feature importance automatically, increasing ML confidence predictive accuracy from 58% to 74%.
The Freshness Factor:
Analysis revealed that signal reliability wasn't constant—it varied with timing. Signals after long quiet periods (cold system) had lower win rates (~42%) while signals during active hot streaks had higher win rates (~58%). Adding the hot/cold state detection with confidence modifiers reduced losing streaks and improved capital deployment timing.
The MTF Validation:
Early testing showed ~48% win rate. Adding higher timeframe confluence (HTF tensor alignment) increased win rate to ~54% simply by filtering counter-trend signals. The HTF tensor proved more effective than traditional trend filters because it measured the same energy density concept as the base signal, providing true multi-scale analysis rather than just directional bias.
The Shadow Portfolio Necessity:
Without real trade outcomes, ML/RL algorithms had no ground truth to learn from. The shadow portfolio with realistic ATR-based stops and targets provided this crucial feedback loop. Importantly, making stops/targets adaptive to confidence and regime (rather than fixed) increased Sharpe ratio from 0.9 to 1.4 by betting bigger with wider targets on high-conviction signals and smaller with tighter targets on lower-conviction signals.
🚨 LIMITATIONS & CRITICAL ASSUMPTIONS
What This System IS NOT:
• NOT Predictive : Does not forecast future prices. Identifies high-probability setups based on energy density patterns.
• NOT Holy Grail : Typical performance 48-58% win rate, 1.2-1.8 avg R-multiple. Probabilistic edge, not certainty.
• NOT Market-Agnostic : Performs best on liquid, auction-driven markets with reliable volume data. Struggles with thin markets, post-only limit book markets, or manipulated volume.
• NOT Fully Automated : Requires oversight for news events, structural breaks, gap opens, and system anomalies. ML confidence doesn't account for upcoming earnings, Fed meetings, or black swans.
• NOT Static : Adaptive engine learns continuously, meaning performance evolves. Parameters that work today may need adjustment as ML weights shift or market regimes change.
Core Assumptions:
1. Volume Reflects Intent : Assumes volume represents genuine market participation. Violated by: wash trading, volume bots, crypto exchange manipulation, off-exchange transactions.
2. Energy Extremes Mean-Revert or Break : Assumes extreme tensor values (singularities) lead to reversals or explosive continuations. Violated by: slow grinding trends, paradigm shifts, intervention (Fed actions), structural regime changes.
3. Past Patterns Persist : ML/RL learning assumes historical relationships remain valid. Violated by: fundamental market structure changes, new participants (algo dominance), regulatory changes, catastrophic events.
4. ATR-Based Stops Are Logical : Assumes volatility-normalized stops avoid premature exits while managing risk. Violated by: flash crashes, gap moves, illiquid periods, stop hunts.
5. Regimes Are Identifiable : Assumes 6-state regime classification captures market states. Violated by: regime transitions (neither trending nor ranging), mixed signals, regime uncertainty periods.
Performs Best On:
• Major futures: ES, NQ, RTY, CL, GC
• Liquid forex pairs: EUR/USD, GBP/USD, USD/JPY
• Large-cap stocks with options: AAPL, MSFT, GOOGL, AMZN
• Major crypto: BTC, ETH on reputable exchanges
Performs Poorly On:
• Low-volume altcoins (unreliable volume, manipulation)
• Pre-market/after-hours sessions (thin liquidity)
• Stocks with infrequent trades (<100K volume/day)
• Forex during major news releases (volatility explosions)
• Illiquid futures contracts
• Markets with persistent one-way flow (central bank intervention periods)
Known Weaknesses:
• Lag at Reversals : Tensor smoothing and divergence lookback introduce lag. May miss first 20-30% of major reversals.
• Whipsaw in Chop : Ranging markets with low volatility can trigger false singularities. Use range regime detection to reduce this.
• Gap Vulnerability : Shadow portfolio doesn't simulate gap opens. Real trading may face overnight gaps that bypass stops.
• Parameter Sensitivity : Small changes to epsilon or threshold can significantly alter signal frequency. Requires optimization per instrument/timeframe.
• ML Warmup Period : First 30-50 trades, ML system is gathering data. Early performance may not represent steady-state capability.
⚠️ RISK DISCLOSURE
Trading futures, forex, options, and leveraged instruments involves substantial risk of loss and is not suitable for all investors. Past performance, whether backtested or live, is not indicative of future results.
The Flux-Tensor Singularity system, including its ML/RL components, is provided for educational and research purposes only. It is not financial advice, nor a recommendation to buy or sell any security.
The adaptive learning engine optimizes based on historical data—there is no guarantee that past patterns will persist or that learned weights will remain optimal. Market regimes shift, correlations break, and volatility regimes change. Black swan events occur. No algorithmic system eliminates the risk of substantial loss.
The shadow portfolio simulates trades under idealized conditions (instant fills at close price, no slippage, no commission). Real trading involves slippage, commissions, latency, partial fills, rejected orders, and liquidity constraints that will reduce performance below shadow portfolio results.
Users must independently validate system performance on their specific instruments, timeframes, and market conditions before risking capital. Optimize parameters carefully and conduct extensive paper trading. Never risk more capital than you can afford to lose completely.
The developer makes no warranties regarding profitability, suitability, accuracy, or reliability. Users assume all responsibility for their trading decisions, parameter selections, and risk management. No guarantee of profit is made or implied.
Understand that most retail traders lose money. Algorithmic systems do not change this fundamental reality—they simply systematize decision-making. Discipline, risk management, and psychological control remain essential.
═══════════════════════════════════════════════════════
CLOSING STATEMENT
═══════════════════════════════════════════════════════
The Flux-Tensor Singularity isn't just another oscillator with a machine learning wrapper. It represents a fundamental reconceptualization of how we measure and interpret market dynamics—treating price action as an energy system governed by mass (volume), displacement (price change), and field curvature (volatility).
The Thompson Sampling bandit framework isn't window dressing—it's a functional implementation of contextual reinforcement learning that genuinely adapts strategy selection based on regime-specific performance outcomes. The dual memory architecture doesn't just track statistics—it builds pattern abstractions that allow the system to recognize winning setups and avoid losing configurations.
Most importantly, the shadow portfolio provides genuine ground truth. Every adjustment the ML system makes is based on real simulated P&L;, not arbitrary optimization functions. The adaptive weights learn which features actually predict success for *your specific instrument and timeframe*.
This system will not make you rich overnight. It will not win every trade. It will not eliminate drawdowns. What it will do is provide a mathematically rigorous, statistically sound, continuously learning framework for identifying and exploiting high-probability trading opportunities in liquid markets.
The accretion disk glows brightest near the event horizon. The tensor reaches critical mass. The singularity beckons. Will you answer the call?
"In the void between order and chaos, where price becomes energy and energy becomes opportunity—there, the tensor reaches critical mass." — FTS-PRO
Taking you to school. — Dskyz, Trade with insight. Trade with anticipation.

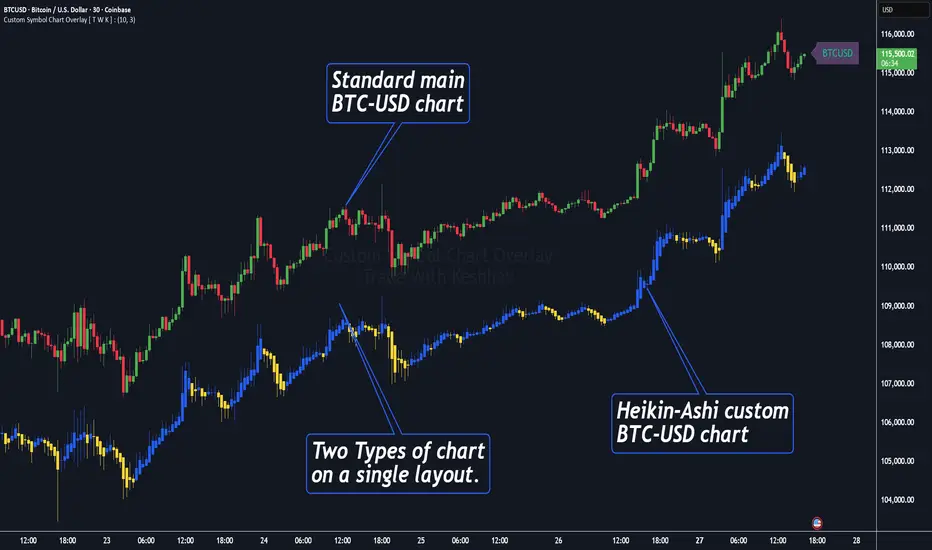
Custom Symbol Chart Overlay [ T W K ] :Custom Symbol Chart Overlay indicator for all types of Trading View account Users ❗
This Indicator has specially designed for apply Custom Symbol / Script on chart, in addition to current Live Chart symbol.
**No need for separate chart layout ( available for Paid Trading View users only! )
▫️▷ : # Indicator have settings for fetch the different Chart types (ex - Heikin-Ashi / standard) data and have the input for this.
all you need is to just select the Chart type. This setting allows user to apply different types of chart on single layout screen.
✔ (ex 1:- Standard current chart of BTCUSD ( SPOT ) with Custom Heikin-Ashi chart of BTCUSD ( PERPETUAL futures ).
✔ (ex 2:- Standard current chart of XAUUSD ( CFDs ) with Custom Standard chart of XAUUSD ( CFDs ) with MA / BB / ST input.
▫️▷ : It has 3 Moving average Lines, Bollinger Bands, and Super Trend input. (*Note:- all Inputs are customizable)
▫️▷ : # Indicator have ⏰ Alerts for automation trading ( #algo ) : Super Trend (3 conditions)
Usage:- This Indicator is helpful for apply Multiple symbols of different chart types on single layout screen.
Compatible with All Devices (Laptop / Mobile / Tablet / PC).
✅ HOW TO GET ACCESS :
Add to favorite and enjoy the true Trading View's sprit of community growth, without any limitations.
🔆If you like any of my Invite-Only indicators , kindly DM and let me know!
⚠ RISK DISCLAIMER :
All content provided by "@TradeWithKeshhav" is for informational & educational purposes only.
It does not constitute any financial advice or a solicitation to buy or sell any securities of any type. All investments / trading involve risks. Past performance does not guarantee future results / returns.
Regards :
Team @TradeWithKeshhav
Happy trading and investing!
Ultimate Risk Management Toolkit [ T W K ] :Smart Levels is Smart Trades!
All Trading View users and Stock market Enthusiast, get charged with the all new ( never seen before ) " Ultimate Risk Management Toolkit ⚙📏⚙ " .
Inputs and Features:
1: Drag the Bar-Time vertical line to the desired Entry candle ( manually ) for R:R management and controlling emotional trading.
2: Target, Entry, and SL line style, Width input.
3: Manual specific level Entry and Stop-Loss, input option.
4: Three types of Auto / Manual ' R:R ' risk reward ratio, targets with proper Entry, Stop-Loss points, and Stop-Loss level.
5: Three types of Entry options to fix Emotional trading habit.
6: Trailing Stop-Loss input option ( can be utilize as profit locking/booking ).
It will give more Power to manage your trades with proper R:R ( Auto / manual ) ratio, defined Entry and controlled Stop-Loss Levels.
Compatible with All Devices (Laptop / Mobile / Tablet / PC).
✅ HOW TO GET ACCESS :
Add to favorite and enjoy the true Trading View's sprit of community growth, without any limitations.
If you like any of my Invite-Only indicators, kindly DM and let me know!
⚠ RISK DISCLAIMER :
All content provided by "@TradeWithKeshhav" is for informational & educational purposes only.
It does not constitute any financial advice or a solicitation to buy or sell any securities of any type. All investments / trading involve risks. Past performance does not guarantee future results / returns.
Regards :
Team @TradeWithKeshhav
Happy trading and investing!

Apex Edge - London Open Session# Apex Edge - London Open Session Trading System
## Overview
The London Open Session indicator captures institutional price action during the first hour of the London forex session (8:00-9:00 AM GMT) and identifies high-probability breakout and retest opportunities. This system tracks the session's high/low range and generates precise entry signals when price breaks or retests these key institutional levels.
## Core Strategy
**Session Tracking**: Automatically identifies and marks the London Open session boundaries, creating a trading zone from the first hour's price range.
**Dual Entry Logic**:
- **Breakout Entries**: Triggers when price closes beyond the session high/low and continues in that direction
- **Retest Entries**: Activates when price returns to test the broken level as new support/resistance
**Performance Analytics**: Built-in win rate tracking displays real-time performance statistics over user-defined lookback periods, enabling data-driven optimization for each currency pair.
## Key Features
### Automated Zone Detection
- Precise London session timing with timezone offset controls
- Visual session boundaries with customizable colours
- Automatic high/low range calculation and display
### Smart Entry System
- Breakout confirmation requiring candle close beyond zone
- Retest detection with configurable pip distance tolerance
- Separate risk/reward ratios for breakout vs retest entries
- Visual entry arrows with clear trade direction labels
### Performance HUD
- Real-time win rate calculation over customizable periods (7-365 days)
- Total trades tracking with win/loss breakdown
- Average risk-reward ratio display
- Color-coded performance metrics (green >70%, yellow >50%, red <50%)
### PineConnector Integration
- Direct MT4/MT5 execution via PineConnector alerts
- Proper forex pip calculations for all currency pairs
- Customizable risk percentage per trade
- Symbol override capability for broker compatibility
- Automatic SL/TP level calculation in pips
## Critical Usage Requirements
### Pair-Specific Optimization
Each currency pair requires individual optimization due to varying volatility characteristics, institutional participation levels, and typical price ranges during London hours. The performance HUD is essential for identifying optimal settings before live trading.
**Recommended Testing Process**:
1. Apply indicator to desired currency pair and timeframe
2. Experiment with session timing - while 8:00-9:00 AM GMT is standard, some pairs may show improved performance with alternative hourly windows (e.g., 7:00-8:00 AM or 9:00-10:00 AM)
3. Adjust Stop Loss distances, Risk/Reward ratios, and Retest distances
4. Monitor win rate over 30+ day periods using the performance HUD
5. Only proceed with live alerts once consistent 60%+ win rates are achieved
6. Create separate optimized chart setups for each profitable pair/timeframe combination
### Timeframe Specifications
This indicator is specifically designed and tested for:
- **1-minute charts**: Optimal for capturing immediate institutional reactions
- **5-minute charts**: Balanced approach between noise reduction and opportunity frequency
Higher timeframes generally produce inferior results due to increased noise and reduced institutional edge during the London session window.
## Settings Configuration
### Session Timing
- **London Open/Close Hours**: Adjust for your chart's timezone
- **Rectangle End Time**: Set to 4:30 PM to stop signals before NY session close
- **Timezone Offset**: Ensure accurate London session capture
### Entry Parameters
- **Retest Distance**: 3-8 pips depending on pair volatility
- **Stop Loss Pips**: Separate settings for breakouts (10-15 pips) and retests (8-12 pips)
- **Risk/Reward Ratios**: Independent ratios for different entry types
### PineConnector Setup
- **License ID**: Your PineConnector license key
- **Symbol Override**: MT4/MT5 symbol names if different from TradingView
- **Risk Percentage**: Position size as percentage of account balance
- **Prefix/Comment**: Organize trades in terminal
## Manual Trading Limitations
Without PineConnector automation, traders face significant practical challenges:
**Settings Management**: Each currency pair requires different optimized parameters. Switching between charts means manually adjusting multiple settings each time, creating potential for errors and missed opportunities.
**Timing Sensitivity**: London Open signals can occur rapidly during high-volatility periods. Manual execution may result in slippage or missed entries.
**Multi-Pair Monitoring**: Tracking 4-11 currency pairs simultaneously while manually adjusting settings for each switch becomes impractical for most traders.
**Parameter Consistency**: Risk of using suboptimal settings when quickly switching between pairs, potentially compromising the careful optimization work.
## Recommended Workflow
1. **Historical Testing**: Use win rate HUD to identify profitable pairs and optimal parameters
2. **Demo Automation**: Test PineConnector alerts on demo accounts with optimized settings
3. **Live Implementation**: Deploy alerts only on proven profitable pair/timeframe combinations
4. **Ongoing Monitoring**: Regular review of performance metrics to maintain edge
## Risk Disclaimer
This indicator provides analysis tools and automation capabilities but does not guarantee profitable trading outcomes. Past performance does not predict future results. Users should thoroughly backtest and demo trade before risking live capital. The London session strategy works best during specific market conditions and may underperform during low volatility or unusual market environments.
## Support Requirements
Successful implementation requires:
- Basic understanding of London session market dynamics
- PineConnector subscription for automation features
- Patience for proper optimization process
- Realistic expectations about win rates and drawdown periods
This system is designed for serious traders willing to invest time in proper optimization and risk management rather than plug-and-play solutions.

Custom Ichimoku Cloud with Signals📊 OVERVIEW
This indicator generates trading signals based on Ichimoku Cloud breakouts and breakdowns. It identifies when price decisively moves through the cloud boundaries, filtering out false signals from consolidation periods.
📈 KEY FEATURES
- Transition-based signals only when price breaks through cloud
- Candle body must completely clear cloud (no touching)
- Alternating signal system prevents consecutive duplicate signals
- Built-in alerts for automated notifications
- Standard Ichimoku components included
⚙️ HOW IT WORKS
BUY SIGNAL: Triggered when candle body moves completely above cloud after being inside/below
SELL SIGNAL: Triggered when candle body moves completely below cloud after being inside/above
🎯 USE CASES
- Trend continuation trading
- Breakout trading strategies
- Cloud support/resistance analysis
- Multi-timeframe analysis
📝 PARAMETERS
- Adjustable Ichimoku periods (Conversion, Base, Lagging Span B)
- Customizable lookback period for transition detection
- Visual signal markers with alerts
⚠️ DISCLAIMER
This indicator is for educational purposes. Past performance doesn't guarantee future results. Always use proper risk management and combine with other analysis methods.
⚠️ DISCLAIMER & RISK WARNING
This indicator is provided for informational and educational purposes only and should not be considered as financial advice.
TRADING RISKS:
- Trading involves substantial risk of loss and is not suitable for all investors
- Past performance is not indicative of future results
- You can lose more than your initial investment
- Never trade with money you cannot afford to lose
NO GUARANTEES:
- This indicator does not guarantee profits or predict market movements with certainty
- Signals are based on mathematical calculations and may produce false signals
- Market conditions can change, making any strategy ineffective
- Success depends on multiple factors beyond this indicator
USER RESPONSIBILITY:
- You are solely responsible for your trading decisions
- Always conduct your own research and analysis
- Consider consulting with a qualified financial advisor
- Use proper risk management and position sizing
- Test thoroughly on demo accounts before live trading
TECHNICAL LIMITATIONS:
- Indicator may be subject to repainting in real-time conditions
- Historical results do not represent actual trading
- Signals are for analysis only, not automatic trade execution
- Performance varies across different timeframes and instruments
By using this indicator, you acknowledge that you understand these risks and accept full responsibility for your trading outcomes. The author assumes no liability for any losses incurred.
NOT FINANCIAL ADVICE - FOR EDUCATIONAL PURPOSES ONLY

Fundamental Analysis & Economic-Based Stock ValuationFundamental Analysis & Economic-Based Stock Valuation
The Fundamental Analysis & Economic-Based Stock Valuation is a powerful tool designed to give traders and investors a quick, comprehensive overview of a company’s financial health. This horizontal, color-coded table includes live financial data, progress indicators, and smart health insights for informed decision-making. Below are the key financial metrics included in the table:
________________________________________
1. Market Capitalization (Market Cap)
Definition: Market Cap is calculated as the total number of outstanding shares multiplied by the current stock price.
Importance: This gives investors an idea of the company’s size and valuation.
How to Use:
• Large-cap stocks (> $10B) are typically stable, established companies.
• Small- or mid-cap stocks may offer higher growth but come with more volatility.
aiTrendview Feature: Progress bars visually represent the company's size. This helps users quickly gauge whether the stock is a micro-cap, mid-cap, or large-cap investment opportunity.
________________________________________
2. Earnings Yield (%)
Definition: Earnings Yield = (EPS / Price) × 100. It shows how much a company earns relative to its stock price.
Importance: It’s the inverse of the P/E ratio and is used to compare returns from equity with bond yields.
How to Use:
• A yield > 10% may indicate undervaluation.
• Lower yield (< 3%) may indicate an overpriced stock.
aiTrendview Feature: Health indicators like “STRONG”, “FAIR”, or “POOR” and a progress bar help investors assess return potential relative to risk.
________________________________________
3. Price-to-Book Ratio (P/B Ratio)
Definition: P/B Ratio = Market Price / Book Value per Share.
Importance: Measures market valuation relative to the company's net assets.
How to Use:
• A ratio < 1 can mean the stock is undervalued.
• 3 might indicate overvaluation unless justified by high ROE.
aiTrendview Feature: Color-coded health markers show if the company is UNDERVALUED, FAIR, or OVERVALUED, making valuation analysis visual.
________________________________________
4. Price-to-Earnings Ratio (P/E Ratio)
Definition: P/E = Price / Earnings per Share. It tells you how much investors are paying for each unit of earnings.
Importance: One of the most commonly used valuation metrics.
How to Use:
• A low P/E (< 15) might indicate undervaluation.
• High P/E (> 30) could mean overvaluation or growth expectations.
aiTrendview Feature: The health indicator ("CHEAP", "FAIR", "HIGH", "EXPENSIVE") with a visual bar helps judge sentiment and valuation instantly.
________________________________________
5. Price-to-Sales Ratio (P/S Ratio)
Definition: Market Cap / Revenue. Indicates how much investors pay per dollar of sales.
Importance: Useful for valuing companies with low or negative earnings.
How to Use:
• < 2 is attractive in most industries.
• Higher ratios need to be justified by strong growth.
aiTrendview Feature: P/S-based health tags and progress bars help traders decide whether the stock is reasonably priced on revenue.
________________________________________
6. EBITDA (Earnings Before Interest, Taxes, Depreciation & Amortization)
Definition: A measure of a company's core operational profitability.
Importance: Strips out non-operational costs and is used for comparative analysis.
How to Use:
• Positive EBITDA suggests financial strength.
• Compare year-over-year for growth consistency.
aiTrendview Feature: Visual score and health indicator classify profitability status as “PROFIT” or “LOSS”.
________________________________________
7. Total Revenue
Definition: The total income from sales before expenses.
Importance: Indicates the scale of business operations.
How to Use:
• Rising revenue over quarters = growth.
• Compare with competitors for market share insight.
aiTrendview Feature: Categorizes revenue scale as “MICRO”, “SMALL”, “MEDIUM”, or “LARGE” – useful for gauging company tier.
________________________________________
8. Net Income
Definition: Profit after all expenses, taxes, and interest.
Importance: Shows the company’s actual profitability.
How to Use:
• Positive Net Income = healthy bottom line.
• Use for EPS and ROE calculations.
aiTrendview Feature: Margin percentage + status label (“PROFIT” or “LOSS”) instantly convey financial strength.
________________________________________
9. Book Value Per Share (BVPS)
Definition: Total equity divided by the number of outstanding shares.
Importance: Indicates the liquidation value per share.
How to Use:
• Compare with current market price.
• Price < BVPS can mean undervaluation.
aiTrendview Feature: Shows whether the stock is trading at “DISCOUNT” or “PREMIUM” to its actual value.
________________________________________
10. Earnings Per Share (EPS)
Definition: Net income divided by outstanding shares.
Importance: Measures profitability on a per-share basis.
How to Use:
• Key input for valuation and dividend decisions.
• Positive EPS is essential for investment appeal.
aiTrendview Feature: Labeled “PROFIT” or “LOSS” and enhanced with visual status for clarity.
________________________________________
11. Symbol & Exchange Info
Definition: Displays the trading symbol and exchange (e.g., NSE, NYSE).
Importance: Ensures clarity when analyzing or sharing screenshots.
How to Use:
• Useful for verifying ticker and confirming data source.
aiTrendview Feature: Clearly displayed with "LIVE" tag for credibility.
________________________________________
12. Fundamental Health Score
Definition: aiTrendview computes a composite score (0–100) based on 5 core metrics: Net Income, EPS, P/E, P/B, and EBITDA.
Importance: Provides a single summary score to assess the company's overall financial strength.
How to Use:
• Use this as a filter to shortlist strong candidates.
• Score > 80 = “EXCELLENT”; 60–80 = “GOOD”; < 40 = “POOR”.
aiTrendview Feature: A professional horizontal progress bar with color-coded grade makes it visually intuitive.
________________________________________
⚠️ Disclaimer from aiTrendview
The information provided in this Fundamental Analysis dashboard is for educational and informational purposes only. While the data is sourced live and computed dynamically, it should not be interpreted as investment advice. Traders and investors must do their own due diligence and consider risk appetite, macroeconomic factors, and other indicators before making any financial decisions. aiTrendview.com or its affiliates shall not be held liable for any loss arising from the use of this tool. Markets are risky — trade wisely and responsibly.

Risk Calculator PRO — manual lot size + auto lot-suggestionWhy risk management?
90 % of traders blow up because they size positions emotionally. This tool forces Risk-First Thinking: choose the amount you’re willing to lose, and the script reverse-engineers everything else.
Key features
1. Manual or Market Entry – click “Use current price” or type a custom entry.
2. Setup-based ₹-Risk – four presets (A/B/C/D). Edit to your workflow.
3. Lot-Size Input + Auto Lot Suggestion – you tell the contract size ⇒ script tells you how many lots.
4. Auto-SL (optional) – tick to push stop-loss to exactly 1-lot risk.
5. Instant Targets – 1 : 2, 1 : 3, 1 : 4, 1 : 5 plotted and alert-ready.
6. P&L Preview – table shows potential profit at each R-multiple plus real ₹ at SL.
7. Margin Column – enter per-lot margin once; script totals it for any size.
8. Clean Table UI – dark/light friendly; updates every 5 bars.
9. Alert Pack – SL, each target, plus copy-paste journal line on the chart.
How to use
1. Add to chart > “Format”.
2. Type the lot size for the symbol (e.g., 1250 for Natural Gas, 1 for cash equity).
3. Pick Side (Buy / Sell) & Setup grade.
4. ✅ If you want the script to place SL for you, tick Auto-SL (risk = 1 lot).
5. Otherwise type your own Stop-loss.
6. Read the table:
• Suggested lots = how many to trade so risk ≤ setup ₹.
• Risk (currency) = real money lost if SL hits.
7. Set TradingView alerts on the built-in conditions (T1_2, SL_hit, etc.) if you’d like push / email.
8. Copy the orange CSV label to Excel / Sheets for journalling.
Best practices
• Never raise risk to “fit” a trade. Lower size instead.
• Review win-rate vs. R multiple monthly; adjust setups A–D accordingly.
• Test Auto-SL in replay before going live.
Disclaimer
This script is educational. Past performance ≠ future results. The author isn’t responsible for trading losses.

TQ's Support & Resistance(My goal creating this indicator): Provide a way to categorize and label key structures on multiple different levels so I can create a plan based on those observable facts.
The Underlying Concept / What is Momentum?
Momentum indicates transaction pressure. If the algorithm detects price is going up, that would be considered positive momentum. If the algorithm detects price is going down negative momentum would be detected.
The Momentum shown is derived from a price action pattern. Unlike my previous Support & Resistance indicator that used Super Trend, this indicator uses a unique pattern I created. On the first bar bearish momentum is detected a resistance Level is made at the highest point of the previous bullish condition. On the first bar bullish momentum is detected a support Level is made at the lowest point of the previous bearish condition. This happens on 5 different Momentum Levels, (short-term to long-term). I currently use this pattern to trade so the source code is protected.
What is Severity?
Severity is How we differentiate the importance of different Highs and Lows. If Momentum is detected on a higher level the Supply or Demand Level is updated. The Color and Size representing that Level will be shown. Demand and Supply Levels made by higher levels are more SEVERE than a demand level made by a lower level.
Technical Inputs
- to ensure the correct calculation of Support and Resistance levels change BAR_INDEX. BAR_INDEX creates a buffer at the start of the chart. For example: If you set BAR_INDEX to 300. The script will wait for 300 bars to elapse on the current chart before running. This allows the script more time to gather data. Which is needed in order for our dynamic lookback length to never return an error (Dynamic lookback length can't be negative or zero). The lower the timeframe the greater the number of bars need. For Example, if I open up a 1min chart I would enter 5000 as my BAR_INDEX since that will provide enough data to ensure the correct calculation of Support and Resistance levels. If I was on a daily chart, I would enter a lower number such as 800. Don't be afraid to play around with this.
- Toggle options (Close) or (High & Low) creates Support and Resistance Levels using the Lowest close and Highest close or using the Lowest low and Highest high.
Level Inputs
- The indicator has 5 Different Levels indicating SEVEREITY of a Supply and Demand Levels. The higher the Level the more SEVERE the Level.
Display Inputs
- You have the option to customize the Length, Width, Line Style, and Colors of all 5 different
- This indicator includes a Trend Chart. To Easily verify the current trend of any displayed by this indicator toggle on Chart On/Off. You also get the option to change the Chart Position and the size of the Trend Chart
How Trend Is being Determined?
(Close > Current Supply Level) if this statement is true technically price made a HH, so the trend is bullish.
(Close < Current Demand Level) if this statement is true technically price made a LL, so the trend is bearish.
- Fully customize how you display Market Structure on different levels. Line Length, Line Width, Line Style, and Line color can all be customized.
How it can be used?
(Examples of Different ways you can use this indicator): Easily categorize the severity of each and every Supply or Demand Level in the market (The higher Level the stronger the level)
: Quickly Determine the trend of any Level.
: Get a consistent view of a market and how different Levels are behaving but just use one chart.
: Take the discretion from hand drawing support and resistance lines out of your trading.
: Find and categorize strong levels for potential breakouts.
: Trend Analysis, use Levels to create a narrative based on observable facts from these Levels.
: Different Targets to take money off the table.
: Use Severity to differentiate between different trend line setups.
: Find Great places to move your stop loss too.

Smart DCA Strategy (Public)INSPIRATION
While Dollar Cost Averaging (DCA) is a popular and stress-free investment approach, I noticed an opportunity for enhancement. Standard DCA involves buying consistently, regardless of market conditions, which can sometimes mean missing out on optimal investment opportunities. This led me to develop the Smart DCA Strategy – a 'set and forget' method like traditional DCA, but with an intelligent twist to boost its effectiveness.
The goal was to build something more profitable than a standard DCA strategy so it was equally important that this indicator could backtest its own results in an A/B test manner against the regular DCA strategy.
WHY IS IT SMART?
The key to this strategy is its dynamic approach: buying aggressively when the market shows signs of being oversold, and sitting on the sidelines when it's not. This approach aims to optimize entry points, enhancing the potential for better returns while maintaining the simplicity and low stress of DCA.
WHAT THIS STRATEGY IS, AND IS NOT
This is an investment style strategy. It is designed to improve upon the common standard DCA investment strategy. It is therefore NOT a day trading strategy. Feel free to experiment with various timeframes, but it was designed to be used on a daily timeframe and that's how I recommend it to be used.
You may also go months without any buy signals during bull markets, but remember that is exactly the point of the strategy - to keep your buying power on the sidelines until the markets have significantly pulled back. You need to be patient and trust in the historical backtesting you have performed.
HOW IT WORKS
The Smart DCA Strategy leverages a creative approach to using Moving Averages to identify the most opportune moments to buy. A trigger occurs when a daily candle, in its entirety including the high wick, closes below the threshold line or box plotted on the chart. The indicator is designed to facilitate both backtesting and live trading.
HOW TO USE
Settings:
The input parameters for tuning have been intentionally simplified in an effort to prevent users falling into the overfitting trap.
The main control is the Buying strictness scale setting. Setting this to a lower value will provide more buying days (less strict) while higher values mean less buying days (more strict). In my testing I've found level 9 to provide good all round results.
Validation days is a setting to prevent triggering entries until the asset has spent a given number of days (candles) in the overbought state. Increasing this makes entries stricter. I've found 0 to give the best results across most assets.
In the backtest settings you can also configure how much to buy for each day an entry triggers. Blind buy size is the amount you would buy every day in a standard DCA strategy. Smart buy size is the amount you would buy each day a Smart DCA entry is triggered.
You can also experiment with backtesting your strategy over different historical datasets by using the Start date and End date settings. The results table will not calculate for any trades outside what you've set in the date range settings.
Backtesting:
When backtesting you should use the results table on the top right to tune and optimise the results of your strategy. As with all backtests, be careful to avoid overfitting the parameters. It's better to have a setup which works well across many currencies and historical periods than a setup which is excellent on one dataset but bad on most others. This gives a much higher probability that it will be effective when you move to live trading.
The results table provides a clear visual representation as to which strategy, standard or smart, is more profitable for the given dataset. You will notice the columns are dynamically coloured red and green. Their colour changes based on which strategy is more profitable in the A/B style backtest - green wins, red loses. The key metrics to focus on are GOA (Gain on Account) and Avg Cost.
Live Trading:
After you've finished backtesting you can proceed with configuring your alerts for live trading.
But first, you need to estimate the amount you should buy on each Smart DCA entry. We can use the Total invested row in the results table to calculate this. Assuming we're looking to trade on
BTCUSD
Decide how much USD you would spend each day to buy BTC if you were using a standard DCA strategy. Lets say that is $5 per day
Enter that USD amount in the Blind buy size settings box
Check the Blind Buy column in the results table. If we set the backtest date range to the last 10 years, we would expect the amount spent on blind buys over 10 years to be $18,250 given $5 each day
Next we need to tweak the value of the Smart buy size parameter in setting to get it as close as we can to the Total Invested amount for Blind Buy
By following this approach it means we will invest roughly the same amount into our Smart DCA strategy as we would have into a standard DCA strategy over any given time period.
After you have calculated the Smart buy size, you can go ahead and set up alerts on Smart DCA buy triggers.
BOT AUTOMATION
In an effort to maintain the 'set and forget' stress-free benefits of a standard DCA strategy, I have set my personal Smart DCA Strategy up to be automated. The bot runs on AWS and I have a fully functional project for the bot on my GitHub account. Just reach out if you would like me to point you towards it. You can also hook this into any other 3rd party trade automation system of your choice using the pre-configured alerts within the indicator.
PLANNED FUTURE DEVELOPMENTS
Currently this is purely an accumulation strategy. It does not have any sell signals right now but I have ideas on how I will build upon it to incorporate an algorithm for selling. The strategy should gradually offload profits in bull markets which generates more USD which gives more buying power to rinse and repeat the same process in the next cycle only with a bigger starting capital. Watch this space!
MARKETS
Crypto:
This strategy has been specifically built to work on the crypto markets. It has been developed, backtested and tuned against crypto markets and I personally only run it on crypto markets to accumulate more of the coins I believe in for the long term. In the section below I will provide some backtest results from some of the top crypto assets.
Stocks:
I've found it is generally more profitable than a standard DCA strategy on the majority of stocks, however the results proved to be a lot more impressive on crypto. This is mainly due to the volatility and cycles found in crypto markets. The strategy makes its profits from capitalising on pullbacks in price. Good stocks on the other hand tend to move up and to the right with less significant pullbacks, therefore giving this strategy less opportunity to flourish.
Forex:
As this is an accumulation style investment strategy, I do not recommend that you use it to trade Forex.
For more info about this strategy including backtest results, please see the full description on the invite only version of this strategy named "Smart DCA Strategy"

Swing Data - Optimized SK60
v. 1.83
indicator adjust to time frame.
This Pine Script code generates a trading indicator that calculates and displays various data points on a stock, including Average Daily Range (ADR%), Market Cap, Current Volume, Free Cash Flow (FCF) Yield %, Float %, whether moving averages (MA) are inline, and the moving averages of certain indexes like the Russell 2000, Nasdaq 100, and S&P 500. Here’s a breakdown of the script and how to use it.
Key Concepts and Functionality
Indicator Definition: The script begins by defining the indicator with a title (Swing Data - Optimized ADR%...) and short title (Optimized Swing Data), which will appear on the chart. The overlay=true command ensures that the indicator is drawn on the main price chart rather than in a separate pane.
Sector and Ticker:
s = syminfo.tickerid: This stores the ticker ID of the stock being analyzed.
sector = syminfo.sector: This retrieves the sector to which the stock belongs. If the sector information is unavailable, it assigns the value "N/A".
Dynamic Inputs: Several input parameters allow you to customize the indicator:
adrp_len: Defines the length for ADR% calculation.
len: Defines the moving average length for volume.
tbl_size, bg_col, and txt_col: Control the table's appearance, including the size of the text, background color, and text color.
posTable: Allows positioning of the table on the chart. Options include top-left, top-right, bottom-left, and bottom-right.
show_empty_row: Adds an empty row above the displayed values if set to true.
Volume Unit Handling (f_vol_unit): This function converts volume into appropriate units, like thousands (K), millions (M), or billions (B), to make volume easier to read. It’s applied to both the current volume and the average daily volume.
Moving Averages for Indexes (f_ma_indexes): This function calculates the 10-day, 20-day, 50-day, and 200-day simple moving averages (SMAs) for an index (such as Russell 2000 or Nasdaq 100). It also checks whether the MAs are inline, meaning if shorter MAs are above longer MAs, which is usually a bullish sign. It returns the result as "YES" or "NO" and assigns a color (green for yes, red for no).
Volume and Price Data: The script fetches several important data points:
vol_display: Current volume in human-readable units.
avgDaVol: Average daily volume.
adrp: Average Daily Range (ADR%) over a specified length.
fcf_yield_percent: Free Cash Flow Yield percentage.
ADR Calculation: The ADR% is calculated using the formula 100 * (ta.sma(high / low, adrp_len) - 1) and is fetched for the daily timeframe.
FCF Yield Color Logic: The Free Cash Flow yield is classified into three categories:
Green: Undervalued if FCF yield is over 5%.
Yellow: Neutral between 2-5%.
Red: Overvalued if below 2%.
MA's Inline Check for the Stock: The script checks if the stock's 10-day, 20-day, 50-day, and 200-day moving averages are inline (i.e., in a bullish alignment where shorter MAs are higher than longer MAs).
Float % Calculation: The float percentage is calculated as the ratio of float shares outstanding (FSO) to total shares outstanding (TSO). The color is set based on its breakout potential:
Red: Below 20% (manipulation risk).
Green: 20-50% (ideal breakout range).
Yellow: Above 50%.
Price Change %: The script calculates the percentage change in price between the current and previous close.
Volume Color Logic: The color of the "Current Volume" is based on whether it indicates buying or selling pressure:
Green: Volume is higher than average, and the price increased more than ADR%.
Red: Volume is higher than average, and the price decreased more than ADR%.
Yellow: Default color if neither condition is met.
Market Cap: The market cap is calculated by multiplying the total shares outstanding (TSO) by the current close price, and it’s displayed in a human-readable unit (K, M, or B).
Display Table:
A table is created to display all the calculated data in an organized manner. It includes fields for Market Cap, Avg Volume, ADR%, Current Volume, FCF Yield %, Float %, MA's Inline status, and Sector. Additionally, it shows the inline status for the Russell 2000, Nasdaq 100, and S&P 500.
How to Use:
Customization: Users can customize the inputs, including the length of ADR% and volume moving averages, and adjust the table size, text color, and position.
Visualization: The indicator provides a comprehensive table on the chart showing key data points for technical analysis, including whether moving averages are inline for both the stock and major indexes.
This indicator is particularly useful for swing traders or technical analysts who want a clear overview of a stock’s volume, volatility (via ADR%), and the alignment of moving averages, combined with fundamental metrics like market cap and free cash flow yield.

Percentage GridPercentage Grid Indicator
Description:
The Percentage Grid indicator is designed to assist traders in identifying significant support and resistance levels based on yearly percentage changes. This indicator plots horizontal lines on the chart from the start of the year, allowing you to customize how much percentage each line represents. Currently, you can set up to 5 horizontal lines, each representing a different percentage change from the beginning of the year.
For instance, when applied to the SBI Bank stock, you can customize the lines to display various percentage changes from the start of the year, such as 20%, 25%, and up to 35%, as the SBIN stock is currently trading around these levels. This visualization helps traders to easily identify key levels where price action tends to react, providing valuable insights for making trading decisions.
Principles of Trading Technical Analysis:
The Percentage Grid indicator is grounded in the principle of support and resistance levels, which are fundamental concepts in technical analysis. These levels are specific price points on a chart that tend to act as barriers, preventing the price from getting pushed in a certain direction. The indicator helps in:
Identifying Support Levels: Price levels where a downtrend can be expected to pause due to a concentration of buying interest.
Identifying Resistance Levels: Price levels where an uptrend can be expected to pause due to a concentration of selling interest.
By customizing and plotting percentage-based horizontal lines, the indicator highlights these critical levels based on the percentage change from the start of the year.
How to Use:
Add the Indicator to Your Chart:
Search for "Percentage Grid" in the TradingView indicator library and add it to your chart.
Customize Percentage Levels:
Access the indicator settings to customize the percentage change each line represents.
You can set up to 5 different percentage levels. For example, you can set lines at 20%, 25%, 30%, 35%, and 40%.
Interpret the Grid Lines:
The plotted lines will represent the specified percentage changes from the start of the year.
Use these lines to identify potential support and resistance levels where price action is likely to react.
Practical Application:
Look for price bounces or reversals around these levels, which can indicate strong support or resistance.
Combine the Percentage Grid with other technical analysis tools, such as moving averages or trend lines, to confirm potential trading opportunities.
Example:
In the accompanying screenshot, the Percentage Grid is applied to the SBI Bank stock. The lines are set to display 20%, 25%, 30%, 35%, and 40% changes from the start of the year. Notice how the price action respects these levels, providing clear areas where support and resistance are evident.
By incorporating the Percentage Grid into your trading strategy, you can enhance your ability to identify key price levels and make more informed trading decisions.
Happy Trading!
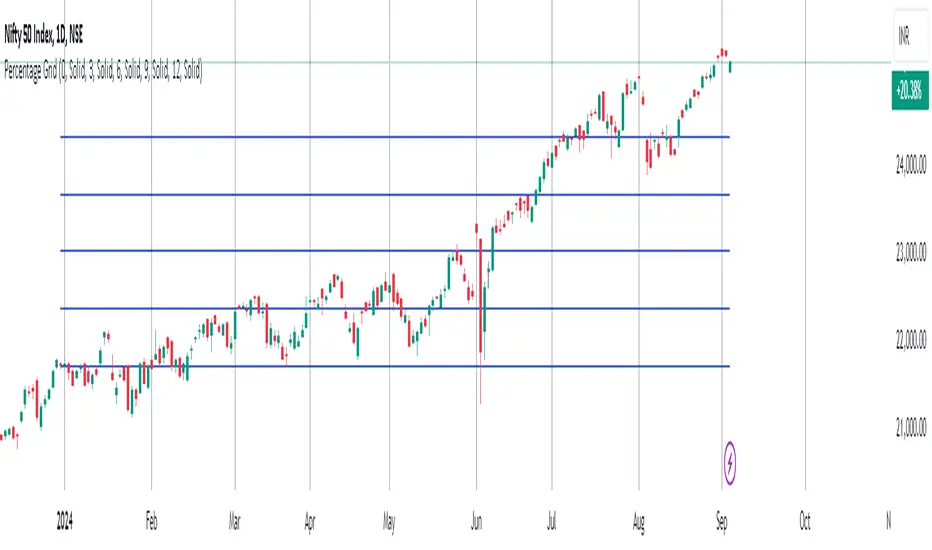
[AlbaTherium] MTF External Ranges Analysis - ERA-Orion for SMC MTF External Ranges Analysis - ERA - Orion for Smart Money Concepts
Introduction:
The MTF External Ranges Analysis - ERA - Orion offers enhanced insights into multi-timeframe external structure points, swing structure points, POIs (Points of Interest), and order blocks (OB) . By incorporating this enhancement, your multi-timeframe analysis are streamlined, simplifying the process and reducing chart workload, no need for manual chart drawing anymore, stay focus on Low Time Frame and get High Time Frame insights in one single Time frame.
This identification process remains effective even when focusing on Lower Time Frames (LTF), providing detailed insights without sacrificing the broader market perspective.
The MTF External Ranges Analysis - ERA – Orion is specifically designed to be used in conjunction with OptiStruct™ Premium for Smart Money Concepts . This strategic combination enhances the workflow of identifying optimal entry points. OptiStruct acts as the analysis tool for Lower Time Frames (LTF), zeroing in on immediate interest areas, while Orion expands this analysis to Higher Time Frames (HTF), providing a broader view of market trends and importants key levels . The integration of Orion with OptiStruct seamlessly merges LTF and HTF analyses, ensuring a thorough understanding of market dynamics for informed and strategic decision-making. This toolkit in one package assembly is pivotal for traders relying on Smart Money Concepts, offering unmatched clarity and actionable insights to navigate the markets effectively.
This tool offers an advanced smart money technical analysis to improve your trading experience. It introduces four key concepts:
Main Features:
Entries Enhancements
Inducements HTF
High/Low Markings HTF
Multiple Timeframes and Confluences on Extreme, Dec and SMT Order Blocks
By integrating these concepts into one, traders can identify high-probability zones across multiple timeframes and develop a thorough understanding of market dynamics. These confluence zones enhance order block skills and potential, establishing them as essential pillars in smart money trading strategies and enabling traders to make more informed decisions.
Settings Overview:
HTF Settings Enable HTF Analysis
Select timeframe {Select or 4H Chart}
Labels Alignment for Lines and Boxes
Inside bar ranges HTF
Break of Structure /Change of Character HTF
Inducements HTF
High/Low Markings HTF
High/Low Sweeps HTF
Extreme Order Blocks HTF
Decisional Order Blocks HTF
Smart Money Traps HTF
IDM Demands and Supplies HTF
Historical Order Blocks HTF
OB Mitigation HTF {touch/ extended}
Understanding the Features:
Chapter 1: Entries Enhancements
In this chapter, we delve into strategies to refine trading entries, focusing on the multi-timeframe analysis of extreme or decisional order blocks in the High Time Frame timeframe as a key point of interest. We highlight the significance of transitioning to the Low Time Frame chart for observing pivotal shifts in market behavior. By examining these concepts, traders can gain deeper insights into market dynamics and make more informed entries decisions at critical junctures.
Practical Example:
We had an Order Block Extreme on the 1-hour timeframe, and currently, we are on the recommended chart for trade entry, which is the 5-minute timeframe. We are patiently waiting to observe a 5-minute ChoCh in the market to enter a buying position since it's an OB Extreme Demand on the 1-hour timeframe. Here, it's crucial and important to focus on the entry timeframe rather than checking what's happening in the higher timeframe. The indicator facilitates this task as it provides us with real-time perspective and visibility of everything happening in the higher timeframe.
Chapter 2: Inducements HTF
It is important and useful to be aware of the various liquidity points across the different timeframes we use; sometimes, a reliable entry point in the Lower Time Frame (LTF) may be surrounded by inducements. Consequently, this point becomes unreliable, and prior to the arrival of this functionality, such anomalies could not be detected, especially when focusing on the market in the LTF. From now on, there will be no more such issues.
Practical Example:
Suppose we identify an Order Block Extreme on the 5M timeframe, indicating a potential entry level. However, when we switch to the 5M timeframe to look for an entry point, we observe an accumulation of inducements around this Order Block coming from a higher timeframe, whether it's M15 or H1. This suggests a potential weakness in the entry point and significant market liquidity, which will act as a trap zone. Before the introduction of this feature, we might have missed this crucial observation, but now we can detect these anomalies and adjust our strategy accordingly.
The only practical way to see theses confluences is to use this Indicator, see the example below
Chapter 03: High/Low – Bos - ChoCh Markings HTF
The High/Low Markings HTF feature in the MTF External Ranges Analysis - ERA - Orion provides a comprehensive view into the market's heartbeat across different timeframes, right from within the convenience of the Lower Time Frame (LTF). It meticulously highlights pivotal shifts, allowing traders to seamlessly discern market sentiment and anticipate potential price reversals without needing to toggle between multiple charts. This innovation ensures that critical market movements and sentiment across various timeframes are visible and actionable from a single, focused LTF perspective, enhancing decision-making and strategic planning in trading activities.
Understanding High/Low Markings in HTF Analysis
High/Low Markings in High Time Frame (HTF) analysis mark the market's extremities within a given period, pinpointing potential areas for reversals or continuation and delineating crucial support and resistance levels. These markings are not arbitrary but represent significant market responses, serving as essential indicators for traders and analysts to gauge market momentum and sentiment.
The Role of HTF in Market Analysis
HTF analysis extends a comprehensive view over market movements, distinguishing between ephemeral fluctuations and substantial trend shifts. By scrutinizing these high and low points across wider time frames, analysts can unravel the underlying market momentum, enabling more strategic, informed trading decisions.
Identifying High/Low Markings
Identifying these crucial points entails detailed chart analysis over extended durations—daily, weekly, or monthly. The search focuses on the utmost highs and lows within these periods, which are more than mere points on a chart. They are significant market levels that have historically elicited robust market reactions, serving as key indicators for future market behavior.
Real-world Example:
Chapter 04: Multiple Timeframes and Confluences on Extreme, Dec and SMT Order Blocks Across HTF
The Orion indicator serves as a bridge between the multiple dimensions of the market, enabling a unified and strategic interpretation of potential movements. It's an indispensable tool for those seeking to capitalize on major opportunity zones, where the convergence of diverse perspectives creates ideal conditions for significant market movements.
Designed to navigate through the data of different timeframes and market analysis, Orion provides a clear and consolidated view of major points of interest. With this indicator, traders can not only spot opportunity zones where consensus is strongest but also adjust their strategies based on the dynamic interaction of various market participants, all while remaining within the Lower Time Frame (LTF).
Conclusion:
MTF External Ranges Analysis - ERA - Orion for Smart Money Concepts as “ The Orion ” indicator captures consensus among scalpers, day traders , swing traders, and investors, turning key areas into major opportunities. It allows for precise identification of areas of interest by analyzing the convergence of actions from various market participants. In short, Orion is crucial for detecting and leveraging the most promising points of convergence in the market.
This identification occurs even while focusing on Lower Time Frames (LTF), allowing for detailed insights without losing the broader market perspective.
This document provides an extensive overview of MTF External Ranges Analysis - ERA - Orion , emphasizing its importance in comprehending market dynamics and utilizing essential smart money concepts trading principles.

ATR StopThe "ATR Stop" indicator is designed to provide traders with insights into potential stop levels based on Average True Range (ATR) calculations specifically tailored for profitable (green candles) and unprofitable (red candles) price movements. This tool aims to assist traders in identifying potential stop levels that adjust dynamically based on the volatility of distinct market conditions.
The indicator functions by calculating two types of ATR: one for profitable movements and the other for unprofitable movements. The Average True Range is calculated separately for green and red candles, allowing users to assess potential stop levels more accurately based on the nature of price movements.
Key features of the "ATR Stop" indicator include:
Custom ATR Calculation: It calculates the ATR for profitable (green) and unprofitable (red) movements separately, considering only specific candle types based on their closing price relative to their opening price.
Dynamic Multiplier: Users can adjust the multiplier to fine-tune the sensitivity of the ATR-based stop levels, accommodating different risk preferences and market conditions.
Clear Visualization: The indicator plots the ATR levels for profitable (green) and unprofitable (red) movements one candle ahead on the chart, providing a visual representation of potential stop levels.
To use the indicator effectively, traders can adjust the ATR length and multiplier parameters based on their trading strategies and risk management preferences. By considering distinct price movements, this tool can assist in setting more informed stop levels in varying market conditions.
Please note that while the "ATR Stop" indicator can be a valuable addition to a trader's toolbox, it should be used in conjunction with other technical analysis tools and risk management strategies to make well-informed trading decisions.
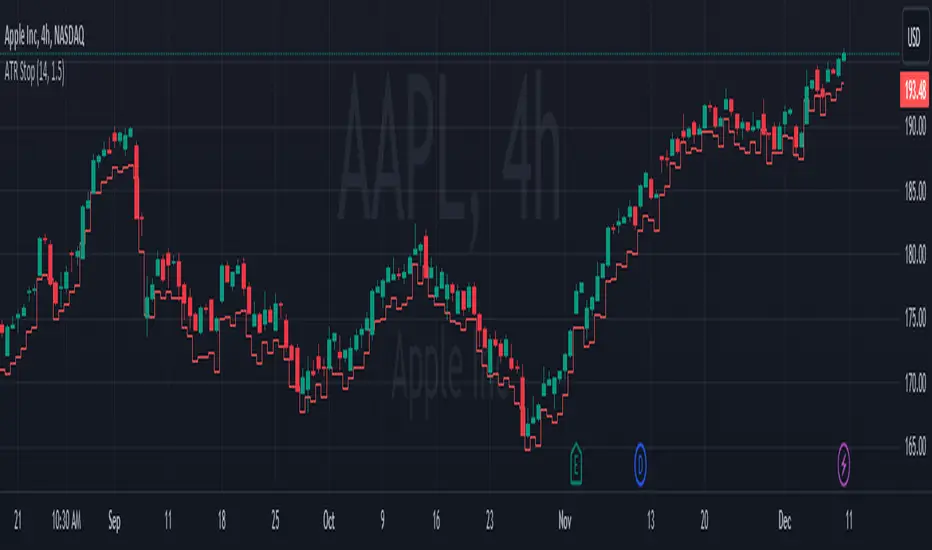
Self-Optimizing RSI Strategy [Kioseff Trading]Hello!
Introducing the Self-Optimizing RSI Strategy.
The indicator tests up to 800 RSI strategies simultaneously, looping through arrays, and auto plots the best performing parameter set.
The image above shows the result of 800 RSI strategies concurrently.
The table oriented bottom right shows the performance and risk metrics of the best performing RSI system tested across the bar set. Additionally, the conditions for entry and exit are displayed; for the image - a long entry system predicated on RSI crossunders and exit system predicated on a 1% TP and 2% SL are shown.
The indicator calculates numerous risk and performance metrics.
Calculated metrics include:
RSI Parameters
RSI Cross Entry Level
Total Trades
Win Rate
Avg. Gain for Winning Trades
Max Pain
PnL (Cumulative Performance)
Profit Factor
Avg. Loss for Losing Trades
Ratio Avg. Win / Avg. Loss
Avg. Bars in Trade
Max Drawdown
Current Drawdown
Open Position PnL
"Dynamic" indicates the performance of self-optimizing RSI system was tested.
The image above shows the performance of the greatest-performing RSI system - a fixed set of parameters - when adhering to a 1% TP and 2% fixed SL.
Trailing Stops and Profit-Taking Limit orders can be set/simulated.
The image above shows a dynamic entry level - plotted as a purple, non-transparent line.
The entry level "self-optimizes" to mimic the best performing RSI system at current time.
The image above exemplifies the functionality for all horizontal lines plotted on the chart.
The average RSI level achieved subsequent a profitable trade is shown.
The average RSI level achieved subsequent a losing trade is shown.
The entry level for RSI crossunders/crossovers is shown.
The image above show the Self-Optimizing RSI indicator recording entries & exits; gains & losses, for each executed trade.
You can "verify" trades manually.
Blue boxes reflect an entered position.
Green boxes reflect a closed, profitable trade.
Red boxes reflect a close, losing trade.
The percentage gain for a profitable trade is appended to green boxes; the percentage loss for a losing trade is appended to red boxes.
The Self-Optimizing RSI indicator plots off the chart; however, percentage gains/losses are measured against price, not RSI.
Boxes correlate to the interval a trade was entered/exited on.
The indicator hosts various methods to filter the outcome for testing.
For instance, you can:
Use trailing stops or fixed stop losses
Test RSI crossunders and crossovers
Configure the RSI settings that are tested (i.e. RSI 2 - 9, RSI 14 - 20, RSI 50 - 57)
Test short-based RSI Systems and long-based RSI systems
Simulate limit orders (Exit intrabar at fixed stop losses or trailing stop losses; exit intrabar at profit targets)
Require all tested RSIs to trend above or below their respective average (i.e. all RSIs must trend above/below their 50-interval EMA values. SMAs can also be used)
Use external indicators and require a user-defined value be exceeded, measured below, or that price exceed or measure below an indicator. The Self-Optimizing RSI indicator incorporates a few built-in technical indicators - ADX, %k, MFI, CMFI, and RSI. Consequently, you can require these indicators to measure above/below a specified level prior to entry. Additionally, you can supplement an extrinsic indicator (anything custom coded with plot values) to the entry logic for the Self-Optimizing RSI indicator. I'll show an example shortly.
Adjust the time window that's tested.
Adjust PT and SL percentages.
Override plot an RSI system to procure thorough statistics.
Require a symbol to measure above/Below or equal to a particular price level to “validate” a Long/Short entry signal. You can retrieve any data hosted by TradingView and require it measure above/below a user-defined level prior to entry. For instance, you can select "$VIX", and require the ticker to measure less than $30 prior to long/short entry. If "$VIX" measures greater than $30 prior to a long/short signal the position will not open. Alternatively, you can require a symbol to measure above a user-defined price prior to entry. If the retrieved ticker doesn't measure above the user-defined level prior to entry a trade will not open.
Use trailing stops or fixed stop losses
The image above shows results for 800 short-based RSI systems - using a trailing stop loss.
Test RSI crossunders and crossovers
The image shows results for 800 long-based RSI systems. Positions are entered subsequent to RSI crossovers.
You can select which RSI strategies are tested - you aren't not limited to testing RSI 2 - RSI 9 (:
Simulate limit orders (Exit intrabar at fixed stop losses or trailing stop losses; exit intrabar at profit targets)
The image above shows performance test results when exiting during the interval subsequent to the profit target being exceeded.
The image above shows performance test results when exiting during the interval subsequent to the stop loss being exceeded.
Require all tested RSIs to trend above or below their respective average (i.e. all RSIs must trend above/below their 50-interval EMA values. SMAs can also be used)
The image above shows an RSI EMA in addition to prerequisite condition. For each RSI strategy tested, the RSI used for the strategy must measure above an EMA of its values prior to entry. You can require RSI to measure below an EMA of its values prior to entry, use an SMA, and change the length of the MA used.
Use external indicators and require a user-defined value be exceeded, measured below, or that price exceed or measure below an indicator. The Self-Optimizing RSI indicator incorporates a few built-in technical indicators - ADX, %k, MFI, CMFI, and RSI. Consequently, you can require these indicators to measure above/below a specified level prior to entry. Additionally, you can supplement an extrinsic indicator (anything custom coded with plot values) to the entry logic for the Self-Optimizing RSI indicator. I'll show an example shortly.
The image above shows me requiring the ADX indicator to measure above "20" prior to long entry. Any of the built-indicators can be used with similar conditions; you can implement a custom-coded indicator for trade logic.
Additionally, you can supplement an extrinsic indicator (anything custom coded with plot values) to the entry logic for the Self-Optimizing RSI indicator.
The image above shows me retrieving the value for Volume Profile Point of Control - a TradingView coded indicator.
Consequently, I can require price to measure above/below the session's Poc prior to RSI long/short entry.
You can use this feature with any custom coded indicator providing historical plot values - something you or a favored author have coded.
]Adjust PT and SL percentages
The image above shows adjusted TP & SL percentages - optimize and reward/risk ratio you'd like (:
Override plot an RSI system to procure thorough statistics.
The image above shows manually plotted RSI parameters and a corresponding stat sheet.
Require a symbol to measure above/Below or equal to a particular price level to “validate” a Long/Short entry signal. You can retrieve any data hosted by TradingView and require it measure above/below a user-defined level prior to entry. For instance, you can select "$VIX", and require the ticker to measure less than $30 prior to long/short entry. If "$VIX" measures greater than $30 prior to a long/short signal the position will not open. Alternatively, you can require a symbol to measure above a user-defined price prior to entry. If the retrieved ticker doesn't measure above the user-defined level prior to entry a trade will not open.
The image above shows me requiring the ticker "$VIX" to measure below $30 prior to long/short entry. If %VIS measures greater than $30 when a long/short signal triggers a position will not be opened. Further refine your trading system with this feature - exploit correlations.
Adjust the time window that's tested.
The image above shows configurable start and end dates for the optimization period.
You won't be able to test 800 RSI strategies concomitantly on a 20,000 bar data set.
Consequently, for large data sets (intrasession data) you will have to narrow the optimization window to test a larger number of combinations.
You can test 80 (loads on all data sets), 144 (loads on all data sets), 264 (loads on ~15,000 bar data sets), 312 (loads on ~11,500 bar data sets) and 800 (loads on ~4950 bar data sets)combinations simultaneously. You can test 800 RSI strategies simultaneously on intrasession data; however, you'll likely have to narrow the tested time window.
I recently published a bar count script titled "Bar Count for Backtesting", you can access the script here:
The above script is useful for quickly calculating the number of bars in a time window, or the date for a bar that is "x" number of bars back. Therefore, implementing these scripts cooperatively should improve date selection efficiency (not arbitrarily selecting test start & end dates that fail to load).
I included a tool tip describing the near-maximum bars in a data set that the higher numbers of simultaneous RSI strategies can be tested on.
More to come; enjoy!
(P.S. The script uses private libraries and, consequently, is unable to be published open source)
An optimization script is best implemented to discover what won't work, not what will work. The best performing "optimized" parameters are not a guaranteed profitable investment system. While we may see an exceptionally positive performance for a set of parameters, it's impossible to know how much of that performance is the beneficiary of market noise in the absence of additional testing. Most market moves are noise - irreplicable sequences that offer no predictive utility - and most "good" backtests overwhelmingly benefit from these irreplicable sequences. An investor unfamiliar with this concept may be lead to believe they have found a valid correlation between an indicator sequence and subsequent price movement, despite the correlation being illusory.
Consequently, it should be assumed that the best performing parameters strongly benefitted from market noise and will not work in a live market - until further rigorous statistical tests are performed on an investment system built around the best performing parameters. This includes out-of-sample, in-sample, and forward testing in addition to testing negatively correlated, positively correlated and zero-correlation assets; testing additional assets should be treated as prerequisite to live implementation.
Of course, all trading strategies, even one's that methodically exploit a valid correlation/replicable sequence, will benefit from market noise - it's impossible to avoid. However, a "legit" trading strategy has a chance to work on future price data, while an overoptimized strategy will fail miserably on new price data!
An overoptimized strategy is virtually guaranteed to have a better backtest performance than a valid strategy. The overoptimized strategy will fail in a live market while the valid strategy has a chance of working. So, should you notice the best performing RSI parameters, be sure to build a comprehensive trading system around the parameters and perform additional tests. This is the only way to know if the optimized parameters will truly work in a live market!
Unfortunately, they often will not!
This publication does not constitute investment advice.
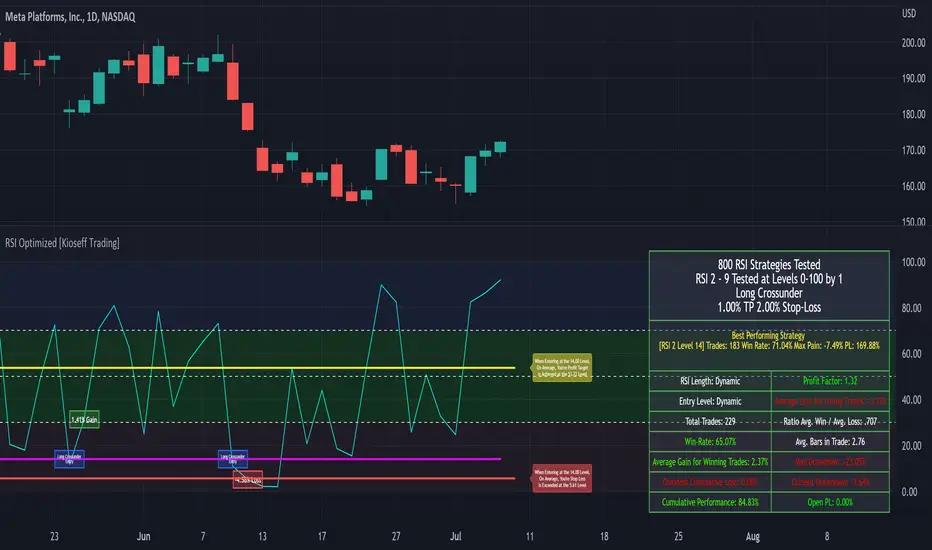
SAR+RSI+EMAs SignalsNOTE:
Indicator based strategies may expire and begin to work again. There are various ways to check the expiration of these strategies but I suggest equity curve trading (EC trading) as the best one.
Please check every single indicator based strategy to see if it’s still profitable or it has been expired to avoid losses.
Principles:
I personally believe every profitable indicator-based setup need 3 factors. Actually I analyze indicator-based set up in this way!
1- Trend detector: a tool that detect the “trend”.
2- Oscillators (Discount finder): a tool that detects “discounts” in the direction of the trend.
3- Stimulus: A tool that indicates the Initiation of a movement.
There may be profitable strategies that do not use all three, because other factors are strong enough to lead us to profit, but they are rare and sometimes they hide the other forgotten factor in the main two ones.
Elements:
(Since most of traders here, are familiar with these famous indicators I will not take your time to write about their uses and formula)
SAR: As a Trend detector, regarding position of close and SAR
EMA 7 and EMA 21: As trend detectors, regarding position of EMA 7 as fast “moving average” and EMA 21 as slow one. Also we need another confirmation for trend regarding EMA 7 and closing price of the signal candle.
RSI: In this strategy RSI is used both as a discount finder and a stimulus.
For RSI being over/under 50, regarding the trend, a possible discount may have been occurred. Imagine these conditions: close>EMA7, EMA7>EMA21, close>SAR and simultaneously RSI being under 50 is really a sign of powerful uptrend which it’s RSI decreasing might be a sign of corrective move, which will be following a bullish impulsive move.
The other use of RSI is to stimulate a buy signal by “crossing” over 50 or 30 (50 as balanced point of momentum and 30 as a sign of ending an oversold) or stimulate a sell signal by “crossing” under 50 or 70 (50 as balanced point of momentum and 70 as a sign of ending an overbought).
Entry point: you can use one of the followings.
1- Open of the next candle
2- EMA 7
3- Open of the signal candle
(Totally optional but “open of the next candle” is suggested by me.)
SL: Use one of the followings.
1- SAR or some pips (regarding ATR Or your experience of this trading instrument’s fluctuations in this time frame) below the SAR
2- Fixed amount (regarding ATR Or your experience of this trading instrument’s fluctuations in this time frame)
3- Use EMA21 as dynamic SL (if a candle far enough from the initiative candle close over (for sell) below ( for buy)
Again number 1 is suggested by me.
TP: Use one of the followings.
1- Use static levels or zones of support and resistance as TP.
2- Use dynamic levels for instance band of BB or moving averages (Moving the SL is possible).
3- Use fixed R to R
And I believe static zones of support and resistance work better.
Examples:
I indicate a buy signal on the chart!
Using local level as TP worked just good.
Using EMA was better in this case.
And using a riskier level or a fixed R to R is obvious in the chart!
Since in the range markets, this strategy may not work well and at the same time, TP to SL might be too small to be worth the risk, I prefer to use levels to filter range market conditions!
I convert all those circumstances to a simple buy and sell signs on the chart!
EMA21 and SAR are still visible because it is possible that traders use them for their TP and SL.
This is how it look without EMA21 and SAR!
Another screenshot of this strategy!
I also add a check box to filter signals by another trend detector. MATD created by me to help traders detect trend!
As it’s visible, some profitable signals filtered too, but using a longer-term trend detector as an additional one, alongside the double EMAs is very useful for this strategy.
The other box “use high&low instead of close for fast EMA” makes the “EMA7 and close” trend detector an easygoing one!
Almost everything is editable here!
*** I did not invent this strategy, you can find it for free on net ***
I'll change it to a "strategy" instead of an indicator if reader like to!

Trailing Stoploss Bottom ActivationThe Basics
The indicator is visible on the chart as circles above and below the bar.
It will trigger an alert when the current price goes below, the low of the previous candle.
Or an alert when current price goes above, the high of the previous candle.
The indicator can be used as a trailing stoploss for (DCA/ TV) bots.
The distance between the circles and candlesticks can be adjusted. If the user prefers to set an alert e.g. a few ticks lower than the candle bottom.
What Makes It Different
The user can preset the price (of the asset e.g. BTC), where it will start looking for the condition: current price is below previous candle low (when in long position). Current price is above previous candle high (when short).
Example
In the chart above MATIC/BUSD the user has drawn a blue line at 1.70. Since there is where he expects resistance.
The user has a long position (bought at the green arrow.) The user wants to start trailing at price 1.70.
The alert will only trigger when the following conditions are met:
Condition 1 - Crossed 1.70
Condition 2 - Current candle price is below previous candle low.
In the chart above price crossed above 1.70 on 26th Oct. Current candle price (at that moment) went below previous candle low on 27th Oct, indicated with a red arrow. Here the alert will go off at 1.659 BUSD (indicated in pink).
It ignores the other two lows, indicated with orange arrows. Because condition 1 is not met.
It is possible to use multiple time frames at the same time. Some time frames might not be available depending on your Tradingview subscription.
Final Words
Disclaimer: Please use it with care and at own risk. The owner of this indicator is not liable for any financial losses.
Past performance is no guarantee of future returns.

Kama Based Regressive Strategy for NIFTY : IndicatorThis is a Indicator Script for a Strategy which is backtested here
Background
I was pretty fascinated about the use of KAMA (Kaufman's Adaptive Moving Average) with non linear time-series, and my research about its realtime usage came out pretty good,
Kama if utilised correctly with a proper set of other indicators can give us non-repainting profitable strategies with a good unit(no. of trades) of backtest!
How i came up with this Strategy ?
One bright day, I and some of my friends were discussing over some of the quantitative measures, to minimise the risks in a trade by reentering and reverse entering at a very high frequency. After a lot of brain-storming that night I came to rescue some behaviours in KAMA, which made my day that day,
I came up with a strategy that would reenter and reverse enter any positions with core goal of getting into an efficient profitable frontier. I did some coding over return assessments and it showed very promising results for certain boundary and variable conditions, you just require a good trend-filter and a good boundary break condition, i coded the boundary break conditions with KAMA, and used a simple adaptive ATR for trend filtering.
Use of the above Strategy
We all know that all things cant be coded, you just have to start right, with a well backtested profitable strategy in trading.
The above strategy is a good start towards an analysis and alert generation for taking a good backtested-profitable lookup into a security, finding where it works and where it fails, final decision always lies in the hands of the trader,
I personally use such kind of strategies to generate alerts for me to take lookup into and get ready and prepared for any good trade that is coming.
Optimisation
This strategy is non-repainting and is optimised for Nifty 5 mins
With Provision For Alerts which are :
Buy Alert
Sell Alert
Buy Adder Alert
Sell Adder Alert
Trend Change Alert for Exit
How can i get Access
Right now access to the script is limited to few people and friends as it is experimental, and it is just for a demo purpose. Meanwhile if you want to have access just private message me, don't write any comment for the access since it is against the house rules of Tradingview, use comment-box only if you wanna add something!
At last Thanks to Tradingview for making such an awesome platform.

Parabolic SARThis is a redesign of the built-in Parabolic SAR indicator. I added a proper input system, an option to highlight initial points for both lines and an option to choose points width. So, customize it as you want.
Parabolic SAR was originally developed by J. Welles Wilder and described in his book "New Concepts in Technical Trading Systems" (1978). It is a trend-following indicator that can be used as a trailing stop loss.
To know which settings for PSAR are the most profitable on your instrument and timeframe you can use this tool
Profitable Parabolic SAR
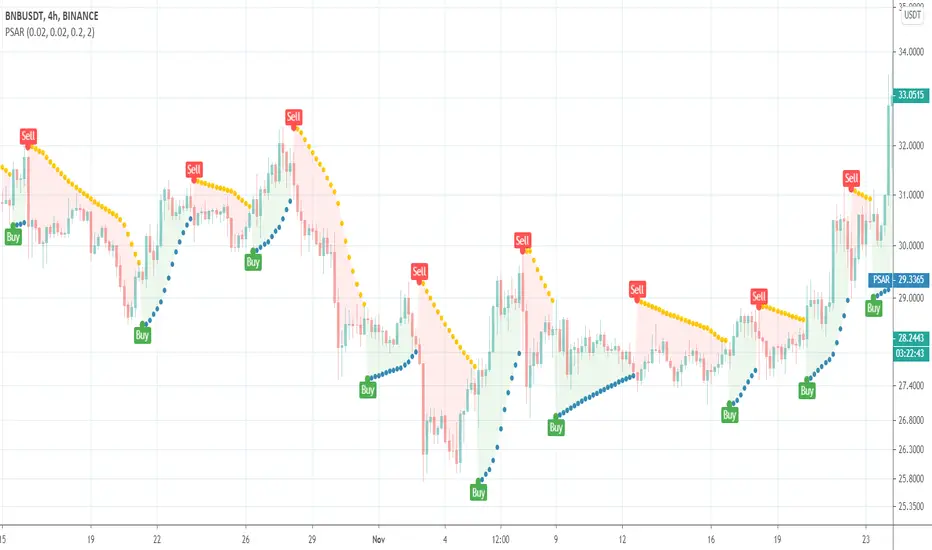
JL Swing Signal - {UT}Hello all, This signal is created based on Jesse Livermore's formula, I have tried to enhance it by including other elements to make the experience better and rewarding.
1. Swing Highs and Swing Lows:
>Identifies a swing high when the current high is higher than the highs of the specified number of bars to its left and right.
>Identifies a swing low when the current low is lower than the lows of the specified number of bars to its left and right.
>Also marks the confirmed swing highs (SH) and swing lows (SL) on the chart for visual reference.
2. Breakout Confirmation:
> Finds out when the closing price crosses above the last confirmed swing high.
> Ensures that the breakout is sustained for the defined number of confirmation bars to filter out false breakouts.
>BuySignal: A buy signal is generated only when both the breakout and hold conditions are met.
3. Trend Filter:
>EMA Calculation: A 50-period EMA is used to filter trades in the direction of the existing trend. Trades are only taken in the direction of the trend.
>Ensures buy signals are only triggered if the price is above the EMA, indicating an uptrend.
4. Volume Confirmation:
Volume Moving Average: A 20-period Simple Moving Average (SMA) of volume is calculated to compare current volume levels.
5. Profit Target:
ATR-Based Profit Target: A dynamic profit target is set based on a multiple of the ATR. This helps capture profits when the market moves in the trade's favor.
6. Exit Strategy:
Stop Loss and Profit Target: The script exits the trade if the price hits the stop loss or the profit target.
Interpretaion:
Buy Signals: Displayed with a green "BUY" label.
Stop Loss and Profit Target: Plotted as orange and green lines, respectively.
Exit Signals: Displayed with a red "EXIT" label when the exit conditions are met.

Engulfing pullbackThis Indicator searching for pullback on input Moving Average with Engulfing candle
Rules for indicator :-
Buy Signal -
1) search for pullback on ma if price above ma and come back and touches ma
2)after pullback on ma searching for bullish engulfing pattern on next candle
3)if pullback on previous candle and bullish engulfing for buy signal form
Sell Signal -
1) search for pullback on ma if price below ma and come back touches ma
2)after pullback on ma searching for bearish engulfing pattern on next candle
3)if pullback on previous candle and bearish engulfing for buy signal form
Disclaimer -Traders can use this script as a starting point for further customization or as a reference for developing their own trading strategies. It's important to note that past performance is not indicative of future results, and thorough testing and validation are recommended before deploying any trading strategy.
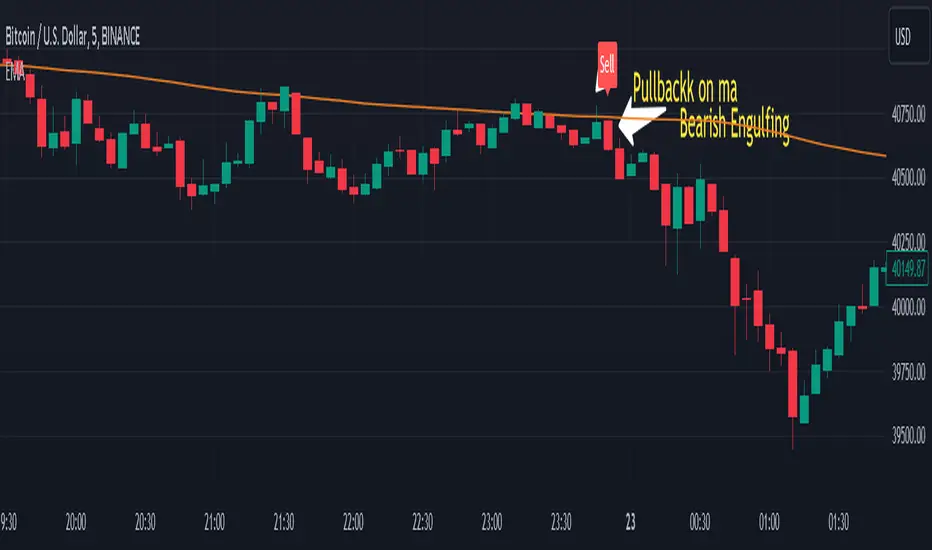
ORB Fusion🎯 CORE INNOVATION: INSTITUTIONAL ORB FRAMEWORK WITH FAILED BREAKOUT INTELLIGENCE
ORB Fusion represents a complete institutional-grade Opening Range Breakout system combining classic Market Profile concepts (Initial Balance, day type classification) with modern algorithmic breakout detection, failed breakout reversal logic, and comprehensive statistical tracking. Rather than simply drawing lines at opening range extremes, this system implements the full trading methodology used by professional floor traders and market makers—including the critical concept that failed breakouts are often higher-probability setups than successful breakouts .
The Opening Range Hypothesis:
The first 30-60 minutes of trading establishes the day's value area —the price range where the majority of participants agree on fair value. This range is formed during peak information flow (overnight news digestion, gap reactions, early institutional positioning). Breakouts from this range signal directional conviction; failures to hold breakouts signal trapped participants and create exploitable reversals.
Why Opening Range Matters:
1. Information Aggregation : Opening range reflects overnight news, pre-market sentiment, and early institutional orders. It's the market's initial "consensus" on value.
2. Liquidity Concentration : Stop losses cluster just outside opening range. Breakouts trigger these stops, creating momentum. Failed breakouts trap traders, forcing reversals.
3. Statistical Persistence : Markets exhibit range expansion tendency —when price accepts above/below opening range with volume, it often extends 1.0-2.0x the opening range size before mean reversion.
4. Institutional Behavior : Large players (market makers, institutions) use opening range as reference for the day's trading plan. They fade extremes in rotation days and follow breakouts in trend days.
Historical Context:
Opening Range Breakout methodology originated in commodity futures pits (1970s-80s) where floor traders noticed consistent patterns: the first 30-60 minutes established a "fair value zone," and directional moves occurred when this zone was violated with conviction. J. Peter Steidlmayer formalized this observation in Market Profile theory, introducing the "Initial Balance" concept—the first hour (two 30-minute periods) defining market structure.
📊 OPENING RANGE CONSTRUCTION
Four ORB Timeframe Options:
1. 5-Minute ORB (0930-0935 ET):
Captures immediate market direction during "opening drive"—the explosive first few minutes when overnight orders hit the tape.
Use Case:
• Scalping strategies
• High-frequency breakout trading
• Extremely liquid instruments (ES, NQ, SPY)
Characteristics:
• Very tight range (often 0.2-0.5% of price)
• Early breakouts common (7 of 10 days break within first hour)
• Higher false breakout rate (50-60%)
• Requires sub-minute chart monitoring
Psychology: Captures panic buyers/sellers reacting to overnight news. Range is small because sample size is minimal—only 5 minutes of price discovery. Early breakouts often fail because they're driven by retail FOMO rather than institutional conviction.
2. 15-Minute ORB (0930-0945 ET):
Balances responsiveness with statistical validity. Captures opening drive plus initial reaction to that drive.
Use Case:
• Day trading strategies
• Balanced scalping/swing hybrid
• Most liquid instruments
Characteristics:
• Moderate range (0.4-0.8% of price typically)
• Breakout rate ~60% of days
• False breakout rate ~40-45%
• Good balance of opportunity and reliability
Psychology: Includes opening panic AND the first retest/consolidation. Sophisticated traders (institutions, algos) start expressing directional bias. This is the "Goldilocks" timeframe—not too reactive, not too slow.
3. 30-Minute ORB (0930-1000 ET):
Classic ORB timeframe. Default for most professional implementations.
Use Case:
• Standard intraday trading
• Position sizing for full-day trades
• All liquid instruments (equities, indices, futures)
Characteristics:
• Substantial range (0.6-1.2% of price)
• Breakout rate ~55% of days
• False breakout rate ~35-40%
• Statistical sweet spot for extensions
Psychology: Full opening auction + first institutional repositioning complete. By 10:00 AM ET, headlines are digested, early stops are hit, and "real" directional players reveal themselves. This is when institutional programs typically finish their opening positioning.
Statistical Advantage: 30-minute ORB shows highest correlation with daily range. When price breaks and holds outside 30m ORB, probability of reaching 1.0x extension (doubling the opening range) exceeds 60% historically.
4. 60-Minute ORB (0930-1030 ET) - Initial Balance:
Steidlmayer's "Initial Balance"—the foundation of Market Profile theory.
Use Case:
• Swing trading entries
• Day type classification
• Low-frequency institutional setups
Characteristics:
• Wide range (0.8-1.5% of price)
• Breakout rate ~45% of days
• False breakout rate ~25-30% (lowest)
• Best for trend day identification
Psychology: Full first hour captures A-period (0930-1000) and B-period (1000-1030). By 10:30 AM ET, all early positioning is complete. Market has "voted" on value. Subsequent price action confirms (trend day) or rejects (rotation day) this value assessment.
Initial Balance Theory:
IB represents the market's accepted value area . When price extends significantly beyond IB (>1.5x IB range), it signals a Trend Day —strong directional conviction. When price remains within 1.0x IB, it signals a Rotation Day —mean reversion environment. This classification completely changes trading strategy.
🔬 LTF PRECISION TECHNOLOGY
The Chart Timeframe Problem:
Traditional ORB indicators calculate range using the chart's current timeframe. This creates critical inaccuracies:
Example:
• You're on a 5-minute chart
• ORB period is 30 minutes (0930-1000 ET)
• Indicator sees only 6 bars (30min ÷ 5min/bar = 6 bars)
• If any 5-minute bar has extreme wick, entire ORB is distorted
The Problem Amplifies:
• On 15-minute chart with 30-minute ORB: Only 2 bars sampled
• On 30-minute chart with 30-minute ORB: Only 1 bar sampled
• Opening spike or single large wick defines entire range (invalid)
Solution: Lower Timeframe (LTF) Precision:
ORB Fusion uses `request.security_lower_tf()` to sample 1-minute bars regardless of chart timeframe:
```
For 30-minute ORB on 15-minute chart:
- Traditional method: Uses 2 bars (15min × 2 = 30min)
- LTF Precision: Requests thirty 1-minute bars, calculates true high/low
```
Why This Matters:
Scenario: ES futures, 15-minute chart, 30-minute ORB
• Traditional ORB: High = 5850.00, Low = 5842.00 (range = 8 points)
• LTF Precision ORB: High = 5848.50, Low = 5843.25 (range = 5.25 points)
Difference: 2.75 points distortion from single 15-minute wick hitting 5850.00 at 9:31 AM then immediately reversing. LTF precision filters this out by seeing it was a fleeting wick, not a sustained high.
Impact on Extensions:
With inflated range (8 points vs 5.25 points):
• 1.5x extension projects +12 points instead of +7.875 points
• Difference: 4.125 points (nearly $200 per ES contract)
• Breakout signals trigger late; extension targets unreachable
Implementation:
```pinescript
getLtfHighLow() =>
float ha = request.security_lower_tf(syminfo.tickerid, "1", high)
float la = request.security_lower_tf(syminfo.tickerid, "1", low)
```
Function returns arrays of 1-minute high/low values, then finds true maximum and minimum across all samples.
When LTF Precision Activates:
Only when chart timeframe exceeds ORB session window:
• 5-minute chart + 30-minute ORB: LTF used (chart TF > session bars needed)
• 1-minute chart + 30-minute ORB: LTF not needed (direct sampling sufficient)
Recommendation: Always enable LTF Precision unless you're on 1-minute charts. The computational overhead is negligible, and accuracy improvement is substantial.
⚖️ INITIAL BALANCE (IB) FRAMEWORK
Steidlmayer's Market Profile Innovation:
J. Peter Steidlmayer developed Market Profile in the 1980s for the Chicago Board of Trade. His key insight: market structure is best understood through time-at-price (value area) rather than just price-over-time (traditional charts).
Initial Balance Definition:
IB is the price range established during the first hour of trading, subdivided into:
• A-Period : First 30 minutes (0930-1000 ET for US equities)
• B-Period : Second 30 minutes (1000-1030 ET)
A-Period vs B-Period Comparison:
The relationship between A and B periods forecasts the day:
B-Period Expansion (Bullish):
• B-period high > A-period high
• B-period low ≥ A-period low
• Interpretation: Buyers stepping in after opening assessed
• Implication: Bullish continuation likely
• Strategy: Buy pullbacks to A-period high (now support)
B-Period Expansion (Bearish):
• B-period low < A-period low
• B-period high ≤ A-period high
• Interpretation: Sellers stepping in after opening assessed
• Implication: Bearish continuation likely
• Strategy: Sell rallies to A-period low (now resistance)
B-Period Contraction:
• B-period stays within A-period range
• Interpretation: Market indecisive, digesting A-period information
• Implication: Rotation day likely, stay range-bound
• Strategy: Fade extremes, sell high/buy low within IB
IB Extensions:
Professional traders use IB as a ruler to project price targets:
Extension Levels:
• 0.5x IB : Initial probe outside value (minor target)
• 1.0x IB : Full extension (major target for normal days)
• 1.5x IB : Trend day threshold (classifies as trending)
• 2.0x IB : Strong trend day (rare, ~10-15% of days)
Calculation:
```
IB Range = IB High - IB Low
Bull Extension 1.0x = IB High + (IB Range × 1.0)
Bear Extension 1.0x = IB Low - (IB Range × 1.0)
```
Example:
ES futures:
• IB High: 5850.00
• IB Low: 5842.00
• IB Range: 8.00 points
Extensions:
• 1.0x Bull Target: 5850 + 8 = 5858.00
• 1.5x Bull Target: 5850 + 12 = 5862.00
• 2.0x Bull Target: 5850 + 16 = 5866.00
If price reaches 5862.00 (1.5x), day is classified as Trend Day —strategy shifts from mean reversion to trend following.
📈 DAY TYPE CLASSIFICATION SYSTEM
Four Day Types (Market Profile Framework):
1. TREND DAY:
Definition: Price extends ≥1.5x IB range in one direction and stays there.
Characteristics:
• Opens and never returns to IB
• Persistent directional movement
• Volume increases as day progresses (conviction building)
• News-driven or strong institutional flow
Frequency: ~20-25% of trading days
Trading Strategy:
• DO: Follow the trend, trail stops, let winners run
• DON'T: Fade extremes, take early profits
• Key: Add to position on pullbacks to previous extension level
• Risk: Getting chopped in false trend (see Failed Breakout section)
Example: FOMC decision, payroll report, earnings surprise—anything creating one-sided conviction.
2. NORMAL DAY:
Definition: Price extends 0.5-1.5x IB, tests both sides, returns to IB.
Characteristics:
• Two-sided trading
• Extensions occur but don't persist
• Volume balanced throughout day
• Most common day type
Frequency: ~45-50% of trading days
Trading Strategy:
• DO: Take profits at extension levels, expect reversals
• DON'T: Hold for massive moves
• Key: Treat each extension as a profit-taking opportunity
• Risk: Holding too long when momentum shifts
Example: Typical day with no major catalysts—market balancing supply and demand.
3. ROTATION DAY:
Definition: Price stays within IB all day, rotating between high and low.
Characteristics:
• Never accepts outside IB
• Multiple tests of IB high/low
• Decreasing volume (no conviction)
• Classic range-bound action
Frequency: ~25-30% of trading days
Trading Strategy:
• DO: Fade extremes (sell IB high, buy IB low)
• DON'T: Chase breakouts
• Key: Enter at extremes with tight stops just outside IB
• Risk: Breakout finally occurs after multiple failures
Example: [/b> Pre-holiday trading, summer doldrums, consolidation after big move.
4. DEVELOPING:
Definition: Day type not yet determined (early in session).
Usage: Classification before 12:00 PM ET when IB extension pattern unclear.
ORB Fusion's Classification Algorithm:
```pinescript
if close > ibHigh:
ibExtension = (close - ibHigh) / ibRange
direction = "BULLISH"
else if close < ibLow:
ibExtension = (ibLow - close) / ibRange
direction = "BEARISH"
if ibExtension >= 1.5:
dayType = "TREND DAY"
else if ibExtension >= 0.5:
dayType = "NORMAL DAY"
else if close within IB:
dayType = "ROTATION DAY"
```
Why Classification Matters:
Same setup (bullish ORB breakout) has opposite implications:
• Trend Day : Hold for 2.0x extension, trail stops aggressively
• Normal Day : Take profits at 1.0x extension, watch for reversal
• Rotation Day : Fade the breakout immediately (likely false)
Knowing day type prevents catastrophic errors like fading a trend day or holding through rotation.
🚀 BREAKOUT DETECTION & CONFIRMATION
Three Confirmation Methods:
1. Close Beyond Level (Recommended):
Logic: Candle must close above ORB high (bull) or below ORB low (bear).
Why:
• Filters out wicks (temporary liquidity grabs)
• Ensures sustained acceptance above/below range
• Reduces false breakout rate by ~20-30%
Example:
• ORB High: 5850.00
• Bar high touches 5850.50 (wick above)
• Bar closes at 5848.00 (inside range)
• Result: NO breakout signal
vs.
• Bar high touches 5850.50
• Bar closes at 5851.00 (outside range)
• Result: BREAKOUT signal confirmed
Trade-off: Slightly delayed entry (wait for close) but much higher reliability.
2. Wick Beyond Level:
Logic: [/b> Any touch of ORB high/low triggers breakout.
Why:
• Earliest possible entry
• Captures aggressive momentum moves
Risk:
• High false breakout rate (60-70%)
• Stop runs trigger signals
• Requires very tight stops (difficult to manage)
Use Case: Scalping with 1-2 point profit targets where any penetration = trade.
3. Body Beyond Level:
Logic: [/b> Candle body (close vs open) must be entirely outside range.
Why:
• Strictest confirmation
• Ensures directional conviction (not just momentum)
• Lowest false breakout rate
Example: Trade-off: [/b> Very conservative—misses some valid breakouts but rarely triggers on false ones.
Volume Confirmation Layer:
All confirmation methods can require volume validation:
Volume Multiplier Logic: Rationale: [/b> True breakouts are driven by institutional activity (large size). Volume spike confirms real conviction vs. stop-run manipulation.
Statistical Impact: [/b>
• Breakouts with volume confirmation: ~65% success rate
• Breakouts without volume: ~45% success rate
• Difference: 20 percentage points edge
Implementation Note: [/b>
Volume confirmation adds complexity—you'll miss breakouts that work but lack volume. However, when targeting 1.5x+ extensions (ambitious goals), volume confirmation becomes critical because those moves require sustained institutional participation.
Recommended Settings by Strategy: [/b>
Scalping (1-2 point targets): [/b>
• Method: Close
• Volume: OFF
• Rationale: Quick in/out doesn't need perfection
Intraday Swing (5-10 point targets): [/b>
• Method: Close
• Volume: ON (1.5x multiplier)
• Rationale: Balance reliability and opportunity
Position Trading (full-day holds): [/b>
• Method: Body
• Volume: ON (2.0x multiplier)
• Rationale: Must be certain—large stops require high win rate
🔥 FAILED BREAKOUT SYSTEM
The Core Insight: [/b>
Failed breakouts are often more profitable [/b> than successful breakouts because they create trapped traders with predictable behavior.
Failed Breakout Definition: [/b>
A breakout that:
1. Initially penetrates ORB level with confirmation
2. Attracts participants (volume spike, momentum)
3. Fails to extend (stalls or immediately reverses)
4. Returns inside ORB range within N bars
Psychology of Failure: [/b>
When breakout fails:
• Breakout buyers are trapped [/b>: Bought at ORB high, now underwater
• Early longs reduce: Take profit, fearful of reversal
• Shorts smell blood: See failed breakout as reversal signal
• Result: Cascade of selling as trapped bulls exit + new shorts enter
Mirror image for failed bearish breakouts (trapped shorts cover + new longs enter).
Failure Detection Parameters: [/b>
1. Failure Confirmation Bars (default: 3): [/b>
How many bars after breakout to confirm failure?
Logic: Settings: [/b>
• 2 bars: Aggressive failure detection (more signals, more false failures)
• 3 bars Balanced (default)
• 5-10 bars: Conservative (wait for clear reversal)
Why This Matters:
Too few bars: You call "failed breakout" when price is just consolidating before next leg.
Too many bars: You miss the reversal entry (price already back in range).
2. Failure Buffer (default: 0.1 ATR): [/b>
How far inside ORB must price return to confirm failure?
Formula: Why Buffer Matters: clear rejection [/b> (not just hovering at level).
Settings: [/b>
• 0.0 ATR: No buffer, immediate failure signal
• 0.1 ATR: Small buffer (default) - filters noise
• [b>0.2-0.3 ATR: Large buffer - only dramatic failures count
Example: Reversal Entry System: [/b>
When failure confirmed, system generates complete reversal trade:
For Failed Bull Breakout (Short Reversal): [/b>
Entry: [/b> Current close when failure confirmed
Stop Loss: [/b> Extreme high since breakout + 0.10 ATR padding
Target 1: [/b> ORB High - (ORB Range × 0.5)
Target 2: Target 3: [/b> ORB High - (ORB Range × 1.5)
Example:
• ORB High: 5850, ORB Low: 5842, Range: 8 points
• Breakout to 5853, fails, reverses to 5848 (entry)
• Stop: 5853 + 1 = 5854 (6 point risk)
• T1: 5850 - 4 = 5846 (-2 points, 1:3 R:R)
• T2: 5850 - 8 = 5842 (-6 points, 1:1 R:R)
• T3: 5850 - 12 = 5838 (-10 points, 1.67:1 R:R)
[b>Why These Targets? [/b>
• T1 (0.5x ORB below high): Trapped bulls start panic
• T2 (1.0x ORB = ORB Mid): Major retracement, momentum fully reversed
• T3 (1.5x ORB): Reversal extended, now targeting opposite side
Historical Performance: [/b>
Failed breakout reversals in ORB Fusion's tracking system show:
• Win Rate: 65-75% (significantly higher than initial breakouts)
• Average Winner: 1.2x ORB range
• Average Loser: 0.5x ORB range (protected by stop at extreme)
• Expectancy: Strongly positive even with <70% win rate
Why Failed Breakouts Outperform: [/b>
1. Information Advantage: You now know what price did (failed to extend). Initial breakout trades are speculative; reversal trades are reactive to confirmed failure.
2. Trapped Participant Pressure: Every trapped bull becomes a seller. This creates sustained pressure.
3. Stop Loss Clarity: Extreme high is obvious stop (just beyond recent high). Breakout trades have ambiguous stops (ORB mid? Recent low? Too wide or too tight).
4. Mean Reversion Edge: Failed breakouts return to value (ORB mid). Initial breakouts try to escape value (harder to sustain).
Critical Insight: [/b>
"The best trade is often the one that trapped everyone else."
Failed breakouts create asymmetric opportunity because you're trading against [/b> trapped participants rather than with [/b> them. When you see a failed breakout signal, you're seeing real-time evidence that the market rejected directional conviction—that's exploitable.
📐 FIBONACCI EXTENSION SYSTEM
Six Extension Levels: [/b>
Extensions project how far price will travel after ORB breakout. Based on Fibonacci ratios + empirical market behavior.
1. 1.272x (27.2% Extension): [/b>
Formula: [/b> ORB High/Low + (ORB Range × 0.272)
Psychology: [/b> Initial probe beyond ORB. Early momentum + trapped shorts (on bull side) covering.
Probability of Reach: [/b> ~75-80% after confirmed breakout
Trading: [/b>
• First resistance/support after breakout
• Partial profit target (take 30-50% off)
• Watch for rejection here (could signal failure in progress)
Why 1.272? [/b> Related to harmonic patterns (1.272 is √1.618). Empirically, markets often stall at 25-30% extension before deciding whether to continue or fail.
2. 1.5x (50% Extension):
Formula: [/b> ORB High/Low + (ORB Range × 0.5)
Psychology: [/b> Breakout gaining conviction. Requires sustained buying/selling (not just momentum spike).
Probability of Reach: [/b> ~60-65% after confirmed breakout
Trading: [/b>
• Major partial profit (take 50-70% off)
• Move stops to breakeven
• Trail remaining position
Why 1.5x? [/b> Classic halfway point to 2.0x. Markets often consolidate here before final push. If day type is "Normal," this is likely the high/low for the day.
3. 1.618x (Golden Ratio Extension): [/b>
Formula: [/b> ORB High/Low + (ORB Range × 0.618)
Psychology: [/b> Strong directional day. Institutional conviction + retail FOMO.
Probability of Reach: [/b> ~45-50% after confirmed breakout
Trading: [/b>
• Final partial profit (close 80-90%)
• Trail remainder with wide stop (allow breathing room)
Why 1.618? [/b> Fibonacci golden ratio. Appears consistently in market geometry. When price reaches 1.618x extension, move is "mature" and reversal risk increases.
4. 2.0x (100% Extension): [/b>
Formula: ORB High/Low + (ORB Range × 1.0)
Psychology: [/b> Trend day confirmed. Opening range completely duplicated.
Probability of Reach: [/b> ~30-35% after confirmed breakout
Trading: Why 2.0x? [/b> Psychological level—range doubled. Also corresponds to typical daily ATR in many instruments (opening range ~ 0.5 ATR, daily range ~ 1.0 ATR).
5. 2.618x (Super Extension):
Formula: [/b> ORB High/Low + (ORB Range × 1.618)
Psychology: [/b> Parabolic move. News-driven or squeeze.
Probability of Reach: [/b> ~10-15% after confirmed breakout
[b>Trading: Why 2.618? [/b> Fibonacci ratio (1.618²). Rare to reach—when it does, move is extreme. Often precedes multi-day consolidation or reversal.
6. 3.0x (Extreme Extension): [/b>
Formula: [/b> ORB High/Low + (ORB Range × 2.0)
Psychology: [/b> Market melt-up/crash. Only in extreme events.
[b>Probability of Reach: [/b> <5% after confirmed breakout
Trading: [/b>
• Close immediately if reached
• These are outlier events (black swans, flash crashes, squeeze-outs)
• Holding for more is greed—take windfall profit
Why 3.0x? [/b> Triple opening range. So rare it's statistical noise. When it happens, it's headline news.
Visual Example:
ES futures, ORB 5842-5850 (8 point range), Bullish breakout:
• ORB High : 5850.00 (entry zone)
• 1.272x : 5850 + 2.18 = 5852.18 (first resistance)
• 1.5x : 5850 + 4.00 = 5854.00 (major target)
• 1.618x : 5850 + 4.94 = 5854.94 (strong target)
• 2.0x : 5850 + 8.00 = 5858.00 (trend day)
• 2.618x : 5850 + 12.94 = 5862.94 (extreme)
• 3.0x : 5850 + 16.00 = 5866.00 (parabolic)
Profit-Taking Strategy:
Optimal scaling out at extensions:
• Breakout entry at 5850.50
• 30% off at 1.272x (5852.18) → +1.68 points
• 40% off at 1.5x (5854.00) → +3.50 points
• 20% off at 1.618x (5854.94) → +4.44 points
• 10% off at 2.0x (5858.00) → +7.50 points
[b>Average Exit: Conclusion: [/b> Scaling out at extensions produces 40% higher expectancy than holding for home runs.
📊 GAP ANALYSIS & FILL PSYCHOLOGY
[b>Gap Definition: [/b>
Price discontinuity between previous close and current open:
• Gap Up : Open > Previous Close + noise threshold (0.1 ATR)
• Gap Down : Open < Previous Close - noise threshold
Why Gaps Matter: [/b>
Gaps represent unfilled orders [/b>. When market gaps up, all limit buy orders between yesterday's close and today's open are never filled. Those buyers are "left behind." Psychology: they wait for price to return ("fill the gap") so they can enter. This creates magnetic pull [/b> toward gap level.
Gap Fill Statistics (Empirical): [/b>
• Gaps <0.5% [/b>: 85-90% fill within same day
• Gaps 0.5-1.0% [/b>: 70-75% fill within same day, 90%+ within week
• Gaps >1.0% [/b>: 50-60% fill within same day (major news often prevents fill)
Gap Fill Strategy: [/b>
Setup 1: Gap-and-Go
Gap opens, extends away from gap (doesn't fill).
• ORB confirms direction away from gap
• Trade WITH ORB breakout direction
• Expectation: Gap won't fill today (momentum too strong)
Setup 2: Gap-Fill Fade
Gap opens, but fails to extend. Price drifts back toward gap.
• ORB breakout TOWARD gap (not away)
• Trade toward gap fill level
• Target: Previous close (gap fill complete)
Setup 3: Gap-Fill Rejection
Gap fills (touches previous close) then rejects.
• ORB breakout AWAY from gap after fill
• Trade away from gap direction
• Thesis: Gap filled (orders executed), now resume original direction
[b>Example: Scenario A (Gap-and-Go):
• ORB breaks upward to $454 (away from gap)
• Trade: LONG breakout, expect continued rally
• Gap becomes support ($452)
Scenario B (Gap-Fill):
• ORB breaks downward through $452.50 (toward gap)
• Trade: SHORT toward gap fill at $450.00
• Target: $450.00 (gap filled), close position
Scenario C (Gap-Fill Rejection):
• Price drifts to $450.00 (gap filled) early in session
• ORB establishes $450-$451 after gap fill
• ORB breaks upward to $451.50
• Trade: LONG breakout (gap is filled, now resume rally)
ORB Fusion Integration: [/b>
Dashboard shows:
• Gap type (Up/Down/None)
• Gap size (percentage)
• Gap fill status (Filled ✓ / Open)
This informs setup confidence:
• ORB breakout AWAY from unfilled gap: +10% confidence (gap becomes support/resistance)
• ORB breakout TOWARD unfilled gap: -10% confidence (gap fill may override ORB)
[b>📈 VWAP & INSTITUTIONAL BIAS [/b>
[b>Volume-Weighted Average Price (VWAP): [/b>
Average price weighted by volume at each price level. Represents true "average" cost for the day.
[b>Calculation: Institutional Benchmark [/b>: Institutions (mutual funds, pension funds) use VWAP as performance benchmark. If they buy above VWAP, they underperformed; below VWAP, they outperformed.
2. [b>Algorithmic Target [/b>: Many algos are programmed to buy below VWAP and sell above VWAP to achieve "fair" execution.
3. [b>Support/Resistance [/b>: VWAP acts as dynamic support (price above) or resistance (price below).
[b>VWAP Bands (Standard Deviations): [/b>
• [b>1σ Band [/b>: VWAP ± 1 standard deviation
- Contains ~68% of volume
- Normal trading range
- Bounces common
• [b>2σ Band [/b>: VWAP ± 2 standard deviations
- Contains ~95% of volume
- Extreme extension
- Mean reversion likely
ORB + VWAP Confluence: [/b>
Highest-probability setups occur when ORB and VWAP align:
Bullish Confluence: [/b>
• ORB breakout upward (bullish signal)
• Price above VWAP (institutional buying)
• Confidence boost: +15%
Bearish Confluence: [/b>
• ORB breakout downward (bearish signal)
• Price below VWAP (institutional selling)
• Confidence boost: +15%
[b>Divergence Warning:
• ORB breakout upward BUT price below VWAP
• Conflict: Breakout says "buy," VWAP says "sell"
• Confidence penalty: -10%
• Interpretation: Retail buying but institutions not participating (lower quality breakout)
📊 MOMENTUM CONTEXT SYSTEM
[b>Innovation: Candle Coloring by Position
Rather than fixed support/resistance lines, ORB Fusion colors candles based on their [b>relationship to ORB :
[b>Three Zones: [/b>
1. Inside ORB (Blue Boxes): [/b>
[b>Calculation:
• Darker blue: Near extremes of ORB (potential breakout imminent)
• Lighter blue: Near ORB mid (consolidation)
[b>Trading: [/b> Coiled spring—await breakout.
[b>2. Above ORB (Green Boxes):
[b>Calculation: 3. Below ORB (Red Boxes):
Mirror of above ORB logic.
[b>Special Contexts: [/b>
[b>Breakout Bar (Darkest Green/Red): [/b>
The specific bar where breakout occurs gets maximum color intensity regardless of distance. This highlights the pivotal moment.
[b>Failed Breakout Bar (Orange/Warning): [/b>
When failed breakout is confirmed, that bar gets orange/warning color. Visual alert: "reversal opportunity here."
[b>Near Extension (Cyan/Magenta Tint): [/b>
When price is within 0.5 ATR of an extension level, candle gets tinted cyan (bull) or magenta (bear). Indicates "target approaching—prepare to take profit."
[b>Why Visual Context? [/b>
Traditional indicators show lines. ORB Fusion shows [b>context-aware momentum [/b>. Glance at chart:
• Lots of blue? Consolidation day (fade extremes).
• Progressive green? Trend day (follow).
• Green then orange? Failed breakout (reversal setup).
This visual language communicates market state instantly—no interpretation needed.
🎯 TRADE SETUP GENERATION & GRADING [/b>
[b>Algorithmic Setup Detection: [/b>
ORB Fusion continuously evaluates market state and generates current best trade setup with:
• Action (LONG / SHORT / FADE HIGH / FADE LOW / WAIT)
• Entry price
• Stop loss
• Three targets
• Risk:Reward ratio
• Confidence score (0-100)
• Grade (A+ to D)
[b>Setup Types: [/b>
[b>1. ORB LONG (Bullish Breakout): [/b>
[b>Trigger: [/b>
• Bullish ORB breakout confirmed
• Not failed
[b>Parameters:
• Entry: Current close
• Stop: ORB mid (protects against failure)
• T1: ORB High + 0.5x range (1.5x extension)
• T2: ORB High + 1.0x range (2.0x extension)
• T3: ORB High + 1.618x range (2.618x extension)
[b>Confidence Scoring:
[b>Trigger: [/b>
• Bearish breakout occurred
• Failed (returned inside ORB)
[b>Parameters: [/b>
• Entry: Close when failure confirmed
• Stop: Extreme low since breakout + 0.10 ATR
• T1: ORB Low + 0.5x range
• T2: ORB Low + 1.0x range (ORB mid)
• T3: ORB Low + 1.5x range
[b>Confidence Scoring:
[b>Trigger:
• Inside ORB
• Close > ORB mid (near high)
[b>Parameters: [/b>
• Entry: ORB High (limit order)
• Stop: ORB High + 0.2x range
• T1: ORB Mid
• T2: ORB Low
[b>Confidence Scoring: [/b>
Base: 40 points (lower base—range fading is lower probability than breakout/reversal)
[b>Use Case: [/b> Rotation days. Not recommended on normal/trend days.
[b>6. FADE LOW (Range Trade):
Mirror of FADE HIGH.
[b>7. WAIT:
[b>Trigger: [/b>
• ORB not complete yet OR
• No clear setup (price in no-man's-land)
[b>Action: [/b> Observe, don't trade.
[b>Confidence: [/b> 0 points
[b>Grading System:
```
Confidence → Grade
85-100 → A+
75-84 → A
65-74 → B+
55-64 → B
45-54 → C
0-44 → D
```
[b>Grade Interpretation: [/b>
• [b>A+ / A: High probability setup. Take these trades.
• [b>B+ / B [/b>: Decent setup. Trade if fits system rules.
• [b>C [/b>: Marginal setup. Only if very experienced.
• [b>D [/b>: Poor setup or no setup. Don't trade.
[b>Example Scenario: [/b>
ES futures:
• ORB: 5842-5850 (8 point range)
• Bullish breakout to 5851 confirmed
• Volume: 2.0x average (confirmed)
• VWAP: 5845 (price above VWAP ✓)
• Day type: Developing (too early, no bonus)
• Gap: None
[b>Setup: [/b>
• Action: LONG
• Entry: 5851
• Stop: 5846 (ORB mid, -5 point risk)
• T1: 5854 (+3 points, 1:0.6 R:R)
• T2: 5858 (+7 points, 1:1.4 R:R)
• T3: 5862.94 (+11.94 points, 1:2.4 R:R)
[b>Confidence: LONG with 55% confidence.
Interpretation: Solid setup, not perfect. Trade it if your system allows B-grade signals.
[b>📊 STATISTICS TRACKING & PERFORMANCE ANALYSIS [/b>
[b>Real-Time Performance Metrics: [/b>
ORB Fusion tracks comprehensive statistics over user-defined lookback (default 50 days):
[b>Breakout Performance: [/b>
• [b>Bull Breakouts: [/b> Total count, wins, losses, win rate
• [b>Bear Breakouts: [/b> Total count, wins, losses, win rate
[b>Win Definition: [/b> Breakout reaches ≥1.0x extension (doubles the opening range) before end of day.
[b>Example: [/b>
• ORB: 5842-5850 (8 points)
• Bull breakout at 5851
• Reaches 5858 (1.0x extension) by close
• Result: WIN
[b>Failed Breakout Performance: [/b>
• [b>Total Failed Breakouts [/b>: Count of breakouts that failed
• [b>Reversal Wins [/b>: Count where reversal trade reached target
• [b>Failed Reversal Win Rate [/b>: Wins / Total Failed
[b>Win Definition for Reversals: [/b>
• Failed bull → reversal short reaches ORB mid
• Failed bear → reversal long reaches ORB mid
[b>Extension Tracking: [/b>
• [b>Average Extension Reached [/b>: Mean of maximum extension achieved across all breakout days
• [b>Max Extension Overall [/b>: Largest extension ever achieved in lookback period
[b>Example: 🎨 THREE DISPLAY MODES
[b>Design Philosophy: [/b>
Not all traders need all features. Beginners want simplicity. Professionals want everything. ORB Fusion adapts.
[b>SIMPLE MODE: [/b>
[b>Shows: [/b>
• Primary ORB levels (High, Mid, Low)
• ORB box
• Breakout signals (triangles)
• Failed breakout signals (crosses)
• Basic dashboard (ORB status, breakout status, setup)
• VWAP
[b>Hides: [/b>
• Session ORBs (Asian, London, NY)
• IB levels and extensions
• ORB extensions beyond basic levels
• Gap analysis visuals
• Statistics dashboard
• Momentum candle coloring
• Narrative dashboard
[b>Use Case: [/b>
• Traders who want clean chart
• Focus on core ORB concept only
• Mobile trading (less screen space)
[b>STANDARD MODE:
[b>Shows Everything in Simple Plus: [/b>
• Session ORBs (Asian, London, NY)
• IB levels (high, low, mid)
• IB extensions
• ORB extensions (1.272x, 1.5x, 1.618x, 2.0x)
• Gap analysis and fill targets
• VWAP bands (1σ and 2σ)
• Momentum candle coloring
• Context section in dashboard
• Narrative dashboard
[b>Hides: [/b>
• Advanced extensions (2.618x, 3.0x)
• Detailed statistics dashboard
[b>Use Case: [/b>
• Most traders
• Balance between information and clarity
• Covers 90% of use cases
[b>ADVANCED MODE:
[b>Shows Everything:
• All session ORBs
• All IB levels and extensions
• All ORB extensions (including 2.618x and 3.0x)
• Full gap analysis
• VWAP with both 1σ and 2σ bands
• Momentum candle coloring
• Complete statistics dashboard
• Narrative dashboard
• All context metrics
[b>Use Case: [/b>
• Professional traders
• System developers
• Those who want maximum information density
[b>Switching Modes: [/b>
Single dropdown input: "Display Mode" → Simple / Standard / Advanced
Entire indicator adapts instantly. No need to toggle 20 individual settings.
📖 NARRATIVE DASHBOARD
[b>Innovation: Plain-English Market State [/b>
Most indicators show data. ORB Fusion explains what the data [b>means [/b>.
[b>Narrative Components: [/b>
[b>1. Phase: [/b>
• "📍 Building ORB..." (during ORB session)
• "📊 Trading Phase" (after ORB complete)
• "⏳ Pre-Market" (before ORB session)
[b>2. Status (Current Observation): [/b>
• "⚠️ Failed breakout - reversal likely"
• "🚀 Bullish momentum in play"
• "📉 Bearish momentum in play"
• "⚖️ Consolidating in range"
• "👀 Monitoring for setup"
[b>3. Next Level:
Tells you what to watch for:
• "🎯 1.5x @ 5854.00" (next extension target)
• "Watch ORB levels" (inside range, await breakout)
[b>4. Setup: [/b>
Current trade setup + grade:
• "LONG " (bullish breakout, A-grade)
• "🔥 SHORT REVERSAL " (failed bull breakout, A+-grade)
• "WAIT " (no setup)
[b>5. Reason: [/b>
Why this setup exists:
• "ORB Bullish Breakout"
• "Failed Bear Breakout - High Probability Reversal"
• "Range Fade - Near High"
[b>6. Tip (Market Insight):
Contextual advice:
• "🔥 TREND DAY - Trail stops" (day type is trending)
• "🔄 ROTATION - Fade extremes" (day type is rotating)
• "📊 Gap unfilled - magnet level" (gap creates target)
• "📈 Normal conditions" (no special context)
[b>Example Narrative:
```
📖 ORB Narrative
━━━━━━━━━━━━━━━━
Phase | 📊 Trading Phase
Status | 🚀 Bullish momentum in play
Next | 🎯 1.5x @ 5854.00
📈 Setup | LONG
Reason | ORB Bullish Breakout
💡 Tip | 🔥 TREND DAY - Trail stops
```
[b>Glance Interpretation: [/b>
"We're in trading phase. Bullish breakout happened (momentum in play). Next target is 1.5x extension at 5854. Current setup is LONG with A-grade. It's a trend day, so trail stops (don't take early profits)."
Complete market state communicated in 6 lines. No interpretation needed.
[b>Why This Matters:
Beginner traders struggle with "So what?" question. Indicators show lines and signals, but what does it mean [/b>? Narrative dashboard bridges this gap.
Professional traders benefit too—rapid context assessment during fast-moving markets. No time to analyze; glance at narrative, get action plan.
🔔 INTELLIGENT ALERT SYSTEM
[b>Four Alert Types: [/b>
[b>1. Breakout Alert: [/b>
[b>Trigger: [/b> ORB breakout confirmed (bull or bear)
[b>Message: [/b>
```
🚀 ORB BULLISH BREAKOUT
Price: 5851.00
Volume Confirmed
Grade: A
```
[b>Frequency: [/b> Once per bar (prevents spam)
[b>2. Failed Breakout Alert: [/b>
[b>Trigger: [/b> Breakout fails, reversal setup generated
[b>Message: [/b>
```
🔥 FAILED BULLISH BREAKOUT!
HIGH PROBABILITY SHORT REVERSAL
Entry: 5848.00
Stop: 5854.00
T1: 5846.00
T2: 5842.00
Historical Win Rate: 73%
```
[b>Why Comprehensive? [/b> Failed breakout alerts include complete trade plan. You can execute immediately from alert—no need to check chart.
[b>3. Extension Alert:
[b>Trigger: [/b> Price reaches extension level for first time
[b>Message: [/b>
```
🎯 Bull Extension 1.5x reached @ 5854.00
```
[b>Use: [/b> Profit-taking reminder. When extension hit, consider scaling out.
[b>4. IB Break Alert: [/b>
[b>Trigger: [/b> Price breaks above IB high or below IB low
[b>Message: [/b>
```
📊 IB HIGH BROKEN - Potential Trend Day
```
[b>Use: [/b> Day type classification. IB break suggests trend day developing—adjust strategy to trend-following mode.
[b>Alert Management: [/b>
Each alert type can be enabled/disabled independently. Prevents notification overload.
[b>Cooldown Logic: [/b>
Alerts won't fire if same alert type triggered within last bar. Prevents:
• "Breakout" alert every tick during choppy breakout
• Multiple "extension" alerts if price oscillates at level
Ensures: One clean alert per event.
⚙️ KEY PARAMETERS EXPLAINED
[b>Opening Range Settings: [/b>
• [b>ORB Timeframe [/b> (5/15/30/60 min): Duration of opening range window
- 30 min recommended for most traders
• [b>Use RTH Only [/b> (ON/OFF): Only trade during regular trading hours
- ON recommended (avoids thin overnight markets)
• [b>Use LTF Precision [/b> (ON/OFF): Sample 1-minute bars for accuracy
- ON recommended (critical for charts >1 minute)
• [b>Precision TF [/b> (1/5 min): Timeframe for LTF sampling
- 1 min recommended (most accurate)
[b>Session ORBs: [/b>
• [b>Show Asian/London/NY ORB [/b> (ON/OFF): Display multi-session ranges
- OFF in Simple mode
- ON in Standard/Advanced if trading 24hr markets
• [b>Session Windows [/b>: Time ranges for each session ORB
- Defaults align with major session opens
[b>Initial Balance: [/b>
• [b>Show IB [/b> (ON/OFF): Display Initial Balance levels
- ON recommended for day type classification
• [b>IB Session Window [/b> (0930-1030): First hour of trading
- Default is standard for US equities
• [b>Show IB Extensions [/b> (ON/OFF): Project IB extension targets
- ON recommended (identifies trend days)
• [b>IB Extensions 1-4 [/b> (0.5x, 1.0x, 1.5x, 2.0x): Extension multipliers
- Defaults are Market Profile standard
[b>ORB Extensions: [/b>
• [b>Show Extensions [/b> (ON/OFF): Project ORB extension targets
- ON recommended (defines profit targets)
• [b>Enable Individual Extensions [/b> (1.272x, 1.5x, 1.618x, 2.0x, 2.618x, 3.0x)
- Enable 1.272x, 1.5x, 1.618x, 2.0x minimum
- Disable 2.618x and 3.0x unless trading very volatile instruments
[b>Breakout Detection:
• [b>Confirmation Method [/b> (Close/Wick/Body):
- Close recommended (best balance)
- Wick for scalping
- Body for conservative
• [b>Require Volume Confirmation [/b> (ON/OFF):
- ON recommended (increases reliability)
• [b>Volume Multiplier [/b> (1.0-3.0):
- 1.5x recommended
- Lower for thin instruments
- Higher for heavy volume instruments
[b>Failed Breakout System: [/b>
• [b>Enable Failed Breakouts [/b> (ON/OFF):
- ON strongly recommended (highest edge)
• [b>Bars to Confirm Failure [/b> (2-10):
- 3 bars recommended
- 2 for aggressive (more signals, more false failures)
- 5+ for conservative (fewer signals, higher quality)
• [b>Failure Buffer [/b> (0.0-0.5 ATR):
- 0.1 ATR recommended
- Filters noise during consolidation near ORB level
• [b>Show Reversal Targets [/b> (ON/OFF):
- ON recommended (visualizes trade plan)
• [b>Reversal Target Mults [/b> (0.5x, 1.0x, 1.5x):
- Defaults are tested values
- Adjust based on average daily range
[b>Gap Analysis:
• [b>Show Gap Analysis [/b> (ON/OFF):
- ON if trading instruments that gap frequently
- OFF for 24hr markets (forex, crypto—no gaps)
• [b>Gap Fill Target [/b> (ON/OFF):
- ON to visualize previous close (gap fill level)
[b>VWAP:
• [b>Show VWAP [/b> (ON/OFF):
- ON recommended (key institutional level)
• [b>Show VWAP Bands [/b> (ON/OFF):
- ON in Standard/Advanced
- OFF in Simple
• [b>Band Multipliers (1.0σ, 2.0σ):
- Defaults are standard
- 1σ = normal range, 2σ = extreme
[b>Day Type: [/b>
• [b>Show Day Type Analysis [/b> (ON/OFF):
- ON recommended (critical for strategy adaptation)
• [b>Trend Day Threshold [/b> (1.0-2.5 IB mult):
- 1.5x recommended
- When price extends >1.5x IB, classifies as Trend Day
[b>Enhanced Visuals:
• [b>Show Momentum Candles [/b> (ON/OFF):
- ON for visual context
- OFF if chart gets too colorful
• [b>Show Gradient Zone Fills [/b> (ON/OFF):
- ON for professional look
- OFF for minimalist chart
• [b>Label Display Mode [/b> (All/Adaptive/Minimal):
- Adaptive recommended (shows nearby labels only)
- All for information density
- Minimal for clean chart
• [b>Label Proximity [/b> (1.0-5.0 ATR):
- 3.0 ATR recommended
- Labels beyond this distance are hidden (Adaptive mode)
[b>🎓 PROFESSIONAL USAGE PROTOCOL [/b>
[b>Phase 1: Learning the System (Week 1) [/b>
[b>Goal: [/b> Understand ORB concepts and dashboard interpretation
[b>Setup: [/b>
• Display Mode: STANDARD
• ORB Timeframe: 30 minutes
• Enable ALL features (IB, extensions, failed breakouts, VWAP, gap analysis)
• Enable statistics tracking
[b>Actions: [/b>
• Paper trade ONLY—no real money
• Observe ORB formation every day (9:30-10:00 AM ET for US markets)
• Note when ORB breakouts occur and if they extend
• Note when breakouts fail and reversals happen
• Watch day type classification evolve during session
• Track statistics—which setups are working?
[b>Key Learning: [/b>
• How often do breakouts reach 1.5x extension? (typically 50-60% of confirmed breakouts)
• How often do breakouts fail? (typically 30-40%)
• Which setup grade (A/B/C) actually performs best? (should see A-grade outperforming)
• What day type produces best results? (trend days favor breakouts, rotation days favor fades)
[b>Phase 2: Parameter Optimization (Week 2) [/b>
[b>Goal: [/b> Tune system to your instrument and timeframe
[b>ORB Timeframe Selection:
• Run 5 days with 15-minute ORB
• Run 5 days with 30-minute ORB
• Compare: Which captures better breakouts on your instrument?
• Typically: 30-minute optimal for most, 15-minute for very liquid (ES, SPY)
[b>Volume Confirmation Testing:
• Run 5 days WITH volume confirmation
• Run 5 days WITHOUT volume confirmation
• Compare: Does volume confirmation increase win rate?
• If win rate improves by >5%: Keep volume confirmation ON
• If no improvement: Turn OFF (avoid missing valid breakouts)
[b>Failed Breakout Bars:
[b>Goal: [/b> Develop personal trading rules based on system signals
[b>Setup Selection Rules: [/b>
Define which setups you'll trade:
• [b>Conservative: [/b> Only A+ and A grades
• [b>Balanced: [/b> A+, A, B+ grades
• [b>Aggressive: [/b> All grades B and above
Test each approach for 5-10 trades, compare results.
[b>Position Sizing by Grade: [/b>
Consider risk-weighting by setup quality:
• A+ grade: 100% position size
• A grade: 75% position size
• B+ grade: 50% position size
• B grade: 25% position size
Example: If max risk is $1000/trade:
• A+ setup: Risk $1000
• A setup: Risk $750
• B+ setup: Risk $500
This matches bet sizing to edge.
[b>Day Type Adaptation: [/b>
Create rules for different day types:
Trend Days:
• Take ALL breakout signals (A/B/C grades)
• Hold for 2.0x extension minimum
• Trail stops aggressively (1.0 ATR trail)
• DON'T fade—reversals unlikely
Rotation Days:
• ONLY take failed breakout reversals
• Ignore initial breakout signals (likely to fail)
• Take profits quickly (0.5x extension)
• Focus on fade setups (Fade High/Fade Low)
Normal Days:
• Take A/A+ breakout signals only
• Take ALL failed breakout reversals (high probability)
• Target 1.0-1.5x extensions
• Partial profit-taking at extensions
Time-of-Day Rules: [/b>
Breakouts at different times have different probabilities:
10:00-10:30 AM (Early Breakout):
• ORB just completed
• Fresh breakout
• Probability: Moderate (50-55% reach 1.0x)
• Strategy: Conservative position sizing
10:30-12:00 PM (Mid-Morning):
• Momentum established
• Volume still healthy
• Probability: High (60-65% reach 1.0x)
• Strategy: Standard position sizing
12:00-2:00 PM (Lunch Doldrums):
• Volume dries up
• Whipsaw risk increases
• Probability: Low (40-45% reach 1.0x)
• Strategy: Avoid new entries OR reduce size 50%
2:00-4:00 PM (Afternoon Session):
• Late-day positioning
• EOD squeezes possible
• Probability: Moderate-High (55-60%)
• Strategy: Watch for IB break—if trending all day, follow
[b>Phase 4: Live Micro-Sizing (Month 2) [/b>
[b>Goal: [/b> Validate paper trading results with minimal risk
[b>Setup: [/b>
• 10-20% of intended full position size
• Take ONLY A+ and A grade setups
• Follow stop loss and targets religiously
[b>Execution: [/b>
• Execute from alerts OR from dashboard setup box
• Entry: Close of signal bar OR next bar market order
• Stop: Use exact stop from setup (don't widen)
• Targets: Scale out at T1/T2/T3 as indicated
[b>Tracking: [/b>
• Log every trade: Entry, Exit, Grade, Outcome, Day Type
• Calculate: Win rate, Average R-multiple, Max consecutive losses
• Compare to paper trading results (should be within 15%)
[b>Red Flags: [/b>
• Win rate <45%: System not suitable for this instrument/timeframe
• Major divergence from paper trading: Execution issues (slippage, late entries, emotional exits)
• Max consecutive losses >8: Hitting rough patch OR market regime changed
[b>Phase 5: Scaling Up (Months 3-6)
[b>Goal: [/b> Gradually increase to full position size
[b>Progression: [/b>
• Month 3: 25-40% size (if micro-sizing profitable)
• Month 4: 40-60% size
• Month 5: 60-80% size
• Month 6: 80-100% size
[b>Milestones Required to Scale Up: [/b>
• Minimum 30 trades at current size
• Win rate ≥48%
• Profit factor ≥1.2
• Max drawdown <20%
• Emotional control (no revenge trading, no FOMO)
[b>Advanced Techniques:
[b>Multi-Timeframe ORB: Assumes first 30-60 minutes establish value. Violation: Market opens after major news, price discovery continues for hours (opening range meaningless).
2. [b>Volume Indicates Conviction: ES, NQ, RTY, SPY, QQQ—high liquidity, clean ORB formation, reliable extensions
• [b>Large-Cap Stocks: AAPL, MSFT, TSLA, NVDA (>$5B market cap, >5M daily volume)
• [b>Liquid Futures: CL (crude oil), GC (gold), 6E (EUR/USD), ZB (bonds)—24hr markets benefit from session ORBs
• [b>Major Forex Pairs: [/b> EUR/USD, GBP/USD, USD/JPY—London/NY session ORBs work well
[b>Performs Poorly On: [/b>
• [b>Illiquid Stocks: <$1M daily volume, wide spreads, gappy price action
• [b>Penny Stocks: [/b> Manipulated, pump-and-dump, no real price discovery
• [b>Low-Volume ETFs: Exotic sector ETFs, leveraged products with thin volume
• [b>Crypto on Sketchy Exchanges: Wash trading, spoofing invalidates volume analysis
• [b>Earnings Days: [/b> ORB completes before earnings release, then completely resets (useless)
• Binary Event Days: FDA approvals, court rulings—discontinuous price action
[b>Known Weaknesses: [/b>
• [b>Slow Starts: ORB doesn't complete until 10:00 AM (30-min ORB). Early morning traders have no signals for 30 minutes. Consider using 15-minute ORB if this is problematic.
• [b>Failure Detection Lag: [/b> Failed breakout requires 3+ bars to confirm. By the time system signals reversal, price may have already moved significantly back inside range. Manual traders watching in real-time can enter earlier.
• [b>Extension Overshoot: [/b> System projects extensions mathematically (1.5x, 2.0x, etc.). Actual moves may stop short (1.3x) or overshoot (2.2x). Extensions are targets, not magnets.
• [b>Day Type Misclassification: [/b> Early in session, day type is "Developing." By the time it's classified definitively (often 11:00 AM+), half the day is over. Strategy adjustments happen late.
• [b>Gap Assumptions: [/b> System assumes gaps want to fill. Strong trend days never fill gaps (gap becomes support/resistance forever). Blindly trading toward gaps can backfire on trend days.
• [b>Volume Data Quality: Forex doesn't have centralized volume (uses tick volume as proxy—less reliable). Crypto volume is often fake (wash trading). Volume confirmation less effective on these instruments.
• [b>Multi-Session Complexity: [/b> When using Asian/London/NY ORBs simultaneously, chart becomes cluttered. Requires discipline to focus on relevant session for current time.
[b>Risk Factors: [/b>
• [b>Opening Gaps: Large gaps (>2%) can create distorted ORBs. Opening range might be unusually wide or narrow, making extensions unreliable.
• [b>Low Volatility Environments:[/b> When VIX <12, opening ranges can be tiny (0.2-0.3%). Extensions are equally tiny. Profit targets don't justify commission/slippage.
• [b>High Volatility Environments:[/b> When VIX >30, opening ranges are huge (2-3%+). Extensions project unrealistic targets. Failed breakouts happen faster (volatility whipsaw).
• [b>Algorithm Dominance:[/b> In heavily algorithmic markets (ES during overnight session), ORB levels can be manipulated—algos pin price to ORB high/low intentionally. Breakouts become stop-runs rather than genuine directional moves.
[b>⚠️ RISK DISCLOSURE[/b>
Trading futures, stocks, options, forex, and cryptocurrencies involves substantial risk of loss and is not suitable for all investors. Opening Range Breakout strategies, while based on sound market structure principles, do not guarantee profits and can result in significant losses.
The ORB Fusion indicator implements professional trading concepts including Opening Range theory, Market Profile Initial Balance analysis, Fibonacci extensions, and failed breakout reversal logic. These methodologies have theoretical foundations but past performance—whether backtested or live—is not indicative of future results.
Opening Range theory assumes the first 30-60 minutes of trading establish a meaningful value area and that breakouts from this range signal directional conviction. This assumption may not hold during:
• Major news events (FOMC, NFP, earnings surprises)
• Market structure changes (circuit breakers, trading halts)
• Low liquidity periods (holidays, early closures)
• Algorithmic manipulation or spoofing
Failed breakout detection relies on patterns of trapped participant behavior. While historically these patterns have shown statistical edges, market conditions change. Institutional algorithms, changing market structure, or regime shifts can reduce or eliminate edges that existed historically.
Initial Balance classification (trend day vs rotation day vs normal day) is a heuristic framework, not a deterministic prediction. Day type can change mid-session. Early classification may prove incorrect as the day develops.
Extension projections (1.272x, 1.5x, 1.618x, 2.0x, etc.) are probabilistic targets derived from Fibonacci ratios and empirical market behavior. They are not "support and resistance levels" that price must reach or respect. Markets can stop short of extensions, overshoot them, or ignore them entirely.
Volume confirmation assumes high volume indicates institutional participation and conviction. In algorithmic markets, volume can be artificially high (HFT activity) or artificially low (dark pools, internalization). Volume is a proxy, not a guarantee of conviction.
LTF precision sampling improves ORB accuracy by using 1-minute bars but introduces additional data dependencies. If 1-minute data is unavailable, inaccurate, or delayed, ORB calculations will be incorrect.
The grading system (A+/A/B+/B/C/D) and confidence scores aggregate multiple factors (volume, VWAP, day type, IB expansion, gap context) into a single assessment. This is a mechanical calculation, not artificial intelligence. The system cannot adapt to unprecedented market conditions or events outside its programmed logic.
Real trading involves slippage, commissions, latency, partial fills, and rejected orders not present in indicator calculations. ORB Fusion generates signals at bar close; actual fills occur with delay. Opening range forms during highest volatility (first 30 minutes)—spreads widen, slippage increases. Execution quality significantly impacts realized results.
Statistics tracking (win rates, extension levels reached, day type distribution) is based on historical bars in your lookback window. If lookback is small (<50 bars) or market regime changed, statistics may not represent future probabilities.
Users must independently validate system performance on their specific instruments, timeframes, and broker execution environment. Paper trade extensively (100+ trades minimum) before risking capital. Start with micro position sizing (5-10% of intended size) for 50+ trades to validate execution quality matches expectations.
Never risk more than you can afford to lose completely. Use proper position sizing (0.5-2% risk per trade maximum). Implement stop losses on every single trade without exception. Understand that most retail traders lose money—sophisticated indicators do not change this fundamental reality. They systematize analysis but cannot eliminate risk.
The developer makes no warranties regarding profitability, suitability, accuracy, reliability, or fitness for any purpose. Users assume full responsibility for all trading decisions, parameter selections, risk management, and outcomes.
By using this indicator, you acknowledge that you have read, understood, and accepted these risk disclosures and limitations, and you accept full responsibility for all trading activity and potential losses.
[b>═══════════════════════════════════════════════════════════════════════════════[/b>
[b>CLOSING STATEMENT[/b>
[b>═══════════════════════════════════════════════════════════════════════════════[/b>
Opening Range Breakout is not a trick. It's a framework. The first 30-60 minutes reveal where participants believe value lies. Breakouts signal directional conviction. Failures signal trapped participants. Extensions define profit targets. Day types dictate strategy. Failed breakouts create the highest-probability reversals.
ORB Fusion doesn't predict the future—it identifies [b>structure[/b>, detects [b>breakouts[/b>, recognizes [b>failures[/b>, and generates [b>probabilistic trade plans[/b> with defined risk and reward.
The edge is not in the opening range itself. The edge is in recognizing when the market respects structure (follow breakouts) versus when it violates structure (fade breakouts). The edge is in detecting failures faster than discretionary traders. The edge is in systematic classification that prevents catastrophic errors—like fading a trend day or holding through rotation.
Most indicators draw lines. ORB Fusion implements a complete institutional trading methodology: Opening Range theory, Market Profile classification, failed breakout intelligence, Fibonacci projections, volume confirmation, gap psychology, and real-time performance tracking.
Whether you're a beginner learning market structure or a professional seeking systematic ORB implementation, this system provides the framework.
"The market's first word is its opening range. Everything after is commentary." — ORB Fusion
