DOP - Load-Level Identification & Setup Assistant (L.I.S.A)This toolkit is made up of more than 3+ innovative indicators that have been designed to assist people in trading smart-money concepts. Get access to a variety of trading tools & relevant data all within one indicator to create your own, smart-money trading strategy.
Catering To SMART-Money Trading Styles
Our toolkit works in any market & allows users to:
• Detect the trend of the market by displaying real-time changes in market structure.
• Detect institutional activity in the market by highlighting structural changes.
• Get automatic order block support and resistance levels in real-time to assist with order entry placement and target take profit levels.
• Timely removal of order blocks that have been run through to give a clear picture of current market structure.
How Does It Work?
The algorithm tracks key pivot points within market data and when these are broken by price movements it provides key information to the user such as when it broke structure, where it broke structure and what levels are now considered support and resistance.
Trend Bar Colouring
The trend bar colouring feature provides a clear visual indication of the market trend by colouring candles red or green depending on the last break in market structure.
Market Structure Breaks
Breaks in market structure are displayed with a single line between two candles, this indicates that there may have been a shift in market trend.
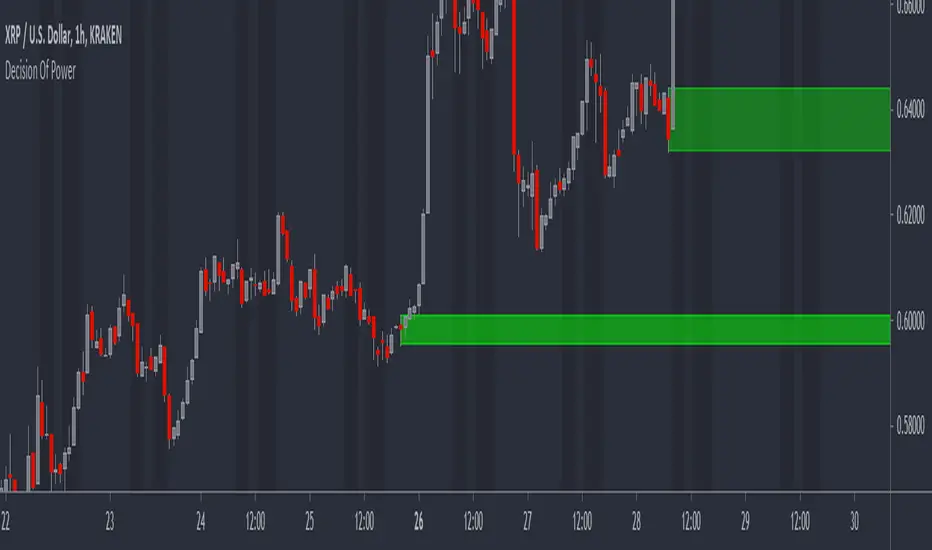
Order Block Levels
Once structure breaks it creates support and resistance levels which can help in trade entries and deciding on take profit targets; these are displayed in real-time with colour coded boxes at either the support or resistance levels. If a level has been broken it is automatically removed from the chart to give a clear representation of the current market state.
If you are using this script you acknowledge past performance is not necessarily indicative of future results and there are many more factors that go into being a profitable trader.
You can see the Author's instructions below to get instant-access to this indicator.
In den Scripts nach "profitable" suchen
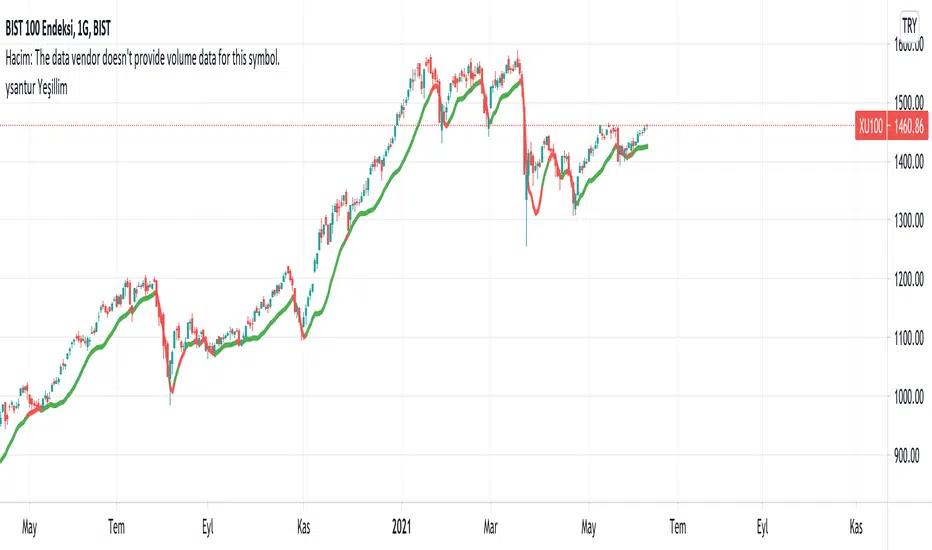
YesillimThe "Yesillim" indicator is a trend follower and trailing stop indicator that reacts quickly and aims to enter early in an uptrend and exit early from a downtrend. Since moving averages are used, it can be used in daytrade and scalping in daily or lower periods. The crossover and crossdown intersections of the price and the indicator line may be meaningful, but it is actually a color changing indicator and color changes should be interpreted. The bullish market gains strength when the color turns green, and the bearish market when it turns red. When prices get too far from the indicator, they are approaching again, in this case, it may be support will work like resistance according to the current trend. Like any indicator, it is possible to produce false signals in the horizontal market, so it should not be used alone, the oscillator and volume should support the current trend. In strong trend changes, angle changes in the indicator can also be interpreted manually. In this case, sharp angled turns indicate a sharp trend change. Technically customized weighted moving average weights are specially weighted with golden ratio coefficients, smoothed with a lower period for noise removal with the same principle and added bias. I wish it to be used in profitable transactions.
Turkish (Türkçe): Yeşillim indikatörü bir trend izleme ve hareketli iz süren indikatördür. Son barları agresif olarak ağırlıklandırdığı için var olan bir yükseliş trendine erken sokup, düşüş trendinden erken çıkarması olasıdır. İndikatör yorumlanırken fiyat ve indikatör kesişimleri anlamlı olsada (yükseliş düşüş trendlerinde destek-direnç görevi görebilecektir) ancak asıl amaç renk değişimi yorumlanmalıdır, yeşil yükseliş trendinin, kırmızı ise düşüş trendinin güç kazandığını göstermektedir. Her indikatör gibi yatay piyasada hatalı sonuçlar üretebilir, bu nedenle rsi, sokastik gibi bir osilatörle desteklenmesi hacimin mevcut trendi desteklemesi gerekmektedir. Kazançlı işlemlerde kullanılmasını temenni ederim.
Wealthy Tech v1.4This script was design to guide the trader in three different ways as a "one stop" place so the trader can have all the basics covered and working together , the indicator is organized by two control panels and one set of technical tools.
1 - First Panel - "Advanced Trading Tools"
- Providing many important parameters that a trader must know before sending an order.
- Displays a green, yellow or red signal in front of the current data helping the trader to quickly identify the overall status of the asset.
- Parameters such as :
Average Daily Range in the past 20 days (ADR)
Current ADR of the day, Live ADR of the current Open/Close
Relative Strength , if in a Bull or Bear Market
Minimum and recommended Dollar Volume to guarantee the necessary liquidity
StochRSI warnings if oversold or bought
Volume /relative volume corresponds to a minimum for a good liquidity
Distance of the current price to the majors moving averages
Also a quick way to have your order size automatically calculated with a stop loss set at either the lows of the day or the last Lower High, giving you an order size and max risk/loss at all times.
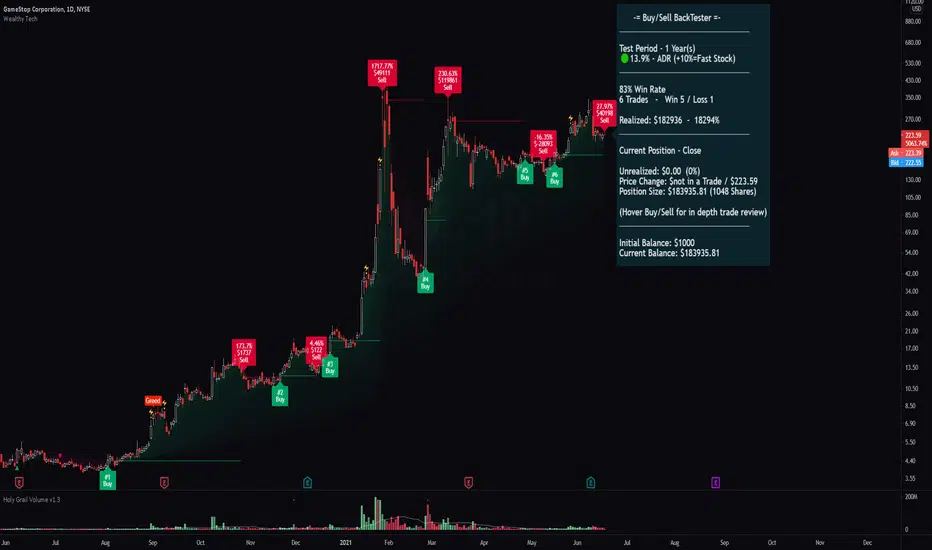
2 - Second Panel - "Buy/Sell Signal tool with live Backtester"
- Buy and Sell signals are provided for the beginner/busy trader. Using a set of combinations to determine the most probable period to enter and exit with adjustability by the user being able to choose how fast or slow the parameters should track the data.
- The live Backtester shows positions and historically calculations of all the Buy/Sell signals during the requested period. Showing how much you would've profit/lose if you had took those trades, helping you to decide which timeframe to use in conjunction to the Buy/Sell speed to give the most profitable probability.
- By hovering on the Buy/Sell, you'll find in depth information about each trade (Trading View limits the number of information the is being showed in a chart. If you have too many trades going back in history, it'll only show the max available)
- Keep in mind that the Buy/Sell signal repaints only while the candle is open. If you don't want to take your chances for a better entry, just wait for the candle to close so you have your confirmation. Over time you'll evolve a sense of all the functionalities and learn how to quickly identify what the indicator is trying to show. It takes a few tries to catch a big move, don't be afraid to be stopped or a low Win rate. What really matter is how much you're realizing by the end of the day. You most probably won't have any success in trade if you aren't able to stop your bad trades.
3 - Technical indicators and Visual Implementations
- Tools such as:
Open Range High/Low showing the first 30 min of the day. One of the best ways to identify and perfect breakout entry point
Improved MAs with auto color change indicating when it is strong or weak
MAs Flow Cloud for a generalized asset visualization of a Bull/Bear Market
Scalp line with variable speed helps you get in and our of a scalp with confidence.
High Volatility Reversals and Fear/Greed shows you the most probable point of a reversal/resistance to happen.
Volume Spike
Higher High / Higher Low / Lower High / Lower Low plots to help you visualize the channels.
The indicator is in BETA version, improvements and fixes will be added constantly.
New ideas and recommendations are welcomed.
Thank you very much for your time
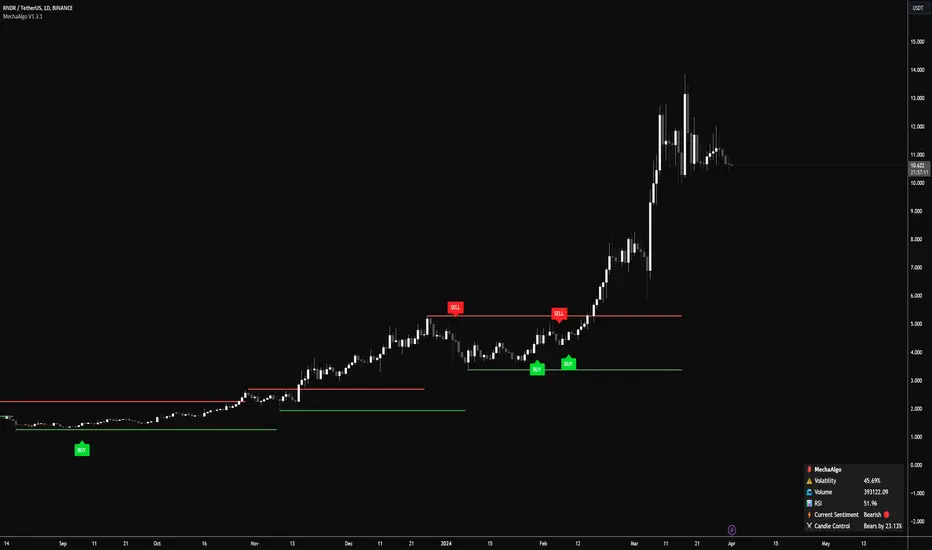
MechaAlgoWhat is MechaAlgo?
MechaAlgo was created to assist any type of trader on a day to day basis. Our intelligent and accurate algorithms turn complex charts into profitable plays, minimizing losses and maximizing profits. We hope that you will find use in the tools and resources we provide, and we will continue to improve on our products in order to take your trading to new heights!
Any Time, Any Market
Our indicators work with real time data on any market. This means that any kind of trader will find our tools useful, regardless of what you are trading.
Feature List
Multiple Signal Modes
Numerous Candle Coloring Modes
Reversal Cloud Overlay
Auto Support & Resistance
Auto Trendlines
Auto Profit Targets
Real Time Informational Dashboard
Multi-Timeframe Trend Panel
Future Trend Projection
Many More Features to Come!
By using this script you acknowledge that MechaAlgo cannot guarantee you profit, and that this product was only created in attempt to benefit traders. You also acknowledge that past performance is not indicative of future results, and that the experience of other users or what you see online may not always be your experience.
[Sidders] MACDEMASAR IndicatorCame across a cool idea for a strategy that couldn't find in the indicator database, so decided to code it up myself for your pleasure.
Indicators consists of 3 indicators: EMA(200) to determine the overall trend, and the MACD & Parabolic SAR to determine entries (and exits).
Long entry contains 4 conditions and is generated when price is above the 200EMA (1), the MACD crosses above the signal line (2), while they are both below 0 line (3) and when the parabolic SAR is below the closing price of the bar (4).
Short entry is build up the same but in reverse: price is below the 200EMA(1), signal line crosses below the MACD line (2), while they are both above the 0 line (3) and when the parabolic SAR is above the closing price of the bar (4).
Place the stoploss on the parabolic SAR dot below/above the candle that created the signal. Profit target 1:1 risk:reward ratio, but can ofcourse be changed according to your risk apetite. Might add automatically drawn SL/TPs in a later update.
Concept behind the strategy should work on all timeframes, but will require proper backtesting. I think with additional filters the strategy can also be way more finetuned and profitable, personally haven't had the time yet to dive into that.
Have also added alerts for your convenience.
Enjoy!

Stochastic OTTStochastic OTT is Anıl Özekşi's latest derived version of Optimized Trend Tracker on Stochastic Oscillator.
You might like to view the original version of the indicator if you don't know about OTT yet:
He tried to solve the fake signals of Stochastic Oscillator by adopting OTT on the indicator.
He advised users to set the stochastic smoothing parameters to 500 and 200 on his latest video about SOTT.
He personally uses 1 min charts on stock market so the parameters of the indicator might have to be optimized for other time frames nad markets.
He exaggerated the Stochastic to 1000's to have better signals of percent values of OTT.
Also hes used VIDYA in both calculations of OTT and Stochastic smoothing.
Hope you'll enjoy the SOTT in your profitable trades.
Kıvanç

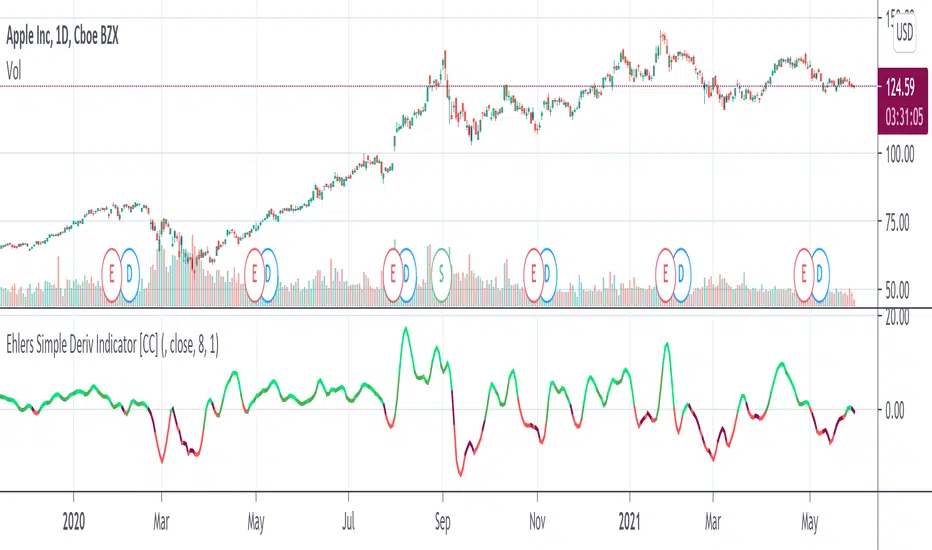
Ehlers Simple Deriv Indicator [CC]The Simple Deriv Indicator was created by John Ehlers (Stocks and Commodities June 2021 pg 10) and this is a heavily modified version of his original script that changes the buy and sell signals. I did testing with his original settings but they didn't seem to be very profitable for most stocks so I created my own system. This indicator does have a lag though so it is best used for trend confirmation imo. Buy when the line turns green and sell when it turns red.
Let me know if there are any other indicators you would like to see me publish!
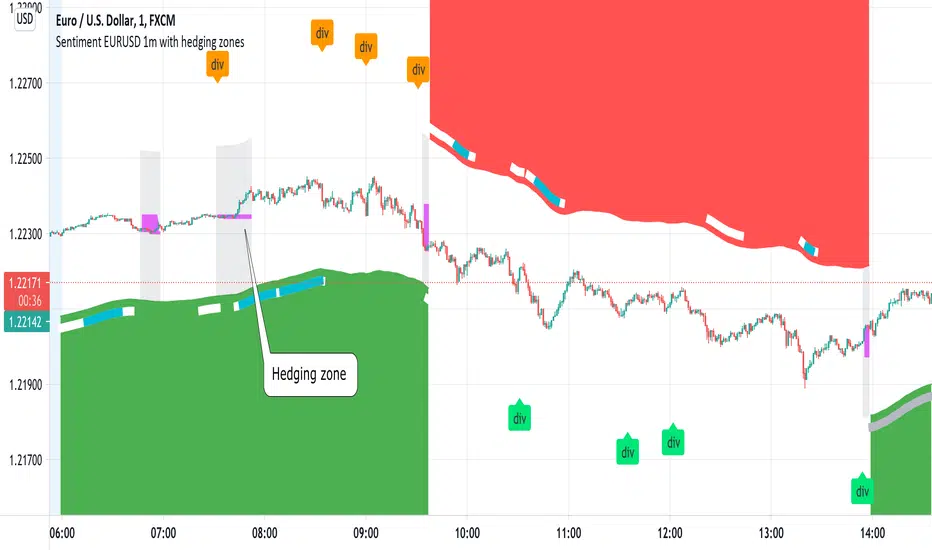
Sentiment EURUSD 1m with hedging zonesThis is a very specialised and optimized script, for 1m EURUSD traders - daytraders, scalpers.
1m trading is very difficult, but it can be also most profitable, if done right.
Why difficult? It is hard to detect market direction - usually when trend indicators reverse, that new trend is already over. One and the same indicator signal sometimes provides one outcome (for example reversal) and sometimes exactly the opposite (continuation). It requires deep understanding on WHEN to use which indicator and when to ignore signals. Set the parameters of your indicators to a very sensitive extent and they will keep changing direction back and forth - always being too late of course :) Set the parameters too losely, and you'll be late with entries 100% of times. Looking for universal trend-showing indicator? There is none...
This script is a result of 2 years of practical following EURUSD 1m market action. Looking at charts with MANUAL TRADER'S eyes. Analyzing all together: price action, indicators, zigzag, divergences, momentum, pivot points, support and resistance. On the one hand traders say only manual trading can be successful and on the other - to stick to one strategy and be automatic when applying to it. So this is it - automatic coding of market signals as if manual trader would do it. Forex is news-driven? Yes, it is. So if market sentiment changes because of some news happening, the script will quickly recognize it and suggest reversal.
Please note I'm not pretending to have a crystal ball. Nobody has. The goal of this script is not to predict where EURUSD market will be, but to correctly notice that is has reversed. Nothing else.
Sometimes the market will move towards reversal, but not cross the line yet - these are so-called HEDGING ZONES. Sometimes they turn out to be reversals and sometimes simply best places for dip entries. Ideally a trader should hedge there, because market could move either way. You might wanna apply apply knowledge of market fundamentals there or look into some micro-indicators. Anyway, it is good to realize where those zones are and this script shows them. In pink.
It is invite-only script. DM me for access.
CandletypesBackground information:
In my price action trading principles, I normally classify the candles into four types and look for trade opportunities. The candles are classified based whether buyers or sellers is dominating, namely, Indecisive candles, Decisive candles, Counter decisive candles and Strong decisive candles. Each of these can either be buyers or sellers dominant. This Philosophy I have attempted to convert into pine script for all traders to analyze and trade.
Indecisive candles: When the strength of the candle cannot be decided and we cant take any decision. Best is stay away. Something similar to conventional doji. Even though the strength is undecided, still the advantage can be towards either buyers or sellers favor. so we have Indecisive buy and indecisive sell candle
Decisive candles: When the strength is tipped towards the buyers or sellers, then I call Decisive bull or Decisive sell. This candles can be used to pyramid the trade position and not for initiating the trade, as many times it could be climatic also.
Counter decisive candles: These are candles , when the initial decision was towards one side and before closing of the candle, the decision was countered by the other side. There are counter decisive buy and sell. Counter decisive buy is actually a sell signal, because first buyers showed the strength later sellers overcome the buyers and become strong. Similarly counter decisive sell is a buy signal. These can be coupled with decisive candles for initiating the trading position
Strong decisive candles: These candles are good for initiating trade as a standalone alert system. It is something similar to pin bar, but more precise. we have both buy and sell and they have strong tendency to move in the direction of alert. These candles at right levels form a profitable trading system.
How the inputs are arranged:
There are total 8 candle types and whichever trader want can be selected for display.
By default,
The indecisive and decisive bull signals are placed on top of the charts as square and round green signal with title "IDB" and "DB"
The indecisive and decisive bear signals are placed on bottom of the charts as square and round red signal with title "IDS" and "DS"
The counter decisive and strong decisive signals are placed on the top and bottom of the candles.
In addition, the first candle of the day in any intraday time frame carries the label to display what type of candle is formed. This is very useful for making intraday trading.
This can be used freely by clicking to favorites. Source code is however not shared. please do contact for any additional info or modification.
happy trading

IC Options °Turn the Dashboard on or off
°Turn the Signal Bars on or off
°Turn the Buy & Sell Signals on or off
°Turn the Fibonacci Retracement Tool on or off
The Dashboard information is best used for confirmation and informational purposes
-above 9 ema is bullish, below 9 ema is bearish trend
This script allows user input, you can add or remove built in dashboard, color bars(inform you of when the price action is above or below the midpoint of the Void Lines), long short signals(can be used to find optimal entries and exits for trades on any time frame. Smaller time frames are best for scalping. Longer time frames are best for longer swing trades. This paired with 9,21,34 ema can produced profitable trades!), auto Fibonacci retracement(allows you to plot perfect Fib Lines every time.)
-thanks for allow the following above being public domain from lemon:lemon:

NexTrader v2.1Trading can be a profitable pursuit but it can also be a very risky one.
A lot of traders do not have the time to study the market all day long, which means they don’t have the time to study the patterns that develop over the course of a day or week.
There is a way to trade that overcomes this problem by trading indicators that help you catch the trend in the early stages, something that is all too easy to miss. (The way to do this is to use a trading system based on the previous months average price and the current months average price, that is described in this post.)
Yes, it is possible to trade without indicators. We can argue about how much better it is to trade with trading indicators, but all is better than nothing.
Here in Nextrader we decided to show you how to trade with average* monthly prices. The idea behind this trading indicator is that the average monthly price is a reflection of the price action of the instrument.
Some traders believe that there is a possibility that the price will go back to the average monthly price level. In general, the use of the average monthly price as a trading indicator is not new and is very common among advanced traders.
Everyone is looking for trading indicators that can predict future trends.
This one is based on past prices and goes well across all time frames. It uses the average price for the current month and the average price for the last month to predict future price direction.
The indicator is the result of a simple moving average crossover system.
The fast average(white crosses) is based on the current month price and the slow average(red crosses) is based on the last month price. When the current month price crosses above the previous month price the signal line turns up and indicates a positive trend.
The thing to keep in mind here is that the average is not an indicator of when to buy or sell, but rather a direction signal generator.
The wider distances between two lines the stronger trend direction is. The shorter distance meaning more sideways price action.
* The average is just a mathematical tool that will help you to generate a trading rule.

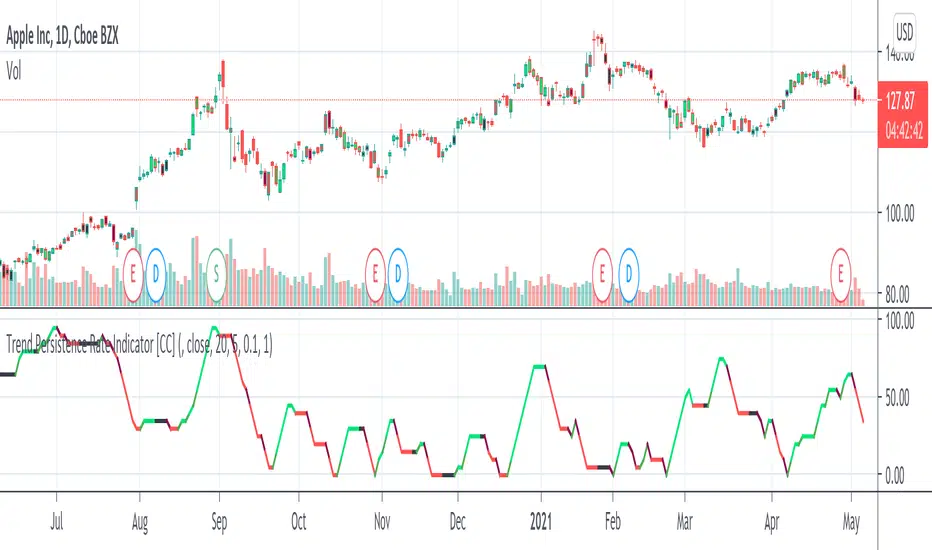
Trend Persistence Rate Indicator [CC]The Trend Persistence Rate Indicator was created by Richard Poster (Stocks and Commodities Feb 2021 pg 12) and this indicator is a good trend strength indicator similar to ADX. A good strategy with this indicator according to the author is to combine this with a moving average crossover strategy and a volatility indicator. Buy when the price crosses over the moving average and when the volatility and this indicator are over a selected minimum. I think 30-40 as a minimum for this indicator works well. Exit that position when this indicator peaks and starts to go down and it should be very profitable for you. I have included general buy and sell signals with this indicator as well.
Let me know if there are any other indicators you would like to see me publish!
Bollinger Band Width PercentileIntroducing the Bollinger Band Width Percentile
Definitions :
Bollinger Band Width Percentile is derived from the Bollinger Band Width indicator.
It shows the percentage of bars over a specified lookback period that the Bollinger Band Width was less than the current Bollinger Band Width.
Bollinger Band Width is derived from the Bollinger Bands® indicator.
It quantitatively measures the width between the Upper and Lower Bands of the Bollinger Bands.
Bollinger Bands® is a volatility-based indicator.
It consists of three lines which are plotted in relation to a security's price.
The Middle Line is typically a Simple Moving Average.
The Upper and Lower Bands are typically 2 standard deviations above, and below the SMA (Middle Line).
Volatility is a statistical measure of the dispersion of returns for a given security or market index, measured by the standard deviation of logarithmic returns.
The Broad Concept :
Quoting Tradingview specifically for commonly noted limitations of the BBW indicator which I have based this indicator on....
“ Bollinger Bands Width (BBW) outputs a Percentage Difference between the Upper Band and the Lower Band.
This value is used to define the narrowness of the bands.
What needs to be understood however is that a trader cannot simply look at the BBW value and determine if the Band is truly narrow or not.
The significance of an instruments relative narrowness changes depending on the instrument or security in question.
What is considered narrow for one security may not be for another.
What is considered narrow for one security may even change within the scope of the same security depending on the timeframe.
In order to accurately gauge the significance of a narrowing of the bands, a technical analyst will need to research past BBW fluctuations and price performance to increase trading accuracy. ”
Here I present the Bollinger Band Width Percentile as a refinement of the BBW to somewhat overcome the limitations cited above.
Much of the work researching past BBW fluctuations, and making relative comparisons is done naturally by calculating the Bollinger Band Width Percentile.
This calculation also means that it can be read in a similar fashion across assets, greatly simplifying the interpretation of it.
Plotted Components of the Bollinger Band Width Percentile indicator :
Scale High
Mid Line
Scale Low
BBWP plot
Moving Average 1
Moving Average 2
Extreme High Alert
Extreme Low Alert
Bollinger Band Width Percentile Properties:
BBWP Length
The time period to be used in calculating the Moving average which creates the Basis for the BBW component of the BBWP.
Basis Type
The type of moving average to be used as the Basis for the BBW component of the BBWP.
BBWP Lookback
The lookback period to be used in calculating the BBWP itself.
BBWP Plot settings
The BBWP plot settings give a choice between a user defined solid color, and a choice of "Blue Green Red", or "Blue Red" spectrum palettes.
Moving Averages
Has 2 Optional User definable and adjustable moving averages of the BBWP.
Visual Alerts
Optional User adjustable High and low Signal columns.
How to read the BBWP :
A BBWP read of 95 % ... means that the current BBW level is greater than 95% of the lookback period.
A BBWP read of 5 % .... means that the current BBW level is lower than 95% of the lookback period.
Proposed interpretations :
When the BBWP gets above 90 % and particularly when it hits 100% ... this can be a signal that volatility is reaching a maximum and that a macro High or Low is about to be set.
When the BBWP gets below 10 % and particularly when it hits 0% ...... this can be a signal that volatility is reaching a minimum and that there could be a violent range breakout into a trending move.
When the BBWP hits a low level < 5 % and then gets above its moving average ...... this can be an early signal that a consolidation phase is ending and a trending move is beginning.
When the BBWP hits a high level > 95 % and then falls below its moving average ... this can be an early signal that a trending move is ending and a consolidation phase is beginning.
Essential knowledge :
The BBWP was designed with the daily timeframe in mind, but technical analysists may find use for it on other time frames also.
High and Low BBWP readings do not entail any direction bias.
Deeper Concepts :
In finance, “mean reversion” is the assumption that a financial instrument's price will tend to move towards the average price over time.
If we apply that same logic to volatility as represented here by the Bollinger band width percentile, the assumption is that the Bollinger band width percentile will tend to contract from extreme highs, and expand from extreme lows over time corresponding to repeated phases of contraction and expansion of volatility.
It is clear that for most assets there are periods of directional trending behavior followed by periods of “consolidation” ( trading sideways in a range ).
This often ends with a tightening range under reducing volume and volatility ( popularly known as “the squeeze” ).
The squeeze typically ends with a “breakout” from the range characterized by a rapid increase in volume, and volatility when price action again trends directionally, and the cycle repeats.
Typical Use Cases :
The Bollinger Band Width Percentile may be especially useful for Options traders, as it can provide a bias for when Options are relatively expensive, or inexpensive from a Volatility (Vega) perspective.
When the Bollinger Band Width Percentile is relatively high ( 85 percentile or above ) it may be more advantageous to be a net seller of Vega.
When the Bollinger Band Width Percentile is relatively low ( 15 percentile or below ) it may be advantageous to be net long Vega.
Here we examine a number of actionable signals on BTCUSD daily timeframe using the BBWP and a momentum oscillator ( using the TSI here but can equally be used with Bollinger bands, moving averages, or the traders preferred momentum oscillator ).
In this first case we will examine how a spot trader and an options trader could each use a low BBWP read to alert them to a good potential trade setup.
note: using a period of 30 for both the Bollinger bands and the BBWP period ( approximately a month ) and a BBWP lookback of 350 ( approximately a year )
As we see the Bollinger Bands have gradually contracted while price action trended down and the BBWP also fell consistently while below its moving average ( denoting falling volatility ) down to an extremely low level <5% until it broke above its moving average along with a break of range to the upside ( signaling the end of the consolidation at a low level and the beginning of a new trending move to the upside with expanding volatility).
In this next case we will continue to follow the price action presuming that the traders have taken or locked in profit at reasonable take profit levels from the previous trade setup.
Here we see the contraction of the Bollinger bands, and the BBWP alongside price action breaking below the BB Basis giving a warning that the trending move to the upside is likely over.
We then see the BBWP rising and getting above its moving average while price action fails to get above the BB Basis, likewise the TSI fails to get above its signal line and actually crosses below its zeroline.
The trader would normally take this as a signal that the next trending move could be to the downside.
The next trending move turns out to be a dramatic downside move which causes the BBWP to hit 100% signaling that volatility is likely to hit a maximum giving good opportunities for profitable trades to the skilled trader as outlined.
Limitations :
Here we will look at 2 cases where blindly taking BBWP signals could cause the trader to take a failed trade.
In this first example we will look at blindly taking a low volatility options trade
Low Volatility and corresponding low BBWP levels do not automatically mean there has to be expansion immediately, these periods of extreme low volatility can go on for quite some time.
In this second example we will look at blindly taking a high volatility spot short trade
High volatility and corresponding high BBWP levels do not automatically mean there has to be a macro high and contraction of volatility immediately, these periods of extreme high volatility can also go on for quite some time, hence the famous saying "The trend is your friend until the end of the trend" and lesser well known, but equally valid saying "never try to short the top of a parabolic blow off top"
Markets are variable and past performance is no guarantee of future results, this is not financial advice, I am not a financial advisor.
Final thoughts
The BBWP is an improvement over the BBW in my opinion, and is a novel, and useful addition to a Technical Analysts toolkit.
It is not a standalone indicator and is meant to be used in conjunction with other tools for direction bias, and Good Risk Management to base sound trades off.
John Bollinger has suggested using Bolliger bands, and its related indicators with two or three other non-correlated indicators that provide more direct market signals.
He believes it is crucial to use indicators based on different types of data.
Some of his favored technical techniques are moving average divergence/convergence (MACD), on-balance volume and relative strength index (RSI).
Thanks
Massive respect to John Bollinger, long-time technician of the markets, and legendary creator of both the Bollinger Bands® in the 1980´s, and the Bollinger band Width indicator in 2010 which this indicator is based on.
His work continues to inspire, decades after he brought the original Bollinger Bands to the market.
Much respect also to Eric Crown who gave me the fundamental knowledge of Technical Analysis, and Options trading.

Percentile Rank Market FilterA simple script to filter bull and bear markets by using percentile rank filter. Using market regimes to filter by bull/bear/sideways markets helps to understand how your strategy will
behave in various market regimes and allows you to avoid unprofitable regimes and only trade in profitable ones.
The idea of market regime filtering is used in the most successful technical algorithmic trading strategies, as one should always design a trading strategy with a particular market in mind according to trading legend, Larry Connors
Feel free to use this script in your strategies to improve your profits and lower drawdowns.

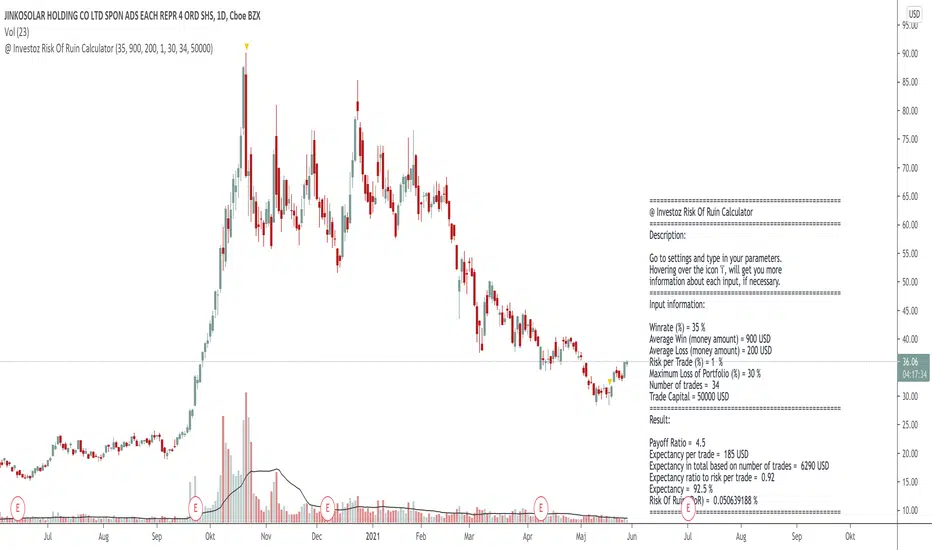
@ Investoz Risk Of Ruin CalculatorWhat is risk of ruin?
The risk of ruin is a statistical concept that matches the probability that you reach the point where it is no longer possible to recover the losses or continue. Please note that this is not the total capital in your account, as you should NEVER risk 100% of your capital.
Ideally, you should be prepared to risk 25-30% of your account as a MAXIMUM breakpoint before you need to stop trading. If that maximum is reached, review your trading plan for new goals and risk settings to determine if you can continue trading and then develop a new plan. You should never have a drawdown of 50% or more, because then you have to get 100% return, just for breaking even!
Considering that new traders are highly risk averse and have no idea of how much risk they can afford to take for each trade, they most likely end up blowing up their account. They probably did not wanted to see it as a possibility, just saw the opportunity to earn money.
Therefore, risk management is one of the key points a trader need to know well, to avoid reaching our point of destruction. This is what allows you to survive and stay in the game in order to have a greater chance of making money in the markets. Every trader must therefore calculate their chances of reaching this drawdown level. Simply put, the more you risk per trade, the more you increase the risk of destruction. So the easiest way to avoid the risk of ruin is to risk only a small portion of your account on each trade. Risk should never exceed 1-2% of the account per trade (preferably less) otherwise that path to point of destruction is where you are heading.
It is obviously not possible for a trader to make money without taking some risk, but it is imperative that he / she knows what his / her risk is and that he / she is prepared to take it. If a trader is not willing to take risks on his / her trading account, trading is not for him / her, it's that simple.
How the Risk Of Ruin Calculator works
You need to know a few things before you can use this calculator. You need to manually go to the indicator settings and make a few inputs over following:
(If you use a pine script strategy, you have all the info you need. Go to "Strategy Tester" and then "Performance Summary").
Inputs
Win rate = How profitable your strategy is in % terms.
Average win = Average winning trade, in money terms.
Average loss = Average losing trade, in money terms.
Risk per trade = How much risk of your portfolio you take at each trade.
Maximum Loss Of Portfolio = What is the total percentage loss of your portfolio that you can afford to risk before you stop trading.
Trade Capital = The total sum of your current trade capital.
Outputs
Payoff ratio = The payoff ratio is simply the system's average profit per trade divided by the average loss per trade.
Expectancy = Is the win rate of the strategy divided by payoff ratio.
Risk of ruin ( RoR ) = Risk of ruin is the probability of a strategy losing money, to the point where it is no longer possible to recover the losses or continue.
=============================================================================================================================================================
DISCLAIMER
Any data and information is provided 'as is' solely for informational purposes, and is not intended for trading purposes or advice. Past performance is not indicative of future results.
Educate yourself on the risks associated with trading, and seek advice from an independent financial or tax advisor if you have any questions.
=============================================================================================================================================================
RSI Trend Indicator [paRSI]The Relative Strength Index ( RSI ) is a measurement used by traders to assess the price momentum. It is scaled from 0 to 100. when RSI reads below 30, it is usually interpreted as oversold and when RSI is above 70 it is usually interpreted as overbought. However, it is usually not profitable to trade based on overbought and oversold signal.
RSI Trend Indicator or as I like to call it "paRSI" ("Parsa (my name) + RSI") shows that when RSI is above a specific number (default value = 60) it indicates bullish trend and when RSI is below a specific number (default value = 40 ) it indicates bearish trend. Lastly when RSI is below the 2 specified numbers it indicates a neutral trend.
I don't recommend trading based on this single indicator. If you're a trend trader this might be useful tool in addition to your own strategy
Usage:
If the created pattern has worked previously on the chart, you could enter on the first stages of the green or red section (depending on the market's trend).
It is not recommended to trade in any direction when there is no color
*THIS IS A TREND FOLLOWING STRATEGY AND DOES NOT WORK ON ALL MARKETS*

Interstellar / buy and sell
Interstellar is the buy and sell indicator for trading on TradingView
Buy and sell signals are tested, improved, developed and tried until we reach the highest precision we aspire to, so that we do not need further updates.
Before publishing the Interstellar indicator, we made sure that we reached the best and most accurate version, which exceeded the accuracy of the signals 90%
How does the Interstellar indicator work?
The algorithm behind buy and sell signals is based on a set of more important and accurate technical indicators that give signals to change direction early.
When conditions are met on all indicators, it produces only very accurate and high probability trading signals and significantly reduces false signals.
For a more detailed illustration of the strategy, see the following image:
i.imgur.com
Look at the picture above and imagine with me that there are a bunch of technical indicators going next to each other to get to level 20 and Level 20 represents the killer point that gives the entry or exit signals.
When all these indicators agree and reach Level 20, you have met all the requirements of the strategy and the buy or sell signal will appear on the chart.
i.imgur.com
In the image above we note that the RSI has not reached the 20th level, what happens in this case?
In this case the signals will not appear on the chart for the incompleteness of the terms of the strategy.
But in the next candle we will have one indicator which is the RSI indicator only and when it returns to level 20 the terms of the strategy are completed and the signal appears on the chart. The rest of the other indicators we will not need because they met the conditions in the previous candle.
When this situation occurs 9 out of 10 times returns the index at a level of 20
In this way the signals of the interstellar indicator are formed on the chart.
Note: The indicators shown in the image above are only for explanation and may not be part of the indicator
/
Why is the Interstellar Index the best deal you get?
It helps you find the best areas for early entry and exit.
It gives more profitable signals than false signals.
Unique strategy and easiest way to trade with high profit rate.
It works in all markets like stocks and forex, but the index is primarily developed in the cryptocurrency market.
Comes with an indicator called Interstellar Trend, this indicator displays Interstellar signals on all timeframes and helps to find solid opportunities.
Works great on large timeframes like 1d and 4h. It also works great on smaller timeframes but prefers to keep up with the trend.
It gives very high profit scores on background tests conducted over a historical period of 24 months.
Not repainted. Once the candle closes, the signal will not change.
Finally, try the indicator for yourself and you will not regret it. There is a 3-day free trial! Let me know if you are interested in the comments section. Send a message directly or request a free 3-day trial.

Hourly Scalp Engine◆ Purpose of this Script
The Hourly Scalp Engine (HSE) is designed to show scalp long opportunities on lower timeframes (H, 2H or 4H) based on a Fibonacci-valued MA-like structure. It was tested for Bitcoin and Ethereum, with the 2H timeframe seemingly giving the best test results. The chart shows a few instances where the price crossed below the HSE to trigger an entry (marked manually with arrows).
◆ Settings
Default scaling input (10.6) is tuned for Ethereum (ETH/USD) on Kraken.
Scaling input for Bitcoin (XBT/USD) on Kraken: 10.4.
Reasonable timeframes: H, 2H, 4H. Recommended timeframe: 2H.
You should probably set an alert for when Price crosses under the HSE.
◆ Instructions
As this is purely a scalp engine (and not feasible for long-term trades), the instructions have to be followed precisely for intended functionality:
As soon as Price crosses below the HSE, contemplate if you want to scalp, i.e. check current price, other indicators and market conditions. If yes, enter a scalp long. Do not enter the trade if : price has crossed above the HSE already and sits more than 1 % above it, or the down-wick was so deep and quick that it already retraced 10 % to the upside from the wick low (even if price is still below the HSE). In both cases it might be too late to enter.
Watch the 2H candle, at which you entered the trade, closing. Draw a 10 % price range from the wick low to the upside. The range high is your exit point. Set a take profit trigger there. Set a stop loss slightly below the wick low.
Observe the price action for the next 6 hours (i.e. the next three 2H candle closes). If price bounces up and hits the target, you exit with 10 % gains. If price hasn't moved to the target after 6 hours, close the trade at current price. If the stop loss should be hit in the meantime, you will have closed the trade automatically. The 10 % gain as a target was chosen because it seems to be hit very often, while higher targets are not reliably hit.
◆ Example Trade
Shown below is an example trade with correct drawing of the 10 % price range.
◆ Viability
From backtesting this should be a viable strategy for most instances where the HSE is crossed. However the HSE is not as hard as a boundary as e.g. the Confidence Bands (also published by DeanTrader), so that price can and will sometimes breach through (= close below) the HSE (as e.g. in the case of the March 2020 black swan event). Still even there a profitable trade could have been performed on the first bounce dependent on actual entry, although more risky due to very high volatility. Before using the HSE please make yourself familiar with the price action history of the considered asset and review the instances where the price crossed below the HSE in connection with the rules laid out in "Instructions" to understand the system and how to execute the trades. Also note that scalp trades are generally harder to perform than slower-paced swing trades, as timing becomes much more important and noise becomes relevant.
◆ Access
For access to this indicator please contact me via DM on TradingView or on Twitter (linked on my TradingView profile and in my signature).

ComboTrade V.2.1 (BuySell Signals,Take profit,4MA,Fibo,Ichi+QL)A WORD WITH ESTEEMED TRADERS:
The type of indicator that a trader uses to create a strategy depends on the type of strategy he intends to employ; this is related to the trading style and the trader's loss tolerance.
A trader looking for a long-term trade with high profits may adopt a follow-up strategy, and on the other hand, a trader who decides to make short-term trades with frequent but low profits may be eager to use a strategy based on price fluctuations. Different types of indicators can be used to confirm the results.
Indicators alone should not be used as a tool to make trading decisions. Instead, every trader should use indicators to receive trading signals and formulate trading strategies and determine his or her exact method.
Brief and essential description:
With the above description, traders are advised to use the ComboTrade indicator as a trading assistant. Using the tools embedded in this trading assistant makes it easy for traders and depending on the trading strategy, you can get the best result for positioning.
Note 1: The trading time frame for ComboTrade with over one hour (1H) will achieve best result. Checking out the lower time frame to buy or sell as a confirmation is recommended.
Note 2: At Trading View home screen choose “ Candles or ...” as “Bar’s Style”.
Once you added ComboTrade into to your chart, go to the setting gear of the ComboTrade indicator, which includes two sections: “Input” and “Style”.
The “Input” section is for the input values of the indicators and the “Style” section is for activating and deactivating the tools.
Activate Moving Average 7, 21, 50 and 200 with close (Default)
Activate Combo Cloud by tick the “Show ichimoku” if you use it (Default)
By activating ichimoku, three components will be added to the Como Cloud with below details:
1- The “Quality Line” shows the quality line (26 Kijun-sen future candlesticks) which helps the trader to understand the direction of the trend and will help the trader to make a decision.
2. The “Period Line” shows the 103-day period and can act as a support and resistance tool. In addition, this number can be changed.
3- The intersection of various Como cloud lines has also been installed.
The TP (Take Profit) signal indicates a similar buy or sell area using the RSI and Stochastic oscillators, and be sure to pay special attention to it. Be sure to tick the related box (TP) at “Style” section.
The “Trailing Stop” at “Style” section acts as a support and resistance line. It acts as a support when the price candle is placed above the Trailing Stop line and as a resistance if the price candle is placed below the Trailing Stop line.
At “Bot Key Value” in “Input” section, the number is adjustable from 0.25 to any number. According to the trader's strategy, the number of input and output signals in this section can be adjusted. The best number for BTC is 0.78 and for Altcoins is 0.78 to 1.
At “Bot ATR Period” in “Input” section, the best default number is 8. The best values for Altcoins is 8 to 10, which has a significant effect on the regulation of signaling and support and authority lines.
The “Bot Buy” and “Bot Sell” at “Style” section are the main and most important parts of the indicator that you must tick in order to active them both.
“Plot Background” can activate the Como Cloud and set it to green (ascending) and red (descending).
The “Labels” and “Lines” are related to the important Fibonacci tool, which by displaying the lines of the Fibonacci lines and by activating the label, the numbers related to the price and the Fibonacci numbers are displayed. It helps traders to extract data from the last few days.
DISCLAIMER:
ALL DECISIONS AND RISK MANAGEMENT, ETC. ARE THE FULL RESPONSIBILITY OF THE TRADER AND THE AUTHOR IS NOT RESPONSIBLE FOR THE POSITIONS AND THE RESULTS OF THE TRADES (POSSIBLE LOSSES) IN ANY WAYS. DO YOUR OWN RESEARCH (DYOR) BEFORE ENTERING/ EXISTING IN TO/ FROM ANY POSITIONS.
Please like and use your comments after using the indicator.
Always be Profitable!
JebraTrade
14 April 2021

TV Community AlgoTV Community Algo is a free TradingView script that I designed from the ground to benefit the traders of this community. It has plenty of features that you will enjoy, and I have included documentation for how to use this below!
Settings:
Basic:
Turn the Void Lines on or off
Turn the Dashboard on or off
Turn the Signal Bars on or off
Turn the Support & Resistance Lines on or off
Turn the EMA 8 and EMA 200 on or off
Turn the Buy & Sell Signals on or off
Turn the Fibonacci Retracement Tool on or off
Style:
Change the Dashboard's distance from the price action
Change the Dashboard's Color and Transparency
Change the Dashboard Text Color
Change the Fibonacci Deviation
Make the Fibonacci Retracement Tool reverse
Make the Fibonacci Lines extend left, right, both directions, or none
Turn Fibonacci Prices on or off
Turn Fibonacci Levels on or off and change between percent or value
Change Fibonacci Label Position from the left or the right
Usage:
This algo has many uses including but not limited to:
Finding entries and exits using the EMA 8 and EMA 200 crossovers
Using the Void Lines to identify bounces or reversals
Using the Signal Bars to identify trend and confirmation for entries and exits
Using the Dashboard information for confirmation and informational purposes
In the images below, I give a few examples of the many uses of the TV Community Algo!
VOID LINES
The Void Lines are very helpful when it comes to identifying reversals.
TV COMMUNITY ALGO DASHBOARD
The Dashboard is filled with useful information that all traders can benefit from!
SIGNAL BARS
The colored candles known as Signal Bars inform you of when the price action is above or below the midpoint of the Void Lines.
AUTO SUPPORT & RESISTANCE LINES
These lines help traders find accurate levels of support & resistance on all time frames, and the lines change color depending on if the price is above or below them.
EMA 8 AND 200
The EMA 8 and EMA 200 crossovers can be used as entry and exit signals.
BUY & SELL SIGNALS
The BUY & SELL signals can be used to find optimal entries and exits for trades on any time frame. Smaller time frames are best for scalping, while larger time frames are more suited for longer trades. When combined with the EMA lines and Dashboard information, these signals can produce incredibly profitable trades.
AUTO FIBONACCI RETRACEMENT TOOL
The Auto Fibonacci Retracement Tool allows you to plot perfect Fib Lines every time.
Conclusion:
I truly hope that the TV Community Algo benefits the TradingView community and that you all find some value in it. I worked very hard on this product and I would love to see it put to good use.
with love,
-Lemon 🍋
This work is licensed under a Attribution-NonCommercial-ShareAlike 4.0 International (CC BY-NC-SA 4.0) creativecommons.org

RSKYVNThis indicator is a combination of ema and sma which is good for trend analysis.
I put buy and sell signal in this indicator for an easy entry and exit.
How to use it?
First check our ma100. Ma100 shows trend analysis whether we are (uptrend and downtrend).
Second just wait for our biuy and sell signal.
This is profitable when ma100 is under our sma and ema region. So always wait that ma100 dive under ema and ma regions to enter a trade.
Disclaimer: This indicator is only good when there is a trend. The only flaw of this is when market is consolidating if that the case just switch to a support and resistance or fibonacci for entry and exit.
Always remember manage your own risk

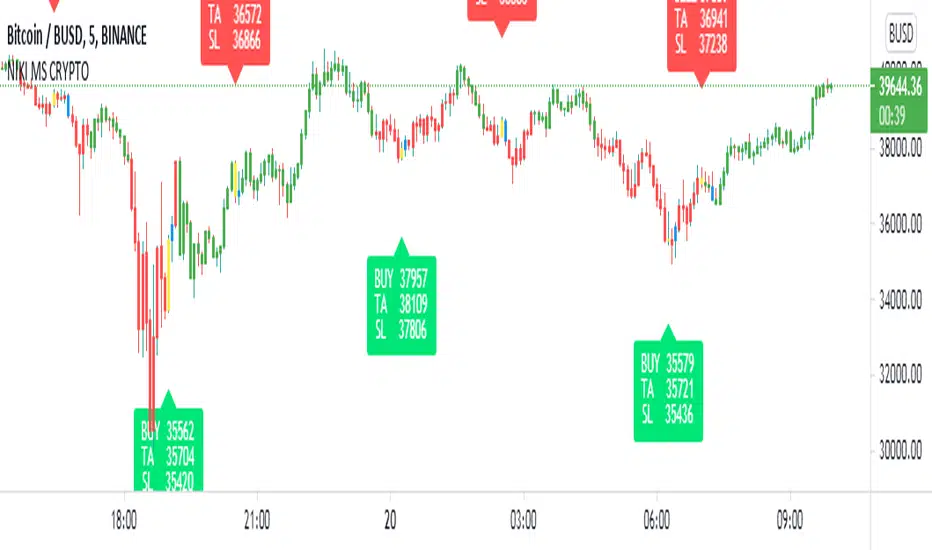
NIKI MS CRYPTOThis indicator is created specifically for BTCUSDTPERP, BTCBUSD, and BTCUSDT cryptocurrency pairs. It is not profitable in other cryptocurrency pairs. It only works on the 5-minute chart with a candle pattern. This indicator is just based on multi-timeframe Supertrend analysis. This indicator is more suitable for scalping. The target is 0.45% and the stop loss is 0.4%, which can be adjusted from the indicator settings. The yellow candle on the chart represents the entry and the blue candle represents the exit. All signals should be considered only after the candle is closed.
This indicator comes with Algo trading settings. By setting an alarm you can do robot trading in Binance.
Contact us using the links provided below to get access to this indicator.
Pivot Points AlgoThis is a Pivot Points Algo (PPA).
PPA uses an adaptive pivot algorithm that adapts to different market situations based on various factors.
PPA also includes depth filtering to make it more precise at its signal decision.
======= Signal Types ======
Main Signal of BUY and SELL shown by buy/sell labels.
Mini Signals of BUY and SELL shown by buy/sell arrows and shows additional breakouts after the Main Signal occurred.
Optional reversal signals show a possible reversal in trend (small triangle).
======= Alerts =======
Main Signals alerts - Alerts when a main Buy or Sell is triggered (Shown as Labels).
Combo Alerts - Alerts when main or mini signals of Buy and Sell are triggered (Shown as Arrows).
======= Assets and Time frames =======
Can be used on various assets, stocks, forex, crypto and works great for day trading as well as swing trading and long term investing.
PPA is designed to adjust to any time frame!
======= General info =======
The purpose of this indicator is to signal possible breakouts with a high rate of success.
PPA has been extensively tested and fine tuned to provide traders and investors with a valuable tool for timing long and short entries. However, no system is 100% perfect, and it is good practice to have a plan in place and use stop losses or other tools to mitigate unforeseen risk.
Also, note, I don't hide what PPA is doing as opposed to some other commercial indicators on the market. You can view pivot lines and pivot bands and so on.
The magic is the inner system itself which works for you to pinpoint the best entrance possible, I recommend confirming your own methods to make sure you want to take the trade.
To subscribe to Pivot Points Algo service see “Author's instructions” below.
For any question you can PM me.
Happy and profitable trading!
