Plus Screener [ChartPrime]The Plus Screener is designed to provide a broad vision of market conditions across selected asset classes. These models include low-lag filtering, directional bias estimation, pressure gradient calculations, probabilistic states, reversal inflection modelling, candlestick structure classification, and volatility phase metrics.
By combining these metrics the aim is to provide the user with a blanket breakdown at a glance of all key market systems and states.
Underlying Components
This section defines the technical foundations of the screener’s calculations and each column.
Low-Lag Trend Engine
The trend signals / trend-detection module based on recursive low pass filtering and phase compensation techniques to minimize delay typically seen in classical trading signals.
It produces directional states by evaluating:
- filtered slope
- rate-of-change
- smoothing derivative
- trend persistence score
This engine forms the primary input for the Trend Signals column. By combining these evaluations the trend signals offer unique insights.
A plus next to the signal shows that the signal is stronger in nature and a more violent market reaction could be occurring. A tick next to the signal suggests a system take profit (derived from ATR) was reached. This could suggest taking this trade is less likely to be profitable as we already have overextended.
A vital feature of The Prime Screener is its adaptability and customizability.
Users can refine the tuning and responsiveness of signals through the settings and tuning input, offering a tailored experience to individual trading preferences.
For example; a trader that wants to scan for longer term swing moves might want to consider using a higher tuning input. A scalper however might want to use a lower value for higher frequency signals.
Dynamic Reactor Model
The Dynamic Reactor provides a simple band passing through the chart. This can provide assistance in support and resistance locations as well as identifying the trend direction expressed via green and red colors. Taking a moving average and applying unique low lag adaptivity calculations gives this plot a unique and fast behavior. This gives a unique edge to standard high length moving averages.
This model approximates buying/selling force without relying on volume data, instead inferring pressure from displacement behaviour.
Quantum Reactor System
The quantum reactor is a custom weighted moving average analyzing trends in the market. Unlike other moving averages; weighting has been considered to account for ranging markets. The Reactor will turn gray in a ranging market to avoid chop allowing for filtering of trades. This offers a unique insight into price action. Classical moving averages will constantly attempt to re-adapt to a trend whereas the Reactor will avoid adaptation where it sees fit.
The Quantum Reactor column therefore shows the current state of this calculation making for easy volume analysis at a glance.
Candlestick Structure Classifier
Beyond signal identification, the screener incorporates a comprehensive analysis of candle patterns and potential reversals. Employing contrarian logic, the tool highlights key reversal signals on assets. Additionally, the screener accommodates ChartPrime's candlestick pattern identification, contributing a predictive element for anticipating market reversals or continuations.
These candle sticks are detected via traditional candle formations however it is important to note these are filtered. By looking for reversal candles with correct momentum attributes we can create a unique candlestick detection system.
Only patterns with statistically relevant characteristics are displayed.
Volatility Computation
In trading, volatility and finding volatile assets can help traders get in on opportunities and assess market conditions. This column in the table leverages filtered Z-scores to present a percentage rating with anything >70% deemed highly volatile. These are charts of the present possible scalping opportunities depending on the selected timeframe.
The Plus Screener consolidates multiple analytical models each focused on a distinct aspect of market behaviour, into a single, structured output.
By evaluating trend direction, displacement pressure, probabilistic bias, reversal potential, structural candle formation, and volatility phases, the system offers a high-resolution overview of each asset in a watchlist.
The goal is not to issue buy/sell decisions, but to present objective system states so traders can:
- rapidly identify favourable environments
- filter out assets lacking structure
- locate high-energy or low-energy conditions
- observe early signs of trend initiation, trend exhaustion, or reversal formation
In den Scripts nach "profitable" suchen

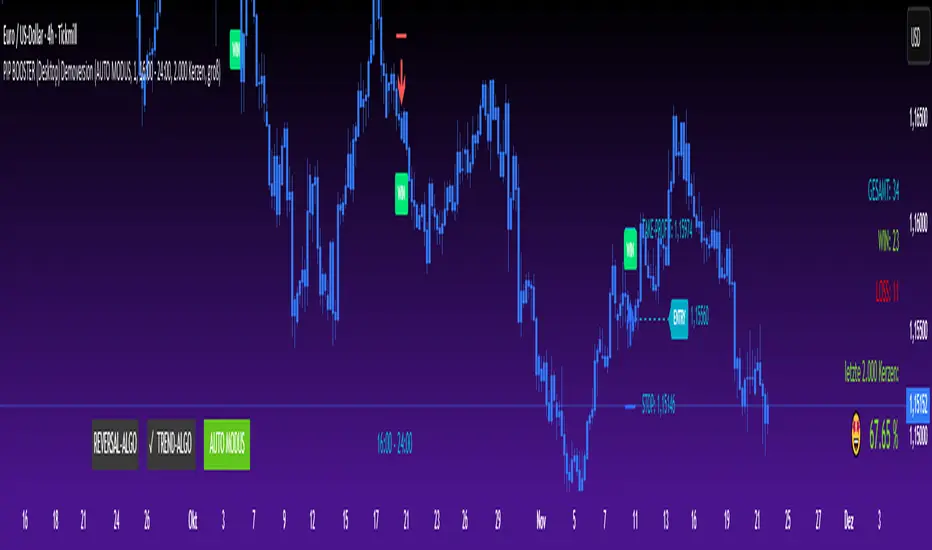
PIP BOOSTER (Desktop) DemoversionThe PIP BOOSTER from underground-traders.com is a very intelligent indicator with integrated win-rate tracking (%), which can be used on all markets and timeframes. Thanks to its two fundamentally different algorithms, the PIP BOOSTER is able to find a profitable setup in over 80% of all charts. The win-rate tracking (%) is highly detailed and can be applied to up to 5,000 candles.
It updates after every single signal, ensuring that performance monitoring is always up to date. Additionally, PIP BOOSTER users can apply different time filters, which can further optimize performance.
There is both a desktop version and a mobile version, which can be used with the TradingView mobile app. All signals are displayed clearly in the mobile app, making it possible to trade directly from your smartphone.
Please note that the demo version does not include any live signals. The demo version is only for you to evaluate the performance (win-rate %) of the two algorithms.
We guarantee that there are no repaint signals, and the signals in the demo version are 100% identical to those in the full version.
For any questions, please visit:
underground-traders.com
Or contact us at:
help@underground-traders.com
PIP BOOSTER (Mobile) DemoversionThe PIP BOOSTER from underground-traders.com is a very intelligent indicator with integrated win-rate tracking (%), which can be used on all markets and timeframes. Thanks to its two fundamentally different algorithms, the PIP BOOSTER is able to find a profitable setup in over 80% of all charts. The win-rate tracking (%) is highly detailed and can be applied to up to 5,000 candles.
It updates after every single signal, ensuring that performance monitoring is always up to date. Additionally, PIP BOOSTER users can apply different time filters, which can further optimize performance.
There is both a desktop version and a mobile version, which can be used with the TradingView mobile app. All signals are displayed clearly in the mobile app, making it possible to trade directly from your smartphone.
Please note that the demo version does not include any live signals. The demo version is only for you to evaluate the performance (win-rate %) of the two algorithms.
We guarantee that there are no repaint signals, and the signals in the demo version are 100% identical to those in the full version.
For any questions, please visit:
underground-traders.com
Or contact us at:
help@underground-traders.com

PIP BOOSTER (Desktop) FullversionThe PIP BOOSTER from underground-traders.com is a very intelligent indicator with integrated win-rate tracking (%), which can be used on all markets and timeframes. Thanks to its two fundamentally different algorithms, the PIP BOOSTER is able to find a profitable setup in over 80% of all charts. The win-rate tracking (%) is highly detailed and can be applied to up to 5,000 candles.
It updates after every single signal, ensuring that performance monitoring is always up to date. Additionally, PIP BOOSTER users can apply different time filters, which can further optimize performance.
There is both a desktop version and a mobile version, which can be used with the TradingView mobile app. All signals are displayed clearly in the mobile app, making it possible to trade directly from your smartphone.
Please note that the demo version does not include any live signals. The demo version is only for you to evaluate the performance (win-rate %) of the two algorithms.
We guarantee that there are no repaint signals, and the signals in the demo version are 100% identical to those in the full version.
For any questions, please visit:
underground-traders.com
Or contact us at:
help@underground-traders.com

PIP BOOSTER (Mobile) FullversionThe PIP BOOSTER from underground-traders.com is a very intelligent indicator with integrated win-rate tracking (%), which can be used on all markets and timeframes. Thanks to its two fundamentally different algorithms, the PIP BOOSTER is able to find a profitable setup in over 80% of all charts. The win-rate tracking (%) is highly detailed and can be applied to up to 5,000 candles.
It updates after every single signal, ensuring that performance monitoring is always up to date. Additionally, PIP BOOSTER users can apply different time filters, which can further optimize performance.
There is both a desktop version and a mobile version, which can be used with the TradingView mobile app. All signals are displayed clearly in the mobile app, making it possible to trade directly from your smartphone.
Please note that the demo version does not include any live signals. The demo version is only for you to evaluate the performance (win-rate %) of the two algorithms.
We guarantee that there are no repaint signals, and the signals in the demo version are 100% identical to those in the full version.
For any questions, please visit:
underground-traders.com
Or contact us at:
help@underground-traders.com

NeuraEdge Pro v1- Auto-OptimizedNeuraEdge Pro is an advanced, self-optimizing trading system that combines Smart Money Concepts (SMC), ICT principles, and adaptive neural networks to identify high-probability trade setups. The indicator automatically learns from its signal history and optimizes parameters in real-time to maintain your target win rate.
Key Features:
✅ Auto-optimization based on historical performance
✅ Neural adaptive system that learns market conditions
✅ ICT session filtering (London, New York, Asian)
✅ Smart Money Concepts integration
✅ Multi-timeframe support (Scalping to Swing trading)
✅ Built-in risk management system
📊 How It Works
NeuraEdge Pro identifies institutional order blocks, fair value gaps, and liquidity zones using advanced price action analysis. The system then filters these setups through multiple confluence factors including:
Market structure alignment
Volume confirmation
Neural network prediction
Session timing (ICT concepts)
Momentum indicators
RSI divergences
The higher you set the confluence number to (max 5) the more accurate but less signal quantity preferred on higher time frame from 1 HR and above.
The unique auto-optimization engine tracks signal performance and automatically adjusts internal parameters to improve accuracy over time.
⚙️ Recommended Settings by Trading Style
🔥 Scalping (1m - 5m charts)
Trading Mode:
✅ Scalp Mode
❌ Intraday Mode
❌ Swing Mode
✅ ICT Concepts
✅ Neural Adaptive
Risk Management:
Risk % per Trade: 0.5-1.0%
Risk:Reward Ratio: 2:1
ATR-Based Stop Loss: ON
ATR Multiplier: 1.3
Min SL Points: 15-20
Advanced Settings:
Analysis Lookback: 40
Order Block Strength: 4-5
Base FVG Size: 0.8-1.0
Base Volume Threshold: 1.8
Base Confluence Score: 4
📈 Intraday (15m - 1h charts)
Trading Mode:
❌ Scalp Mode
✅ Intraday Mode
❌ Swing Mode
✅ ICT Concepts
✅ Neural Adaptive
Risk Management:
Risk % per Trade: 1.0-1.5%
Risk:Reward Ratio: 2.5:1
ATR-Based Stop Loss: ON
ATR Multiplier: 1.5
Min SL Points: 25-30
Advanced Settings:
Analysis Lookback: 50
Order Block Strength: 4
Base FVG Size: 0.9
Base Volume Threshold: 1.6
Base Confluence Score: 4
📊 Swing Trading (4h - Daily charts)
Trading Mode:
❌ Scalp Mode
❌ Intraday Mode
✅ Swing Mode
✅ ICT Concepts
✅ Neural Adaptive
Risk Management:
Risk % per Trade: 1.5-2.0%
Risk:Reward Ratio: 3:1
ATR-Based Stop Loss: ON
ATR Multiplier: 1.8
Min SL Points: 40-50
Advanced Settings:
Analysis Lookback: 75
Order Block Strength: 3-4
Base FVG Size: 1.0-1.2
Base Volume Threshold: 1.5
Base Confluence Score: 3-4
🤖 Auto-Optimization Settings
Recommended for all timeframes:
Enable Auto-Optimization: ON
Optimization Lookback: 100 trades
Target Win Rate: 60%
💡 The system needs at least 10-15 signals to begin optimization. Initial signals use base settings, then the system adapts automatically.
🔮 Predictive Analysis
Keep these balanced for optimal results:
Enable Predictive Mode: ON
Price Action Weight: 0.4
Volume Weight: 0.3
Momentum Weight: 0.3
These weights determine how much each factor influences setup scoring.
📱 Signal Interpretation
BUY Signals (Green Labels)
Price has reached a bullish order block or FVG
Multiple confluence factors aligned
Neural network confirms bullish bias
Entry price shown on label
Green dashed line = Take Profit target
Red dashed line = Stop Loss
SELL Signals (Red Labels)
Price has reached a bearish order block or FVG
Multiple confluence factors aligned
Neural network confirms bearish bias
Entry price shown on label
Green dashed line = Take Profit target
Red dashed line = Stop Loss
📊 Dashboard Explained
Top Section:
Mode - Active trading mode and timeframe
Trend - Current market structure (Bullish/Bearish/Range)
Vol - Volume ratio (higher = stronger moves)
ATR - Current volatility measurement
Auto-Optimize Section:
Win Rate - Historical performance (updates after signals)
FVG/Vol/Conf - Current optimized parameters with arrows:
↑ = System increased selectivity (fewer signals)
↓ = System decreased selectivity (more signals)
= = No change from base settings
Ready OBs - Number of high-probability setups currently available
⚠️ Important Trading Rules
Wait for signal labels - Don't trade order blocks/FVGs without confirmation
Respect the stop loss - Always displayed as red dashed line
Use proper position sizing - Based on your Risk % setting
Trade during recommended sessions - When ICT Concepts enabled
Let auto-optimization work - Give it 15-20 signals before judging
One signal at a time - System prevents new signals for 5 bars after entry
🎯 Best Practices
✅ DO:
Use on liquid, trending markets (Forex majors, indices, crypto majors)
Enable only ONE trading mode matching your timeframe
Keep ICT Concepts enabled for session filtering
Trust the auto-optimization after 15+ signals
Set alerts for BUY/SELL signals
❌ DON'T:
Enable multiple trading modes simultaneously
Override stop losses manually
Trade during low liquidity hours without ICT filtering
Expect perfection - manage risk appropriately
Judge performance before 20+ signals
🔔 Alert Setup
The indicator includes 4 alert types:
Buy Signal - Long entry opportunity
Sell Signal - Short entry opportunity
Sell-Side Sweep - Liquidity grabbed above
Buy-Side Sweep - Liquidity grabbed below
Set up alerts via TradingView's alert menu for real-time notifications.
📈 Performance Tracking
The dashboard shows real-time performance metrics:
Win Rate % - Percentage of profitable signals
Parameter adjustments - How the system is adapting
Neural Score - AI confidence (0-1 scale)
ICT Session Status - Whether optimal trading hours are active
💡 Pro Tips
Start conservative - Use recommended settings for your timeframe
Give it time - Auto-optimization needs 20-30 signals for best results
Higher timeframes = higher quality - Fewer but better signals
Volume matters - Strongest signals occur on volume spikes
Structure alignment - Best trades align with overall trend
⚙️ Technical Requirements
Minimum Timeframe: 1 minute
Maximum Timeframe: Monthly
Best Timeframes: 5m, 15m, 1h, 4h
Asset Classes: Forex, Crypto, Indices, Stocks
Account Type: Any (works with all TradingView plans)
📞 Support & Updates
This indicator is actively maintained and updated based on user feedback. Future updates will include additional features and optimizations.
Disclaimer: Trading involves substantial risk. This indicator is a tool to assist analysis, not a guarantee of profits. Always use proper risk management and never risk more than you can afford to lose. Past performance does not guarantee future results.

BBWW 2.0 Revised EN# Expert Review: BBWW 2.0 (Bollinger Bands Wing Waves)
**Verdict:** This is not just an indicator, but a full-fledged **system for visualizing market regimes**. Unlike standard Bollinger Bands, which only show volatility and deviation, BBWW 2.0 decodes **crowd psychology**, separating price movements into momentum phases (Fear/Greed) and decay phases (Correction).
This is a tool for **trend** and **swing** traders operating on volatility breakouts.
---
## How It Works: Under the Hood
At its core lies the classic mathematics of standard deviation, enhanced by advanced digital filters (Gaussian, Butterworth, SWMA).
The main "feature" of the indicator is the **Wing Waves** algorithm, which analyzes three vectors simultaneously:
1. Direction of the Basis (central line).
2. Dynamics of the Upper Band (expansion/contraction).
3. Dynamics of the Lower Band (expansion/contraction).
The combination of these vectors creates 4 market states:
### 1. Greed Impulse (Color: Olive)
* **Logic:** Basis rising + Channel expanding upwards.
* **Meaning:** Aggressive buying. Volatility is increasing in the direction of the trend. This is the most profitable phase for holding long positions. Shorting here is suicide.
### 2. Greed Correction (Color: Maroon)
* **Logic:** Basis is still rising, but the lower band has started to pull up (volatility contraction).
* **Meaning:** Buyers are exhausting, taking profits. Momentum has faded, the market is drifting or preparing for a reversal.
### 3. Fear Impulse (Color: Fuchsia)
* **Logic:** Basis falling + Channel expanding downwards.
* **Meaning:** Panic selling. Strong downward impulsive movement. The best time to hold shorts or stay out of the market (for spot).
### 4. Fear Correction (Color: Teal)
* **Logic:** Basis falling, but the upper band has started to decline (contraction).
* **Meaning:** "Dead cat bounce" or bottom stabilization. Sellers are closing positions, volatility is dropping. Dangerous to open new shorts.
---
## Trading Strategies and Recommendations
As a professional trader, I recommend using BBWW 2.0 as follows:
### Strategy 1: "Surfing the Waves" (Trend Following)
Works perfectly on 1H, 4H, and 1D timeframes.
* **ENTRY:** Enter a trade when a "Correction" phase changes to an "Impulse" phase.
* *Long:* Change from Maroon (Correction) → to Olive (Greed). This is a signal that consolidation is over and the trend has resumed.
* *Short:* Change from Teal (Correction) → to Fuchsia (Fear).
* **EXIT:** As soon as the color changes to a correction phase, tighten your stop-loss or take partial profits.
### Strategy 2: "The Squeeze"
BBWW excels at showing moments when the spring is coiling.
* If you see a prolonged period of "Correction" (bands narrowing), and price is squeezed between the Basis and one of the bands — get ready for a breakout.
* Use **Basis Line touches** during a trend as an entry point to add to a position. In a strong trend, price often tests the middle (Basis) and bounces off it.
### Strategy 3: Noise Filtering
* Enable **Gaussian** or **Butterworth** filter in settings instead of the standard SMA. This removes market noise and provides a smoother Basis Line, reducing false signals in sideways markets (flat).
---
## Nuances and Risks
1. **Sideways Market (Flat):** Like any trend tool, BBWW will give false signals in a narrow range. Colors will change frequently, and bands will be horizontal.
* *Solution:* Do not trade if the Basis Line is flat (horizontal). Wait for a slope.
2. **Lag:** Any MA (Moving Average) has lag. The signal for a phase change (e.g., start of Fear) comes when the move has already started. Do not try to catch the absolute tops and bottoms. Capture the "body" of the move.
3. **Period Settings:**
* For scalping (5m-15m): Reduce period to 14-16.
* For medium-term (4H-1D): Leave at 20 or increase to 50 to filter for the global trend.
### Summary
BBWW 2.0 is a powerful visual assistant. It removes the emotional component of trading by answering the main questions: *"Is it greed or fear right now?"* and *"Is volatility rising or falling?"*.
**Best Application:** Cryptocurrencies and volatile stocks, where pump and dump phases (volatility expansions) are most pronounced.

ICT/SMC DOL Detector PRO (Final)This indicator is designed to operate only on the 1-hour timeframe.
The ICT/SMC DOL Detector PRO is an educational indicator designed to identify and visualize Draw on Liquidity (DOL) levels across multiple time-frames. It tracks unmitigated daily highs and lows, clusters them into zones, and calculates confidence scores based on multiple factors including time decay, cluster size, and time-frame alignment.
This indicator is based on ICT (Inner Circle Trader) concepts and liquidity theory, which suggests that price tends to seek out areas of concentrated unfilled orders before reversing or continuing its trend.
What is a DOL (Draw on Liquidity)?
A Draw on Liquidity represents a daily high or low that has not been revisited (mitigated) by price. These levels act as "magnets" that draw price toward them because:
1. They represent untapped liquidity pools where unfilled orders exist
2. Market makers and institutions often target these levels to fill large orders
3. Price is drawn to these zones to clear pending orders
4. They can serve as potential reversal or continuation zones once liquidity is taken
Methodology
1. Level Tracking
The indicator monitors daily session highs and lows on the 1-hour time-frame, tracking:
- Session high price and time of formation
- Session low price and time of formation
- Whether each level has been breached (mitigated)
- Time elapsed since level formation
2. Clustering Algorithm
Unmitigated levels within a defined tolerance (default 0.5% of price) are grouped together to identify zones where multiple DOLs cluster. Larger clusters indicate stronger liquidity pools.
3. Confidence Scoring (The "AI" Logic)
Each DOL receives a confidence score (0-100%) based on three weighted factors. This is the core "AI" intelligence of the indicator:
**Factor 1: Cluster Size (50% weight)**
- Counts how many unmitigated levels exist within 0.5% of the price zone
- Formula: (levels_in_cluster / total_unmitigated_levels) × 50
- Logic: More unfilled orders clustered together = stronger liquidity pool = higher confidence
- Example: If 5 out of 10 total unmitigated levels cluster at 27,500, cluster score = (5/10) × 50 = 25%
**Factor 2: Time Decay (25% weight)**
- Calculates age of the level since formation
- Fresh levels (< 1 week old): Full 25% score
- Aging penalty: Loses 5% per week of age
- Maximum penalty: 25% (very old levels = 0% time score)
- Formula: max(0, 25 - (weeks_old × 5))
- Logic: Recent liquidity is more relevant than old liquidity that price has ignored for months
**Factor 3: Timeframe Alignment (25% weight)**
- Checks how many timeframes (1H, 4H, D1, W1) point in the same direction
- If multiple timeframes identify DOLs on the same side (all bullish or all bearish): Higher score
- If mixed signals: Lower score
- Formula: (aligned_timeframes / total_timeframes) × 25
- Logic: When multiple timeframes agree, the liquidity zone is validated across different time perspectives
**Total Confidence Score:**
```
Confidence = Cluster_Score + Time_Score + Alignment_Score
= (0-50%) + (0-25%) + (0-25%)
= 0-100%
```
**Example Calculation:**
```
DOL at 27,500:
- 6 out of 12 unmitigated levels cluster here → (6/12) × 50 = 25%
- Level is 2 weeks old → 25 - (2 × 5) = 15%
- 3 out of 4 timeframes bullish toward this level → (3/4) × 25 = 18.75%
- Total Confidence = 25% + 15% + 18.75% = 58.75% ≈ 59%
```
This mathematical approach removes subjectivity and provides objective, data-driven confidence scoring.
4. Multi-Timeframe Analysis
The indicator analyzes DOLs across four timeframes:
- **1H:** Intraday levels (fastest reaction)
- **4H:** Short-term swing levels
- **Daily:** Intermediate-term levels
- **Weekly:** Long-term structural levels
For each timeframe, it identifies:
- Highest confidence unmitigated high
- Highest confidence unmitigated low
- Directional bias (bullish if high > low confidence, bearish if low > high confidence)
5. Primary DOL Selection (AI Auto-Selection Logic)
When "Show AI DOL" is enabled, the indicator uses an automated selection algorithm to identify the most important targets:
**Step 1: Collect All Candidates**
The algorithm gathers all identified DOLs from all timeframes (1H, 4H, D1, W1) that meet minimum criteria:
- Must be unmitigated (not yet swept)
- Must have confidence score > 0%
- Must have at least 1 level in cluster
**Step 2: Calculate Confidence for Each**
Each candidate DOL receives its confidence score using the three-factor formula described above (Cluster + Time + Alignment).
**Step 3: Sort by Confidence**
All candidates are ranked from highest to lowest confidence score.
**Step 4: Select Primary and Secondary**
- **P1 (Primary DOL):** The DOL with the absolute highest confidence score
- **P2 (Secondary DOL):** The DOL with the second highest confidence score
**Why This Matters:**
Instead of manually scanning multiple timeframes and guessing which level is most important, the AI objectively identifies the two highest-probability liquidity targets based on quantifiable data.
**Example AI Selection:**
```
Available DOLs:
- 1H High: 27,400
- 4H High: 27,500
- D1 High: 27,500 ← P1 (Highest)
- W1 High: 27,650 ← P2 (Second Highest)
- 1H Low: 26,800
- D1 Low: 26,500
AI Selection:
P1 = 27,500 (Daily High with 92% confidence)
P2 = 27,650 (Weekly High with 88% confidence)
```
This provides a data-driven target selection rather than subjective manual interpretation. The AI removes emotion and bias, selecting targets based purely on mathematical probability.
Features
Why "AI" DOL?
The term "AI" in this indicator refers to the automated algorithmic selection process, not machine learning or neural networks. Specifically:
**What the AI Does:**
- Automatically evaluates all available DOLs across all timeframes
- Applies a weighted scoring algorithm (Cluster 50%, Time 25%, Alignment 25%)
- Objectively ranks DOLs by probability
- Selects the top 2 highest-confidence targets (P1 and P2)
- Removes human bias and emotion from target selection
**What the AI Does NOT Do:**
- It does not use machine learning or train on historical data
- It does not predict future price movements
- It does not adapt or "learn" over time
- It does not guarantee accuracy
The "AI" is simply an automated decision-making algorithm that applies consistent mathematical rules to identify the most statistically significant liquidity zones. Think of it as a "smart filter" rather than artificial intelligence in the traditional sense.
Visual Components
**Daily Level Lines:**
- Green lines: Unmitigated (not yet breached) levels
- Red lines: Mitigated (already breached) levels
- Dots at origin point showing where level was formed
- X marker when level gets breached
- Lines extend forward to show projection
**DOL Labels:**
- Display timeframe (1H, 4H, D1, W1) or "DOL" for AI selection
- Show confidence percentage in brackets
- Color-coded by timeframe:
- Lime: AI DOL (Smart selection)
- Aqua: 1-hour timeframe
- Blue: 4-hour timeframe
- Purple: Daily timeframe
- Orange: Weekly timeframe
**Info Box (Top Right):**
Displays comprehensive liquidity metrics:
- Total levels tracked
- Active (unmitigated) levels count
- Cleared (mitigated) levels count
- Flow direction (BID PRESSURE / OFFER PRESSURE)
- Most recent sweep
- Primary and Secondary DOL targets
- Multi-timeframe bias analysis
- Overall directional bias
Settings Explained
**Daily Levels Group:**
- Show Daily Highs/Lows: Toggle visibility of all daily level tracking
- Unbreached Color: Color for levels not yet hit
- Breached Color: Color for levels that have been swept
- Show X on Breach: Display marker when level is breached
- Show Dot at Origin: Display marker at level formation point
- Line Width: Thickness of level lines (1-5)
- Line Extension: How many bars forward to project (1-24)
- Max Days to Track: Historical lookback period (5-200 days)
**DOL Settings Group:**
- Cluster Tolerance %: Price range to group DOLs (0.1-2.0%)
- Show Price on Labels: Display actual price value on labels
- Backtest Mode: Only show recent labels for clean historical analysis
- Labels Lookback: Number of bars to show labels when backtesting (10-500)
**Info Box Group:**
- Show Info Box: Toggle info panel visibility
**DOL Toggles Group:**
- Show AI DOL: Display smart auto-selected primary target
- Show 1HR DOL: Display 1-hour timeframe DOLs
- Show 4HR DOL: Display 4-hour timeframe DOLs
- Show Daily DOL: Display daily timeframe DOLs
- Show Weekly DOL: Display weekly timeframe DOLs
**Advanced Group:**
- Manual Mode: Simplified display showing only daily high/low clusters
How to Use This Indicator
Educational Application
This indicator is intended for educational purposes to help traders:
1. **Understand Liquidity Concepts:** Visualize where unfilled orders may exist
2. **Identify Key Levels:** See where price may be drawn to
3. **Analyze Market Structure:** Understand how price interacts with liquidity
4. **Study Multi-Timeframe Alignment:** Observe when multiple timeframes agree
5. **Learn ICT Concepts:** Apply liquidity theory in practice
Interpretation Guidelines
**BID PRESSURE (Flow):**
When lows are being swept more than highs, it suggests:
- Sell-side liquidity being taken
- Potential for upward move to unfilled buy-side liquidity
- Market may be clearing the way for a bullish move
**OFFER PRESSURE (Flow):**
When highs are being swept more than lows, it suggests:
- Buy-side liquidity being taken
- Potential for downward move to unfilled sell-side liquidity
- Market may be clearing the way for a bearish move
**Confidence Scores:**
- 90-100%: Very high probability zone (strong cluster, recent, aligned)
- 80-89%: High probability zone (good cluster, relatively recent)
- 70-79%: Moderate probability zone (decent cluster or older)
- 60-69%: Lower probability zone (small cluster or very old)
- Below 60%: Weak zone (minimal confluence)
**Timeframe Analysis:**
- All timeframes LONG: Strong bullish alignment
- All timeframes SHORT: Strong bearish alignment
- Mixed: Conflicting signals, exercise caution
- Higher timeframes (D1, W1) carry more weight than lower (1H, 4H)
**DIRECTIONAL Indicator:**
- BULLISH: Overall bias suggests upward movement toward buy-side DOLs
- BEARISH: Overall bias suggests downward movement toward sell-side DOLs
- NEUTRAL: No clear directional bias, conflicting signals
Practical Application Examples
**Example 1: Bullish Setup**
```
Flow: BID PRESSURE (lows being swept)
P1: 27,500 (price above current market)
D1: LONG 27,500
W1: LONG 27,650
DIRECTIONAL: BULLISH
```
Interpretation: Price has cleared sell-side liquidity. High confidence buy-side DOL at 27,500. Daily and Weekly timeframes aligned bullish. Watch for move toward 27,500 target.
**Example 2: Bearish Setup**
```
Flow: OFFER PRESSURE (highs being swept)
P1: 26,200 (price below current market)
D1: SHORT 26,200
W1: SHORT 26,100
DIRECTIONAL: BEARISH
```
Interpretation: Price has cleared buy-side liquidity. High confidence sell-side DOL at 26,200. Daily and Weekly timeframes aligned bearish. Watch for move toward 26,200 target.
**Example 3: Mixed Signals - Wait**
```
Flow: BID PRESSURE
P1: 26,800
D1: LONG 27,000
W1: SHORT 26,200
DIRECTIONAL: NEUTRAL
```
Interpretation: Conflicting signals. Flow suggests up, but Weekly bias is down. Confidence scores moderate. Better to wait for clarity.
Important Considerations
This Indicator Does NOT:
- Predict the future
- Guarantee profitable trades
- Provide buy/sell signals
- Replace proper risk management
- Work in isolation without other analysis
This Indicator DOES:
- Visualize liquidity concepts
- Identify potential target zones
- Show timeframe alignment
- Calculate objective confidence scores
- Help understand market structure
Proper Usage:
1. Use as one component of a complete trading strategy
2. Combine with price action analysis
3. Confirm with other technical indicators
4. Consider fundamental factors
5. Always use proper risk management
6. Backtest any strategy before live trading
Risk Disclaimer
**FOR EDUCATIONAL PURPOSES ONLY**
This indicator is for educational purposes only. Trading financial markets involves substantial risk of loss. Past performance does not guarantee future results. Always conduct your own research and consult with a financial advisor before making trading decisions.
**Important Limitations:**
- No indicator is 100% accurate, including the AI selection
- The "AI" is an automated algorithm, not predictive artificial intelligence
- DOL levels can be swept and price can continue in the same direction
- Confidence scores are mathematical calculations, not predictions or probabilities of success
- High confidence does not mean guaranteed profit
- Markets can remain irrational longer than you can remain solvent
- Always use stop losses and proper position sizing
**Understanding the AI Component:**
The AI auto-selection feature uses a fixed mathematical formula to rank DOLs. It does not:
- Predict where price will go
- Learn from past performance
- Adapt to market conditions
- Guarantee any level of accuracy
The confidence score represents the mathematical strength of a liquidity cluster based on objective factors (cluster size, recency, timeframe alignment), NOT a probability of the trade succeeding.
**Risk Warning:**
Trading is risky. Most traders lose money. This indicator cannot change that fundamental reality. Use it as an educational tool to understand market structure, not as a trading signal or system.
Technical Requirements
- **Timeframe:** Best used on 1-hour charts (required for accurate daily level tracking)
- **Markets:** Works on any market (forex, crypto, stocks, futures, indices)
- **Updates:** Real-time calculation on each bar close
- **Resources:** Uses max 500 lines and 500 labels (TradingView limits)
Backtesting Features
The indicator includes "Backtest Mode" to keep historical charts clean:
- When enabled, only shows labels from recent bars
- Adjustable lookback period (10-500 bars)
- All lines remain visible
- Helps review past setups without clutter
To use:
1. Enable "Backtest Mode" in settings
2. Adjust "Labels Lookback" to desired period
3. Review historical price action
4. Disable for live trading
Credits and Methodology
This indicator implements concepts from:
- ICT (Inner Circle Trader) liquidity theory
- Smart Money Concepts (SMC)
- Order flow analysis
- Multi-timeframe analysis principles
The clustering algorithm, confidence scoring, and timeframe synthesis are original implementations designed to quantify and visualize these concepts.
Version History
**v1.0 - Initial Release**
- Multi-timeframe DOL detection
- Confidence scoring system
- Info box with liquidity metrics
- Backtest mode for clean charts
- Black/white professional theme
Support and Updates
For questions, feedback, or suggestions, please use the TradingView comments section. Updates and improvements will be released as needed based on user feedback and market evolution.
**Remember:** This is an educational tool. Successful trading requires knowledge, discipline, risk management, and continuous learning. Use this indicator to enhance your understanding of market structure and liquidity, not as a standalone trading system.

Quantum Market Analyzer X7Quantum Market Analyzer X7 - Complete Study Guide
Table of Contents
1. Overview
2. Indicator Components
3. Signal Interpretation
4. Live Market Analysis Guide
5. Best Practices
6. Limitations and Considerations
7. Risk Disclaimer
________________________________________
Overview
The Quantum Market Analyzer X7 is a comprehensive multi-timeframe technical analysis indicator that combines traditional and modern analytical methods. It aggregates signals from multiple technical indicators across seven key analysis categories to provide traders with a consolidated view of market sentiment and potential trading opportunities.
Key Features:
• Multi-Indicator Analysis: Combines 20+ technical indicators
• Real-Time Dashboard: Professional interface with customizable display
• Signal Aggregation: Weighted scoring system for overall market sentiment
• Advanced Analytics: Includes Order Block detection, Supertrend, and Volume analysis
• Visual Progress Indicators: Easy-to-read progress bars for signal strength
________________________________________
Indicator Components
1. Oscillators Section
Purpose: Identifies overbought/oversold conditions and momentum changes
Included Indicators:
• RSI (14): Relative Strength Index - momentum oscillator
• Stochastic (14): Compares closing price to price range
• CCI (20): Commodity Channel Index - cycle identification
• Williams %R (14): Momentum indicator similar to Stochastic
• MACD (12,26,9): Moving Average Convergence Divergence
• Momentum (10): Rate of price change
• ROC (9): Rate of Change
• Bollinger Bands (20,2): Volatility-based indicator
Signal Interpretation:
• Strong Buy (6+ points): Multiple oscillators indicate oversold conditions
• Buy (2-5 points): Moderate bullish momentum
• Neutral (-1 to 1 points): Balanced conditions
• Sell (-2 to -5 points): Moderate bearish momentum
• Strong Sell (-6+ points): Multiple oscillators indicate overbought conditions
2. Moving Averages Section
Purpose: Determines trend direction and strength
Included Indicators:
• SMA: 10, 20, 50, 100, 200 periods
• EMA: 10, 20, 50 periods
Signal Logic:
• Price >2% above MA = Strong Buy (+2)
• Price above MA = Buy (+1)
• Price below MA = Sell (-1)
• Price >2% below MA = Strong Sell (-2)
Signal Interpretation:
• Strong Buy (6+ points): Price well above multiple MAs, strong uptrend
• Buy (2-5 points): Price above most MAs, bullish trend
• Neutral (-1 to 1 points): Mixed MA signals, consolidation
• Sell (-2 to -5 points): Price below most MAs, bearish trend
• Strong Sell (-6+ points): Price well below multiple MAs, strong downtrend
3. Order Block Analysis
Purpose: Identifies institutional support/resistance levels and breakouts
How It Works:
• Detects historical levels where large orders were placed
• Monitors price behavior around these levels
• Identifies breakouts from established order blocks
Signal Types:
• BULLISH BRK (+2): Breakout above resistance order block
• BEARISH BRK (-2): Breakdown below support order block
• ABOVE SUP (+1): Price holding above support
• BELOW RES (-1): Price rejected at resistance
• NEUTRAL (0): No significant order block interaction
4. Supertrend Analysis
Purpose: Trend following indicator based on Average True Range
Parameters:
• ATR Period: 10 (default)
• ATR Multiplier: 6.0 (default)
Signal Types:
• BULLISH (+2): Price above Supertrend line
• BEARISH (-2): Price below Supertrend line
• NEUTRAL (0): Transition period
5. Trendline/Channel Analysis
Purpose: Identifies trend channels and breakout patterns
Components:
• Dynamic trendline calculation using pivot points
• Channel width based on historical volatility
• Breakout detection algorithm
Signal Types:
• UPPER BRK (+2): Breakout above upper channel
• LOWER BRK (-2): Breakdown below lower channel
• ABOVE MID (+1): Price above channel midline
• BELOW MID (-1): Price below channel midline
6. Volume Analysis
Purpose: Confirms price movements with volume data
Components:
• Volume spikes detection
• On Balance Volume (OBV)
• Volume Price Trend (VPT)
• Money Flow Index (MFI)
• Accumulation/Distribution Line
Signal Calculation: Multiple volume indicators are combined to determine institutional activity and confirm price movements.
________________________________________
Signal Interpretation
Overall Summary Signals
The indicator aggregates all component signals into an overall market sentiment:
Signal Score Range Interpretation Action
STRONG BUY 10+ Overwhelming bullish consensus Consider long positions
BUY 4-9 Moderate to strong bullish bias Look for long opportunities
NEUTRAL -3 to 3 Mixed signals, consolidation Wait for clearer direction
SELL -4 to -9 Moderate to strong bearish bias Look for short opportunities
STRONG SELL -10+ Overwhelming bearish consensus Consider short positions
Progress Bar Interpretation
• Filled bars indicate signal strength
• Green bars: Bullish signals
• Red bars: Bearish signals
• More filled bars = stronger conviction
________________________________________
Live Market Analysis Guide
Step 1: Initial Assessment
1. Check Overall Summary: Start with the main signal
2. Verify with Component Analysis: Ensure signals align
3. Look for Divergences: Identify conflicting signals
Step 2: Timeframe Analysis
1. Set Appropriate Timeframe: Use 1H for intraday, 4H/1D for swing trading
2. Multi-Timeframe Confirmation: Check higher timeframes for trend context
3. Entry Timing: Use lower timeframes for precise entry points
Step 3: Signal Confirmation Process.
For Buy Signals:
1. Oscillators: Look for oversold conditions (RSI <30, Stoch <20)
2. Moving Averages: Price should be above key MAs
3. Order Blocks: Confirm bounce from support levels
4. Volume: Check for accumulation patterns
5. Supertrend: Ensure bullish trend alignment.
For Sell Signals:
1. Oscillators: Look for overbought conditions (RSI >70, Stoch >80)
2. Moving Averages: Price should be below key MAs
3. Order Blocks: Confirm rejection at resistance levels
4. Volume: Check for distribution patterns
5. Supertrend: Ensure bearish trend alignment.
Step 4: Risk Management Integration
1. Signal Strength Assessment: Stronger signals = larger position size
2. Stop Loss Placement: Use Order Block levels for stops
3. Take Profit Targets: Based on channel analysis and resistance levels
4. Position Sizing: Adjust based on signal confidence
________________________________________
Best Practices
Entry Strategies
1. High Conviction Entries: Wait for STRONG BUY/SELL signals
2. Confluence Trading: Look for multiple components aligning
3. Breakout Trading: Use Order Block and Trendline breakouts
4. Trend Following: Align with Supertrend direction.
Risk Management
1. Never Risk More Than 2% Per Trade: Regardless of signal strength
2. Use Stop Losses: Place at invalidation levels
3. Scale Positions: Stronger signals warrant larger (but still controlled) positions
4. Diversification: Don't rely solely on one indicator.
Market Conditions
1. Trending Markets: Focus on Supertrend and MA signals
2. Range-Bound Markets: Emphasize Oscillator and Order Block signals
3. High Volatility: Reduce position sizes, widen stops
4. Low Volume: Be cautious of breakout signals.
Common Mistakes to Avoid
1. Signal Chasing: Don't enter after signals have already moved significantly
2. Ignoring Context: Consider overall market conditions
3. Overtrading: Wait for high-quality setups
4. Poor Risk Management: Always use appropriate position sizing
________________________________________
Limitations and Considerations
Technical Limitations
1. Lagging Nature: All technical indicators are based on historical data
2. False Signals: No indicator is 100% accurate
3. Market Regime Changes: Indicators may perform differently in various market conditions
4. Whipsaws: Possible in choppy, sideways markets.
Optimal Use Cases
1. Trending Markets: Performs best in clear trending environments
2. Medium to High Volatility: Requires sufficient price movement for signals
3. Liquid Markets: Works best with adequate volume and tight spreads
4. Multiple Timeframe Analysis: Most effective when used across different timeframes.
When to Use Caution
1. Major News Events: Fundamental analysis may override technical signals
2. Market Opens/Closes: Higher volatility can create false signals
3. Low Volume Periods: Signals may be less reliable
4. Holiday Trading: Reduced participation affects signal quality
________________________________________
Risk Disclaimer
IMPORTANT LEGAL DISCLAIMER FROM aiTrendview
WARNING: TRADING INVOLVES SUBSTANTIAL RISK OF LOSS
This Quantum Market Analyzer X7 indicator ("the Indicator") is provided for educational and informational purposes only. By using this indicator, you acknowledge and agree to the following terms:
No Investment Advice
• The Indicator does NOT constitute investment advice, financial advice, or trading recommendations
• All signals generated are based on historical price data and mathematical calculations
• Past performance does not guarantee future results
• No representation is made that any account will achieve profits or losses similar to those shown.
Risk Acknowledgment
• TRADING CARRIES SUBSTANTIAL RISK: You may lose some or all of your invested capital
• LEVERAGE AMPLIFIES RISK: Margin trading can result in losses exceeding your initial investment
• MARKET VOLATILITY: Financial markets are inherently unpredictable and volatile
• TECHNICAL ANALYSIS LIMITATIONS: No technical indicator is infallible or guarantees profitable trades.
User Responsibility
• YOU ARE SOLELY RESPONSIBLE for all trading decisions and their consequences
• CONDUCT YOUR OWN RESEARCH: Always perform independent analysis before making trading decisions
• CONSULT PROFESSIONALS: Seek advice from qualified financial advisors
• RISK MANAGEMENT: Implement appropriate risk management strategies
No Warranties
• The Indicator is provided "AS IS" without warranties of any kind
• aiTrendview makes no representations about the accuracy, reliability, or suitability of the Indicator
• Technical glitches, data feed issues, or calculation errors may occur
• The Indicator may not work as expected in all market conditions.
Limitation of Liability
• aiTrendview SHALL NOT BE LIABLE for any direct, indirect, incidental, or consequential damages
• This includes but is not limited to: trading losses, missed opportunities, data inaccuracies, or system failures
• MAXIMUM LIABILITY is limited to the amount paid for the indicator (if any)
Code Usage and Distribution
• This indicator is published on TradingView in accordance with TradingView's house rules
• UNAUTHORIZED MODIFICATION or redistribution of this code is prohibited
• Users may not claim ownership of this intellectual property
• Commercial use requires explicit written permission from aiTrendview.
Compliance and Regulations
• VERIFY LOCAL REGULATIONS: Ensure compliance with your jurisdiction's trading laws
• Some trading strategies may not be suitable for all investors
• Tax implications of trading are your responsibility
• Report trading activities as required by law
Specific Risk Factors
1. False Signals: The Indicator may generate incorrect buy/sell signals
2. Market Gaps: Overnight gaps can invalidate technical analysis
3. Fundamental Events: News and economic data can override technical signals
4. Liquidity Risk: Some markets may have insufficient liquidity
5. Technology Risk: Platform failures or connectivity issues may prevent order execution.
Professional Trading Warning
• THIS IS NOT PROFESSIONAL TRADING SOFTWARE: Not intended for institutional or professional trading
• NO REGULATORY APPROVAL: This indicator has not been approved by any financial regulatory authority
• EDUCATIONAL PURPOSE: Designed primarily for learning technical analysis concepts
FINAL WARNING
NEVER INVEST MONEY YOU CANNOT AFFORD TO LOSE
Trading financial instruments involves significant risk. The majority of retail traders lose money. Before using this indicator in live trading:
1. Practice on paper/demo accounts extensively
2. Start with small position sizes
3. Develop a comprehensive trading plan
4. Implement strict risk management rules
5. Continuously educate yourself about market dynamics
By using the Quantum Market Analyzer X7, you acknowledge that you have read, understood, and agree to this disclaimer. You assume full responsibility for all trading decisions and their outcomes.
Contact: For questions about this disclaimer or the indicator, contact aiTrendview through official TradingView channels only.
________________________________________
This study guide and indicator are published on TradingView in compliance with TradingView's community guidelines and house rules. All users must adhere to TradingView's terms of service when using this indicator.
Document Version: 1.0
Publisher: aiTrendview
________________________________________
Disclaimer
The content provided in this blog post is for educational and training purposes only. It is not intended to be, and should not be construed as, financial, investment, or trading advice. All charting and technical analysis examples are for illustrative purposes. Trading and investing in financial markets involve substantial risk of loss and are not suitable for every individual. Before making any financial decisions, you should consult with a qualified financial professional to assess your personal financial situation.

One Minute AI scalper keep extended trading hours on# One Minute AI Scalper - Trading Indicator
## Overview
The One Minute AI Scalper is a precision-engineered trading indicator designed specifically for short-term scalping strategies on 1-minute timeframes. This indicator combines multiple technical analysis methods to identify high-probability entry points for both long and short positions, making it ideal for active traders seeking quick, momentum-based opportunities.
## Key Features
### Visual Signals
- **Long Entry Arrows**: Clear green triangle markers appear below price bars when bullish conditions align
- **Short Entry Arrows**: Clear red triangle markers appear above price bars when bearish conditions align
- Clean, uncluttered chart interface focusing on actionable signals
### Advanced Signal Generation
The indicator utilizes a sophisticated multi-factor approach to generate trading signals:
1. **Trend Analysis**: Employs moving average crossover methodology to identify the prevailing market direction
2. **Momentum Confirmation**: Analyzes candlestick patterns and price behavior to confirm momentum strength
3. **Volume Validation**: Incorporates volume analysis to distinguish between high-conviction and standard signals
4. **Reversal Detection**: Identifies potential trend reversals by examining recent price action patterns
5. **Precision Entry Filtering**: Uses specific candlestick characteristics to minimize false signals
### Alert System
Comprehensive alert functionality for all signal types:
- Long Entry alerts
- Short Entry alerts
## How It Works
### Long Position Signals
The indicator generates long entry signals when multiple bullish conditions simultaneously align, including:
- Confirmation of upward momentum through price action
- Specific candlestick structure indicating strong buying pressure
- Price position relative to key moving averages
- Recent price behavior suggesting reversal potential
- Volume characteristics supporting the move
### Short Position Signals
Short entry signals are generated when multiple bearish conditions converge, including:
- Confirmation of downward momentum through price action
- Specific candlestick structure indicating strong selling pressure
- Price position relative to key moving averages
- Recent price behavior suggesting reversal potential
- Volume characteristics supporting the move
### Position Management
The indicator includes intelligent position state tracking to:
- Prevent duplicate signals while in an active position
- Generate exit signals based on opposing price action
- Maintain clear status of whether you're in a long or short position
## Best Practices
### Recommended Usage
- **Timeframe**: Optimized for 1-minute charts
- **Extended Hours**: Keep extended trading hours enabled for full market coverage
- **Markets**: Works on stocks, forex, crypto, and futures
- **Strategy**: Best suited for scalping and day trading strategies
### Risk Management
- Always use proper stop-loss orders
- Consider position sizing based on account risk tolerance
- Pay attention to volume-indicated signals for higher conviction trades
- Avoid trading during low-liquidity periods
- Combine with your own risk management rules
### Trading Tips
- Higher volume signals generally indicate stronger conviction
- Wait for clear arrow signals rather than trying to anticipate them
- Monitor overall market conditions and major support/resistance levels
- Be aware of news events that may cause unusual volatility
- Practice in a paper trading account before using real capital
## Important Notes
### What This Indicator Does
✅ Provides clear visual entry signals for long and short positions
✅ Incorporates multiple technical factors for signal generation
✅ Includes volume analysis for conviction assessment
✅ Offers comprehensive alert options for all signal types
✅ Maintains position state awareness
### What This Indicator Doesn't Do
❌ Does not guarantee profitable trades
❌ Does not provide specific price targets or stop-loss levels
❌ Does not replace the need for proper risk management
❌ Does not account for fundamental analysis or news events
❌ Does not adapt settings automatically to market conditions
## Disclaimer
This indicator is provided for educational and informational purposes only. It is not financial advice, and past performance does not guarantee future results. Trading involves substantial risk of loss, and you should only trade with capital you can afford to lose. Always conduct your own research and consider consulting with a qualified financial advisor before making trading decisions.
## Configuration
This indicator uses fixed, optimized parameters that have been carefully calibrated for 1-minute scalping. No user configuration is required - simply add it to your chart and monitor for signals.
## Support
For questions, suggestions, or feedback about this indicator, please use the comments section or contact the author directly through TradingView.
---
**Version**: 6.0
**Category**: Momentum/Scalping
**Overlay**: Yes
**Timeframe**: 1 minute (optimized)

Net Profit Margin %📌 Net Profit Margin % Indicator — Short Explanation
This indicator calculates and displays a company’s Net Profit Margin (NPM) using its financial statements.
What it does:
Pulls Net Income and Total Revenue from the company’s quarterly (FQ) or yearly (FY) financials.
Calculates:
Net Profit Margin = (Net Income / Revenue) × 100
Plots the NPM% as a line chart.
Background turns green when margin is positive and red when negative.
Shows the latest NPM value in a small info table on the chart.
Purpose:
Helps you quickly see whether a company is profitable and how its profit margin is trending over time.

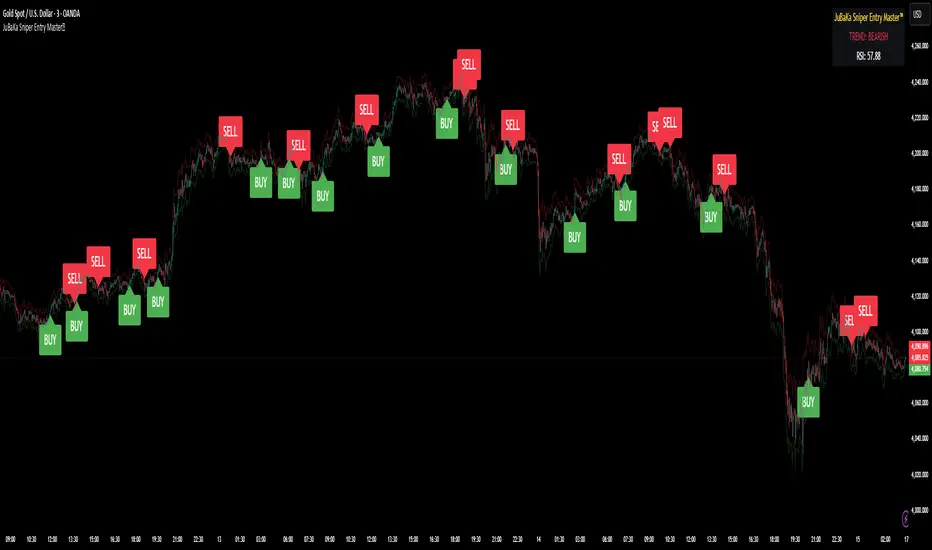
JuBaKa Sniper Entry Master™JuBaKa Sniper Entry Master™ — Premium High-Precision Scalping System
JuBaKa Sniper Entry Master™ is a professional-grade scalping indicator engineered specifically for XAUUSD, NAS100, US30, GER30, and BTC.
It combines trend structure, momentum pressure, RSI confirmation, and non-repainting crossover logic to produce extremely precise sniper entries.
Designed with fixed internal parameters, this invite-only indicator provides a clean, simplified, black-box experience with no inputs — just powerful entries and dynamic stop guidance.
🔥 KEY FEATURES
✓ Sniper Entry Engine
Signals only appear when all conditions align:
• Trend direction
• Momentum pressure
• RSI confirmation
• Non-repainting cross structure
✓ Ultra-Clean Scalping Signals
Perfect for 1m, 3m, 5m, and 15m timeframes.
✓ Fixed Internal Settings (Locked Version)
No inputs to tweak — removes confusion and keeps behavior consistent.
✓ ATR Adaptive Stoploss Line
Automatically adjusts to volatility; perfect for scalpers.
✓ Trend Ribbon
Green = Bullish
Red = Bearish
✓ Alert Ready
BUY and SELL alerts for automation, webhook bots, and mobile trading.
⭐ BEST FOR
✔ Gold (XAUUSD) Scalping
✔ NAS100 / US30 Fast Indices
✔ High-volatility markets
✔ Traders who want early entries
✔ Traders who prefer simple, execution-ready signals
✔ Anyone needing a non-repainting scalping tool
🚀 ACCESS INSTRUCTIONS
This is a premium invite-only indicator.
To gain access:
Complete payment on the official page
Send your TradingView username via Mail
Access will be granted within minutes
The indicator will appear under:
Indicators → Invite-Only Scripts → JuBaKa Sniper Entry Master™
Support (Payments / Access):
Mail: jubaka.com@gmail.com
🏆 JuBaKa Sniper Entry Master™
Precision. Speed. Profitable Entries.
🎓 Smart Beginner Pro - AI Trading Assistant🎓 Smart Beginner Pro - AI Trading Assistant
Short Description:
Your perfect FIRST trading indicator! Clear BUY/SELL signals with automatic risk management. Learn professional trading while getting 5-star rated entries. Built-in education + Stop Loss/Take Profit included. No experience needed!
🎯 FULL DESCRIPTION
Smart Beginner Pro is the ONLY indicator designed specifically to help complete beginners start trading professionally from day one!
Unlike complicated indicators that overwhelm you with information, Smart Beginner Pro makes trading simple while teaching you professional techniques.
🌟 What Makes This Special?
⭐ 5-Star Quality Rating System
Every signal is rated 1-5 stars based on:
✅ Trend alignment
✅ Major trend confirmation
✅ Volume analysis
✅ RSI health check
✅ Trend strength
You always know EXACTLY how good a setup is before entering!
Example:
⭐⭐⭐⭐⭐ = Perfect setup (all factors aligned)
⭐⭐⭐⭐ = Excellent setup (4/5 factors)
⭐⭐⭐ = Good setup (3/5 factors)
Choose your preferred quality level - Conservative traders only take 5-star signals!
🎓 Built-in Education
Learn WHILE You Trade!
This isn't just an indicator - it's your AI trading teacher!
Beginner Mode Features:
✅ Educational tooltips on every signal
✅ Explains WHY each signal appears
✅ Shows what each factor means
✅ Teaches you professional analysis
✅ Risk management guidance included
After a few weeks, you'll understand:
How trends work
Why volume matters
When to enter trades
How to manage risk
Professional trading concepts
Turn OFF Beginner Mode when ready for cleaner charts!
🛡️ Automatic Risk Management
Never Wonder Where to Place Stops Again!
Every signal comes with:
Entry Zone (Green box)
Exact entry price shown
Small buffer zone for entry
Stop Loss (Red box)
Calculated using ATR (volatility)
Placed at safe distance
Protects your capital
Take Profit 1 (Yellow box)
First profit target (50% of full target)
Partial profit recommended
Take Profit 2 (Green box)
Full profit target (1:3 risk/reward default)
Let winners run!
Risk/Reward Ratio: Always displayed!
Default: 1:3 (Risk $10 to make $30)
Customizable: 1.5 to 5.0
Professional money management built-in
🎯 Crystal Clear Signals
No Confusion. No Guessing.
BUY Signals:
🟢 HUGE green arrow below bar
Text says "BUY"
Star rating above
Can't miss it!
SELL Signals:
🔴 HUGE red arrow above bar
Text says "SELL"
Star rating below
Impossible to miss!
WAIT (No Signal):
⚪ Dashboard shows "WAIT"
Don't trade when no signal
Patience is key!
📊 Live Dashboard
All Information at a Glance:
Everything you need to make a decision - RIGHT THERE!
⚙️ Three Sensitivity Modes
Choose your trading style:
🎯 Conservative (Recommended for Beginners)
✅ Only 5-star signals
✅ 2-3 signals per day
✅ Highest win rate
✅ Best for learning
✅ Perfect for part-time traders
⚖️ Balanced (Default)
✅ 4-5 star signals
✅ 5-8 signals per day
✅ Good win rate
✅ More opportunities
✅ Best for most traders
⚡ Aggressive (For Active Traders)
✅ 3-5 star signals
✅ 10-15 signals per day
✅ More trades
✅ Requires experience
✅ For full-time traders
Start Conservative → Move to Balanced → Then Aggressive as you improve!
🌍 Works on EVERYTHING
✅ All Markets:
Forex (EUR/USD, GBP/USD, etc.)
Crypto (Bitcoin, Ethereum, etc.)
Stocks (Apple, Tesla, etc.)
Indices (S&P 500, NASDAQ, etc.)
Commodities (Gold, Silver, Oil, etc.)
✅ All Timeframes:
M5-M15: Scalping (quick trades)
M15-H1: Day trading (same day)
H4-D1: Swing trading (multi-day)
One indicator for your entire trading career!
🕐 Session Highlighting
Trade at the Right Time!
Background colors show best trading sessions:
🟢 Green = London Session (8 AM - 4 PM GMT)
High liquidity
Best for EUR/GBP pairs
🔵 Blue = New York Session (1 PM - 9 PM GMT)
Maximum liquidity
Best for all USD pairs
No color = Asian Session
Lower liquidity
Beginners: Avoid or trade carefully
Toggle ON/OFF in settings if you don't need it.
📚 How to Use (Step by Step)
For Complete Beginners:
Step 1: Add to Chart
1. Open your favorite pair (Start with EUR/USD)
2. Set timeframe to M15
3. Add "Smart Beginner Pro" indicator
4. Done! Default settings work great!
Step 2: Wait for Signal
1. Watch the dashboard
2. When it says "BUY" or "SELL" → A signal appeared!
3. Check the star rating (aim for 4-5 stars)
4. Look at "Safe to Trade" (should be ✅ YES)
Step 3: Enter Trade
1. Enter at current market price
2. Set Stop Loss at RED box level
3. Set Take Profit at GREEN box level (TP2)
4. Optional: Take partial profit at YELLOW box (TP1)
Step 4: Manage Trade
1. Let the trade run to TP or SL
2. Don't move stops (trust the system)
3. When TP1 hit: Close 50%, let rest run
4. When TP2 hit or SL hit: Close completely
Step 5: Learn & Improve
1. Review what happened
2. Was it a 5-star? How did it perform?
3. Read the tooltips (Beginner Mode)
4. Understand WHY signals work
5. Get better with each trade!
💡 Trading Rules for Success
🟢 DO:
✅ Only trade 4-5 star signals at first
✅ Use proper position sizing (1-2% risk)
✅ Always set Stop Loss (use indicator levels)
✅ Be patient (wait for quality setups)
✅ Trade during good sessions (London/NY)
✅ Learn from each trade
✅ Keep a trading journal
🔴 DON'T:
❌ Trade 1-2 star signals (not shown anyway)
❌ Risk more than 2% per trade
❌ Move stop losses (honor them!)
❌ Trade without a signal
❌ Overtrade (quality > quantity)
❌ Trade when "Safe to Trade" says NO
❌ Trade on emotion
⚙️ Settings Explained
📊 Mode Settings
Beginner Mode (Default: ON)
What it does:
- Shows educational tooltips
- Displays "Why?" explanations
- Extra help text
- Star ratings always visible
Turn OFF when:
- You understand the signals
- Want cleaner charts
- Prefer minimal interface
Signal Sensitivity
Conservative: Only perfect setups (5 stars)
Balanced: Good setups (4-5 stars)
Aggressive: Okay setups (3-5 stars)
Tip: Start Conservative, upgrade as you improve!
📈 Trend Settings
Fast EMA (Default: 9)
Shorter period = More responsive
Longer period = Smoother trend
Recommended: Keep at 9
Slow EMA (Default: 21)
Used with Fast EMA for crossovers
Recommended: Keep at 21
Standard setting works best
Major Trend EMA (Default: 200)
The "big picture" trend
Above = Uptrend | Below = Downtrend
Never trade against this!
Recommended: Keep at 200
Show EMAs (Default: ON)
Toggle if you want cleaner chart
EMAs still calculated even if hidden
Dashboard still shows trend direction
🛡️ Risk Management
Risk/Reward Ratio (Default: 3.0)
How much profit vs risk
3.0 = Risk $10 to make $30
Conservative: 2.0
Balanced: 3.0
Aggressive: 4.0-5.0
Higher = Bigger targets (but fewer hits)
Stop Loss ATR Multiplier (Default: 1.5)
How far stop loss is placed
Based on volatility (ATR)
Tight: 1.0 (more stops hit)
Balanced: 1.5
Loose: 2.0-3.0 (fewer stops, bigger risk)
Show Entry/SL/TP Boxes (Default: ON)
Toggle the colored risk boxes
Keep ON for visual guidance
Turn OFF for minimal charts
🎨 Visual Settings
Highlight Trading Sessions (Default: ON)
Shows London/NY sessions with color
Helps you trade at best times
Turn OFF if you trade 24/7
Show Trend Strength Bar (Default: ON)
Shows trend strength percentage
Useful for filtering weak trends
Turn OFF if not needed
🎓 Educational Value
What You'll Learn:
Week 1-2: Basics
✅ How to read trend direction
✅ When to enter trades
✅ Where to place stop losses
✅ What risk/reward means
✅ Why some signals are better than others
Week 3-4: Intermediate
✅ How EMA crossovers work
✅ Why volume matters
✅ What RSI tells you
✅ Session timing importance
✅ Risk management principles
Month 2-3: Advanced
✅ Market structure understanding
✅ Trend vs range recognition
✅ Quality signal identification
✅ Position sizing strategies
✅ Trading psychology basics
After 3 Months:
🎯 You're no longer a beginner!
🎯 You understand price action
🎯 You can analyze markets yourself
🎯 You make informed decisions
🎯 Ready for advanced indicators
💎 Why Choose Smart Beginner Pro?
vs. Other Beginner Indicators:
Most Beginner Indicators:
❌ Just show arrows (no explanation)
❌ No quality rating
❌ No stop loss help
❌ No education
❌ Too many bad signals
❌ Confusing settings
Smart Beginner Pro:
✅ Explains WHY each signal
✅ 5-star quality system
✅ Automatic SL/TP levels
✅ Built-in education
✅ Quality over quantity
✅ Simple, clear settings
✅ Professional results from day 1
vs. Advanced Indicators:
Advanced Indicators:
❌ Too complicated for beginners
❌ Require trading knowledge
❌ No educational features
❌ Overwhelming settings
❌ Steep learning curve
Smart Beginner Pro:
✅ Simple but powerful
✅ No prior knowledge needed
✅ Teaches while you trade
✅ Easy to understand
✅ Grows with you
🚀 Quick Start Guide
First 24 Hours:
Hour 1: Setup
1. Add indicator to EUR/USD M15
2. Enable all alerts (BUY + SELL)
3. Read dashboard labels
4. Wait for first signal
Hour 2-24: Learn
1. Watch how signals appear
2. Check star ratings
3. Observe trend direction
4. Notice session highlights
5. Don't trade yet - just observe!
Day 2-7: Demo Trading
1. Open demo account
2. Trade ONLY 5-star signals
3. Use exact SL/TP from indicator
4. Risk $100 per trade (demo)
5. Keep journal of results
6. Review each trade (win or loss)
Week 2+: Real Trading
1. Start with SMALL real account ($100-500)
2. Risk only 1% per trade ($1-5)
3. Trade Conservative mode only
4. Build confidence slowly
5. Increase size as you improve
🔔 Alert System
Available Alerts:
1. BUY Signal
Triggers: When 4-5 star BUY appears
Message: "SMART BEGINNER PRO - BUY SIGNAL!"
Action: Check chart, enter if conditions met
2. SELL Signal
Triggers: When 4-5 star SELL appears
Message: "SMART BEGINNER PRO - SELL SIGNAL!"
Action: Check chart, enter if conditions met
3. 5-STAR BUY (Premium Quality)
Triggers: Only perfect 5-star BUY setups
Message: "PERFECT 5-STAR BUY SIGNAL!"
Action: Highest probability - don't miss!
4. 5-STAR SELL (Premium Quality)
Triggers: Only perfect 5-star SELL setups
Message: "PERFECT 5-STAR SELL SIGNAL!"
Action: Highest probability - don't miss!
Alert Setup:
1. Click "Create Alert" on indicator
2. Choose "BUY Signal" and "SELL Signal"
3. Set "Once Per Bar Close"
4. Enable notifications to phone/email
5. Never miss a quality setup!
📊 Best Practices
Daily Routine:
Before Market Open:
1. Check economic calendar
2. Identify trending pairs
3. Set up charts with indicator
4. Enable alerts
During Trading:
1. Wait for signal
2. Check star rating (4-5 only)
3. Verify "Safe to Trade" = YES
4. Enter with proper position size
5. Set SL/TP from boxes
6. Walk away (don't watch tick-by-tick)
After Trading:
1. Review trades in journal
2. What worked? What didn't?
3. Were they 4-5 star signals?
4. Did you follow rules?
5. Plan improvements
Position Sizing:
The 1% Rule:
Account: $1000
Risk per trade: 1% = $10
If SL is 20 pips away:
Position size = $10 / 20 pips = $0.50/pip
Simple! Never risk more than you can afford to lose.
🎯 Success Tips
From Professional Traders:
Tip #1: Quality Over Quantity
"Better to take 3 excellent trades per week
than 20 mediocre trades per day."
→ Focus on 5-star signals at first
Tip #2: Respect the Stop Loss
"The indicator calculated it for a reason.
Moving stops = breaking risk management."
→ Set it and honor it, always
Tip #3: Take Partial Profits
"Bank some profit at TP1, let the rest run to TP2.
This keeps you profitable even if TP2 doesn't hit."
→ Close 50% at TP1 (yellow box)
Tip #4: Trade Best Sessions
"London and New York overlap (1-4 PM GMT)
is the most liquid time of day."
→ Watch for green+blue background
Tip #5: Keep Learning
"Every trade is a lesson.
Winners teach confidence, losers teach discipline."
→ Journal everything, review weekly
⚠️ Important Disclaimers
Realistic Expectations:
This is NOT:
❌ A get-rich-quick scheme
❌ A 100% win rate system
❌ A replacement for education
❌ A guarantee of profits
❌ Financial advice
This IS:
✅ A learning tool
✅ A signal system with good probability
✅ A risk management helper
✅ A starting point for beginners
✅ An educational indicator
Trading Risks:
⚠️ All trading involves risk
⚠️ You can lose money
⚠️ Never trade with money you can't afford to lose
⚠️ Start small, grow slowly
⚠️ Past performance ≠ future results
⚠️ Demo trade first!
🎁 Bonus: Beginner's Checklist
Before Every Trade:
□ Signal appeared (BUY or SELL arrow)
□ Star rating is 4 or 5 stars
□ Dashboard shows "Safe to Trade: ✅ YES"
□ Trend and signal agree (both bullish or bearish)
□ Trading during London/NY session
□ Stop Loss level identified (red box)
□ Take Profit level identified (green box)
□ Position size calculated (1% risk max)
□ Emotionally ready (not revenge trading)
□ Have clear mind (not tired/stressed)
If ALL checked → TRADE
If ANY missing → SKIP
🎯 Final Words
Trading doesn't have to be complicated.
Smart Beginner Pro proves that you can:
Get professional results as a beginner
Learn proper trading techniques
Manage risk automatically
Understand WHY trades work
Build confidence step by step
This is your starting point.
Add it to your chart. Watch it work. Learn from it. Grow with it.
Welcome to professional trading! 🚀
📈 Ready to Start?
1. Click "Add to favorites"
2. Apply to your chart
3. Enable alerts
4. Wait for your first 5-star signal
5. Start your trading journey TODAY!
Questions? Comments? Success stories?
Share below! 👇
Happy Trading! 🎓📊✨
Disclaimer: This indicator is for educational purposes. Trading involves risk. Always use proper risk management and never trade with money you cannot afford to lose. Past performance does not guarantee future results.

Buy Sell Entry Filter SYS (SMC IDM LIT)BUY SELL Entry FILTER
An advanced market analysis tool. It provides visual Buy/Sell signals in the form of triangles (▲▼), as well as analytical elements such as Entry/Stop Loss lines, a delta table, overbought and oversold zones, structural market elements with breakouts, displays information from higher time frames, and most importantly, liquidity blocks that trigger reactions. The indicator has a number of built-in filters that help remove unnecessary Buy/Sell signals from the chart. This allows you to create several profitable strategies. You don't need to sit in front of the charts; the alert system (ALERTS) will tell you when to pay attention to the chart and quickly enter a trade.
There are many signals, and the ▲▼ lines themselves are not an entry point. You need to filter them using other tools, such as liquidity blocks (LB and HTF LB), trend, OS/OB, Delta, and Pullback breakout.
If the ▲▼ appears in the right place, for example, in the liquidity block with the correct trend and the correct delta, then you can enter a trade!
Ideally, take short trades of 1/3 – 1/5 RR on a 1-minute timeframe and be sure to set a stop loss.
Remember! You are solely responsible for your deposit!
Buy/Sell, Entry/SL, OS/OB, Filter, EMA, Delta
This main group of settings is responsible for generating buy and sell signals, setting filters, and displaying moving averages.
1. Buy/Sell Main: Enables/disables the display of the main Buy/Sell signal as a ▲▼. This is a specific pattern that identifies potential trend reversals or continuations.
Buy/Sell Simple: Toggles the display of a simplified Buy/Sell signal in the ▲▼ pattern.
This pattern is less powerful than the main one, but works well in certain contexts.
2. Trend Delta Table: Displays a table on the chart showing the cumulative volume delta for the current trend, as well as the percentage. Useful for assessing the strength of a trend.
3. Entry/SL: When enabled, draws horizontal lines on the chart for Entry and Stop Loss.
4. Filters (Delta, Trend, OS/OB, HTF OS/OB):
These filters help filter out false signals. A Buy/Sell signal is displayed only if it passes all enabled filters:
Delta Filter: A signal is generated if the volume percentage delta (set by the user) matches the signal direction (positive for Buy, negative for Sell).
Trend Filter (EMA): A signal is generated if it matches the trend direction.
OS/OB Filter (RSI): A signal is generated if the price where the signal formed is in the desired zone (below Oversold for Buy, above Overbought for Sell).
HTF OS/OB Filter (RSI): Same as OS/OB, but uses the RSI on a higher timeframe (HTF).
EMA 1 & EMA 2: Displays two exponential moving averages on the chart (default 50 and 100). The line color changes (e.g., green if EMA1 is above EMA2).
Overbought/oversold zone
This group configures overbought/oversold levels and zones, both on the current and higher timeframes.
1. OS/OB zone: Enables/disables the display of dynamic overbought (Oversold) and oversold (Overbought) levels. These levels "float," adapting to the current price. 2. Period: Period for calculating zones (default 50)
OS: Level below which the Oversold zone is defined (default 40).
OB: Level above which the Overbought zone is defined (default 60).
Labels: Toggles the display of text labels (--- OB, --- OS) next to the corresponding levels.
Mid: Toggles the display of the center level and its color.
HTF Zones & Labels: Same as for OS/OB, but for levels on a higher timeframe (HTF).
Smooth: Enables smoothing for calculated price levels of zones, making the lines less sharp.
Structure / Breakout line
This setting adds structural analysis elements and breakout lines to the chart. 1. BO Lines (Breakout Lines): Displays horizontal lines on the chart when the price breaks through the external pullback against the trend, thus showing ChoCh.
2. HH/LL: Displays markers (HH - LL - HL - LH) on the chart to indicate key market structural points.________________________________________
Pullbacks EXT/INT
This setting is responsible for the visualization of pullback lines (Pullback) at external (EXT) and internal (INT) levels.
1. Ext (External): Displays lines connecting external extremes (Pullback), showing potential pullback levels.
2. Int (Internal): Displays lines connecting internal extremes (Pullback).
3. Pending Ext/Int: Displays potential pullback lines that may form if the price reaches the next extreme.
Liquidity blocks
Adds visual rectangles (blocks) to the chart, representing potential liquidity zones (where large orders were placed).
1. LB tune: Parameter determining how many candles are used to determine the pattern for a block.
2. High zone: Color of the line inside the block, indicating the strongest part of the block.
3. Show deleted: Shows deleted (broken) blocks in a different color.
4. Volume LB: Enables/disables the display of the volume value in the block.
Quick liquidity blocks
Similar to main blocks, but creates quick blocks. If a quick block is confirmed, it becomes the main LB; if not, it disappears.
1. Quick LB: Enables/disables quick blocks.
2. QLB tune: Pattern length parameter for quick blocks.
HTF liquidity blocks
Displays LB from a higher timeframe (HTF), using the same principles as main blocks. 1. HTF: Enable/disable HTF blocks.
2. Select a timeframe for calculation.
Alerts
A system for alerting you to important indicator actions. Alerts are triggered by certain events.
1. Bull PB Breakout / Bear PB Breakout: Alert when the external pullback is broken and a ChoCh is formed.
2. Trend Change: Alert when a trend changes.
3. New Block: Alert when a new main liquidity block is formed.
4. New HTF Block: Alert when a new HTF liquidity block is formed.
5. Touch Block: Alert when the price of the main liquidity block is touched.
6. Touch HTF Block: Alert when the price of the HTF liquidity block is touched.
7. Touch mode / Touch mode HTF: Select the alert frequency (before or after the bar closes).
This indicator provides a powerful and flexible tool for market analysis, combining several approaches in a single interface.

Presidential ScannerThe Presidential Scanner is an advanced analysis tool that combines state-of-the-art algorithmic calculations with the processing of economic and macroeconomic data in real time.
Thanks to its intelligent technology, it detects high-potential market revenue, offering clear, profitable and highly operationally effective signals.

Tactical Holding [SwissAlgo]Tactical Holding
A visual framework for managing long-term positions across market cycles
--------------------------------------------------------------
Purpose
Instead of holding a fixed position through all market conditions , you can use this framework to adjust your exposure tactically . By reducing positions during distribution phases and accumulating during favorable accumulation zones, you may end up holding more units of the asset over complete market cycles - even if you temporarily exit or reduce exposure during unfavorable periods. This approach aims to help you compound your holdings by taking advantage of market volatility rather than simply enduring it.
--------------------------------------------------------------
Recommended Settings
Timeframe : Weekly (1W) chart
Chart Type : Standard candlesticks (select 'Bar' type Candles)
This indicator is designed for higher timeframe analysis. While it can be applied to other timeframes, the logic and signal generation are optimized for weekly charts to filter out short-term noise and focus on major market cycles.
--------------------------------------------------------------
Key Features
♦ Market State Classification
The indicator aims to categorize potential market conditions into five color-coded states based on technical confluences:
* Bull (bright green): Multiple bullish indicators align
* Bull Retrace (teal): Bullish structure with temporary weakness
* Bull ⇆ Bear Reversal (yellow): Transitional phase between trends
* Bear (bright red): Multiple bearish indicators align
* Bear Retrace (Pale Red/Maroon): Bearish structure with temporary strength
♦ Visual Elements
* Candles change color based on the current market state
* A 50-period EMA tracks with the same color coding, providing visual trend context
* Small arrow markers appear when specific pattern conditions are met (zones for potential distribution or accumulation)
* A legend table (toggle on/off) explains the color system
* A label shows the current state name on the chart
♦ Pattern Recognition
The system monitors for two types of potential entry/exit zones:
1. State transition patterns after periods of market regime consistency
2. RSI divergence patterns (when price and momentum move in opposite directions)
♦ Customization
* Toggle the legend table visibility through settings
* All calculations are transparent and use standard technical analysis methods
--------------------------------------------------------------
How It Works
Think of this indicator as a traffic light system for your portfolio:
♦ Green zones suggest the asset might be in an environment where long-term holders historically have remained invested
Bright green (Bull) : Multiple technical indicators align in a potentially strong bullish phase
Pale green (Bull Retrace) : Bullish structure remains intact, but momentum shows temporary weakness - often a pullback within an uptrend
♦ Red zones suggest conditions where long-term holders might consider reducing exposure or waiting for better entry points
Dark red (Bear) : Multiple technical indicators align in a potentially strong bearish phase
Pale red (Bear Retrace) : Bearish structure remains intact but shows temporary strength - often a bounce within a downtrend
♦ Yellow zones indicate the market is in transition between bull and bear regimes - a time for increased attention as the trend direction becomes uncertain
The system doesn't predict future prices. Instead, it helps you understand the current technical environment by doing the heavy lifting of analyzing multiple indicators at once and presenting them in a simple visual format.
Example: During the 2022 crypto bear market, the indicator would have displayed extended red periods, signaling defensive conditions for holders. When accumulation arrows appeared in late 2022-early 2023, it highlighted potential re-entry zones as the technical regime transitioned back toward green, before the 2024 recovery.
--------------------------------------------------------------
Who This Is For
♦ Long-term investors who want to hold assets through cycles but prefer a systematic approach to position sizing and timing rather than buying and never selling .
♦ Portfolio managers looking for a visual tool to help determine when to increase or decrease exposure to specific assets based on technical regime changes.
♦ Swing traders on higher timeframes who want to align their positions with the broader market structure rather than fighting the trend.
This is not designed for:
* Day traders or scalpers
* Those seeking exact entry/exit prices
* Automated trading systems (this is a visual decision-support tool)
--------------------------------------------------------------
Understanding the Visuals
When you apply Tactical Holding to a chart, you'll see:
1. Colored candles - Instantly see what market regime the asset is in
2. Colored EMA line (thick line) - Provides a dynamic support/resistance reference that changes color with market conditions
3. Small arrows (↑ ↓) - Mark bars where specific technical patterns complete
4. State label - Shows current market classification
5. Legend table (top right) - Quick reference guide for the color system
6. Warning banner (top center) - Reminds you to use weekly charts
The visual design prioritizes clarity over complexity. You should be able to glance at a chart and immediately understand the current technical environment.
--------------------------------------------------------------
Important Limitations
This indicator cannot:
* Predict future price movements
* Guarantee profitable trades
* Work equally well on all assets or timeframes
* Replace your own research and risk management
Technical considerations:
* Divergence detection has a 3-bar confirmation lag (by design, to avoid false signals)
* State transitions require multiple technical confirmations, which may cause delayed reactions to rapid market changes
* The system is reactive, not predictive - it responds to price action after it occurs
* Performance varies significantly between trending assets (like Solana) and stable assets (like Apple)
--------------------------------------------------------------
Practical Application
Consider using this indicator as one component of a broader investment framework:
♦ Understanding Position Context:
The color-coded states can help frame your thinking about current holdings:
Bull: Technical conditions that have historically been associated with sustained uptrends
Bull Retrace: Pullbacks within an overall bullish structure- these periods may offer opportunities to evaluate entry points or reassess existing positions
Reversal (Yellow): Transitional phases where the trend direction is unclear - periods that may warrant closer monitoring
Bear Retrace: Temporary strength within an overall bearish structure - rallies that historically have often faded
Bear: Technical conditions that have historically been associated with sustained downtrends
♦ Interpreting Signal Arrows:
Arrow markers indicate when specific technical pattern conditions have been met. These are observation points, not instructions:
A signal appearing doesn't mean immediate action is required
Treat arrows as prompts for further analysis rather than automatic triggers
Consider the broader context: fundamentals, your investment timeline, risk tolerance, and overall market conditions
Signals show when historical technical patterns have formed - not whether those patterns will lead to the same outcomes as in the past
The framework is designed to organize information visually, not to tell you what to do. Your investment decisions should incorporate this technical perspective alongside other factors relevant to your situation.
--------------------------------------------------------------
Technical Methodology
For transparency, the indicator uses:
* RSI (14) with a 14-period SMA to assess momentum direction
* MACD (12,26,9) to confirm trend strength and histogram momentum
* Stochastic RSI with K and D line crossovers for additional confirmation
* 50-period EMA as the primary trend filter
* Linear regression-based slope analysis to detect flat/transitional periods
* Pivot-based divergence detection following standard technical analysis principles
All calculations use publicly available technical analysis formulas. Nothing is hidden or proprietary beyond the specific combination and weighting of these standard tools.
--------------------------------------------------------------
Disclaimer
This indicator is an educational and analytical tool only. It is not financial advice.
* Trading and investing involve substantial risk of loss
* Past performance of any technical system does not indicate future results
* No indicator can predict market movements with certainty
* Always conduct your own research and consult with qualified financial professionals
* Never invest more than you can afford to lose
* The creators of this indicator are not responsible for any trading losses
* This tool is not affiliated with, endorsed by, or connected to TradingView, 3Commas, or any other trading platform
* Use of this indicator is at your own risk
Risk Management: Regardless of what any indicator shows, always use proper position sizing, stop losses, and risk management appropriate to your personal financial situation.
This indicator provides a framework for analysis. Your decisions, research, and risk management determine your results.

MA SMART Angle
### 📊 WHAT IS MA SMART ANGLE?
**MA SMART Angle** is an advanced momentum and trend detection indicator that analyzes the angles (slopes) of multiple moving averages to generate clear, non-repainting BUY and SELL signals.
**Original Concept Credit:** This indicator builds upon the "MA Angles" concept originally created by **JD** (also known as Duyck). The core angle calculation methodology and Jurik Moving Average (JMA) implementation by **Everget** are preserved from the original open-source work. The angle calculation formula was contributed by **KyJ**. This enhanced version is published with respect to the open-source nature of the original indicator.
Original indicator reference: "ma angles - JD" by Duyck
---
## 🎯 ORIGINALITY & VALUE PROPOSITION
### **What Makes This Different from the Original:**
While the original "MA Angles" by **JD** provided excellent angle visualization, it lacked actionable entry signals. **MA SMART Angle** addresses this by adding:
**1. Clear Entry/Exit Signals**
- Explicit BUY/SELL arrows based on angle crossovers, momentum confirmation, and MA alignment
- No guessing when to enter trades - the indicator tells you exactly when conditions align
**2. Non-Repainting Logic**
- All signals use confirmed historical data (shifted by 2 bars minimum)
- Critical for backtesting reliability and live trading confidence
- Original indicator could repaint signals on current bar
**3. Dual Signal System**
- **Simple Mode:** More frequent signals based on angle crossovers + momentum (for active traders)
- **Strict Mode:** Requires full multi-MA alignment + momentum confirmation (for conservative traders)
- Adaptable to different trading styles and risk tolerances
**4. Smart Signal Filtering**
- **Anti-spam cooldown:** Prevents duplicate signals within configurable bar count
- **No-trade zone detection:** Filters out low-conviction sideways markets automatically
- **Multi-timeframe MA alignment:** Ensures all moving averages agree on direction before signaling
**5. Enhanced Visualization**
- Large, clear BUY/SELL arrows with descriptive labels
- Color-coded backgrounds for market states (trending vs. ranging)
- Momentum histogram showing acceleration/deceleration in real-time
- Live status table displaying trend strength, angle value, momentum, and MA alignment
**6. Professional Alert System**
- Four distinct alert conditions: BUY Signal, SELL Signal, Strong BUY, Strong SELL
- Enables automated trade notifications and strategy integration
**7. Modified MA Periods**
- Original used EMA(27), EMA(83), EMA(278)
- Enhanced version uses faster EMA(3), EMA(8), EMA(13) for more responsive signals
- Better suited for modern volatile markets and shorter timeframes
---
## 📐 HOW IT WORKS - TECHNICAL EXPLANATION
### **Core Methodology:**
The indicator calculates angles (slopes) for five key moving averages:
- **JMA (Jurik Moving Average)** - Smooth, lag-reduced trend line (original implementation by **Everget**)
- **JMA Fast** - Responsive momentum indicator with higher power parameter
- **MA27 (EMA 3)** - Primary fast-moving average for signal generation
- **MA83 (EMA 8)** - Medium-term trend confirmation
- **MA278 (EMA 13)** - Slower trend filter
### **Angle Calculation Formula (by KyJ):**
```
angle = arctan((MA - MA ) / ATR(14)) × (180 / π)
```
**Why ATR normalization?**
- Makes angles comparable across different instruments (forex, stocks, crypto)
- Makes angles comparable across different timeframes
- Accounts for volatility - a 10-point move in different assets has different significance
**Angle Interpretation:**
- **> 15°** = Strong trend (momentum accelerating)
- **0° to 15°** = Weak trend (momentum present but moderate)
- **-2° to +2°** = No-trade zone (sideways/choppy market)
- **< -15°** = Strong downtrend
### **Signal Generation Logic:**
#### **BUY Signal Conditions:**
1. MA27 angle crosses above 0° (upward momentum initiates)
2. All three EMAs (3, 8, 13) pointing upward (trend alignment confirmed)
3. Momentum is positive for 2+ bars (acceleration, not deceleration)
4. Angle exceeds minimum threshold (not in no-trade zone)
5. Cooldown period passed (prevents signal spam)
#### **SELL Signal Conditions:**
1. MA27 angle crosses below 0° (downward momentum initiates)
2. All three EMAs pointing downward (downtrend alignment)
3. Momentum is negative for 2+ bars
4. Angle below negative threshold (not in no-trade zone)
5. Cooldown period passed
#### **Strong BUY+ / SELL+ Signals:**
Additional entry opportunities when JMA Fast crosses JMA Slow while maintaining strong directional angle - indicates momentum acceleration within established trend.
---
## 🔧 HOW TO USE
### **Recommended Settings by Trading Style:**
**Scalpers / Day Traders:**
- Signal Type: **Simple**
- Minimum Angle: **3-5°**
- Cooldown Bars: **3-5 bars**
- Timeframes: 1m, 5m, 15m
**Swing Traders:**
- Signal Type: **Strict**
- Minimum Angle: **7-10°**
- Cooldown Bars: **8-12 bars**
- Timeframes: 1H, 4H, Daily
**Position Traders:**
- Signal Type: **Strict**
- Minimum Angle: **10-15°**
- Cooldown Bars: **15-20 bars**
- Timeframes: Daily, Weekly
### **Parameter Descriptions:**
**1. Source** (default: OHLC4)
- Price data used for MA calculations
- OHLC4 provides smoothest angles
- Close is more responsive but noisier
**2. Threshold for No-Trade Zones** (default: 2°)
- Angles below this are considered sideways/ranging
- Increase for stricter filtering of choppy markets
- Decrease to allow signals in quieter trending periods
**3. Signal Type** (Simple vs. Strict)
- **Simple:** Angle crossover OR (trend + momentum)
- **Strict:** Angle crossover AND all MAs aligned AND momentum confirmed
- Start with Simple, switch to Strict if too many false signals
**4. Minimum Angle for Signal** (default: 5°)
- Only generate signals when angle exceeds this threshold
- Higher values = stronger trends required
- Lower values = more sensitive to momentum changes
**5. Cooldown Bars** (default: 5)
- Minimum bars between consecutive signals
- Prevents spam during volatile chop
- Scale with your timeframe (higher TF = more bars)
**6. Color Bars** (default: true)
- Colors chart bars based on signal state
- Green = bullish conditions, Red = bearish conditions
- Can disable if you prefer clean price bars
**7. Background Colors**
- **Yellow background** = No-trade zone (low angle, ranging market)
- **Green flash** = BUY signal generated
- **Red flash** = SELL signal generated
- All customizable or can be disabled
---
## 📊 INTERPRETING THE INDICATOR
### **Visual Elements:**
**Main Chart Window:**
- **Thick Lime/Fuchsia Line** = MA27 angle (primary signal line)
- **Medium Green/Red Line** = MA83 angle (trend confirmation)
- **Thin Green/Red Line** = MA278 angle (slow trend filter)
- **Aqua/Orange Line** = JMA Fast (momentum detector)
- **Green/Red Area** = JMA slope (overall trend context)
- **Blue/Purple Histogram** = Momentum (angle acceleration/deceleration)
**Signal Arrows:**
- **Large Green ▲ "BUY"** = Primary buy signal (all conditions met)
- **Small Green ▲ "BUY+"** = Strong momentum buy (JMA fast cross)
- **Large Red ▼ "SELL"** = Primary sell signal (all conditions met)
- **Small Red ▼ "SELL+"** = Strong momentum sell (JMA fast cross)
**Status Table (Top Right):**
- **Angle:** Current MA27 angle in degrees
- **Trend:** Classification (STRONG UP/DOWN, UP/DOWN, FLAT)
- **Momentum:** Acceleration state (ACCEL UP/DN, Up/Down)
- **MAs:** Alignment status (ALL UP/DOWN, Mixed)
- **Zone:** Trading zone status (ACTIVE vs. NO TRADE)
- **Last:** Bars since last signal
### **Trading Strategies:**
**Strategy 1: Pure Signal Following**
- Enter LONG on BUY signal
- Exit on SELL signal
- Use stop-loss at recent swing low/high
- Works best on trending instruments
**Strategy 2: Confirmation with Price Action**
- Wait for BUY signal + bullish candlestick pattern
- Wait for SELL signal + bearish candlestick pattern
- Increases win rate by filtering premature signals
- Recommended for beginners
**Strategy 3: Momentum Acceleration**
- Use BUY+/SELL+ signals for adding to positions
- Only take these in direction of primary signal
- Scalp quick moves during momentum spikes
- For experienced traders
**Strategy 4: Mean Reversion in No-Trade Zones**
- When status shows "NO TRADE", fade extremes
- Wait for angle to exit no-trade zone for reversal
- Contrarian approach for range-bound markets
- Requires tight stops
---
## ⚠️ LIMITATIONS & DISCLAIMERS
**What This Indicator DOES:**
✅ Measures momentum direction and strength via angle analysis
✅ Generates signals when multiple conditions align
✅ Filters out low-conviction sideways markets
✅ Provides visual clarity on trend state
**What This Indicator DOES NOT:**
❌ Predict future price movements with certainty
❌ Guarantee profitable trades (no indicator can)
❌ Work equally well on all instruments/timeframes
❌ Replace proper risk management and position sizing
**Known Limitations:**
- **Lagging Nature:** Like all moving averages, signals occur after momentum begins
- **Whipsaw Risk:** Can generate false signals in volatile, directionless markets
- **Optimization Required:** Parameters need adjustment for different assets
- **Not a Complete System:** Should be combined with risk management, position sizing, and other analysis
**Best Performance Conditions:**
- Strong trending markets (crypto bull runs, stock breakouts)
- Liquid instruments (major forex pairs, large-cap stocks)
- Appropriate timeframe selection (match to trading style)
- Used alongside support/resistance and volume analysis
---
## 🔔 ALERT SETUP
The indicator includes four alert conditions:
**1. BUY SIGNAL**
- Message: "MA SMART Angle: BUY SIGNAL! Angle crossed up with momentum"
- Use for: Primary long entries
**2. SELL SIGNAL**
- Message: "MA SMART Angle: SELL SIGNAL! Angle crossed down with momentum"
- Use for: Primary short entries or long exits
**3. Strong BUY**
- Message: "MA SMART Angle: Strong BUY momentum - JMA fast crossed up"
- Use for: Adding to longs or aggressive entries
**4. Strong SELL**
- Message: "MA SMART Angle: Strong SELL momentum - JMA fast crossed down"
- Use for: Adding to shorts or aggressive exits
**Setting Up Alerts:**
1. Right-click indicator → "Add Alert on MA SMART Angle"
2. Select desired condition from dropdown
3. Choose notification method (popup, email, webhook)
4. Set alert expiration (typically "Once Per Bar Close")
---
## 📚 EDUCATIONAL VALUE
This indicator serves as an excellent learning tool for understanding:
**1. Angle-Based Momentum Analysis**
- Traditional indicators show MA crossovers
- This shows the *rate of change* (velocity) of MAs
- Teaches traders to think in terms of momentum acceleration
**2. Multi-Timeframe Confirmation**
- Shows how fast, medium, and slow MAs interact
- Demonstrates importance of trend alignment
- Helps develop patience for high-probability setups
**3. Signal Quality vs. Quantity Tradeoff**
- Simple mode = more signals, more noise
- Strict mode = fewer signals, higher quality
- Teaches discretionary filtering skills
**4. Market State Recognition**
- Visual distinction between trending and ranging markets
- Helps traders avoid trading choppy conditions
- Develops "market context" awareness
---
## 🔄 DIFFERENCES FROM OTHER MA INDICATORS
**vs. Traditional MA Crossovers:**
- Measures momentum (angle) rather than just price crossing MA
- Provides earlier signals as angles change before price crosses
- Filters better for sideways markets using no-trade zones
**vs. MACD:**
- Uses multiple MAs instead of just two
- ATR normalization makes it universal across instruments
- Visual angle representation more intuitive than histogram
**vs. Supertrend:**
- Not based on ATR bands but on MA slope analysis
- Provides graduated strength indication (not just binary trend)
- Less prone to whipsaw in low volatility
**vs. Original "MA Angles" by JD:**
- Adds explicit entry/exit signals (original had none)
- Implements no-repaint logic for reliability
- Includes signal filtering and quality controls
- Provides dual signal systems (Simple/Strict)
- Enhanced visualization and status monitoring
- Uses faster MA periods (3/8/13 vs 27/83/278) for modern markets
---
## 📖 CODE STRUCTURE (for Pine Script learners)
This indicator demonstrates:
**Advanced Pine Script Techniques:**
- Custom function implementation (JMA, angle calculation)
- Var declarations for stateful tracking
- Table creation for HUD display
- Multi-condition signal logic
- Alert system integration
- Proper use of historical references for no-repaint
**Code Organization:**
- Modular function definitions (JMA, angle)
- Clear separation of concerns (inputs, calculations, plotting, alerts)
- Extensive commenting for maintainability
- Best practices for Pine Script v5
**Learning Resources:**
- Study the JMA function to understand adaptive smoothing
- Examine angle calculation for ATR normalization technique
- Review signal logic for multi-condition confirmation patterns
- Analyze anti-spam filtering for state management
The code is open-source - feel free to study, modify, and improve upon it!
---
## 🙏 CREDITS & ATTRIBUTION
**Original Concepts:**
- **"ma angles - JD" by JD (Duyck)** - Core angle calculation methodology and indicator concept
Original open-source indicator on TradingView Community Scripts
- **JMA (Jurik Moving Average) implementation by Everget** - Smooth, low-lag moving average function
Acknowledged in original JD indicator code
- **Angle Calculation formula by KyJ** - Mathematical formula for converting MA slope to degrees using ATR normalization
Acknowledged in original JD indicator code comments
**Enhancements in This Version:**
- Signal generation logic - Original implementation for this indicator
- No-repaint confirmation system - Original implementation
- Dual signal modes (Simple/Strict) - Original implementation
- Visual enhancements and status table - Original implementation
- Alert system and signal filtering - Original implementation
- Modified MA periods (3/8/13 instead of 27/83/278) - Optimization for modern markets
**Open Source Philosophy:**
This indicator follows the open-source spirit of TradingView and the Pine Script community. The original "ma angles - JD" by JD (Duyck) was published as open-source, enabling this enhanced version. Similarly, this code is published as open-source to allow further community improvements.
---
## ⚡ QUICK START GUIDE
**For New Users:**
1. Add indicator to chart
2. Start with default settings (Simple mode)
3. Wait for BUY signal (green arrow)
4. Observe how price behaves after signal
5. Check status table to understand market state
6. Adjust parameters based on your instrument/timeframe
**For Experienced Traders:**
1. Switch to Strict mode for higher quality signals
2. Increase cooldown bars to reduce frequency
3. Raise minimum angle threshold for stronger trends
4. Combine with your existing strategy for confirmation
5. Set up alerts for desired signal types
6. Backtest on your preferred instruments
---
## 🎓 RECOMMENDED COMBINATIONS
**Works Well With:**
- **Volume Analysis:** Confirm signals with volume spikes
- **Support/Resistance:** Take signals near key levels
- **RSI/Stochastic:** Avoid overbought/oversold extremes
- **ATR:** Size positions based on volatility
- **Price Action:** Wait for candlestick confirmation
**Complementary Indicators:**
- Order Flow / Footprint (for institutional confirmation)
- Volume Profile (for identifying value areas)
- VWAP (for intraday mean reversion reference)
- Fibonacci Retracements (for target setting)
---
## 📈 PERFORMANCE EXPECTATIONS
**Realistic Win Rates:**
- Simple Mode: 45-55% (higher frequency, moderate accuracy)
- Strict Mode: 55-65% (lower frequency, higher accuracy)
- Combined with price action: 60-70%
**Best Asset Classes:**
1. **Cryptocurrencies** (strong trends, clear signals)
2. **Forex Major Pairs** (smooth price action, good angles)
3. **Large-Cap Stocks** (trending behavior, liquid)
4. **Index Futures** (trending instruments)
**Challenging Conditions:**
- Low volatility consolidation periods
- News-driven erratic movements
- Thin/illiquid instruments
- Counter-trending markets
---
## 🛡️ RISK DISCLAIMER
**IMPORTANT LEGAL NOTICE:**
This indicator is for **educational and informational purposes only**. It is **NOT financial advice** and does not constitute a recommendation to buy or sell any financial instrument.
**Trading Risks:**
- Trading carries substantial risk of loss
- Past performance does not guarantee future results
- No indicator can predict market movements with certainty
- You can lose more than your initial investment (especially with leverage)
**User Responsibilities:**
- Conduct your own research and due diligence
- Understand the instruments you trade
- Never risk more than you can afford to lose
- Use proper position sizing and risk management
- Consider consulting a licensed financial advisor
**Indicator Limitations:**
- Signals are based on historical data only
- No guarantee of accuracy or profitability
- Parameters must be optimized for your specific use case
- Results vary significantly by market conditions
By using this indicator, you acknowledge and accept all trading risks. The author is not responsible for any financial losses incurred through use of this indicator.
---
## 📧 SUPPORT & FEEDBACK
**Found a bug?** Please report it in the comments with:
- Chart symbol and timeframe
- Parameter settings used
- Description of unexpected behavior
- Screenshot if possible
**Have suggestions?** Share your ideas for improvements!
**Enjoying the indicator?** Leave a like and follow for updates!

Market Profile Dominance Analyzer# Market Profile Dominance Analyzer
## 📊 OVERVIEW
**Market Profile Dominance Analyzer** is an advanced multi-factor indicator that combines Market Profile methodology with composite dominance scoring to identify buyer and seller strength across higher timeframes. Unlike traditional volume profile indicators that only show volume distribution, or simple buyer/seller indicators that only compare candle colors, this script integrates six distinct analytical components into a unified dominance measurement system.
This indicator helps traders understand **WHO controls the market** by analyzing price position relative to Market Profile key levels (POC, Value Area) combined with volume distribution, momentum, and trend characteristics.
## 🎯 WHAT MAKES THIS ORIGINAL
### **Hybrid Analytical Approach**
This indicator uniquely combines two separate methodologies that are typically analyzed independently:
1. **Market Profile Analysis** - Calculates Point of Control (POC) and Value Area (VA) using volume distribution across price channels on higher timeframes
2. **Multi-Factor Dominance Scoring** - Weights six independent factors to produce a composite dominance index
### **Six-Factor Composite Analysis**
The dominance score integrates:
- Price position relative to POC (equilibrium assessment)
- Price position relative to Value Area boundaries (acceptance/rejection zones)
- Volume imbalance within Value Area (institutional bias detection)
- Price momentum (directional strength)
- Volume trend comparison (participation analysis)
- Normalized Value Area position (precise location within fair value zone)
### **Adaptive Higher Timeframe Integration**
The script features an intelligent auto-selection system that automatically chooses appropriate higher timeframes based on the current chart period, ensuring optimal Market Profile structure regardless of the trading timeframe being analyzed.
## 💡 HOW IT WORKS
### **Market Profile Construction**
The indicator builds a Market Profile structure on a higher timeframe by:
1. **Session Identification** - Detects new higher timeframe sessions using `request.security()` to ensure accurate period boundaries
2. **Data Accumulation** - Stores high, low, and volume data for all bars within the current higher timeframe session
3. **Channel Distribution** - Divides the session's price range into configurable channels (default: 20 rows)
4. **Volume Mapping** - Distributes each bar's volume proportionally across all price channels it touched
### **Key Level Calculation**
**Point of Control (POC)**
- Identifies the price channel with the highest accumulated volume
- Represents the price level where the most trading activity occurred
- Serves as a magnetic level where price often returns
**Value Area (VA)**
- Starts at POC and expands both upward and downward
- Includes channels until reaching the specified percentage of total volume (default: 70%)
- Expansion algorithm compares adjacent volumes and prioritizes the direction with higher activity
- Defines the "fair value" zone where most market participants agreed to trade
### **Dominance Score Formula**
```
Dominance Score = (price_vs_poc × 10) +
(price_vs_va × 5) +
(volume_imbalance × 0.5) +
(price_momentum × 100) +
(volume_trend × 5) +
(va_position × 15)
```
**Component Breakdown:**
- **price_vs_poc**: +1 if above POC, -1 if below (shows which side of equilibrium)
- **price_vs_va**: +2 if above VAH, -2 if below VAL, 0 if inside VA
- **volume_imbalance**: Percentage difference between upper and lower VA volumes
- **price_momentum**: 5-period SMA of price change (directional acceleration)
- **volume_trend**: Compares 5-period vs 20-period volume averages
- **va_position**: Normalized position within Value Area (-1 to +1)
The composite score is then smoothed using EMA with configurable sensitivity to reduce noise while maintaining responsiveness.
### **Market State Determination**
- **BUYERS Dominant**: Smooth dominance > +10 (bullish control)
- **SELLERS Dominant**: Smooth dominance < -10 (bearish control)
- **NEUTRAL**: Between -10 and +10 (balanced market)
## 📈 HOW TO USE THIS INDICATOR
### **Trend Identification**
- **Green background** indicates buyers are in control - look for long opportunities
- **Red background** indicates sellers are in control - look for short opportunities
- **Gray background** indicates neutral market - consider range-bound strategies
### **Signal Interpretation**
**Buy Signals** (green triangle) appear when:
- Dominance crosses above -10 from oversold conditions
- Previous state was not already bullish
- Suggests shift from seller to buyer control
**Sell Signals** (red triangle) appear when:
- Dominance crosses below +10 from overbought conditions
- Previous state was not already bearish
- Suggests shift from buyer to seller control
### **Value Area Context**
Monitor the information table (top-right) to understand market structure:
- **Price vs POC**: Shows if trading above/below equilibrium
- **Volume Imbalance**: Positive values favor buyers, negative favors sellers
- **Market State**: Current dominant force (BUYERS/SELLERS/NEUTRAL)
### **Multi-Timeframe Strategy**
The auto-timeframe feature analyzes higher timeframe structure:
- On 1-minute charts → analyzes 2-hour structure
- On 5-minute charts → analyzes Daily structure
- On 15-minute charts → analyzes Weekly structure
- On Daily charts → analyzes Yearly structure
This higher timeframe context helps avoid counter-trend trades against the dominant force.
### **Confluence Trading**
Strongest signals occur when multiple factors align:
1. Price above VAH + positive volume imbalance + buyers dominant = Strong bullish setup
2. Price below VAL + negative volume imbalance + sellers dominant = Strong bearish setup
3. Price at POC + neutral state = Potential breakout/breakdown pivot
## ⚙️ INPUT PARAMETERS
- **Higher Time Frame**: Select specific HTF or use 'Auto' for intelligent selection
- **Value Area %**: Percentage of volume contained in VA (default: 70%)
- **Show Buy/Sell Signals**: Toggle signal triangles visibility
- **Show Dominance Histogram**: Toggle histogram display
- **Signal Sensitivity**: EMA period for dominance smoothing (1-20, default: 5)
- **Number of Channels**: Market Profile resolution (10-50, default: 20)
- **Color Settings**: Customize buyer, seller, and neutral colors
## 🎨 VISUAL ELEMENTS
- **Histogram**: Shows smoothed dominance score (green = buyers, red = sellers)
- **Zero Line**: Neutral equilibrium reference
- **Overbought/Oversold Lines**: ±50 levels marking extreme dominance
- **Background Color**: Highlights current market state
- **Information Table**: Displays key metrics (state, dominance, POC relationship, volume imbalance, timeframe, bars in session, total volume)
- **Signal Shapes**: Triangle markers for buy/sell signals
## 🔔 ALERTS
The indicator includes three alert conditions:
1. **Buyers Dominate** - Fires on buy signal crossovers
2. **Sellers Dominate** - Fires on sell signal crossovers
3. **Dominance Shift** - Fires when dominance crosses zero line
## 📊 BEST PRACTICES
### **Timeframe Selection**
- **Scalping (1-5min)**: Focus on 2H-4H dominance shifts
- **Day Trading (15-60min)**: Monitor Daily and Weekly structure
- **Swing Trading (4H-Daily)**: Track Weekly and Monthly dominance
### **Confirmation Strategies**
1. **Trend Following**: Enter in direction of dominance above/below ±20
2. **Reversal Trading**: Fade extreme readings beyond ±50 when diverging with price
3. **Breakout Trading**: Look for dominance expansion beyond ±30 with increasing volume
### **Risk Management**
- Avoid trading during NEUTRAL states (dominance between -10 and +10)
- Use POC levels as logical stop-loss placement
- Consider VAH/VAL as profit targets for mean reversion
## ⚠️ LIMITATIONS & WARNINGS
**Data Requirements**
- Requires sufficient historical data on current chart (minimum 100 bars recommended)
- Lower timeframes may show fewer bars per HTF session initially
- More accurate results after several complete HTF sessions have formed
**Not a Standalone System**
- This indicator analyzes market structure and participant control
- Should be combined with price action, support/resistance, and risk management
- Does not guarantee profitable trades - past dominance does not predict future results
**Repainting Characteristics**
- Higher timeframe levels (POC, VAH, VAL) update as new bars form within the session
- Dominance score recalculates with each new bar
- Historical signals remain fixed, but current session data is developing
**Volume Limitations**
- Uses exchange-provided volume data which varies by instrument type
- Forex and some CFDs use tick volume (not actual transaction volume)
- Most accurate on instruments with reliable volume data (stocks, futures, crypto)
## 🔍 TECHNICAL NOTES
**Performance Optimization**
- Uses `max_bars_back=5000` for extended historical analysis
- Efficient array management prevents memory issues
- Automatic cleanup of session data on new period
**Calculation Method**
- Market Profile uses actual volume distribution, not TPO (Time Price Opportunity)
- Value Area expansion follows traditional Market Profile auction theory
- All calculations occur on the chart's current symbol and timeframe
## 📚 EDUCATIONAL VALUE
This indicator helps traders understand:
- How institutional traders use Market Profile to identify fair value
- The relationship between price, volume, and market acceptance
- Multi-factor analysis techniques for assessing market conditions
- The importance of higher timeframe structure in trade planning
## 🎓 RECOMMENDED READING
To better understand the concepts behind this indicator:
- "Mind Over Markets" by James Dalton (Market Profile foundations)
- "Markets in Profile" by James Dalton (Value Area analysis)
- Volume Profile analysis in institutional trading
## 💬 USAGE TERMS
This indicator is provided as an educational and analytical tool. It does not constitute financial advice, investment recommendations, or trading signals. Users are responsible for their own trading decisions and should conduct their own research and due diligence.
Trading involves substantial risk of loss. Past performance does not guarantee future results. Always use proper risk management and never risk more than you can afford to lose.

RED-E Gamma Range DetectorRED-E Gamma Range Detector
Overview
The RED-E Gamma Range Detector identifies key support and resistance zones based on recent price action and volume distribution, combined with a simple momentum ribbon to help traders visualize trend direction. It's designed to highlight potential areas where price may react, inspired by the concept of gamma exposure levels in options trading.
How It Works
1. Support & Resistance Zones (Green & Red Boxes)
RED-E analyzes the recent price range over a customizable lookback period
It identifies high-probability support levels (green boxes) below current price
It identifies high-probability resistance levels (red boxes) above current price
These zones represent areas where price has historically shown increased activity
2. Gamma Flip Level (Yellow Dashed Line)
The yellow line represents the approximate "gamma flip" - the midpoint of the recent range
Above this line: Price tends to be more stable with range-bound behavior
Below this line: Price tends to be more volatile with trending behavior
This level acts as a key pivot point for market structure
3. Momentum Ribbon (Green/Red Fill)
A simple visual indicator using 9 and 21 period EMAs
Green ribbon: 9 EMA is above 21 EMA (bullish momentum)
Red ribbon: 9 EMA is below 21 EMA (bearish momentum)
Ribbon width shows strength of trend (wider = stronger trend)
How to Use
For Range Trading:
Look for buy signals near green support zones when above gamma flip
Look for sell signals near red resistance zones when above gamma flip
Price tends to bounce between zones in stable conditions
For Trend Trading:
Watch for breakouts above resistance or below support zones
Use the momentum ribbon to confirm trend direction
Wider ribbon gaps indicate stronger directional moves
For Risk Management:
Use support/resistance zones for stop-loss placement
Recognize increased volatility potential below the gamma flip
Adjust position sizing based on your proximity to key zones
Settings
Lookback Period: Number of bars to analyze (default: 20)
Lower values = more responsive to recent price action
Higher values = more stable, longer-term levels
Best Practices
Works best on liquid instruments (major stocks, indices, forex pairs)
Combine with other technical analysis tools for confirmation
Most effective on 1H, 4H, and daily timeframes
Always use proper risk management and stop losses
Why "RED-E"?
RED-E stands for being Ready to identify critical gamma levels, support/resistance zones, and momentum shifts - keeping you prepared for market moves before they happen.
Educational Note
This indicator approximates gamma exposure concepts using price and volume analysis. It does not use actual options data. The term "gamma" refers to the rate of change in options delta and how market makers hedge their positions, which can create support/resistance at certain price levels.
Disclaimer
This indicator is for educational and informational purposes only. It does not guarantee profitable trades. Past performance is not indicative of future results. Always conduct your own analysis and manage risk appropriately. Trading involves substantial risk of loss.
Recommended Categories
Primary Category:
✅ Support and Resistance
Secondary Categories:
✅ Momentum
✅ Trend Analysis
✅ Volatility

Slick Strategy Weekly PCS TesterInspired by the book “The Slick Strategy: A Unique Profitable Options Trading Method.” This indicator tests weekly SPX put-credit spreads set below Monday’s open and judged at Friday’s close.
WHAT IT DOES
• Sets weekly PCS level = Monday (or first trading day) OPEN − your offset; win/loss checked at Friday close.
• Optional core filter at entry: Price ≥ 200-SMA AND 10-SMA ≥ 20-SMA; pause if Price < both 10 & 20 while > 200.
• Reference modes: Strict = Mon OPEN vs Fri SMAs (no repaint); Mid = Mon OPEN vs Mon SMAs
KEY INPUTS
• Date range (Start/End) to limit backtest window.
• Offset mode/value (Points or Percent).
• Entry day (Monday only or first trading day).
• Core filters (On/Off) and Strict/Mid reference.
• SMA settings (source; 10/20/200 lengths).
• Table settings (position, size, padding, border).
VISUALS
• Active week line: Orange = trade taken; Gray = skipped.
• History: Green = win; Red = loss; Purple = skipped.
• Optional week bands highlight active/win/loss/skipped weeks (adjustable opacity).
TABLE
• Shows Date range, Trades, Wins, Losses, Win rate, and Active level (this week’s PCS price).
NOTES
• PCS level freezes at week open and persists through the week.

Force DashboardScalping Dashboard - Complete User Guide
Overview
This scalping system consists of two complementary TradingView indicators designed for intraday trading with no overnight holds:
Force Dashboard - Single-row table showing real-time market bias and entry signals
Large Order Detection - Visual diamonds showing institutional order flow
Together, they provide a complete at-a-glance view of market conditions optimized for quick entries and exits.
Recommended Timeframes
Primary Scalping Timeframes
1-minute chart: Ultra-fast scalps (30 seconds - 3 minutes hold time)
2-minute chart: Quick scalps (2-5 minutes hold time)
5-minute chart: Standard scalps (5-15 minutes hold time)
Best Practices
Use 1-2 minute for highly liquid instruments (ES, NQ, major forex pairs)
Use 5-minute for less liquid markets or if you prefer fewer signals
Never hold past the last hour of trading to avoid overnight risk
Set hard stop times (e.g., exit all positions by 3:45 PM EST)
Dashboard Components Explained
Core Indicators (Circles ●)
MACD (5/13/5)
Green ● = Bullish momentum (MACD histogram positive)
Red ● = Bearish momentum (MACD histogram negative)
Gray ● = No clear momentum
Use: Confirms trend direction and momentum shifts
EMA (9/20/50)
Green ● = Price > EMA9 > EMA20 (uptrend)
Red ● = Price < EMA9 < EMA20 (downtrend)
Gray ● = Choppy/sideways
Use: Identifies the immediate micro-trend
Stoch (5-period Stochastic)
Green ● = Oversold (<20) - potential reversal up
Red ● = Overbought (>80) - potential reversal down
Gray ● = Neutral zone (20-80)
Use: Spots reversal opportunities at extremes
RSI (7-period)
Green ● = Oversold (<30)
Red ● = Overbought (>70)
Gray ● = Neutral
Use: Confirms overbought/oversold conditions
CVD (Cumulative Volume Delta)
Green ● = CVD above its moving average (buying pressure)
Red ● = CVD below its moving average (selling pressure)
Gray ● = Neutral
Use: Shows overall buying vs selling pressure
ΔCVD (Delta CVD - Rate of Change)
Green ● = CVD accelerating upward (buying acceleration)
Red ● = CVD accelerating downward (selling acceleration)
Gray ● = No acceleration
Use: Detects momentum shifts in order flow
Imbal (Order Flow Imbalance)
Green ● = Buy pressure >2x sell pressure
Red ● = Sell pressure >2x buy pressure
Gray ● = Balanced
Use: Identifies extreme one-sided order flow
Vol (Volume Strength)
Green ● = Volume >1.5x average (strong interest)
Red ● = Volume <0.7x average (low interest)
Gray ● = Normal volume
Yellow background = Volume surge (>2x average) - BIG MOVE ALERT
Use: Confirms conviction behind price moves
Tape (Tape Speed)
Green ● = Fast order flow (>1.3x normal)
Red ● = Slow order flow (<0.7x normal)
Gray ● = Normal speed
Yellow background = Very fast tape (>1.5x) - RAPID EXECUTION ALERT
Use: Measures urgency and speed of orders
Key Levels
Support (Supp)
Shows the nearest high-volume support level below current price
Bright Green background = Price is AT support (within 0.3%) - BOUNCE ZONE
Green background = Price above support (healthy)
Red background = Price below support (broken support, now resistance)
Resistance (Res)
Shows the nearest high-volume resistance level above current price
Bright Orange background = Price is AT resistance (within 0.3%) - REJECTION ZONE
Red background = Price below resistance (facing overhead supply)
Green background = Price above resistance (breakout)
These levels update automatically every 3 bars based on volume profile
Entry Signal Components
Score
Displays format: "6L" (6 long indicators) or "4S" (4 short indicators)
Bright Green = 6-7 indicators aligned for long
Light Green = 5 indicators aligned for long
Yellow = 4 indicators aligned (weaker setup)
Gray = No alignment
Red/Orange colors = Same scale for short setups
Score of 5+ indicates high-probability setup
SCALP (Main Entry Signal)
BRIGHT GREEN "LONG" = High-quality long scalp (Score 5+)
Green "LONG" = Decent long scalp (Score 4)
BRIGHT ORANGE "SHORT" = High-quality short scalp (Score 5+)
Red "SHORT" = Decent short scalp (Score 4)
Gray "WAIT" = No clear setup - STAY OUT
Entry Strategies
Strategy 1: High-Probability Scalps (Conservative)
When to Enter:
SCALP column shows BRIGHT GREEN "LONG" or BRIGHT ORANGE "SHORT"
Score is 5 or higher
Vol or Tape has yellow background (volume surge)
Example Long Setup:
SCALP = BRIGHT GREEN "LONG"
Score = 6L
Vol = Yellow background
Price AT Support (bright green Supp cell)
EMA, MACD, CVD, ΔCVD, Imbal all green
Entry: Enter immediately on next candle
Target: 0.5-1% move or resistance level
Stop: Below support or -0.3%
Hold Time: 2-10 minutes
Strategy 2: Momentum Scalps (Aggressive)
When to Enter:
Tape has yellow background (fast tape)
Vol has yellow background (volume surge)
ΔCVD is green (for longs) or red (for shorts)
Imbal shows strong imbalance in your direction
Score is 4+
Example Short Setup:
Tape & Vol = Yellow backgrounds
ΔCVD = Red, Imbal = Red
Price AT Resistance (bright orange)
Score = 5S
Entry: Enter immediately
Target: Quick 0.3-0.7% move
Stop: Tight -0.2%
Hold Time: 1-5 minutes
Strategy 3: Reversal Scalps (Mean Reversion)
When to Enter:
Stoch shows oversold (green) or overbought (red)
RSI confirms the extreme
Price is AT Support (for longs) or AT Resistance (for shorts)
ΔCVD and Imbal start reversing direction
Score is 4+
Example Long Setup:
Stoch = Green (oversold)
RSI = Green (oversold)
Supp = Bright green (at support)
ΔCVD turns green
Imbal turns green
Score = 4L or 5L
Entry: Wait for confirmation candle
Target: Move back to EMA9 or mid-range
Stop: Below the low
Hold Time: 3-8 minutes
Large Order Detection Usage
Diamond Signals
Green diamonds below bar = Large buy orders (institutional buying)
Red diamonds above bar = Large sell orders (institutional selling)
Size matters: Larger diamonds = larger order flow
How to Use with Dashboard
Confirmation Entries
Dashboard shows "LONG" signal
Green diamond appears
Enter immediately - institutions are buying
Divergence Alerts (CAUTION)
Dashboard shows "LONG" signal
RED diamond appears (institutions selling)
DO NOT ENTER - conflicting order flow
Cluster Patterns
Multiple green diamonds in row = Strong accumulation, stay long
Multiple red diamonds in row = Strong distribution, stay short
Alternating colors = Chop, avoid trading
Risk Management Rules
Position Sizing
Risk 0.5-1% of account per scalp
Maximum 3 concurrent positions
Reduce size after 2 consecutive losses
Stop Loss Guidelines
Tight stops: 0.2-0.3% for 1-2 min charts
Standard stops: 0.3-0.5% for 5 min charts
Always use stop loss - no exceptions
Place stops below support (longs) or above resistance (shorts)
Take Profit Targets
Target 1: 0.3-0.5% (take 50% off)
Target 2: 0.7-1% (take remaining 50%)
Move stop to breakeven after Target 1 hit
Trail stop if Score remains high
Time-Based Exits
Exit immediately if:
SCALP changes from LONG/SHORT to WAIT
Score drops below 3
Large diamond appears in opposite direction
Maximum hold time: 15 minutes (even if profitable)
Hard exit time: 30 minutes before market close
Trading Sessions
Best Times to Scalp
High-Liquidity Sessions
9:30-11:00 AM EST (Market open, highest volume)
2:00-3:30 PM EST (Afternoon session, good moves)
Avoid
11:30 AM-1:30 PM EST (Lunch, low volume)
Last 30 minutes (unpredictable, don't initiate new trades)
News releases (wait 5 minutes for volatility to settle)
Common Patterns & Setups
The Perfect Storm (Highest Probability)
Score = 6L or 7L
SCALP = BRIGHT GREEN
Vol + Tape = Yellow backgrounds
Green diamond appears
Price AT Support
Win rate: ~70-80%
The Fade Setup (Counter-Trend)
Price hits resistance (bright orange)
Stoch + RSI overbought (red)
Red diamond appears
CVD starts turning red
SCALP shows "SHORT"
Win rate: ~60-70%
The Breakout Continuation
Price breaks resistance (Res turns green)
EMA, MACD green
Vol surge (yellow)
Multiple green diamonds
SCALP = "LONG"
Win rate: ~65-75%
Warning Signs - DO NOT TRADE
Red Flags
❌ SCALP shows "WAIT"
❌ Score below 3
❌ Vol and Tape both gray (no volume)
❌ Conflicting signals (dashboard says LONG but red diamonds appearing)
❌ Alternating green/red circles (choppy market)
❌ Support and Resistance very close together (tight range)
Market Conditions to Avoid
Low volume periods
Major news releases (first 5 minutes after)
First 2 minutes after market open
Wide spreads
Consecutive losing trades (take a break after 2 losses)
Quick Reference Checklist
Before Taking ANY Trade:
☑ SCALP shows LONG or SHORT (not WAIT)
☑ Score is 4 or higher
☑ Vol or Tape shows activity
☑ No conflicting diamond signals
☑ Stop loss level identified
☑ Target profit level identified
☑ Not in restricted time periods
After Entering:
☑ Set stop loss immediately
☑ Set profit targets
☑ Watch SCALP column - exit if changes to WAIT
☑ Watch for opposite-colored diamonds
☑ Move stop to breakeven after first target
☑ Exit all by market close
Advanced Tips
Scalping Psychology
Be patient: Wait for Score 5+ setups
Be decisive: When signal appears, act immediately
Be disciplined: Follow your stop loss always
Be flexible: Exit quickly if dashboard reverses
Optimization
Backtest on your specific instrument
Adjust RSI/Stoch levels for your market
Fine-tune volume thresholds
Keep a trade journal to track which setups work best
Multi-Timeframe Confirmation
Use 5-min dashboard as "trend filter"
Take 1-min trades only in direction of 5-min SCALP signal
Increases win rate by ~10-15%
Troubleshooting
Q: Dashboard shows WAIT most of the time
Normal - scalping is about patience. Quality > Quantity
3-8 good setups per day is excellent
Q: Too many false signals
Increase minimum Score requirement to 5 or 6
Only trade with volume surge (yellow backgrounds)
Add large order detection confirmation
Q: Signals too slow
You may be on too high a timeframe
Try 1-minute chart for faster signals
Ensure real-time data feed is active
Q: Support/Resistance not updating
Normal - updates every 3 bars
If completely stuck, remove and re-add indicator
Summary
This scalping system works best when:
✅ Multiple indicators align (Score 5+)
✅ Volume and tape speed confirm the move
✅ Order flow (diamonds) confirms direction
✅ Price is at key levels (support/resistance)
✅ You manage risk strictly
✅ You exit before market close
The golden rule: When SCALP says WAIT, you WAIT. Discipline beats frequency.

chart Pattern & Candle sticks Strategy# **XAUUSD Pattern & Candle Strategy - Complete Description**
## **Overview**
This Pine Script indicator is a comprehensive multi-factor trading system specifically designed for **XAUUSD (Gold) scalping and swing trading**. It combines classical technical analysis methods including candlestick patterns, chart patterns, moving averages, and volume analysis to generate high-probability buy/sell signals with automatic stop-loss and take-profit levels.
***
## **Core Components**
### **1. Moving Average System (Triple MA)**
**Purpose:** Identifies trend direction and momentum
- **Fast MA (20-period)** - Short-term price action
- **Medium MA (50-period)** - Intermediate trend
- **Slow MA (200-period)** - Long-term trend direction
**How it works:**
- **Bullish alignment**: MA20 > MA50 > MA200 (all pointing up)
- **Bearish alignment**: MA20 < MA50 < MA200 (all pointing down)
- **Crossover signals**: When Fast MA crosses Medium MA, it triggers buy/sell signals
- **Choice of SMA or EMA**: Adjustable based on preference
**Visual indicators:**
- Blue line = Fast MA
- Orange line = Medium MA
- Light red line = Slow MA
- Green background tint = Bullish trend
- Red background tint = Bearish trend
---
### **2. Candlestick Pattern Recognition (13 Patterns)**
**Purpose:** Identifies reversal and continuation signals based on price action
#### **Bullish Patterns (Signal potential upward moves):**
1. **Hammer** 🔨
- Long lower wick (2x body size)
- Small body at top
- Indicates rejection of lower prices (buyers stepping in)
- Best at support levels
2. **Inverted Hammer**
- Long upper wick
- Small body at bottom
- Shows buying pressure despite initial selling
3. **Bullish Engulfing** 📈
- Green candle completely engulfs previous red candle
- Strong reversal signal
- Body must be 1.2x larger than previous
4. **Morning Star** ⭐
- 3-candle pattern
- Red candle → Small indecision candle → Large green candle
- Powerful reversal at bottoms
5. **Piercing Line** ⚡
- Green candle closes above 50% of previous red candle
- Indicates strong buying interest
6. **Bullish Marubozu**
- Almost no wicks (95% body)
- Very strong bullish momentum
- Body must be 1.3x average size
#### **Bearish Patterns (Signal potential downward moves):**
7. **Shooting Star** 💫
- Long upper wick
- Small body at bottom
- Indicates rejection of higher prices (sellers in control)
- Best at resistance levels
8. **Hanging Man**
- Similar to hammer but appears at top
- Warning of potential reversal down
9. **Bearish Engulfing** 📉
- Red candle completely engulfs previous green candle
- Strong reversal signal
10. **Evening Star** 🌙
- 3-candle pattern (opposite of Morning Star)
- Green → Small → Large red candle
- Powerful top reversal
11. **Dark Cloud Cover** ☁️
- Red candle closes below 50% of previous green candle
- Indicates strong selling pressure
12. **Bearish Marubozu**
- Almost no wicks, pure red body
- Very strong bearish momentum
#### **Neutral Pattern:**
13. **Doji**
- Open and close nearly equal (tiny body)
- Indicates indecision
- Often precedes major moves
**Detection Logic:**
- Compares body size, wick ratios, and position relative to previous candles
- Uses 14-period average body size as reference
- All patterns validated against volume confirmation
***
### **3. Chart Pattern Recognition**
**Purpose:** Identifies major support/resistance and reversal patterns
#### **Patterns Detected:**
**Double Bottom** 📊 (Bullish)
- Two lows at approximately same level
- Indicates strong support
- Breakout above neckline triggers buy signal
- Most reliable at major support zones
**Double Top** 📊 (Bearish)
- Two highs at approximately same level
- Indicates strong resistance
- Breakdown below neckline triggers sell signal
- Most reliable at major resistance zones
**Support & Resistance Levels**
- Automatically plots recent pivot highs (resistance)
- Automatically plots recent pivot lows (support)
- Uses 3-bar strength for validation
- Levels shown as dashed horizontal lines
**Price Action Patterns**
- **Uptrend detection**: Higher highs + higher lows
- **Downtrend detection**: Lower highs + lower lows
- Confirms overall market structure
***
### **4. Volume Analysis**
**Purpose:** Confirms signal strength and filters false signals
**Metrics tracked:**
- **Volume MA (20-period)**: Baseline average volume
- **High volume threshold**: 1.5x the volume average
- **Volume increase**: Current volume > previous 2 bars
**How it's used:**
- All buy/sell signals **require volume confirmation**
- High volume = institutional participation
- Low volume signals are filtered out
- Prevents whipsaw trades during quiet periods
**Visual indicator:**
- Dashboard shows "High" volume in orange when active
- "Normal" shown in gray during low volume
***
### **5. Signal Generation Logic**
**BUY SIGNALS triggered when ANY of these occur:**
1. **Candlestick + Volume**
- Bullish candle pattern detected
- High volume confirmation
- Price above Fast MA
2. **MA Crossover + Volume**
- Fast MA crosses above Medium MA
- High volume confirmation
3. **Double Bottom Breakout**
- Price breaks above support level
- Volume confirmation present
4. **Trend Continuation**
- Uptrend structure intact (higher highs/lows)
- All MAs in bullish alignment
- Price above Fast MA
- Volume confirmation
**SELL SIGNALS triggered when ANY of these occur:**
1. **Candlestick + Volume**
- Bearish candle pattern detected
- High volume confirmation
- Price below Fast MA
2. **MA Crossunder + Volume**
- Fast MA crosses below Medium MA
- High volume confirmation
3. **Double Top Breakdown**
- Price breaks below resistance level
- Volume confirmation present
4. **Trend Continuation**
- Downtrend structure intact (lower highs/lows)
- All MAs in bearish alignment
- Price below Fast MA
- Volume confirmation
***
### **6. Risk Management System**
**Automatic Stop Loss Calculation:**
- Based on ATR (Average True Range) - 14 periods
- **Formula**: Entry price ± (ATR × SL Multiplier)
- **Default multiplier**: 1.5 (adjustable)
- Adapts to market volatility automatically
**Automatic Take Profit Calculation:**
- **Formula**: Entry price ± (ATR × TP Multiplier)
- **Default multiplier**: 2.5 (adjustable)
- **Default Risk:Reward ratio**: 1:1.67
- Higher TP multiplier = more aggressive targets
**Position Management:**
- Tracks ONE position at a time (no pyramiding)
- Automatically closes position when:
- Stop loss is hit
- Take profit is reached
- Opposite MA crossover occurs
- Prevents revenge trading and over-leveraging
**Visual Representation:**
- **Red horizontal line** = Stop Loss level
- **Green horizontal line** = Take Profit level
- Lines remain on chart while position is active
- Automatically disappear when position closes
***
### **7. Visual Elements**
**On-Chart Displays:**
1. **Moving Average Lines**
- Fast MA (Blue, thick)
- Medium MA (Orange, thick)
- Slow MA (Red, thin)
2. **Support/Resistance**
- Green crosses = Support levels
- Red crosses = Resistance levels
3. **Buy/Sell Arrows**
- Large GREEN "BUY" label below bars
- Large RED "SELL" label above bars
4. **Pattern Labels** (Small markers)
- "Hammer", "Bull Engulf", "Morning Star" (green, below bars)
- "Shooting Star", "Bear Engulf", "Evening Star" (red, above bars)
- "Double Bottom" / "Double Top" (blue/orange)
5. **Signal Detail Labels** (Medium size)
- Shows signal reason (e.g., "Bullish Candle", "MA Cross Up")
- Displays Entry, SL, and TP prices
- Color-coded (green for long, red for short)
6. **Background Coloring**
- Light green tint = Bullish MA alignment
- Light red tint = Bearish MA alignment
***
### **8. Information Dashboard**
**Top-right corner table showing:**
| Metric | Description |
|--------|-------------|
| **Position** | Current trade status (LONG/SHORT/None) |
| **MA Trend** | Overall trend direction (Bullish/Bearish/Neutral) |
| **Volume** | Current volume status (High/Normal) |
| **Pattern** | Last detected candlestick pattern |
| **ATR** | Current volatility measurement |
**Purpose:**
- Quick at-a-glance market assessment
- Real-time position tracking
- No need to check multiple indicators
***
### **9. Alert System**
**Complete alert coverage for:**
✅ **Entry Alerts**
- "Buy Signal" - Triggers when buy conditions met
- "Sell Signal" - Triggers when sell conditions met
✅ **Exit Alerts**
- "Long TP Hit" - Take profit reached on long position
- "Long SL Hit" - Stop loss triggered on long position
- "Short TP Hit" - Take profit reached on short position
- "Short SL Hit" - Stop loss triggered on short position
**How to use:**
1. Click "Create Alert" button
2. Select desired alert from dropdown
3. Set notification method (popup, email, SMS, webhook)
4. Never miss a trade opportunity
***
## **Recommended Settings**
### **For Scalping (Quick trades):**
- **Timeframe**: 5-minute
- **Fast MA**: 9
- **Medium MA**: 21
- **Slow MA**: 50
- **SL Multiplier**: 1.0
- **TP Multiplier**: 2.0
- **Volume Threshold**: 1.5x
### **For Swing Trading (Longer holds):**
- **Timeframe**: 1-hour or 4-hour
- **Fast MA**: 20
- **Medium MA**: 50
- **Slow MA**: 200
- **SL Multiplier**: 2.0
- **TP Multiplier**: 3.0
- **Volume Threshold**: 1.3x
### **Best Trading Hours for XAUUSD:**
- **Asian Session**: 00:00 - 08:00 GMT (lower volatility)
- **London Session**: 08:00 - 16:00 GMT (high volatility) ⭐
- **New York Session**: 13:00 - 21:00 GMT (highest volume) ⭐
- **London-NY Overlap**: 13:00 - 16:00 GMT (BEST for scalping) 🔥
***
## **How to Use This Strategy**
### **Step 1: Setup**
1. Open TradingView
2. Load XAUUSD chart
3. Select timeframe (5m, 15m, 1H, or 4H)
4. Add indicator from Pine Editor
5. Adjust settings based on your trading style
### **Step 2: Wait for Signals**
- Watch for GREEN "BUY" or RED "SELL" labels
- Check the signal reason in the detail label
- Verify dashboard shows favorable conditions
- Confirm volume is "High" (not required but preferred)
### **Step 3: Enter Trade**
- Enter at market or limit order near signal price
- Note the displayed Entry, SL, and TP prices
- Set your broker's SL/TP to match indicator levels
### **Step 4: Manage Position**
- Watch for SL/TP lines on chart
- Monitor dashboard for trend changes
- Exit manually if opposite MA crossover occurs
- Let SL/TP do their job (don't move them!)
### **Step 5: Review & Learn**
- Track win rate over 20+ trades
- Adjust multipliers if needed
- Note which patterns work best for you
- Refine entry timing
***
## **Key Advantages**
✅ **Multi-confirmation approach** - Reduces false signals significantly
✅ **Automatic risk management** - No manual calculation needed
✅ **Adapts to volatility** - ATR-based SL/TP adjusts to market conditions
✅ **Volume filtered** - Ensures institutional participation
✅ **Visual clarity** - Easy to understand at a glance
✅ **Complete alert system** - Never miss opportunities
✅ **Pattern education** - Learn patterns as they appear
✅ **Works on all timeframes** - Scalping to swing trading
***
## **Limitations & Considerations**
⚠️ **Not a holy grail** - No strategy wins 100% of trades
⚠️ **Requires practice** - Demo trade first to understand signals
⚠️ **Market conditions matter** - Works best in trending or volatile markets
⚠️ **News events** - Avoid trading during major economic releases
⚠️ **Slippage on 5m** - Fast markets may have execution delays
⚠️ **Pattern subjectivity** - Some patterns may trigger differently than expected
***
## **Risk Management Rules**
1. **Never risk more than 1-2% per trade**
2. **Maximum 3 positions per day** (avoid overtrading)
3. **Don't trade during major news** (NFP, FOMC, etc.)
4. **Use proper position sizing** (0.01 lot per $100 for micro accounts)
5. **Keep trade journal** (track patterns, win rate, mistakes)
6. **Stop trading after 3 consecutive losses** (psychological reset)
7. **Don't move stop loss further away** (accept losses)
8. **Take partial profits** at 1:1 R:R if desired
***
## **Expected Performance**
**Realistic expectations:**
- **Win rate**: 50-65% (depending on market conditions and timeframe)
- **Risk:Reward**: 1:1.67 default (adjustable to 1:2 or 1:3)
- **Signals per day**: 3-8 on 5m, 1-3 on 1H
- **Best months**: High volatility periods (news events, economic uncertainty)
- **Drawdowns**: Expect 3-5 losing trades in a row occasionally
***
## **Customization Options**
All inputs are adjustable in settings panel:
**Moving Averages:**
- Type (SMA or EMA)
- All three period lengths
**Volume:**
- Volume MA length
- High volume multiplier threshold
**Chart Patterns:**
- Pattern strength (bars for pivot detection)
- Show/hide pattern labels
**Risk Management:**
- ATR period
- Stop loss multiplier
- Take profit multiplier
**Display:**
- Toggle pattern labels
- Customize colors (in code)
***
## **Conclusion**
This is a **professional-grade, multi-factor trading system** that combines the best of classical technical analysis with modern risk management. It's designed to give clear, actionable signals while automatically handling the complex calculations of stop loss and take profit levels.
**Best suited for traders who:**
- Understand basic technical analysis
- Can follow rules consistently
- Prefer systematic approach over gut feeling
- Want visual confirmation before entering trades
- Value proper risk management
**Start with demo trading** for at least 20-30 trades to understand how the signals work in different market conditions. Once comfortable and profitable on demo, transition to live trading with minimal risk per trade.
Happy trading! 📈🎯

LONG/SHORT Signals by YCGH CapitalThis indicator uses volatility as its primary input to help identify potential market
bottoms and tops. By measuring extreme price movements and volatility spikes, it generates
signals for both long (buy) and short (sell) opportunities.
BEST SUITED FOR:
This indicator works best when the market is in a clear trend - either uptrend or downtrend.
It excels at catching reversal points within trending markets and identifying exhaustion
points where trends may reverse.
HOW TO USE THIS INDICATOR:
1. IDENTIFY SIGNAL TYPES:
• Long Filtered (Dark Blue, Tiny): Conservative buy signals with higher probability
• Long Aggressive (Aqua, Small): Early buy signals for catching bottoms faster
• Short Filtered (Dark Red, Tiny): Conservative sell signals with confirmation
• Short Aggressive (Orange, Small): Early sell signals for catching tops
2. TRADING APPROACHES:
Conservative Traders:
- Focus only on Filtered signals (tiny arrows)
- Wait for full confirmation before entering
- Lower risk, fewer trades, higher win rate
Aggressive Traders:
- Use Aggressive signals (small arrows) for earlier entries
- Accept more risk for potentially larger profits
- More trades, catch moves from the beginning
Balanced Approach:
- Use Aggressive signals to spot opportunities early
- Confirm with Filtered signals or use them to add to positions
- Scale in with Aggressive, scale out with opposite signals
3. RISK MANAGEMENT:
- Always use stop losses below recent swing lows (long) or above swing highs (short)
- Risk less per trade on Aggressive signals (they have more false signals)
- Risk more per trade on Filtered signals (higher probability setups)
- Consider the broader trend - signals aligned with trend work better
4. COMBINATION STRATEGIES:
- Use with trend indicators (moving averages) to filter signals
- Combine with support/resistance levels for higher probability entries
- Look for signals near key price levels for best results
- Use volume confirmation to validate signal strength
5. TIMEFRAME RECOMMENDATIONS:
- 15min-1H charts: Day trading with quick reversals
- 4H-Daily charts: Swing trading with multi-day holds (RECOMMENDED)
- Weekly charts: Position trading for long-term trend reversals
IMPORTANT NOTES:
- Not all signals will result in profitable trades
- Best performance in trending markets, may produce false signals in sideways/choppy conditions
- Combine with your own analysis and risk management rules
- Past performance does not guarantee future results