EMASARPLEASE READ THE FULL DESCRIPTION BEFORE BUYING OR USING THIS INDICATOR
EMASAR (pronounced Emma-sar) is a strategy based on Exponential Moving Averages and the Parabolic SAR . This is a position trading approach that is derived from Tyler Jenks’ Consensio.
This strategy was developed with four objectives in mind: (1) managing risk (2) protecting from missing out on major moves (3) maximizing risk:reward (4) staying in a trending market and taking profit before it fully reverses.
EMASAR does a great job at accomplishing all of the above through the buy and sell signals that are generated. The data provided below is from the signals that occurred on Bitcoin (Bitstamp) from January 1, 2015 to present (November 11, 2019).
(1) Risk is tightly managed, relative to the winners, and losing positions will be exited before the market moves too far against.
The biggest losing trade on Bitcoin, for the time period outlined above, is -18.47%.
(2) Following the EMASAR buy and sell signals guarantees that one will not miss out on a major trend. As a result of the indicators used for this system it is mathematically impossible for a major trend to occur without providing a buy or sell signal. This system isn't meant to catch exact tops or bottoms but it will do a great job of capturing ~85% of a trend.
(3) On average the winning trades will be 5.55 times the losing trades. There will be stretches where the losers are bigger than the winners and this could last for many months, maybe even a year. However, over the long run the average reward is expected to be 5.55 times the average risk*.
*Past performance does not guarantee future results!
(4) This indicator was designed to capitalize on parabolic markets, specifically Bitcoin and alt coins. Crypto markets have a tendency to get moving so fast that many indicators become all but useless.
Entries can get signaled too late and exits will get signaled way too early. This is specifically true when using oscillators that are designed to identify overbought or oversold environments. EMASAR does a great job of keeping us in a position for the duration of a trend and this includes the major parabolic runs that Bitcoin has a tendency to go on.
Take a look at the two charts below which illustrates the buy and sell signals that occurred at the beginning and end of the 2017 and 2019 parabolic moves. Green = Buy | Blue = Exit | Red = Short
Long signaled at $4,190.27 on September 29th, 2017
Exit signaled at $13,647 on January 14th, 2018
Short signaled at $12,050 on January 16th, 2018
Close Short signaled at $3,684 on February 18th, 2019
Long signaled at $3,684 on February 18th, 2019
Exit signaled at $9,614 on July 16th, 2019
Short signaled at $10,328 on July 22nd, 2019
When Bitcoin, or other alts, really get moving it can be very difficult to distinguish between a correction and a full reversal. We do not want to be exiting during a minor correction, instead this is a time when we want to be holding on or looking to buy the dip.
This is a very fragile balance. The market has a very strong tendency to make corrections looks like reversals and to make reversals look like corrections. Therefore it is very important to have a tool(s) that you trust to distinguish in between the two.
I believe that EMASAR is the best way to find that balance - if I knew of a better way then I would be using it instead!
Following these signals will help us to hold onto positions while the market is still trending in our favor when most think that it has moved too far / too fast, and it will also get us out before a market fully reverses.
Keep in mind that there will be times when we exit a market that is in danger of reversing, only to buy back higher later on. That is okay because it enables us to properly manage risk during times of uncertainty and buying back in at a higher price is more than worth the opportunity cost.
Lets look at the signals above in chronological order:
1) Close Long: $2,274
2) Open Short: $2,347
3) Exit Short: $2,934
4) Open Long: $2,766
5) Close Long: $3,124
6) Enter Long: $4,190
A long was closed at $2,274 after Signal #1 and was re-entered after Signal #4 at $2,766. Additionally a long was closed at $3,124 after Signal #5 and was re-entered on the following signal at $4,190. These are examples of some of the bad signals that will occur. Something to pay attention to is the ratio of the risk to the reward. When the market turns against us EMASAR will quickly signal an exit or a re entry.
EMASAR also works great in traditional markets. The S&P 500 has been on a tear lately after creating new all time highs in October of 2019. It has resumed it's strong bull trend and therefore it is a great market to have long exposure to. That being said we are well overdue for a correction and most people, including myself, expect the next bear market to be much more severe than the last two. Therefore I would not want to have long exposure unless equipped with a very reliable method for taking profit before it fully reverses.
Let's take a look at the S&P 500 weekly EMASAR signals using the preferred settings outlined below:
In August of 1990 EMASAR signaled a 'Close Long' at $308. At that time the market was in danger of fully reversing. When that didn't happen EMASAR gave a signal to re enter at $369 which resulted in losing 19.8% in opportunity cost. That is quite okay because it would have allowed us to properly protect ourselves in the event that the market proceeded to crash. Instead we entered a massive bull market that culminated in the dot com bubble. Notice how EMASAR kept us in for the entire duration of that bull run and then signaled an exit very close to the top at $1,294. It got us back in by the end of 2004 after the market had bottomed. Yet again it kept us in for the following multi year bull market before signaling an exit very close to the top at $1,270.
The action that followed in 2016 looks very similar to what happened in 1990 - 1991. An exit was signaled when the market was in danger of fully reversing. When that didn't happen a re entry was signaled 14% higher. Now the market appears to be taking off in another parabolic advance. There is no way to know how far this next run will go or how long it will last. Nevertheless I feel highly confident that I will be able to hold on for the majority of the trend and then get fully out before it reverses thanks to the signals provided by EMASAR.
When looking at the signals on Gold we will notice striking similarities to the signals in the S&P 500 as well as Bitcoin.
Notice how an entry was signaled very close to the bottom at $323 in June of 2002. An exit was also signaled very close to the top at $1,441 in April of 2013. Throughout that runup there was one bad signal that cost some opportunity. It's very important to understand that missing out on opportunity is well worth the price because it allows us to effectively manage risk. EMASAR also recently provided a long signal at $1,401 which preceded this recent runup.
Settings
Default settings work best for crypto, however the time multiplier should be adjusted for markets that are not open 24/7. For commodities and FOREX my default is 40 and for stocks I use 24. The Moving Averages can be adjusted as well. The period can be changed and you can also select SMA or EMA. I always use the EMA's and strongly prefer the 50 and 200. We have noticed good results with the 9 and 54 EMA's as well. The shorter the period that the Moving Average is set to the more frequent the signals will be. This will generally improve risk:reward while decreasing strike rate. For crypto the best time frames are the 4h and 6h. For traditional markets the best time frames are the Daily, 3D and Weekly. EMASAR can be used on smaller time frames as well, specifically in crypto. The 15m and 1h have shown good results.
Risks
The biggest risks with trading EMASAR revolve around disobeying the signals. Risk management is built into this system with the exit signals that will occur, however it is up to the individual to execute those signals. Passing on an exit signal could lead to a big loss which would have a dramatic impact on the ROI. Most trading systems will have small and medium losses with small, medium and large wins. That is exactly how this works. The small - medium losses and wins will mostly be a wash and will account for roughly 80% of the trades. The large wins will happen about 20% of the time and will make up 80% - 90% of the profits.
Therefore the two biggest risks are passing on signals entirely, or exiting preemptively. Getting chopped in and out of a market can be quite frustrating. If you become overwhelmed with negative emotions then it could cause you to pass up on the next signal. That signal will often be the one that more than makes up for the small - medium losses that preceded.
On average EMASAR will provide one signal every 6 weeks when using the default settings on the 4h chart. Therefore missing one entry could turn an otherwise profitable year into a loser. If electing to trade a system, whether it is EMASAR or another, it is crucial to commit to taking every signal regardless of outside variables (namely your personal bias about market direction or frustration that follows a losing stretch).
Another major risk with this system is taking too much profit too soon. When getting into a trade that has the potential to be a big winner it can be challenging to continue holding through the swings. Anyone that has watched paper profits vanish will be inclined to start exiting after the market makes a big move in his or her favor. While this is better than watching profits completely evaporate, this mistake can be enough to turn a profitable system into one that loses to the market. If 80% - 90% of our profits come from 10% - 20% of our trades then it is vital we do not cut those positions off at the knees.
If taking too much profit too soon then you will consistently turn potential large winners into medium winners. This may lead to making money over the long run which will make it very difficult to realize that anything is wrong. However making money and beating the market are two very different things. Exiting early and making money is nearly as big of a risk as missing entries entirely.
If you have the discipline to execute signals in a timely manner after they are triggered and the emotional control to let the winners run despite the appearance of a vastly overbought / oversold market, then you should have what it takes to beat the market with EMASAR.
If you are not an experienced trader then it is very important to start out small. The only way to learn is to trade in a live environment and the only way to succeed is to risk much less than you can afford to lose. If you have $2,000 to trade with then start with a maximum position size of $20 - $50 and don’t be shy about scaling that down even further. Focus on ROI instead of actual dollars made. If you can return 100% on a $20 roll then you should be able to do the same with a $2,000 roll.
Important Notes
Make sure that you read / understand the risks outlined above. If you jump into this without understanding the unique risks that this system entails then you are going to have a bad time.
This indicator was developed around the 4h and that is where it works best. For crypto adjusting to higher TF’s will cause for bad results as the entries / exits will be late to the party. For traditional markets the Daily - Weekly time frames are preferred. It was not originally intended for smaller TF's but we have seen some good results on the 15m and 1h. The RSI can be a great compliment when using on smaller TF's. Adding a rule for not entering when RSI > 75 or < 25 and instead entering when RSI retests 50 will help to avoid some bad signals.
Alerts can be set for this indicator. Simply make sure that it is visible on the chart, then click the alert icon on the top panel. In the first dropdown set 'Condition' to 'EMASAR' and the second 'Condition' for the upcoming signal. For example if just entered long then set the second condition to 'Close Long' and you will be notified as soon as that signal occurs. If waiting for the next long entry then set the second condition to 'Open Long' so on and so forth. There is an 'All in One' alert that is also available. If you select that then you will be alerted any time that a signal occurs. The message will tell you to check the chart to see which signal caused the alert.
How to Buy
The EMASAR Indicator is available for purchase on my website. The link can be found in my signature or in the tagline of my Trading View profile.
The price is $500 per year which is only payable in Bitcoin. That also includes access to a private Telegram group.
In den Scripts nach "profitable" suchen

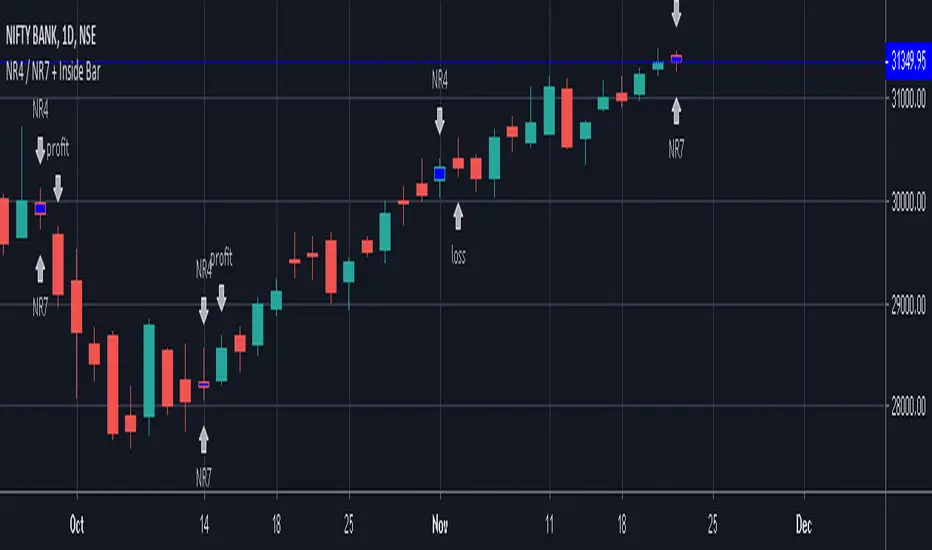
NR4 / NR7 + Inside BarIndicator Script for identifying Narrow Range 4 / 7 + Inside Bar
It also helps to check whether NR4 / NR7 breakout trading has been profitable or not in the past in a particular instrument.
It has helped me to select profitable scripts and avoid losing ones. Can be used for anytime frame.
SIGNAL
NR4 == Narrowest range of 4 periods + signal day is an inside bar
NR4 & NR7 == Narrowest range of 7 periods + signal day is an inside bar
SIGNAL "PROFIT" -
Prior day was NR4 / NR7 and next day price broke out of prior day range in 1 direction and closed in the direction of breakout away from breakout price, resulting in a profit trade.
SIGNAL "LOSS" -
Prior day was NR4 / NR7 and next day price broke out of prior day range and returned back to close inside the narrow zone OR went in opposite direction after the initial breakout, resulting in a loss trade.
SPY Weekly Trading Strategy - ARK IndicatorDisclaimer: This is not financial advise, please consult with your licensed Financial Advisor for investment advise
Hello everyone,
This Script is designed to spot trends and provide you with an entry and exit points.
Rules of Trading with this Indicator:
1- The best risk/reward ratio of this indicator is that you buy at the very first buy Signal "B" and Sell at the very first Sell Signal "S"
2- and Repeat ....as simple as that
Few notes:
1- The repeats of the buy/sell signal are just confirmation of the the trend so to maximize the chances of being profitable, always start when the trend flips (From Sell to buy and vice versa).
2- No signal indicates that you maybe on an up/down trend depending on what the last signal was but the trend is starting to get weak
3- Once a trend is spotted by the algorithm, it will plot a line to establish, entry and exit depending on the direction of the trend (green for buying and red for selling)
4- you will notice that during up trend since the indicator recommends buying only entry points will be suggested with the help of a green line to give you an exact entry point, it is important that the price reaches that entry point for you to pull the trigger, however once the trend gets exhausted it will start to plot a red line so you are mentally prepared that a counter trend might be just around the corner (this is a pretty useful feature)
5- Recommended Settings: The most important setting that you need to be mindful of is "Signal Frequency", based on my observation so far, 2 works best with Weekly & monthly Charts, 8 with Daily Charts , and 10 with hourly charts or lower. As you know the price of a security depends on countless variables, including but not limited to general market condition, success/failure of the underlying security, and the psychology of the market participants of the security, so you can play around with the signal frequency to see what gives you the optimal/profitable signal in the historical candles.
6- the indicator comes with 3 moving averages since some traders/investors like to use moving averages, if you don't need them feel free to turn them off in the settings. they aren't part of any thing used behind the scene.
any questions feel free to contact me by commenting below.
Note: if you have any useful ideas on how to enhance the indicator, please don't be shy!
Warm regards & best of luck!
Ahmad

Trend Pulse Pro V2Trend Pulse Pro V2 (Non Repaint)
TradingView Account Needed: Free
You don't need to be an expert to use Trend Pulse Pro.
Just follow the signals and that's all and use simple Fibonacci levels to find stop loss and take profit!
You can increase the win rate even more by following some simple technical analysis, for example, when trend breaks (price break signal level) you can use that as support become resistance level (sell) or resistance becomes support (buy):
No complex things. No waste of time.
And although you won't win 100% of the trades (no signals can guarantee that), your trading will surely improve a lot!
Even someone with almost no trading experience can read the simple trading rules given in the included user guide, watch the how-to videos and follow Trend Pulse Pro’s signals to consistently make smarter trades.
With Trend Pulse Pro you will get accurate buy and sell signals every time there is a new trading opportunity so that you never miss any big price movements and makes your trading both easier and more profitable.
How to use the signals and alerts:
Trend Pulse Pro automatically analyze trend and price action to give you a signal when there's a good trade.
These trend signals and alerts are derived from live data but the stability of our code allows it to not repaint.
Trend Pulse Pro allow you to easily determine the trend and will give you buy and sell entry levels.
Works on all markets on all time frames so it's suitable for scalpers, day and swing traders.
If you want more details, the link is in the signature.
Disclaimer:
Past performance is not indicative of future performance. No representation is being made that any results discussed within the service and its related media content will be achieved. All opinions, news, research, analyses, prices or other information is provided as general market commentary and not as investment advice. TradingWalk, their members, shareholders, employees, agents, representatives and resellers do not warrant the completeness, accuracy or timeliness of the information supplied, and they shall not be liable for any loss or damages, consequential or otherwise, which may arise from the use or reliance of the TradingWalk service and its content. © 2019 TradingWalk.
TradingWalk indicators are built for TradingView. TradingWalk is on no way a part of TradingView.

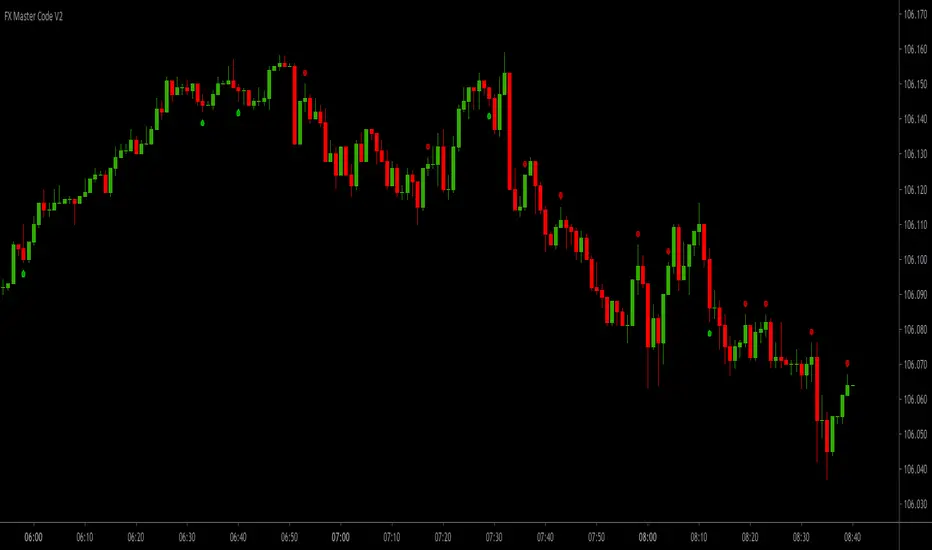
FX Master Code V2FX Master Code V2 (Non Repaint)
TradingView Account Needed: Free
Are you making the making the kind of results you want from trading right now?
Well, if the answer's no, then read this!
Even if you're a complete beginner in trading or an experienced trader, you can use these signals and alerts to start making great results.
The main goal of trading the 1-minute time frame is to make a profit through buying or selling currency pairs by holding a position for a very short period of time, and closing it for a profit.
FX Master Code will give you signals based on my proven and profitable 1-minute trading strategy.
You should be aware that this strategy will demand a certain amount of time and concentration. If you are not able to dedicate at least one hour a day to trade this strategy, then trading the 1-minute chart might not be the best strategy for you.
This is a day trading strategy suitable scalpers and binary options traders, as it involves opening a buy or sell position, gaining a few pips, and then closing the position 3 candlesticks after the signal (3 minute expiration time for binary options).
The exiting aspect of this is quantity. It is not unusual for traders to place more than +10 trades a day (and the more trades you place, the higher returns you can make).
Why not try FX Master Code and see if this system works for you?
The essence of the system will not allow for high losses. We will help you with risk management, use the best-practice risk and trade management for successful trading we give you with FX Master Code.
FX Master Code can be an extremely effective and profitable strategy – even for those who are beginners or use it purely as a supplementary strategy.
What is even better, using this strategy you are rewarded for quantitative work – the more trading you perform, the higher returns you can make.
If you want more details, the link is in the signature.
Disclaimer:
Past performance is not indicative of future performance. No representation is being made that any results discussed within the service and its related media content will be achieved. All opinions, news, research, analyses, prices or other information is provided as general market commentary and not as investment advice. TradingWalk, their members, shareholders, employees, agents, representatives and resellers do not warrant the completeness, accuracy or timeliness of the information supplied, and they shall not be liable for any loss or damages, consequential or otherwise, which may arise from the use or reliance of the TradingWalk service and its content. © 2019 TradingWalk.
TradingWalk indicators are built for TradingView. TradingWalk is on no way a part of TradingView.
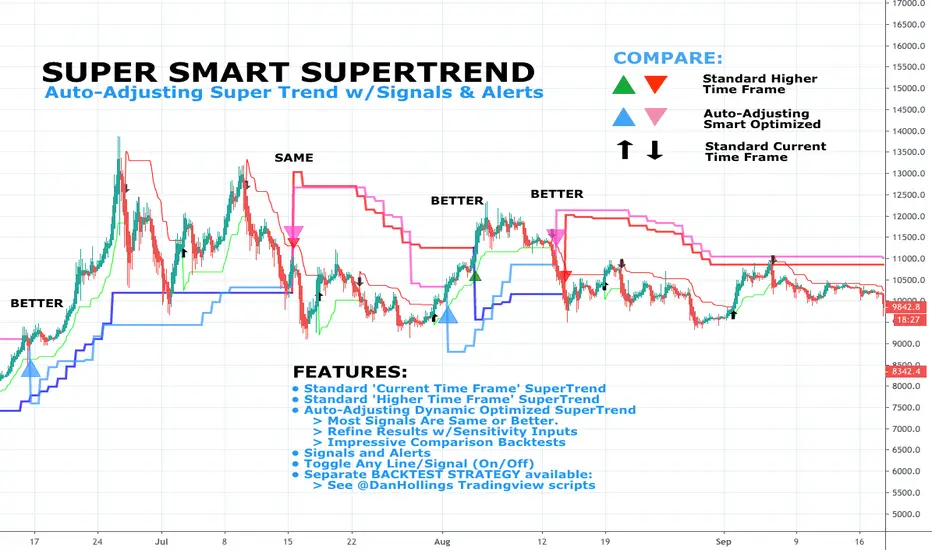
DH: (Study) Super Smart SuperTrend: Self AdjustingSUPER SMART SUPERTREND (Study Version w/Alerts)
Using data from other indicators I came up with a SMART SUPERTREND that auto-adjusts as the market changes - shall we call it "Artificial Intelligence?" Yes, you can fine tune it for specific assets and timeframes, but once the settings are entered, it auto-adjusts as the market and prices evolve.
This is the STUDY version of "Super Smart SuperTrend" with ALERTS. There is also a STRATEGY version which is designed for backtesting various settings.
STRATEGY VERSION FOR BACKTESTING IS HERE
ABOUT THIS INDICATOR
As the name suggests, 'Supertrend' is a trend-following indicator that is notably popular here on Tradingview and elsewhere. It does a remarkably great job of recognizing a trend (in progress) and it will signal you to initiate a position when the trend is clear. Perhaps the greater value of Supertrend is that it helps keep you in your position until that trend is over.
WHAT'S THE BEST ATR PERIOD AND MULTIPLIER?
There are two important data points we must enter for Supertrend to work, namely the 'period (ATR number of candles or days)' and the 'multiplier (value by which ATR is multiplied)' BTW, in case you don't know, ATR signals the degree of price volatility. A common default setting is 10 for the ATR period and 3 for the multiplier.
SORRY, BUT THE MOVIE STARTED HALF HOUR AGO...
Unfortunately Supertrend has a couple of big weaknesses. Generally, it fails in a sideways-moving market and when it does detect a trend, the signal to get in (or out) comes rather late. It's like someone telling you about a great movie they're watching, but by the time you start watching, one-third of the movie is over... bummer, right?
HOW TO IMPROVE SUPERTREND
One solution is to combine Supertrend with other indicators such as MACD, Parabolic SAR, RSI, etc. And another solution is to experiment (backtest) with the Period and Multiplier settings for the asset and timeframe you are considering for trade.
For the STANDARD SETTINGS in this "Super Smart SuperTrend" indicator, I have set 9 for the ATR and 2.2 for the multiplier as default after backtesting on Bitcoin and other crypto (mostly in the 15 minute to 6 HOUR timeframe). Of course you can change this easily to any ATR period and Multiplier you like.
BUT... WHY NOT GET SMART?
I started thinking, it might be best if we let the market determine candle-by-candle what the settings should be. If everyone says that Supertrend works best in conjunction with other indicators, why not do our "conjuncting" programmatically (ie: automatically) sorta like artificial intelligence!
HOW IT WORKS
So here's what I did. Using data from other indicators I came up with a SMART SUPERTREND that auto-adjusts as the market changes. It still has settings so you can fine tune it for specific assets and timeframes, but once the settings are entered, it auto-adjusts as the market and prices evolve.
With "Super Smart SuperTrend" there is no ATR period setting (that is determined programmatically) and now there are TWO multipliers you can experiment with... (a lower one set at 1.7 default and a higher one at 2.5). These multiplier settings create a multiplier range that can be used programmatically to adjust the multiplier as the market and prices evolve.
THE RESULTS
Across all time frames and assets I've tested, I generally get better results. Better entries, better exits and well defined trends. In comparison with a STANDARD Supertrend, it is not radically different, but when it does differ "Super Smart SuperTrend: is almost always better. All this is substantiated by backtesting of course.
SAMPLE BACKTEST RESULTS (BTC/USD)
Using Indicator Defaults
TIMEFRAME STANDARD RESULTS SUPER SMART RESULTS
% Profitable | Profit Factor % Profitable | Profit Factor
DAY 58.33% 9.38 75.00% 10.77
4 HOUR 78.43% 18.22 80.95% 21.78
1 HOUR 74.11% 8.98 70.13% 9.34
15 MIN 58.10% 6.10 71.43% 9.48
Keep in mind that "Profit Factor" is key. It basically tells you what you'd make for every ONE DOLLAR invested by consistently trading with the backtested parameters.
SUPER SMART SUPERTREND FEATURES
• There is a STUDY VERSION w/Alerts
• There is a STRATEGY VERSION for Backtesting
• Standard 'Current Time Frame' SuperTrend Line
• Standard 'Higher Time Frame' SuperTrend Line
• Auto-Adjusting Dynamic Optimized SuperTrend Line
> Most Signals Are Same or Better than Standard
> Refine Results w/Sensitivity Inputs (2 Multipliers)
> Impressive Comparison Backtests
• Both Standard and Smart Signals and Alerts
• Toggle Any Line/Signal (On/Off)
• Toggle Backtest
> Standard vs. "Smart Auto-Adjust"
> Backtest Higher Timeframe Only
WHAT MORE COULD YOU ASK FOR?
So glad you asked. Actually, there is more... Super Smart SuperTrend is incorporated into my premier indicator set called: STONEHENGE PLUS: SUPERTREND TRADING TOOLKIT.
With STONEHENGE, I'm combining this Super Smart SuperTrend with dozens of other indicators plus predictive "Stones." Check out STONEHENGE... you'll be in Trader's Heaven.
That's it. Get "SMART" Today!
STONEHENGE PLUS:
The Complete SuperTrend Trading Toolkit
SUPER SMART SUPERTREND ALSO WORKS WITH:
STONEHENGE BASIC: Double Stone Version (Study w/Alerts):
######
######
PLEASE HIT THE LIKE BUTTON (and follow me... lots of great stuff in the works!)
As always, I appreciate your support. Please share with others.
ENJOY!
Dan Hollings
Master Crypto Grid Trader
Stonehenge Master Mason
Host of the "High Leverage Lounge"
Please Explore My Other Indicators, Scripts, Grids and Educational Ideas.
@DanHollings on Tradingview.
Additional Links Below...
BORSACA TRADERBORSACA TRADER does NOT REPAINT. If the signal occurs it will be forever. Easy and profitable strategy optimized for Crypto, Foreks and Stock Markets...
This indicator gives you Long and Exit signals all timeframes...
BORSACA TRADER is optimized to catch trend movements as soon as possible and maximize profitability.
Strategy tester results. 96% Profitable on BTCUSD Daily scale. Test other markets you want.
WE RELY ON OUR INDICATOR TO THE END. AND WE ASSURE YOU THERE IS NOTHING BETTER THAN THE BORSACA TRADER INDICATOR.
Best regards and happy trading.
Herif's winning strategy option. Check the strategy tester results success than %96
Safe Mode as optional parameter. You can enable this to prevent some riskier trades to happen at the cost of some profitability. Use it if you are more conservative in trading.
Normal Mode signals for Buy and Sell. Trade Mode signals for buy and sell use with support and resistance levels.
Auto Support And Resistance ..
Auto Fibonacci Levels...
BORSACA TRADER indicator is the best option for everybody in financial markets. Check my Profile Page for more information and follow me, like and favorite my indicator and support your positive response and take a message for 10 days trial.
UPDATED PINE SCRIPT V4
Happy trading. Good luck :)
Jurik RSX+Hello friends,
Meet Jurik RSX+, a powerful standalone oscillator that also integrates perfectly with Profitable Jurik RSX optimizer.
It enhances Jurik's original RSX by introducing a Values Distribution Profile , Point of Control (POC) , and Value Area visualization — transforming a traditional oscillator into a statistically guided market sentiment tool.
These additions help identify where true equilibrium, overbought, and oversold zones occur based on the actual behavior of RSX values rather than fixed numeric levels.
🛠 How It Works
Jurik RSX+ applies advanced smoothing and statistical profiling to analyze how RSX values are distributed over time.
The Values Distribution Profile builds a frequency map of RSX activity, allowing traders to see:
The Point of Control (POC) — the statistically dominant RSX level.
The Value Area — the range where RSX values cluster most frequently.
By studying this distribution, the indicator reveals true overbought, oversold, and midline zones , adapting dynamically to different instruments and market conditions.
On top of that, traders can construct fully customized Buy/Sell signals using crossover conditions between RSX, Signal Line, Midline, or POC — creating a flexible signal generation framework.
🔥 Key Features
Jurik RSX foundation with enhanced smoothing and adaptive distribution modeling
Values Distribution Profile identifying statistically balanced and extreme zones
Point of Control (POC) and Value Area visualization for precision analysis
Customizable Buy/Sell logic — up to 4 Buy and 4 Sell slots using flexible crossover conditions
Strategy Mode preventing overlapping Buy/Sell signals
Multiple visualization styles — Labels , Dots , Stripes , or combined modes
Integrated alerts for RSX, POC, and OB/OS conditions
If you'd like access or have any questions, feel free to reach out to me directly via DM.
👋 Good luck and happy trading!
Bezahltes Script

RSI+A free addon for Profitable RSI . Equipped with RSI Values Distribution Profile, Point of Control, Value Area (customizable % based) and alert system.

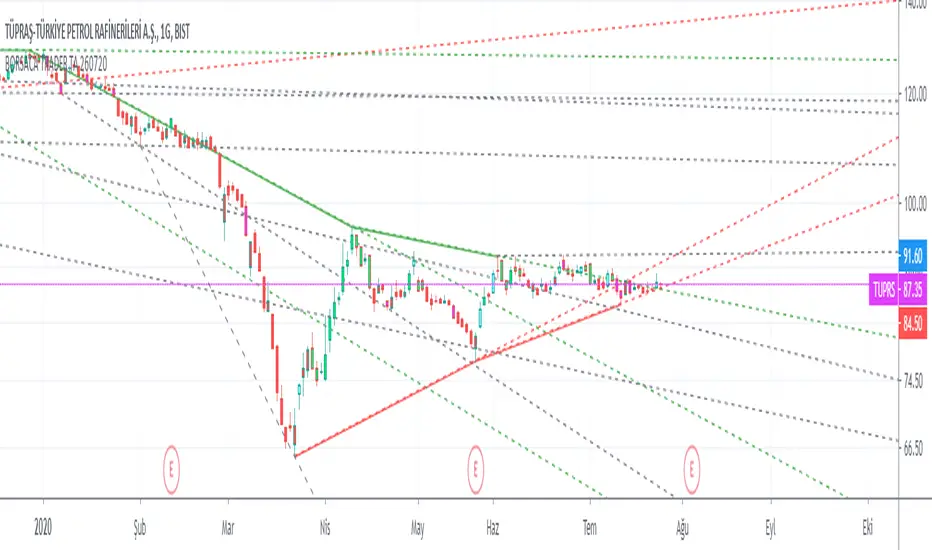
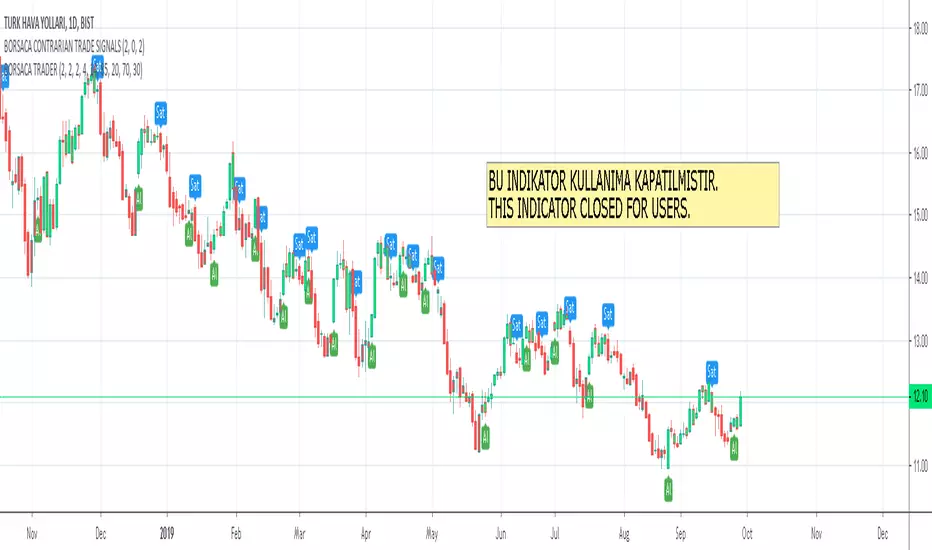
BORSACA CONTRARIAN TRADE SIGNALSThis indicator does NOT REPAINT. If the signal occurs it will be forever. Easy and profitable strategy optimized for Crypto, Foreks and Stock Markets...
This indicator gives you Long and Exit signals all timeframes...
BORSACA CONTRARIAN TRADER is optimized to catch trend movements as soon as possible and maximize profitability.
Strategy tester results. 96% Profitable on BTCUSD Daily scale. Test other markets you want.
WE RELY ON OUR INDICATOR TO THE END. AND WE ASSURE YOU THERE IS NOTHING BETTER THAN THE BORSACA TRADER INDICATOR.
Best regards and happy trading.
Added Auto Support And Resistance ..
Added Auto Fibonacci Levels...
BORSACA CONTRARIAN TRADER indicator is the best option for everybody in financial markets. Check my Profile Page for more information and follow me, like and favorite my indicator and support your positive response and take a message for 10 days trial.
Happy trading. Good luck :)
Borsaca Demo Limited Time OnlyThis indicator does NOT REPAINT. If the signal occurs it will be forever. Easy and profitable strategy optimized for Crypto, Foreks and Stock Markets...
This indicator gives you Long and Exit signals all timeframes...
BORSACA TRADER is optimized to catch trend movements as soon as possible and maximize profitability.
Strategy tester results. 96% Profitable on BTCUSD Daily scale. Test other markets you want.
WE RELY ON OUR INDICATOR TO THE END. AND WE ASSURE YOU THERE IS NOTHING BETTER THAN THE BORSACA TRADER INDICATOR.
Best regards and happy trading.
Herif's winning strategy option. Check the strategy tester results success than %96
Safe Mode as optional parameter. You can enable this to prevent some riskier trades to happen at the cost of some profitability. Use it if you are more conservative in trading.
Normal Mode signals for Buy and Sell. Trade Mode signals for buy and sell use with support and resistance levels.
Auto Support And Resistance ..
Auto Fibonacci Levels...
BORSACA TRADER indicator is the best option for everybody in financial markets. Check my Profile Page for more information and follow me, like and favorite my indicator and support your positive response and take a message for 10 days trial.
Happy trading. Good luck :)

BorsacaThis indicator does NOT REPAINT. If the signal occurs it will be forever. Easy and profitable strategy optimized for Crypto, Foreks and Stock Markets...
This indicator gives you Long and Exit signals all timeframes...
BORSACA TRADER is optimized to catch trend movements as soon as possible and maximize profitability.
Strategy tester results. 96% Profitable on BTCUSD Daily scale. Test other markets you want.
WE RELY ON OUR INDICATOR TO THE END. AND WE ASSURE YOU THERE IS NOTHING BETTER THAN THE BORSACA TRADER INDICATOR.
Best regards and happy trading.
Herif's winning strategy option. Check the strategy tester results success than %96
Safe Mode as optional parameter. You can enable this to prevent some riskier trades to happen at the cost of some profitability. Use it if you are more conservative in trading.
Normal Mode signals for Buy and Sell. Trade Mode signals for buy and sell use with support and resistance levels.
Auto Support And Resistance ..
Auto Fibonacci Levels...
BORSACA TRADER indicator is the best option for everybody in financial markets. Check my Profile Page for more information and follow me, like and favorite my indicator and support your positive response and take a message for 10 days trial.
Happy trading. Good luck :)

BORSACA TRADER LIMITED TIME USE ONLYThis indicator does NOT REPAINT. If the signal occurs it will be forever. Easy and profitable strategy optimized for Crypto, Foreks and Stock Markets...
This indicator gives you Long and Exit signals all timeframes...
BORSACA TRADER is optimized to catch trend movements as soon as possible and maximize profitability.
Strategy tester results. 96% Profitable on BTCUSD Daily scale. Test other markets you want.
WE RELY ON OUR INDICATOR TO THE END. AND WE ASSURE YOU THERE IS NOTHING BETTER THAN THE BORSACA TRADER INDICATOR.
Best regards and happy trading.
Herif's winning strategy option. Check the strategy tester results success than %96
Safe Mode as optional parameter. You can enable this to prevent some riskier trades to happen at the cost of some profitability. Use it if you are more conservative in trading.
Normal Mode signals for Buy and Sell.
Trade Mode signals for buy and sell use with support and resistance levels.
Auto Support And Resistance..
Auto Fibonacci Levels...
BORSACA TRADER indicator is the best option for everybody in financial markets. Check my Profile Page for more information and follow me, like and favorite my indicator and support your positive response and take a message for 10 days trial.
Happy trading. Good luck :)
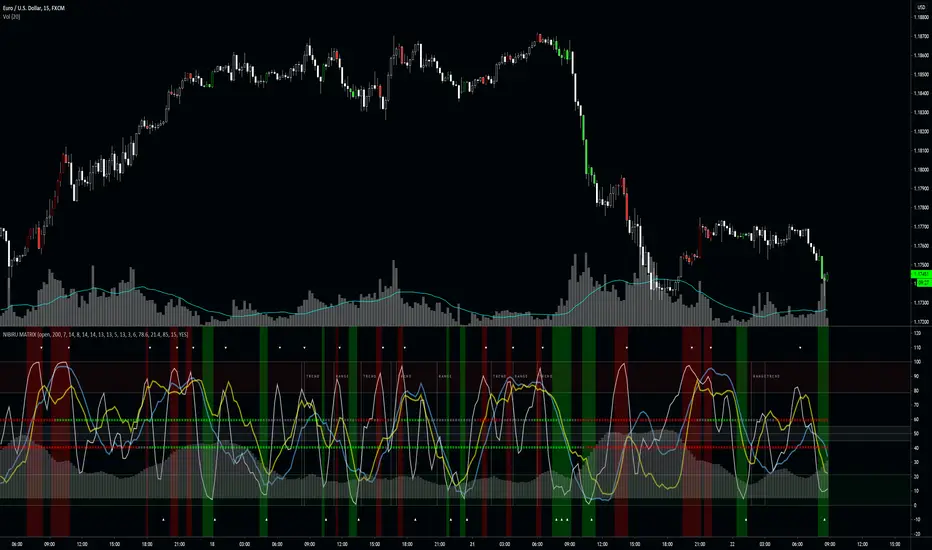
NIBIRU MATRIXThe Nibiru Matrix is an entry timing tool based on oscillators and trends. It's to provide an intuitive way of timing trades when price is at the resistance or on the support.
The Nibiru Matrix provides trade entry hints and information about the current market behavior (trending or ranging). If the market is trending, it also shows the trend strength and direction. It is a secondary indicator meaning it trade should be made on the support or resistance using Nibiru Matrix as a confluence indicator.
What it plots?
Slow, fast and stochastic oscillators
Bar coloring to warn about possible setups
Trending/ranging market indication
Current volatility
2 methods of trend confirmation based on 2 different algorithms
Indicator components:
Trend/range setup - provides information about current possible trade strategy. Following a RANGE indicator, Voodoo Matrix suggests that the safest way to trade will be between the local support and resistance shown by Voodoo Support and Resistance, and following a TREND indicator, it is likely that a trending strategy or taking profit on larger ranges is more profitable.
Fast trend indicator - providing color based information on direction of the short-term trend. This is the most reactive trend indication shown by Voodoo Matrix. This can even be used for counter-main-trend scalping.
Green - uptrend
Red - downtrend
Gray - indecision
Slow trend indicator - providing color based information on direction of the long-term trend. It is based on the behavior of a longer period EMAs.
Green - uptrend
Red - downtrend
Gray - indecision
Volatility histogram - information on current price strength. Best used in confluence with the short term trend indicator.
Fast oscillator - oscillator based on stochastic RSI, modified to provide better information on timing and price movement. It's fast moving which helps time the shorter-term moves.
Slow oscillator - oscillator based on stochastic RSI, modified to provide better information on timing and price movement. It's slow moving and provides useful information about the price direction and strength of the move.
Stochastic oscillator - simple stochastic oscillator. Best used with both Fast and Slow Oscillators to get best timing and price movement strength and direction.
Overbought zone - area of the chart where the modified stochastic oscillator suggests the market is currently overbought.
Oversold zone - area of the chart where the modified stochastic oscillator suggests the market is currently oversold.
Neutral zone - area of the chart where the modified stochastic oscillator suggests the market is currently neutral.
Timing confirmation hints - signaling confirmation of fast oscillator forming a buy/sell setup.
Fast oscillator buy/sell color hint s – bar coloring to bring a focus and attention to possible buy/sell signal forming on the fast oscillator.
Use the link below or PM me to gain access to the indicator.
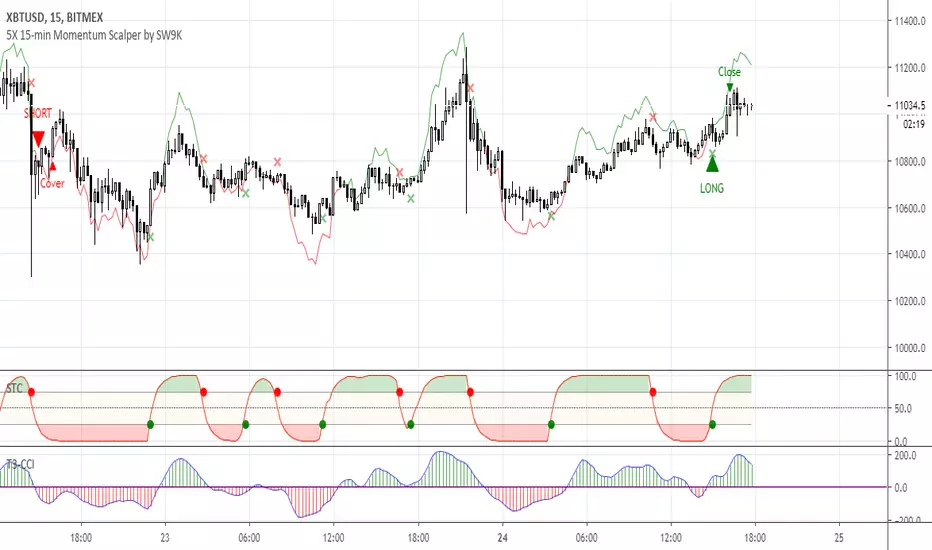
5X 15-min Momentum Scalper by SW9KThis is the alpha release-candidate study script with indicator alerts included. It is currently open for select individuals to test.
The core of this momentum scalper is primarily based on a modified Schaff Trend (which in itself is based on Stochastic elements and MACD) and a modified T3-CCI oscillator, specifically calibrated for 15-minute type movements -- do not apply to any other timeframes. Although it will take small scalps, it is designed to recognize when to ride out underwater positions so use maximum leverage or 5X or you may risk liquidation. Also, there is a stop loss setting feature, but it may reduce profits and win rate.
You can verify the highly accurate 75% win rate performance statistics with 100,000 XBTUSD contracts simulated at .
Features:
40% 3-month net profit, 74.48% win rate, 2.988 profit factor, 3.13% max drawdown, adjusted Sharpe ratio of ~3
Optimized for 15 minute timeframe scalping
Attempts to recognize when to keep position open and ride them out into profitable or breakeven
Profitable even with full Bitmex taker fees (0.075%)
Pyramiding Setting (default 3)
Aggressive Mode to increase entries and potential profits at higher risk
Easy-to-set binary Alerts
Follow SW9K at www.twitter.com
ATR and RSI Buy / Sell Signal Beta 1.0This has been a long time coming for me.
I need to clean it up and add inputs for others to customize it that's why its protected.
This is configured for US securities.
Goal: Signal when to enter a trade on either side
Method: ATR and 2 RSI signals using:
3 Minute Chart Resolution
MUST have an active (can be hidden) BUILT-IN ATR ; length = 4 and set to RMA smoothing
MUST add the script; THEN go to the scripts settings and change the source to ATR. TV does not allow this to be set to default (that I know of)
I have default settings how I use them but you can modify:
ATR period (Length) =4
ATR multiplier = 0.9 (can edit by 0.1 increments.
The 1st Length/offset/resolution is defaulted to the 1 minute RSI.
The 2nd Length/offset/resolution is defaulted to the 3 minute RSI.
1)
OVERBOUGHT or OVERSOLD
*Please understand I use a length of 4 for this script, that is why the RSI OB/OS limits are so high/low.
Overbought conditions will light yellow if the 1m RSI > 90 and the 3min RSI > 85 and the time is between 09:42am and 16:00
Oversold conditions will light yellow if the 1m RSI < 10 and the 3min RSI < 10 and the time is between 09:42am and 16:00
The script ensures that if it is OB/OS under these conditions than it will not signal a buy or sell.
2)ATR
The script identifies reversals via the close breaking past the previous ATR on the preceding candle. ATR will not move UP on a short and will not move down on a long. It trails the last candle it was not broken.
The script plots labels up and down to identify the start of a reversal. Each start will have an accompanying line to display the continuation of the trend in one direction.
The script displays the value of the STOP as it trails price action. One could continue to mirror this value if you chose to. I use the fib tool for my targets and manage it as P/A demands.
3) RSI SIGNALLING
The script identifies a trend by analyzing BOTH RSI (1m and 3m) measures and requires that the current bar's readouts for BOTH measures are either greater or lower than the preceding candle.
The script also requires that both measures are above or below 50 to signal a trend.
The script will plot the trend as arrows up or down, it will display a (-) when the these conditions are not met.
Requirements to signal a BUY (LIME GREEN) or SELL (BRIGHT RED):
**Ensure your chart candle colors are faded so you can see the signal.**
**Precision is set to 0; remember TV rounds up or down for the visual measure but uses the exact measure for the script**
During the first 12 minutes:
----------------------------------
There are no OB/OS conditions as informed in section 1.
ATR stop line must be present OR the current bar close is higher than the ATR stop of the preceding candle whether it is a long or short stop signal. Quick whips are accounted for.
The current bar close MUST be higher or lower than the preceding candle's HIGH or LOW.
The script MUST identify the RSI signalling as detailed above in section 3.
The candle will light LIME or BRIGHT RED when these conditions are met and will not deceive the statements I have made.
It is important to understand that the signal may become null if the conditions do not persist through the final close of the candle. This means that a snapshot of the indicator does not accurately represent
what it will display at different times during each countdown of EACH 3 minute candle. Sometimes it signals to go long and once RSI gets too high it no longer signals. This is a good thing. Limits FOMO entries.
@ 09:42 until 16:00
-----------------------------------
OB/OS yellow candles will now occur as detailed in section 1.
Candles MUST clear the HIGH or LOW of the TWO preceding candles.
Candles MUST be trending as defined in section 3.
Candles MUST conform the conditions of the ATR stop.
I want to thank;
@pinescripters
@freedom_trader_
and I will even thank the manual lol
I have manually back tested this because I am working on the proper coding to have TV do it for me.
My strategy requires me to cover 25% of my position at 0.5 of the TV ATR 4 length RMA indicator.
Once the first target is hit than the STOP is moved to break-even.
If the target is not hit than my maximum loss is also 0.5 of the TV ATR 4 length RMA indicator.
I tested 3 full days, always on the 3min chart.
I tested 96 trades. All occurring immediately upon signal.
85 were wins and 9 were losses, 88.5% profitable.
Please understand that my intend is to cover enough quickly to cover commission costs and limit losses.
The remaining 75% of my position are sold off in the following pattern unless P/A demands that I override the FIB tool. Let them run when you can.
Position ENTRY
25% cover @ 0.5 x ATR
25% of remaining position cover @ 1.75 x ATR
25% of remaining position cover @ 2.5 x ATR
25% of remaining position cover @ 3.5 x ATR (APX 40% of the initial position)
I will further back test in the near future with an expanded risk.

Moving Average CrossoverIt was planned as an addition to Moving Average Smoothness Benchmark and Profitable Moving Average Crossover , but can be used standalone.
Supports 62 types of well-known moving averages and allows full-featured customization.
Supported types of averages and filters:
AEMA , Adaptive Exponential MA (by Vitali Apirine)
AHMA , Ahrens MA (by Richard D. Ahrens)
ALMA , Arnaud Legoux MA (by Arnaud Legoux and Dimitris Kouzis-Loukas)
ALF , Adaptive Laguerre Filter (by John F. Ehlers)
AMA , Adaptive MA (by Vitali Apirine)
ARSI , Adaptive RSI
BAMA , Bryant Adaptive MA (by Michael R. Bryant)
BF2 , Butterworth Filter with 2 poles
BF3 , Butterworth Filter with 3 poles
DEMA , Double Exponential MA (by Patrick G. Mulloy)
DWMA , Double Weighted (Linear) MA
EDCF , Ehlers Distance Coefficient Filter (by John F. Ehlers)
EDSMA , Ehlers Deviation-Scaled MA (by John F. Ehlers)
EHMA , Exponential Hull MA
EMA , Exponential MA
EVWMA , Elastic Volume Weighted MA (by Christian P. Fries)
FRAMA , Fractal Adaptive MA (by John F. Ehlers)
GF1 , Gaussian Filter with 1 pole
GF2 , Gaussian Filter with 2 poles
GF3 , Gaussian Filter with 3 poles
GF4 , Gaussian Filter with 4 poles
HFSMA , Hampel Filter on Simple Moving Average
HFEMA , Hampel Filter on Exponential Moving Average
HMA , Hull MA (by Alan Hull)
HWMA , Henderson Weighted MA (by Robert Henderson)
IDWMA , Inverse Distance Weighted MA
IIRF , Infinite Impulse Response Filter (by John F. Ehlers)
JAMA , Jurik Adaptive MA (by Mark Jurik)
JMA , Jurik MA (by Mark Jurik, )
KAMA , Kaufman Adaptive MA (by Perry J. Kaufman)
LF , Laguerre Filter (by John F. Ehlers)
LMA , Leo MA (by ProRealCode' user Leo)
LSMA , Least Squares MA (Moving Linear Regression)
MAMA (by John F. Ehlers)
FAMA , Following Adaptive MA (by John F. Ehlers)
MD , McGinley Dynamic (by John R. McGinley)
MHLMA , Middle-High-Low MA (by Vitali Apirine)
MNMA , McNicholl MA (by Dennis McNicholl)
NSMA , Moving Average 3.0 on SMA (by Manfred G. Dürschner)
NEMA , Moving Average 3.0 on EMA (by Manfred G. Dürschner)
NWMA , Moving Average 3.0 on WMA (by Manfred G. Dürschner)
NVWMA , Moving Average 3.0 on VWMA (by Manfred G. Dürschner)
PEMA , Pentuple Exponential MA (by Bruno Pio)
PWMA , Parabolic Weighted MA
QMA , Quick MA (by John McCormick)
QEMA , Quadruple Exponential MA (by Bruno Pio)
REMA , Regularized Exponential MA (by Chris Satchwell)
RMA , Running MA (by J. Welles Wilder)
RMF , Recursive Median Filter (by John F. Ehlers )
RMTA , Recursive Moving Trend Average (by Dennis Meyers)
SHMMA , Sharp Modified MA (by Joe Sharp)
SMA , Simple MA
SSF2 , Super Smoother Filter with 2 poles (by John F. Ehlers)
SSF3 , Super Smoother Filter with 3 poles (by John F. Ehlers)
SWMA , Sine Weighted MA
TEMA , Triple Exponential MA (by Patrick G. Mulloy)
TMA , Triangular MA (generalized by John F. Ehlers)
T3 , (by Tim Tillson)
VIDYA , Variable Index Dynamic Average (by Tushar S. Chande)
VWMA , Volume Weighted MA (by Buff P. Dormeier)
WMA , Weighted (Linear) MA
ZLEMA , Zero Lag Exponential MA (by John F. Ehlers and Ric Way)
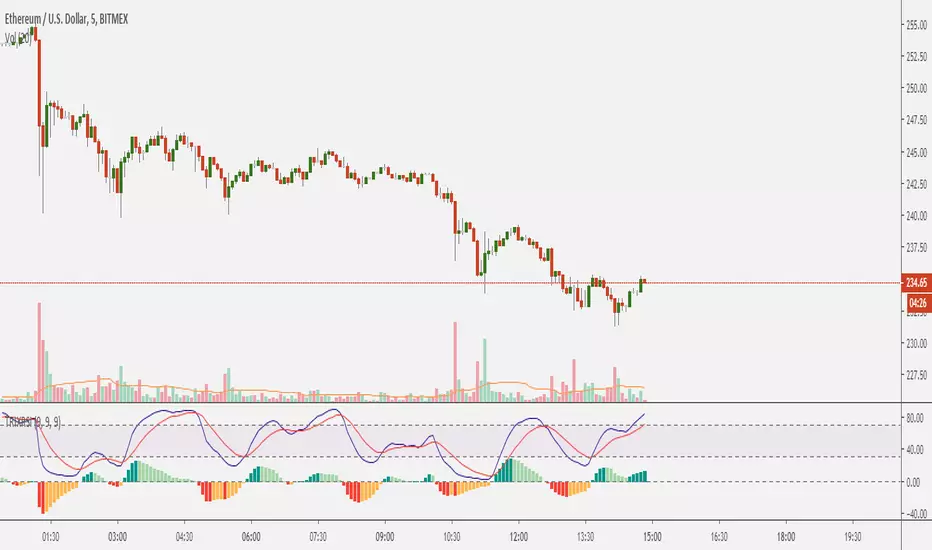
TRSIThis indicator is made by uniting into one three famous indicators - RSI, TRIX and EMA, because of this there are less wrong signals and more potential profitable deals.
The script was intended to be used on 15 minute timeframe, but it also can be used on bigger timeframes. For 15 minute tf best periods tested by me are 9-9-9.
The script was tested on XBT/USD and ETH/USD 15 min tf, Bitmex and gave from 80 to 90% profitable deals.
How to use:
Long signal: the RSI (blue line) goes down 30 area, reverses and crosses 30 and EMA (orange) line.
Short signal: the RSI (blue line) goes up 70 area, reverses and crosses 70 and EMA (orange) line.
Dont use only one TRIXRSI to enter the deal. Use it in combination with other indicators.
Make sure to draw main resistance and support lines because it is not right to long below resistance and to short over support lines.
Instead, the script usually gives you a signal to short under resistance and to long over support zones.
I will be glad to hear your feedback.
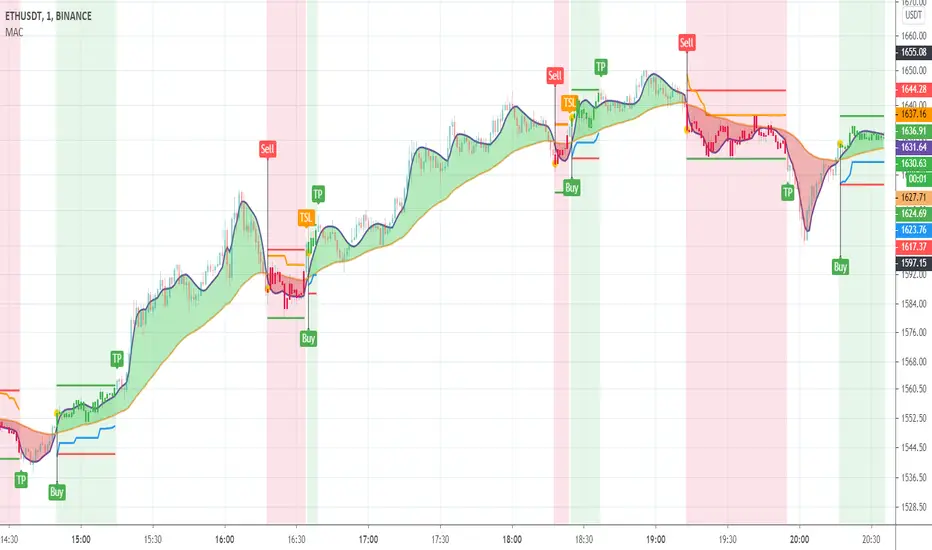
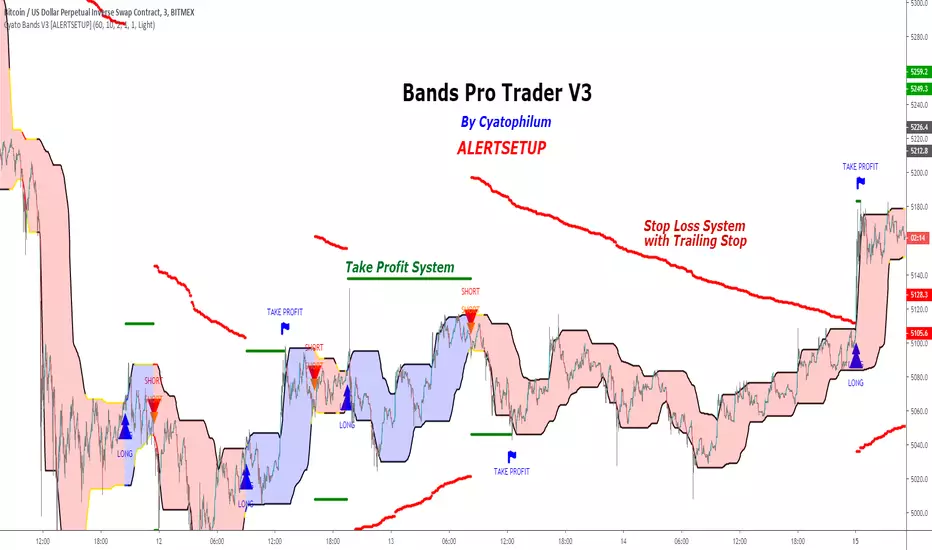
Cyatophilum Bands Pro Trader V3 [ALERTSETUP]An Original Automated Strategy that can be used for Manual or Bot Trading, on any timeframe and market.
>> Presentation <<
This script comes with a Backtest Version
How it works
No, these are NOT Bollinger Bands..
The Cyatophilum Bands are an original formula that I created. You will probably never find it anywhere else.
Their behavior is the following:
When they are horizontal it means the trend is going sideways and they represent supports (lower band) and resistances (upper band).
When they are climbing or falling it means the trend is either bullish or bearish and they represent Trend Lines.
The strategy enters Long on a Bull Breakout and enters Short on a Bear Breakout.
The exits are triggered either on a Trend Reversal, a Stop Loss or a Take Profit.
FEATURES
Take Profit System
Stop Loss System
Show Net profit Line
More features here
Finding a profitable configuration is GUARANTEED
0. Choose your symbol and timeframe. Then add the Backtest version to your chart. If at any time you decide to change your timeframe, go back to step 1.
1. Open the strategy tester and look at the buy & hold line.
If it is mostly climbing (last value greater than 0) then it means we are in a bull market. You should then opt or a long only strategy.
If it is mostly dropping (last value lower than 0) then it means we are in a bear market. You should then opt or a short only strategy.
Note : This first step is really important. Trading against the market has very little chances to succeed.
2. Go into the Strategy Input Parameters:
check "Enable Long Results" and uncheck "Enable Short Results" if you are in a long only strategy.
check "Enable Short Results" and uncheck "Enable Long Results" if you are in a short only strategy.
3. Open the Strategy Tester and open the Strategy Properties.
We are going to find the base parameters for the Bands.
The "Bands Lookback" is the main parameter to configure for any strategy. It corresponds to how strong of a support and resistance the bands will behave. The lower the timeframe, the higher lookback you will need. It can move from 10 to 60. For example 60 is a good value for a 3 minute timeframe. Try different values, and look at the "net profit" value in the Overview tab of the Strategy Tester. Keep the Lookback value that shows the best net profit value.
Then play with the "Bands Smoothing" from 2 to 20 and keep the best net profit value.
The "Band Smoothing" is used to reduce noise.
Usually, the default value (10) is what gives the best results.
From this point you should already be able to have a profitable strategy (net profit>0), but we can improve it using the Stop Loss and the Take Profit feature.
4. To activate the Stop Loss feature, click on the "SECURITY" checkbox
You should see horizontal red lines appear.
A Long/short exit alert will be triggered if the price were to cross this line. (A red Xcross will appear)
Choose the Stop Loss percentage.
On top of that, you can enable the feature "Trailing Stop". It will make the red line follow the price, at a speed that you can configure with the "Trailing Speed" parameter.
Now, sometimes a stop is triggered and it was just a fakeout. You can enable "Re-entries after a stop" to avoid missing additional opportunities.
5. To activate the Take Profit feature, click on the "TAKE PROFIT" checkbox
You should see horizontal green lines appear.
A Long/short exit alert will be triggered if the price were to cross this line. (A flag will appear)
Choose the Take Profit percentage.
A low takeprofit will provide a safer strategy but can reduce potential profits.
A higher takeprofit will increase risk but can provide higher potential profits.
6. Money Management
You can configure the backtest according to your own money management.
Let's say you have 10 000 $ as initial capital and want to trade only 5%, set the Order Size to 5% of Equity.
You can increase net profit by increasing the order size but this is at your own risk.
How to create alerts explained here
Sample Uses Cases
Use it literally anywhere
This indicator can be used on any timeframe and market (not only cryptocurrencies).
About the Backtest below
The Net Profit (Gross profit - Gross loss) is calculated with a commission of 0.05% on each order.
No leverage used. This is a long strategy.
Each trade is made with 10 % of equity from an inital capital of 10 000$. The net profit can be bigger by increasing the % of equity but this a trader's rule to minimise the risk.
I am selling access to all my indicators on my website : blockchainfiesta.com
To get a 2 days free trial, just leave a comment , thanks !
Join my Discord for help, configurations, requests, etc. discord.gg
PivotBoss TriggersI have collected the four PivotBoss indicators into one big indicator. Eventually I will delete the individual ones, since you can just turn off the ones you don't need in the style controller. Cheers.
Wick Reversal
When the market has been trending lower then suddenly forms a reversal wick candlestick , the likelihood of
a reversal increases since buyers have finally begun to overwhelm the sellers. Selling pressure rules the decline,
but responsive buyers entered the market due to perceived undervaluation. For the reversal wick to open near the
high of the candle, sell off sharply intra-bar, and then rally back toward the open of the candle is bullish , as it
signifies that the bears no longer have control since they were not able to extend the decline of the candle, or the
trend. Instead, the bulls were able to rally price from the lows of the candle and close the bar near the top of its
range, which is bullish - at least for one bar, which hadn't been the case during the bearish trend.
Essentially, when a reversal wick forms at the extreme of a trend, the market is telling you that the trend
either has stalled or is on the verge of a reversal. Remember, the market auctions higher in search of sellers, and
lower in search of buyers. When the market over-extends itself in search of market participants, it will find itself
out of value, which means responsive market participants will look to enter the market to push price back toward
an area of perceived value. This will help price find a value area for two-sided trade to take place. When the
market finds itself too far out of value, responsive market participants will sometimes enter the market with
force, which aggressively pushes price in the opposite direction, essentially forming reversal wick candlesticks .
This pattern is perhaps the most telling and common reversal setup, but requires steadfast confirmation in order
to capitalize on its power. Understanding the psychology behind these formations and learning to identify them
quickly will allow you to enter positions well ahead of the crowd, especially if you've spotted these patterns at
potentially overvalued or undervalued areas.
Fade (Extreme) Reversal
The extreme reversal setup is a clever pattern that capitalizes on the ongoing psychological patterns of
investors, traders, and institutions. Basically, the setup looks for an extreme pattern of selling pressure and then
looks to fade this behavior to capture a bullish move higher (reverse for shorts). In essence, this setup is visually
pointing out oversold and overbought scenarios that forces responsive buyers and sellers to come out of the dark
and put their money to work-price has been over-extended and must be pushed back toward a fair area of value
so two-sided trade can take place.
This setup works because many normal investors, or casual traders, head for the exits once their trade
begins to move sharply against them. When this happens, price becomes extremely overbought or oversold,
creating value for responsive buyers and sellers. Therefore, savvy professionals will see that price is above or
below value and will seize the opportunity. When the scared money is selling, the smart money begins to buy, and
Vice versa.
Look at it this way, when the market sells off sharply in one giant candlestick , traders that were short
during the drop begin to cover their profitable positions by buying. Likewise, the traders that were on the
sidelines during the sell-off now see value in lower prices and begin to buy, thus doubling up on the buying
pressure. This helps to spark a sharp v-bottom reversal that pushes price in the opposite direction back toward
fair value.
Engulfing (Outside) Reversal
The power behind this pattern lies in the psychology behind the traders involved in this setup. If you have
ever participated in a breakout at support or resistance only to have the market reverse sharply against you, then
you are familiar with the market dynamics of this setup. What exactly is going on at these levels? To understand
this concept is to understand the outside reversal pattern. Basically, market participants are testing the waters
above resistance or below support to make sure there is no new business to be done at these levels. When no
initiative buyers or sellers participate in range extension, responsive participants have all the information they
need to reverse price back toward a new area of perceived value.
As you look at a bullish outside reversal pattern, you will notice that the current bar's low is lower than the
prior bar's low. Essentially, the market is testing the waters below recently established lows to see if a downside
follow-through will occur. When no additional selling pressure enters the market, the result is a flood of buying
pressure that causes a springboard effect, thereby shooting price above the prior bar's highs and creating the
beginning of a bullish advance.
If you recall the child on the trampoline for a moment, you'll realize that the child had to force the bounce
mat down before he could spring into the air. Also, remember Jennifer the cake baker? She initially pushed price
to $20 per cake, which sent a flood of orders into her shop. The flood of buying pressure eventually sent the price
of her cakes to $35 apiece. Basically, price had to test the $20 level before it could rise to $35.
Let's analyze the outside reversal setup in a different light for a moment. One of the reasons I like this setup
is because the two-bar pattern reduces into the wick reversal setup, which we covered earlier in the chapter. If
you are not familiar with candlestick reduction, the idea is simple. You are taking the price data over two or more
candlesticks and combining them to create a single candlestick . Therefore, you will be taking the open, high, low,
and close prices of the bars in question to create a single composite candlestick .
Doji Reversal
The doji candlestick is the epitome of indecision. The pattern illustrates a virtual stalemate between buyers
and sellers, which means the existing trend may be on the verge of a reversal. If buyers have been controlling a
bullish advance over a period of time, you will typically see full-bodied candlesticks that personify the bullish
nature of the move. However, if a doji candlestick suddenly appears, the indication is that buyers are suddenly
not as confident in upside price potential as they once were. This is clearly a point of indecision, as buyers are no
longer pushing price to higher valuation, and have allowed sellers to battle them to a draw-at least for this one
candlestick . This leads to profit taking, as buyers begin to sell their profitable long positions, which is heightened
by responsive sellers entering the market due to perceived overvaluation. This "double whammy" of selling
pressure essentially pushes price lower, as responsive sellers take control of the market and push price back
toward fair value.

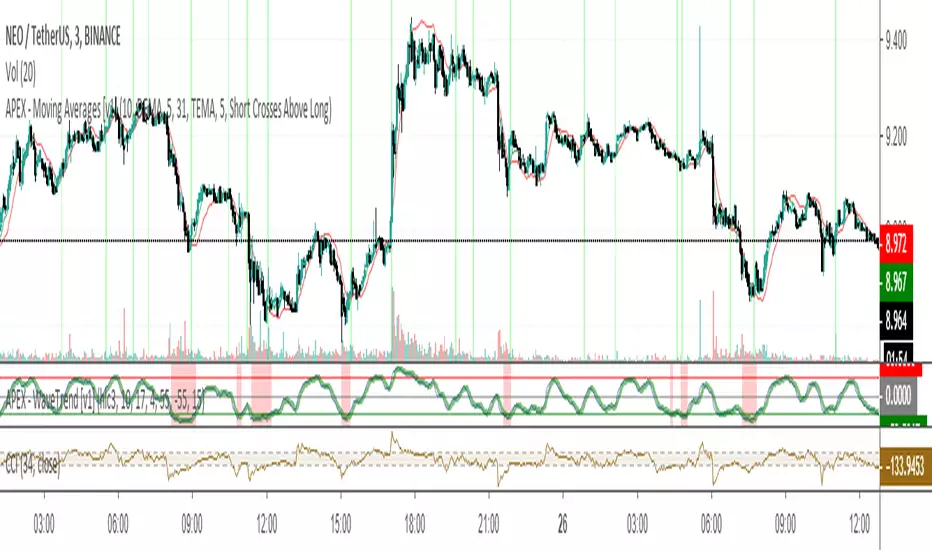
APEX - Moving Averages [v1]A moving average is the most known indicator that takes into consideration price from the last several periods of the price and calculates a smoothed line also known as a Moving average. This way you will cut out a lot of the noise and have a different view.
The most common usage is the moving average crossover system when you buy and sell when a crossover happens. This system is in general not very profitable but can be used effectively in trending markets.
There is really no general rule to what length should be used. The most well-known and respected lengths are 20 / 50 / 100 / 200 for almost all average. These values are respected as strong resistance and support levels. but if you plan to use a crossover Systems the most profitable settings tend to be when the averages are close together 14 and 28 etc. But this is an area I would appeal to for you to really try out what works and what does not.
Other uses of moving averages are the following:
Crossover system
Moving averages are pointing up and price crosses below (Buy Pullback)
The slow-moving average is Below the fast moving average to help to identify possible bullishness
Can be used as support and resistance lines
If you are an advanced user you may want to try out the following techniques:
Create your own moving average by combining several of those together with the source function
Using the Average True Range to create Keltner Channels
Using Standard deviation to create Bollinger bands (Bollinger bands are also accessible on their own)
You can use Moving averages to smooth the noise on other indicators such as RSI / CCI / MFI
PpSignal Acceleration BandsAcceleration Bands
Description:
Adaptive bands that contain 95% of price action usually used in 20 or 80 bar periods. Trading signals occur when price action is confirmed outside the bands.
This indicator targets the top 5% of moves, keeping traders focused on the best trends.
The 20 Bar Acceleration Band Expert Advisor (SPX chart below) shows buy and sell signals based on my system. Notice
hat in the 14 months shown, the &P500 only exposed a signal 4 times, each was profitable. This depicts the 5% theory sell - Acceleration Bands highlight only the extreme moves for option traders. The issue many traders face is really two-fold; many traders want more signals and the entry point can use some refinement. Like the Yin & Yang relationship, I've developed a system that combines Acceleration bands with Williams' Percent R% to remove any weaknesses and refine trading signals. Let's take a look at how it works.
Willams' %R with two separate systems based on breakout and retest (lower risk entries) methods. We have smoothed out and modified Williams' Percent R to make it a better and more usable trading vehicle.
Description: Larry Williams created the Percent Range oscillator to highlight overbought versus oversold levels in securities. Traditionally overbought connotates a long exit or sell short entry as oversold would insinuate the opposite, however, we in general consider overbought to be bullish and oversold to be bearish. The Big Trends Percent R system targets the top 20th percentile and bottom 20th percentile.
Signal
Buy when the price breaks the upperline and W5 overblows.
Sell when the price breaks the lower band and W5 oversold
www.bigtrends.com

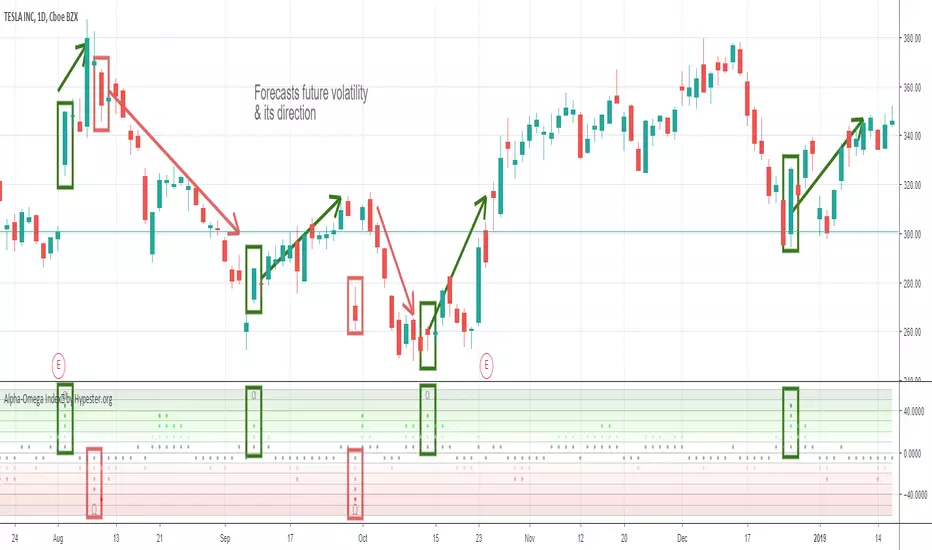
Specter Alpha-Omega Volatility Index™Meet the Alpha-Omega Volatility custom indicator by Specter
This premium volatility indicator uses a series of models to compare historical volatility, and by using a series of noise reduction techniques, it only gives you the very best signals. This indicator shows you aggressive reversals, which are often the most profitable.
The customization options already come with pre-sets, and it's as simple as one click. It comes with Aggressive, Moderate, Conservative and Ultra Conservative behaviors filters.
Also, it offers an interest zone indicator so you can start paying attention to the chart before it happens when trading extra volatile stocks timing is crucial and you want to be ready before the action begins.
The way you use it is pretty simple, you look for divergences. When you have a bullish movement, and you see high negative volatility appearing in the Alpha-Omega indicator, it means a strong reversal/spike is coming. The same goes for bearish reversals, just the opposite logic. You also get an extra layer of confirmation which is the Alpha/Omega characters; they only appear with the most robust volatility prediction. It's up to your trading strategy to decide how conservative you are and which signals you will follow.
It works on any market/security/asset/timeframe.
Ready to ride some spikes?