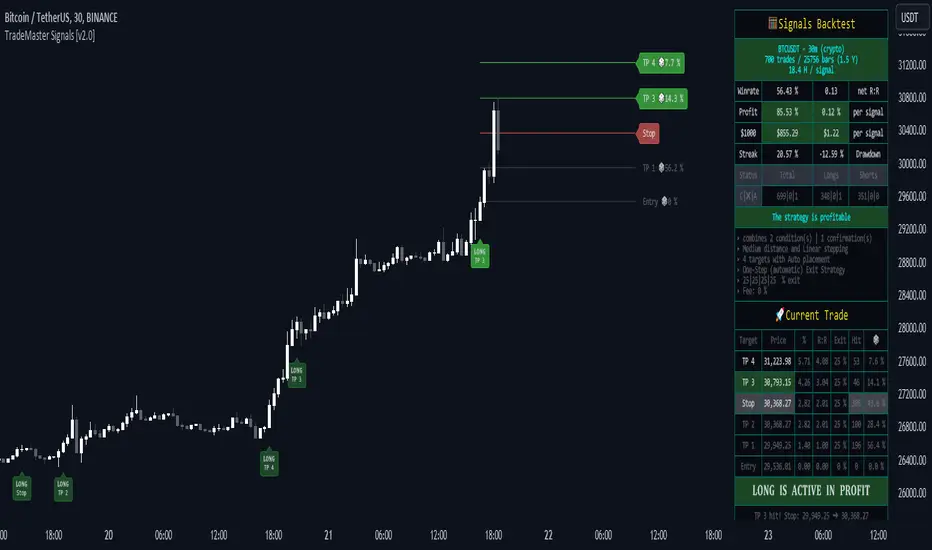
Profit/Loss HelperHi guys, just a quick little indicator based on the ATR to help you set some profit and stop targets. This is NOT financial advice, just a simple indicator that will attempt to another indicator to consult when placing those stop and profit orders.
The indicator will give you the an average stop loss target based on a 2:1 risk reward ratio based on the current timeframe . The first profit target adheres to the 2:1 ratio and should be respected in sideways markets. The following two TPs will give you an indication of what more probable targets will be if you think that the asset is poised to move further.
Further to help with your analysis, the indicator will provide you 4 metrics from different timeframes also based on the ATR and the most probable size of the moves we may see in price. Again this is purely based on the ATR and nothing fancy so take it with a grain of salt and may it help you bring another check when placing orders on the market.
In den Scripts nach "profit" suchen

Profit Z Study Study version of the Profit Z strategy. Generates signals based on price and volume Z-Scores.
We updated this version to include more alerts, volume Z-scores, and an easily-adjustable stop-loss.

Profit Runner Study v2.0Updated version of our Profit Runner indicator. All of our invite-only scripts are available through our website profitprogrammers.com. All studies come together with their strategy equivalent!


Profit/Stop Loss Pro - CryptoProToolsA quick visualization of where the market needs to move to reach your desired level of profit, plus your stop loss point.
Plan your trade entries and exits better with this easy to use visual indicator.

PROFIT CANDLE -BILLION WAY Indicator SimplifiedHere is another good indicator with lot of logical combinations for making some good Buy.
This can be applied for any time frame ,Best works in 30min ,1hr,1D,W,M
Only Look for the Black handle to appear in the chart
As soon as you sea the black candle forming Enter Buy (If you see the black candle after the candle made huge high avoid entering the trade at very high level price)
Cover the the trade after 2to3 candle ,This gives some false signal as well so this might work only 80%.
Test it and provide your feedback.
To get this indicator for your testing invite to give you the access. www.tradingview.com INDEX:VXGO NASDAQ:AAPL /Llkz4wjE/

Profit target areaCalculates short-term support and resistance and shows areas where put profit targets. Area calculation is based on retracement levels 38% and 62%
Assuming that price always tests previous resistance and performs 38% or 62% retracement. So if area above or below are 62% or 38% of the movement, current resistance-support is 100-62 or 100-38. Result area is rest part above resistance to fill 100% of movement (same below).
When price breaks the support or the resistance, put profit target into the area.
You should always watch not only current suggested area, but also previous areas because detecting supports and resistances is not always perfect

Gabriel's Relative Unrealized Profit with Dynamic MVRV Histogram
Certainly! Here’s an enhanced description of the Gabriel's Relative Unrealized Profit with Dynamic MVRV Histogram indicator with detailed usage instructions and explanations of why it's effective:
Gabriel's Relative Unrealized Profit with Dynamic MVRV Histogram
Description:
The Gabriel's Relative Unrealized Profit with Dynamic MVRV Histogram is an advanced trading indicator designed to offer in-depth insights into asset profitability and market valuation. By integrating Relative Unrealized Profit (RUP) and the Market Value to Realized Value (MVRV) Ratio, this indicator provides a nuanced view of an asset's performance and potential trading signals.
Key Components:
SMA Length and Volume Indicator:
SMA Length: Defines the period for the Simple Moving Average (SMA) used to calculate the entry price, defaulted to 14 periods. This smoothing technique helps estimate the average historical price at which the asset was acquired.
Volume Indicator: Allows selection between "volume" and "vwap" (Volume-Weighted Average Price) for calculating entry volume. The choice impacts the calculation of entry volume, either based on standard trading volume or a weighted average price.
Realized Price Calculation:
Computes the average price over a specified period (default of 30 periods) to establish the realized price. This serves as a benchmark for evaluating the cost basis of the asset.
MVRV Calculation:
Current Price: The most recent closing price of the asset, representing its market value.
Total Cost: Calculated as the product of the entry price and entry volume, reflecting the total investment made.
Unrealized Profit: The difference between the current price and the entry price, multiplied by entry volume, indicating profit or loss that has yet to be realized.
Relative Unrealized Profit: Expressed as a percentage of the total cost, showing how much profit or loss exists relative to the initial investment.
Market Value and Realized Value: Market Value is the current price multiplied by entry volume, while Realized Value is the realized price multiplied by entry volume. The MVRV Ratio is obtained by dividing Market Value by Realized Value.
Normalization:
Normalizes both Relative Unrealized Profit and MVRV Ratio to a standardized range of -100 to 100. This involves calculating the minimum and maximum values over a 100-period window to ensure comparability and relevance.
Histogram Calculation:
The histogram is derived from the difference between the normalized Relative Unrealized Profit and the normalized MVRV Ratio. It visually represents the disparity between the two metrics, highlighting potential trading signals.
Plotting and Alerts:
Plots:
Normalized Relative Unrealized Profit (Blue Line): Plotted in blue, this line shows the scaled measure of unrealized profit. Positive values indicate potential gains, while negative values suggest potential losses.
Normalized MVRV Ratio (Red Line): Plotted in red, this line represents the scaled MVRV Ratio. Higher values suggest that the asset’s market value significantly exceeds its realized value, indicating potential overvaluation, while lower values suggest potential undervaluation.
Histogram (Green Bars): Plotted in green, this histogram displays the difference between the normalized Relative Unrealized Profit and the normalized MVRV Ratio. Positive bars indicate that the asset’s profitability is exceeding its market valuation, while negative bars suggest the opposite.
Alerts:
High Histogram Alert: Activated when the histogram value exceeds 50. This condition signals a strong positive divergence, indicating that the asset's profitability is outperforming its market valuation. It may suggest a buying opportunity or indicate that the asset is undervalued relative to its potential profitability.
Low Histogram Alert: Triggered when the histogram value falls below -50. This condition signals a strong negative divergence, indicating that the asset's profitability is lagging behind its market valuation. It may suggest a selling opportunity or indicate that the asset is overvalued relative to its profitability.
How to Use the Indicator:
Setup: Customize the SMA Length, Volume Indicator, and Realized Price Length based on your trading strategy and asset volatility. These parameters allow you to tailor the indicator to different market conditions and asset types.
Interpretation:
Blue Line (Normalized Relative Unrealized Profit): Monitor this line to gauge the profitability of holding the asset. Significant positive values suggest that the asset is currently in a profitable position relative to its purchase price.
Red Line (Normalized MVRV Ratio): Use this line to assess whether the asset is trading at a premium or discount relative to its cost basis. Higher values may indicate overvaluation, while lower values suggest undervaluation.
Green Bars (Histogram): Observe the histogram for deviations between RUP and MVRV Ratio. Large positive bars indicate that the asset's profitability is strong relative to its valuation, signaling potential buying opportunities. Large negative bars suggest that the asset's profitability is weak relative to its valuation, signaling potential selling opportunities.
Trading Strategy:
Bullish Conditions: When the histogram shows large positive values, it suggests that the asset’s profitability is strong compared to its valuation. Consider this as a potential buying signal, especially if the histogram remains consistently positive.
Bearish Conditions: When the histogram displays large negative values, it indicates that the asset’s profitability is weak compared to its valuation. This may signal a potential selling opportunity or caution, particularly if the histogram remains consistently negative.
Why This Indicator is Effective:
Integrated Metrics: Combining Relative Unrealized Profit and MVRV Ratio provides a comprehensive view of asset performance. This integration allows traders to evaluate both profitability and market valuation in one cohesive tool.

Global Financial IndexIntroducing the "Global Financial Index" indicator on TradingView, a meticulously crafted tool derived from extensive research aimed at providing the most comprehensive assessment of a company's financial health, profitability, and valuation. Developed with the discerning trader and investor in mind, this indicator amalgamates a diverse array of financial metrics, meticulously weighted and balanced to yield optimal results.
Financial Strength:
Financial strength is a cornerstone of a company's stability and resilience in the face of economic challenges. It encompasses various metrics that gauge the company's ability to meet its financial obligations, manage its debt, and generate sustainable profits. In our Global Financial Index indicator, the evaluation of financial strength is meticulously crafted to provide investors with a comprehensive understanding of a company's fiscal robustness. Let's delve into the key components and the rationale behind their inclusion:
1. Current Ratio:
The Current Ratio serves as a vital indicator of a company's liquidity position by comparing its current assets to its current liabilities.
A ratio greater than 1 indicates that the company possesses more short-term assets than liabilities, suggesting a healthy liquidity position and the ability to meet short-term obligations promptly.
By including the Current Ratio in our evaluation, we emphasize the importance of liquidity management in sustaining business operations and weathering financial storms.
2. Debt to Equity Ratio:
The Debt to Equity Ratio measures the proportion of a company's debt relative to its equity, reflecting its reliance on debt financing versus equity financing.
A higher ratio signifies higher financial risk due to increased debt burden, potentially leading to liquidity constraints and solvency issues.
Incorporating the Debt to Equity Ratio underscores the significance of balancing debt levels to maintain financial stability and mitigate risk exposure.
3. Interest Coverage Ratio:
The Interest Coverage Ratio assesses a company's ability to service its interest payments with its operating income.
A higher ratio indicates a healthier financial position, as it implies that the company generates sufficient earnings to cover its interest expenses comfortably.
By evaluating the Interest Coverage Ratio, we gauge the company's capacity to manage its debt obligations without compromising its profitability or sustainability.
4. Altman Z-Score:
The Altman Z-Score, developed by Edward Altman, is a composite metric that predicts the likelihood of a company facing financial distress or bankruptcy within a specific timeframe.
It considers multiple financial ratios, including liquidity, profitability, leverage, and solvency, to provide a comprehensive assessment of a company's financial health.
The Altman Z-Score categorizes companies into distinct risk groups, allowing investors to identify potential warning signs and make informed decisions regarding investment or credit exposure.
By integrating the Altman Z-Score, we offer a nuanced perspective on a company's financial viability and resilience in turbulent market conditions.
Profitability Rank:
Profitability rank is a crucial aspect of investment analysis that evaluates a company's ability to generate profits relative to its peers and industry benchmarks. It involves assessing various profitability metrics to gauge the efficiency and effectiveness of a company's operations and management. In our Global Financial Index indicator, the profitability rank segment is meticulously designed to provide investors with a comprehensive understanding of a company's profitability dynamics. Let's delve into the key components and rationale behind their inclusion:
1. Return on Equity (ROE):
Return on Equity measures a company's net income generated relative to its shareholders' equity.
A higher ROE indicates that a company is generating more profits with its shareholders' investment, reflecting efficient capital utilization and strong profitability.
By incorporating ROE, we assess management's ability to generate returns for shareholders and evaluate the overall profitability of the company's operations.
2. Gross Profit Margin:
Gross Profit Margin represents the percentage of revenue retained by a company after accounting for the cost of goods sold (COGS).
A higher gross profit margin indicates that a company is effectively managing its production costs and pricing strategies, leading to greater profitability.
By analyzing gross profit margin, we evaluate a company's pricing power, cost efficiency, and competitive positioning within its industry.
3. Operating Profit Margin:
Operating Profit Margin measures the percentage of revenue that remains after deducting operating expenses, such as salaries, rent, and utilities.
A higher operating profit margin signifies that a company is efficiently managing its operating costs and generating more profit from its core business activities.
By considering operating profit margin, we assess the underlying profitability of a company's operations and its ability to generate sustainable earnings.
4. Net Profit Margin:
Net Profit Margin measures the percentage of revenue that remains as net income after deducting all expenses, including taxes and interest.
A higher net profit margin indicates that a company is effectively managing its expenses and generating greater bottom-line profitability.
By analyzing net profit margin, we evaluate the overall profitability and financial health of a company, taking into account all expenses and income streams.
Valuation Rank:
Valuation rank is a fundamental aspect of investment analysis that assesses the attractiveness of a company's stock price relative to its intrinsic value. It involves evaluating various valuation metrics to determine whether a stock is undervalued, overvalued, or fairly valued compared to its peers and the broader market. In our Global Financial Index indicator, the valuation rank segment is meticulously designed to provide investors with a comprehensive perspective on a company's valuation dynamics. Let's explore the key components and rationale behind their inclusion:
1. Price-to-Earnings (P/E) Ratio:
The Price-to-Earnings ratio is a widely used valuation metric that compares a company's current stock price to its earnings per share (EPS).
A lower P/E ratio may indicate that the stock is undervalued relative to its earnings potential, while a higher ratio may suggest overvaluation.
By incorporating the P/E ratio, we offer insight into market sentiment and investor expectations regarding a company's future earnings growth prospects.
2. Price-to-Book (P/B) Ratio:
The Price-to-Book ratio evaluates a company's market value relative to its book value, which represents its net asset value per share.
A P/B ratio below 1 may indicate that the stock is trading at a discount to its book value, potentially signaling an undervalued opportunity.
Conversely, a P/B ratio above 1 may suggest overvaluation, as investors are paying a premium for the company's assets.
By considering the P/B ratio, we assess the market's perception of a company's tangible asset value and its implications for investment attractiveness.
3. Dividend Yield:
Dividend Yield measures the annual dividend income received from owning a stock relative to its current market price.
A higher dividend yield may indicate that the stock is undervalued or that the company is returning a significant portion of its profits to shareholders.
Conversely, a lower dividend yield may signal overvaluation or a company's focus on reinvesting profits for growth rather than distributing them as dividends.
By analyzing dividend yield, we offer insights into a company's capital allocation strategy and its implications for shareholder returns and valuation.
4. Discounted Cash Flow (DCF) Analysis:
Discounted Cash Flow analysis estimates the present value of a company's future cash flows, taking into account the time value of money.
By discounting projected cash flows back to their present value using an appropriate discount rate, DCF analysis provides a fair value estimate for the company's stock.
Comparing the calculated fair value to the current market price allows investors to assess whether the stock is undervalued, overvalued, or fairly valued.
By integrating DCF analysis, we offer a rigorous framework for valuing stocks based on their underlying cash flow generation potential.
Earnings Transparency:
Mitigating the risk of fraudulent financial reporting is crucial for investors. The indicator incorporates the Beneish M-Score, a robust model designed to detect earnings manipulation or financial irregularities. By evaluating various financial ratios and metrics, this component provides valuable insights into the integrity and transparency of a company's financial statements, aiding investors in mitigating potential risks.
Overall Score:
The pinnacle of the "Global Financial Index" is the Overall Score, a comprehensive amalgamation of financial strength, profitability, valuation, and manipulation risk, further enhanced by the inclusion of the Piotroski F-Score. This holistic score offers investors a succinct assessment of a company's overall health and investment potential, facilitating informed decision-making.
The weighting and balancing of each metric within the indicator have been meticulously calibrated to ensure accuracy and reliability. By amalgamating these diverse metrics, the "Global Financial Index" empowers traders and investors with a powerful tool for evaluating investment opportunities with confidence and precision.
This indicator is provided for informational purposes only and does not constitute financial advice, investment advice, or any other type of advice. The information provided by this indicator should not be relied upon for making investment decisions. Trading and investing in financial markets involves risk, and you should carefully consider your financial situation and consult with a qualified financial advisor before making any investment decisions. Past performance is not necessarily indicative of future results. The creator of this indicator makes no representations or warranties of any kind, express or implied, about the completeness, accuracy, reliability, suitability, or availability with respect to the indicator or the information contained herein. Any reliance you place on such information is therefore strictly at your own risk. By using this indicator, you agree to assume full responsibility for any and all gains and losses, financial, emotional, or otherwise, experienced, suffered, or incurred by you.

Crypto Wallets Profitability & Performance [LuxAlgo]The Crypto Wallets Profitability & Performance indicator provides a comprehensive view of the financial status of cryptocurrency wallets by leveraging on-chain data from IntoTheBlock. It measures the percentage of wallets profiting, losing, or breaking even based on current market prices.
Additionally, it offers performance metrics across different timeframes, enabling traders to better assess market conditions.
This information can be crucial for understanding market sentiment and making informed trading decisions.
🔶 USAGE
🔹 Wallets Profitability
This indicator is designed to help traders and analysts evaluate the profitability of cryptocurrency wallets in real-time. It aggregates data gathered from the blockchain on the number of wallets that are in profit, loss, or breaking even and presents it visually on the chart.
Breaking even line demonstrates how realized gains and losses have changed, while the profit and the loss monitor unrealized gains and losses.
The signal line helps traders by providing a smoothed average and highlighting areas relative to profiting and losing levels. This makes it easier to identify and confirm trading momentum, assess strength, and filter out market noise.
🔹 Profitability Meter
The Profitability Meter is an alternative display that visually represents the percentage of wallets that are profiting, losing, or breaking even.
🔹 Performance
The script provides a view of the financial health of cryptocurrency wallets, showing the percentage of wallets in profit, loss, or breaking even. By combining these metrics with performance data across various timeframes, traders can gain valuable insights into overall wallet performance, assess trend strength, and identify potential market reversals.
🔹 Dashboard
The dashboard presents a consolidated view of key statistics. It allows traders to quickly assess the overall financial health of wallets, monitor trend strength, and gauge market conditions.
🔶 DETAILS
🔹 The Chart Occupation Option
The chart occupation option adjusts the occupation percentage of the chart to balance the visibility of the indicator.
🔹 The Height in Performance Options
Crypto markets often experience significant volatility, leading to rapid and substantial gains or losses. Hence, plotting performance graphs on top of the chart alongside other indicators can result in a cluttered display. The height option allows you to adjust the plotting for balanced visibility, ensuring a clearer and more organized chart.
🔶 SETTINGS
The script offers a range of customizable settings to tailor the analysis to your trading needs.
Chart Occupation %: Adjust the occupation percentage of the chart to balance the visibility of the indicator.
🔹 Profiting Wallets
Profiting Percentage: Toggle to display the percentage of wallets in profit.
Smoothing: Adjust the smoothing period for the profiting percentage line.
Signal Line: Choose a signal line type (SMA, EMA, RMA, or None) to overlay on the profiting percentage.
🔹 Losing Wallets
Losing Percentage: Toggle to display the percentage of wallets in loss.
Smoothing: Adjust the smoothing period for the losing percentage line.
Signal Line: Choose a signal line type (SMA, EMA, RMA, or None) to overlay on the losing percentage.
🔹 Breaking Even Wallets
Breaking-Even Percentage: Toggle to display the percentage of wallets breaking even.
Smoothing: Adjust the smoothing period for the breaking-even percentage line.
🔹 Profitability Meter
Profitability Meter: Enable or disable the meter display, set its width, and adjust the offset.
🔹 Performance
Performance Metrics: Choose the timeframe for performance metrics (Day to Date, Week to Date, etc.).
Height: Adjust the height of the chart visuals to balance the visibility of the indicator.
🔹 Dashboard
Block Profitability Stats: Toggle the display of profitability stats.
Performance Stats: Toggle the display of performance stats.
Dashboard Size and Position: Customize the size and position of the performance dashboard on the chart.
🔶 RELATED SCRIPTS
Market-Sentiment-Technicals
Multi-Chart-Widget

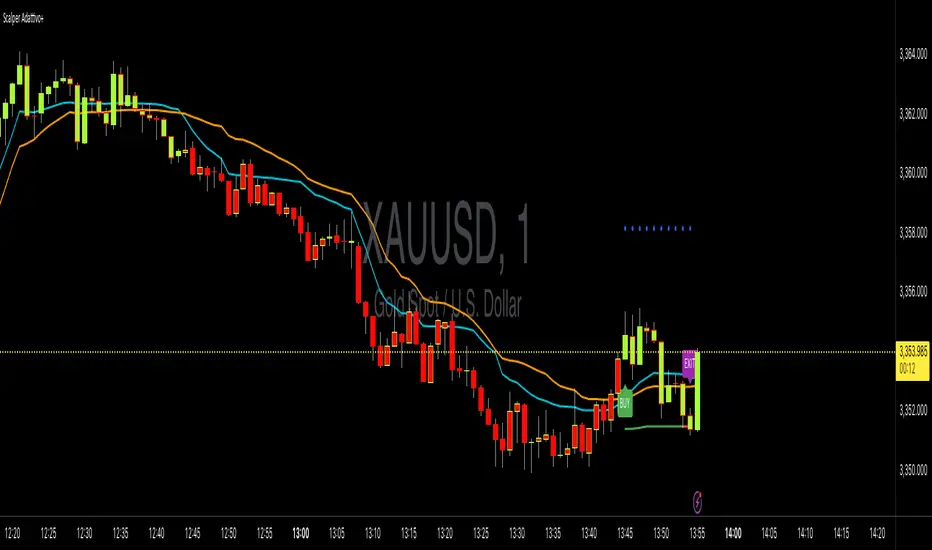
Adaptive Scalping with Take ProfitThis is a comprehensive and adaptive trading system designed specifically for scalping XAUUSD (Gold) on a 3-minute timeframe. Its main feature is that it "adapts" to current market conditions rather than using fixed parameters. It provides clear BUY, SELL, and EXIT signals directly on the chart.
Key Components
1. Adaptive Entry Signal (KAMA)
Instead of using standard moving averages (like EMA or SMA), the entry logic is based on Kaufman's Adaptive Moving Average (KAMA).
How it's adaptive: KAMA automatically adjusts its speed based on market noise. It moves slowly when the market is choppy and sideways, filtering out many false signals. It speeds up when a clear trend emerges, allowing you to enter a move early.
A BUY signal is generated when the faster KAMA crosses above the slower KAMA. A SELL signal is generated on a cross-under.
2. Volatility Filter
The system includes an optional filter that uses the Average True Range (ATR) to measure market volatility.
A trade signal will only appear if the market is volatile enough for scalping. This prevents you from entering trades when the market is flat and there's little opportunity for profit.
3. Dual Exit Strategy (Adaptive)
This is the most advanced part of the system. It gives you two ways to exit a trade to maximize and protect profits:
Dynamic Take Profit: When a trade starts, a profit target (the blue circles) is immediately plotted on the chart. This target is calculated using the ATR, so on a volatile day, the target will be further away. If the price hits this level, it's a signal to take your profits.
ATR Trailing Stop: This is your safety net. It's a stop loss that automatically "trails" behind the price as it moves in your favor (the green/red line). If the market suddenly reverses, the trade is closed when the price hits this trailing stop, locking in any accumulated profit.
An EXIT label appears on the chart as soon as one of these two conditions is met.
4. On-Chart Visuals
BUY/SELL/EXIT Labels: Clear, unmissable labels appear to show you exactly when to enter and exit.
Bar Coloring: The chart candles are colored green when the trend is bullish (fast KAMA > slow KAMA) and red when the trend is bearish, giving you an instant visual confirmation of the market sentiment.
Fundamental Analysis & Economic-Based Stock ValuationFundamental Analysis & Economic-Based Stock Valuation
The Fundamental Analysis & Economic-Based Stock Valuation is a powerful tool designed to give traders and investors a quick, comprehensive overview of a company’s financial health. This horizontal, color-coded table includes live financial data, progress indicators, and smart health insights for informed decision-making. Below are the key financial metrics included in the table:
________________________________________
1. Market Capitalization (Market Cap)
Definition: Market Cap is calculated as the total number of outstanding shares multiplied by the current stock price.
Importance: This gives investors an idea of the company’s size and valuation.
How to Use:
• Large-cap stocks (> $10B) are typically stable, established companies.
• Small- or mid-cap stocks may offer higher growth but come with more volatility.
aiTrendview Feature: Progress bars visually represent the company's size. This helps users quickly gauge whether the stock is a micro-cap, mid-cap, or large-cap investment opportunity.
________________________________________
2. Earnings Yield (%)
Definition: Earnings Yield = (EPS / Price) × 100. It shows how much a company earns relative to its stock price.
Importance: It’s the inverse of the P/E ratio and is used to compare returns from equity with bond yields.
How to Use:
• A yield > 10% may indicate undervaluation.
• Lower yield (< 3%) may indicate an overpriced stock.
aiTrendview Feature: Health indicators like “STRONG”, “FAIR”, or “POOR” and a progress bar help investors assess return potential relative to risk.
________________________________________
3. Price-to-Book Ratio (P/B Ratio)
Definition: P/B Ratio = Market Price / Book Value per Share.
Importance: Measures market valuation relative to the company's net assets.
How to Use:
• A ratio < 1 can mean the stock is undervalued.
• 3 might indicate overvaluation unless justified by high ROE.
aiTrendview Feature: Color-coded health markers show if the company is UNDERVALUED, FAIR, or OVERVALUED, making valuation analysis visual.
________________________________________
4. Price-to-Earnings Ratio (P/E Ratio)
Definition: P/E = Price / Earnings per Share. It tells you how much investors are paying for each unit of earnings.
Importance: One of the most commonly used valuation metrics.
How to Use:
• A low P/E (< 15) might indicate undervaluation.
• High P/E (> 30) could mean overvaluation or growth expectations.
aiTrendview Feature: The health indicator ("CHEAP", "FAIR", "HIGH", "EXPENSIVE") with a visual bar helps judge sentiment and valuation instantly.
________________________________________
5. Price-to-Sales Ratio (P/S Ratio)
Definition: Market Cap / Revenue. Indicates how much investors pay per dollar of sales.
Importance: Useful for valuing companies with low or negative earnings.
How to Use:
• < 2 is attractive in most industries.
• Higher ratios need to be justified by strong growth.
aiTrendview Feature: P/S-based health tags and progress bars help traders decide whether the stock is reasonably priced on revenue.
________________________________________
6. EBITDA (Earnings Before Interest, Taxes, Depreciation & Amortization)
Definition: A measure of a company's core operational profitability.
Importance: Strips out non-operational costs and is used for comparative analysis.
How to Use:
• Positive EBITDA suggests financial strength.
• Compare year-over-year for growth consistency.
aiTrendview Feature: Visual score and health indicator classify profitability status as “PROFIT” or “LOSS”.
________________________________________
7. Total Revenue
Definition: The total income from sales before expenses.
Importance: Indicates the scale of business operations.
How to Use:
• Rising revenue over quarters = growth.
• Compare with competitors for market share insight.
aiTrendview Feature: Categorizes revenue scale as “MICRO”, “SMALL”, “MEDIUM”, or “LARGE” – useful for gauging company tier.
________________________________________
8. Net Income
Definition: Profit after all expenses, taxes, and interest.
Importance: Shows the company’s actual profitability.
How to Use:
• Positive Net Income = healthy bottom line.
• Use for EPS and ROE calculations.
aiTrendview Feature: Margin percentage + status label (“PROFIT” or “LOSS”) instantly convey financial strength.
________________________________________
9. Book Value Per Share (BVPS)
Definition: Total equity divided by the number of outstanding shares.
Importance: Indicates the liquidation value per share.
How to Use:
• Compare with current market price.
• Price < BVPS can mean undervaluation.
aiTrendview Feature: Shows whether the stock is trading at “DISCOUNT” or “PREMIUM” to its actual value.
________________________________________
10. Earnings Per Share (EPS)
Definition: Net income divided by outstanding shares.
Importance: Measures profitability on a per-share basis.
How to Use:
• Key input for valuation and dividend decisions.
• Positive EPS is essential for investment appeal.
aiTrendview Feature: Labeled “PROFIT” or “LOSS” and enhanced with visual status for clarity.
________________________________________
11. Symbol & Exchange Info
Definition: Displays the trading symbol and exchange (e.g., NSE, NYSE).
Importance: Ensures clarity when analyzing or sharing screenshots.
How to Use:
• Useful for verifying ticker and confirming data source.
aiTrendview Feature: Clearly displayed with "LIVE" tag for credibility.
________________________________________
12. Fundamental Health Score
Definition: aiTrendview computes a composite score (0–100) based on 5 core metrics: Net Income, EPS, P/E, P/B, and EBITDA.
Importance: Provides a single summary score to assess the company's overall financial strength.
How to Use:
• Use this as a filter to shortlist strong candidates.
• Score > 80 = “EXCELLENT”; 60–80 = “GOOD”; < 40 = “POOR”.
aiTrendview Feature: A professional horizontal progress bar with color-coded grade makes it visually intuitive.
________________________________________
⚠️ Disclaimer from aiTrendview
The information provided in this Fundamental Analysis dashboard is for educational and informational purposes only. While the data is sourced live and computed dynamically, it should not be interpreted as investment advice. Traders and investors must do their own due diligence and consider risk appetite, macroeconomic factors, and other indicators before making any financial decisions. aiTrendview.com or its affiliates shall not be held liable for any loss arising from the use of this tool. Markets are risky — trade wisely and responsibly.

Yearly Profit BackgroundDescription:
The Yearly Profit Background indicator is a powerful tool designed to help traders quickly visualize the profitability of each calendar year on their charts. By analyzing the annual performance of an asset, this indicator colors the background of each completed year green if the year was profitable (close > open) or red if it resulted in a loss (close < open). This visual representation allows traders to identify long-term trends and historical performance at a glance.
Key Features:
Annual Profit Calculation: Automatically calculates the yearly performance based on the opening price of January 1st and the closing price of December 31st.
Visual Background Coloring: Highlights each completed year with a green (profit) or red (loss) background, making it easy to spot trends.
Customizable Transparency: The background colors are set at 90% transparency, ensuring they don’t obstruct your chart analysis.
Optional Price Plots: Displays the annual opening (blue line) and closing (orange line) prices for additional context.
How to Use:
Add the indicator to your chart.
Observe the background colors for each completed year:
Green: The year was profitable.
Red: The year resulted in a loss.
Use the optional price plots to analyze annual opening and closing levels.
Ideal For:
Long-term investors analyzing historical performance.
Traders looking to identify multi-year trends.
Anyone interested in visualizing annual market cycles.
Why Use This Indicator?
Understanding the annual performance of an asset is crucial for making informed trading decisions. The Yearly Profit Background indicator simplifies this process by providing a clear, visual representation of yearly profitability, helping you spot patterns and trends that might otherwise go unnoticed.

RSI ProfitGuard [CHE]The RSI ProfitGuard Indicator is a comprehensive tool designed to assist traders in making informed decisions by integrating the Relative Strength Index (RSI) with automated Take Profit (TP) and Stop Loss (SL) levels. This indicator enhances trading strategies by providing clear entry signals and risk management parameters.
Key Features
RSIBased Signals: Utilizes RSI crossovers and crossunders to generate trade signals.
Automated TP and SL: Automatically calculates and plots Take Profit and Stop Loss levels based on userdefined methods.
Customizable Trade Types: Supports Long trades, Short trades, or both simultaneously.
Flexible Calculation Methods: Choose between Percentagebased or ATRbased methods for determining TP and SL levels.
Visual Enhancements: Highlights overbought and oversold RSI regions with background colors and marks trade entries with arrows.
Alerts: Provides realtime alerts when TP or SL levels are reached, ensuring timely trade management.
How It Works
1. RSI Calculation: The indicator calculates the RSI value based on the specified length.
2. Trade Signals:
Long Entry: Triggered when RSI crosses above the defined crossover threshold.
Short Entry: Triggered when RSI crosses below the defined crossunder threshold.
3. TP/SL Level Determination:
Percentage Method: Sets TP and SL as a percentage above and below the entry price.
ATR Method: Sets TP and SL based on the Average True Range (ATR), allowing for dynamic adjustments based on market volatility.
4. Visualization: Draws lines and labels on the chart to indicate TP, SL, and entry points.
5. Trade Management: Monitors price movements to determine if TP or SL levels are hit, automatically managing the trade state.
Customization Options
Trade Type Selection: Choose to execute Long trades, Short trades, or both.
RSI Settings:
RSI Length: Defines the period for RSI calculation (default is 14).
Crossover Threshold: RSI level above which a Long entry is signaled (default is 65).
Crossunder Threshold: RSI level below which a Short entry is signaled (default is 35).
Delay Settings: Sets the minimum number of bars between consecutive trade signals to avoid overtrading.
TP/SL Settings:
Method Selection: Choose between Percentage or ATRbased calculations.
Percentage Values: Define the percentage for TP and SL levels.
ATR Settings: Define ATR length and multipliers for TP and SL when using the ATR method.
Visual Settings:
Line Colors and Styles: Customize the appearance of TP, SL, crossover, and crossunder lines.
Transparency: Adjust the transparency of lines for better chart visibility.
Label Offset: Position labels at a specified number of bars to the right for clarity.
Using the Indicator
1. Add to Chart: Apply the RSI ProfitGuard Indicator to your TradingView chart.
2. Configure Settings: Adjust the parameters according to your trading strategy and risk tolerance.
3. Interpret Signals:
Long Entries: Look for green upward arrows indicating potential buy opportunities.
Short Entries: Look for red downward arrows indicating potential sell opportunities.
4. Monitor TP and SL Levels: Observe the plotted lines and labels to manage your trades effectively.
5. Set Up Alerts: Enable alerts to receive notifications when TP or SL levels are reached, ensuring you can act promptly.
Benefits
Enhanced DecisionMaking: Combines RSI signals with clear risk management levels.
Time Efficiency: Automates the calculation and plotting of TP and SL, saving time and reducing manual errors.
Flexibility: Adapts to various trading styles and market conditions through customizable settings.
Risk Management: Helps in defining and adhering to risk parameters, essential for longterm trading success.
Conclusion
The RSI ProfitGuard Indicator is an invaluable tool for traders seeking to integrate technical analysis with automated risk management. Its customizable features and realtime alerts provide a robust framework for executing and managing trades with confidence.
Disclaimer
The content provided with our RSI ProfitGuard Indicator, including all code, scripts, lessons, and materials, is strictly for educational and informational purposes only. It is not intended as, and should not be interpreted as, financial advice, a recommendation to buy or sell, or an offer of any financial product or service.
Key Points:
Educational Purpose:
All strategies, tools, and examples included within the RSI ProfitGuard Indicator are provided solely for illustrative purposes. They are designed to demonstrate coding techniques and the functionality of Pine Script within a trading context.
No Financial Advice:
The RSI ProfitGuard Indicator does not constitute financial advice. Users should not rely on it as a basis for making investment or trading decisions.
Hypothetical Results:
Any results or performance metrics derived from using the RSI ProfitGuard Indicator are purely hypothetical. Past performance is not indicative of future results, and there is no guarantee of profitability.
Risk Disclosure:
Trading and investing involve significant risks, including the potential loss of principal. The RSI ProfitGuard Indicator is not suitable for all persons, and users should be aware of the inherent risks involved in trading.
Professional Consultation:
Before making any trading decisions, it is strongly recommended to consult with a qualified financial professional to fully understand the risks and ensure that such decisions align with your financial situation and goals.
User Responsibility:
By using the RSI ProfitGuard Indicator, you acknowledge and agree that all trading decisions are made solely at your own discretion and risk. The developers and providers of the RSI ProfitGuard Indicator assume no responsibility or liability for any losses or damages resulting from its use.
Additional Notes:
No Guarantees:
There are no guarantees regarding the accuracy, reliability, or completeness of the RSI ProfitGuard Indicator. Users utilize the tool at their own risk.
No Endorsement:
Any mention of third-party products, services, or strategies within the RSI ProfitGuard Indicator does not constitute an endorsement or recommendation.
Updates and Modifications:
The RSI ProfitGuard Indicator may be updated or modified over time. Users are responsible for staying informed about any changes and understanding how they may impact the use of the tool.
Summary
This disclaimer clearly states that the RSI ProfitGuard Indicator is intended for educational purposes and should not be used as financial advice. It highlights the risks associated with trading, the hypothetical nature of any results, and the importance of consulting with a financial professional. Additionally, it emphasizes that users are solely responsible for their trading decisions and any outcomes that result from using the indicator.
Tips for Implementation:
Visibility:
Ensure that this disclaimer is prominently displayed wherever the RSI ProfitGuard Indicator is offered, such as on your website, within the TradingView description, or in any accompanying documentation.
Clarity:
Use clear and concise language to make sure that all users understand the limitations and responsibilities associated with using the indicator.
Legal Review:
Consider having the disclaimer reviewed by a legal professional to ensure that it meets all necessary legal requirements and adequately protects your interests.
Regular Updates:
Periodically review and update the disclaimer to reflect any changes in the indicator's functionality or in relevant laws and regulations.

GKD-C Vulkan Profit [Loxx]Giga Kaleidoscope GKD-C Vulkan Profit is a Confirmation module included in Loxx's "Giga Kaleidoscope Modularized Trading System".
█ GKD-C Vulkan Profit
What is the Vulkan Profit Indicator?
The Vulkan Profit indicator is a trading tool that helps traders identify potential buy and sell signals in financial markets. It uses a combination of short-term and long-term moving averages to gauge the strength of trends and generate trading signals based on the interaction between these averages. The following explores the workings of the Vulkan Profit indicator, focusing on the concepts and calculations it uses to generate trading signals.
At the core of the Vulkan Profit indicator are two sets of moving averages: the short-term and the long-term. The short-term moving averages are calculated using weighted moving averages (WMA) with periods of 3 and 8. These short-term moving averages, referred to as STL1 and STL2, are designed to track the price movements more closely and respond faster to recent price changes.
The long-term moving averages, on the other hand, are calculated using exponential moving averages (EMA) with periods of 18 and 28. These long-term moving averages, referred to as LTL1 and LTL2, provide a smoother representation of the price movements and are less sensitive to recent price fluctuations. They represent the long-term trend in the market.
The buy and sell signals generated by the Vulkan Profit indicator are based on the relationship between the short-term and long-term moving averages. The indicator monitors the crossover between these two sets of moving averages to identify potential trend reversals.
A buy signal is generated when the minimum value of the short-term moving averages (STL1 and STL2) becomes greater than the maximum value of the long-term moving averages (LTL1 and LTL2), and this condition was not met in the previous candle. This scenario indicates that the short-term trend has shifted upwards, crossing above the long-term trend, and could be a sign of a potential bullish reversal.
Conversely, a sell signal is generated when the maximum value of the short-term moving averages (STL1 and STL2) becomes less than the minimum value of the long-term moving averages (LTL1 and LTL2), and this condition was not met in the previous candle. This indicates that the short-term trend has shifted downwards, crossing below the long-term trend, and could be a sign of a potential bearish reversal.
In summary, the Vulkan Profit indicator is a trading tool that uses a combination of short-term and long-term moving averages to identify potential buy and sell signals in financial markets. By monitoring the crossovers between these two sets of moving averages, the indicator provides traders with an easy-to-understand visual representation of the current trend and potential trend reversals. This information can be valuable for traders looking to time their entries and exits in the market and make more informed trading decisions.
Additional Features
This indicator allows you to select from 33 source types. They are as follows:
Close
Open
High
Low
Median
Typical
Weighted
Average
Average Median Body
Trend Biased
Trend Biased (Extreme)
HA Close
HA Open
HA High
HA Low
HA Median
HA Typical
HA Weighted
HA Average
HA Average Median Body
HA Trend Biased
HA Trend Biased (Extreme)
HAB Close
HAB Open
HAB High
HAB Low
HAB Median
HAB Typical
HAB Weighted
HAB Average
HAB Average Median Body
HAB Trend Biased
HAB Trend Biased (Extreme)
What are Heiken Ashi "better" candles?
Heiken Ashi "better" candles are a modified version of the standard Heiken Ashi candles, which are a popular charting technique used in technical analysis. Heiken Ashi candles help traders identify trends and potential reversal points by smoothing out price data and reducing market noise. The "better formula" was proposed by Sebastian Schmidt in an article published by BNP Paribas in Warrants & Zertifikate, a German magazine, in August 2004. The aim of this formula is to further improve the smoothing of the Heiken Ashi chart and enhance its effectiveness in identifying trends and reversals.
Standard Heiken Ashi candles are calculated using the following formulas:
Heiken Ashi Close = (Open + High + Low + Close) / 4
Heiken Ashi Open = (Previous Heiken Ashi Open + Previous Heiken Ashi Close) / 2
Heiken Ashi High = Max (High, Heiken Ashi Open, Heiken Ashi Close)
Heiken Ashi Low = Min (Low, Heiken Ashi Open, Heiken Ashi Close)
The "better formula" modifies the standard Heiken Ashi calculation by incorporating additional smoothing, which can help reduce noise and make it easier to identify trends and reversals. The modified formulas for Heiken Ashi "better" candles are as follows:
Better Heiken Ashi Close = (Open + High + Low + Close) / 4
Better Heiken Ashi Open = (Previous Better Heiken Ashi Open + Previous Better Heiken Ashi Close) / 2
Better Heiken Ashi High = Max (High, Better Heiken Ashi Open, Better Heiken Ashi Close)
Better Heiken Ashi Low = Min (Low, Better Heiken Ashi Open, Better Heiken Ashi Close)
Smoothing Factor = 2 / (N + 1), where N is the chosen period for smoothing
Smoothed Better Heiken Ashi Open = (Better Heiken Ashi Open * Smoothing Factor) + (Previous Smoothed Better Heiken Ashi Open * (1 - Smoothing Factor))
Smoothed Better Heiken Ashi Close = (Better Heiken Ashi Close * Smoothing Factor) + (Previous Smoothed Better Heiken Ashi Close * (1 - Smoothing Factor))
The smoothed Better Heiken Ashi Open and Close values are then used to calculate the smoothed Better Heiken Ashi High and Low values, resulting in "better" candles that provide a clearer representation of the market trend and potential reversal points.
It's important to note that, like any other technical analysis tool, Heiken Ashi "better" candles are not foolproof and should be used in conjunction with other indicators and analysis techniques to make well-informed trading decisions.
Heiken Ashi "better" candles, as mentioned previously, provide a clearer representation of market trends and potential reversal points by reducing noise and smoothing out price data. When using these candles in conjunction with other technical analysis tools and indicators, traders can gain valuable insights into market behavior and make more informed decisions.
To effectively use Heiken Ashi "better" candles in your trading strategy, consider the following tips:
Trend Identification: Heiken Ashi "better" candles can help you identify the prevailing trend in the market. When the majority of the candles are green (or another color, depending on your chart settings) and there are no or few lower wicks, it may indicate a strong uptrend. Conversely, when the majority of the candles are red (or another color) and there are no or few upper wicks, it may signal a strong downtrend.
Trend Reversals: Look for potential trend reversals when a change in the color of the candles occurs, especially when accompanied by longer wicks. For example, if a green candle with a long lower wick is followed by a red candle, it could indicate a bearish reversal. Similarly, a red candle with a long upper wick followed by a green candle may suggest a bullish reversal.
Support and Resistance: You can use Heiken Ashi "better" candles to identify potential support and resistance levels. When the candles are consistently moving in one direction and then suddenly change color with longer wicks, it could indicate the presence of a support or resistance level.
Stop-Loss and Take-Profit: Using Heiken Ashi "better" candles can help you manage risk by determining optimal stop-loss and take-profit levels. For instance, you can place your stop-loss below the low of the most recent green candle in an uptrend or above the high of the most recent red candle in a downtrend.
Confirming Signals: Heiken Ashi "better" candles should be used in conjunction with other technical indicators, such as moving averages, oscillators, or chart patterns, to confirm signals and improve the accuracy of your analysis.
In this implementation, you have the choice of AMA, KAMA, or T3 smoothing. These are as follows:
Kaufman Adaptive Moving Average (KAMA)
The Kaufman Adaptive Moving Average (KAMA) is a type of adaptive moving average used in technical analysis to smooth out price fluctuations and identify trends. The KAMA adjusts its smoothing factor based on the market's volatility, making it more responsive in volatile markets and smoother in calm markets. The KAMA is calculated using three different efficiency ratios that determine the appropriate smoothing factor for the current market conditions. These ratios are based on the noise level of the market, the speed at which the market is moving, and the length of the moving average. The KAMA is a popular choice among traders who prefer to use adaptive indicators to identify trends and potential reversals.
Adaptive Moving Average
The Adaptive Moving Average (AMA) is a type of moving average that adjusts its sensitivity to price movements based on market conditions. It uses a ratio between the current price and the highest and lowest prices over a certain lookback period to determine its level of smoothing. The AMA can help reduce lag and increase responsiveness to changes in trend direction, making it useful for traders who want to follow trends while avoiding false signals. The AMA is calculated by multiplying a smoothing constant with the difference between the current price and the previous AMA value, then adding the result to the previous AMA value.
T3
The T3 moving average is a type of technical indicator used in financial analysis to identify trends in price movements. It is similar to the Exponential Moving Average (EMA) and the Double Exponential Moving Average (DEMA), but uses a different smoothing algorithm.
The T3 moving average is calculated using a series of exponential moving averages that are designed to filter out noise and smooth the data. The resulting smoothed data is then weighted with a non-linear function to produce a final output that is more responsive to changes in trend direction.
The T3 moving average can be customized by adjusting the length of the moving average, as well as the weighting function used to smooth the data. It is commonly used in conjunction with other technical indicators as part of a larger trading strategy.
█ Giga Kaleidoscope Modularized Trading System
Core components of an NNFX algorithmic trading strategy
The NNFX algorithm is built on the principles of trend, momentum, and volatility. There are six core components in the NNFX trading algorithm:
1. Volatility - price volatility; e.g., Average True Range, True Range Double, Close-to-Close, etc.
2. Baseline - a moving average to identify price trend
3. Confirmation 1 - a technical indicator used to identify trends
4. Confirmation 2 - a technical indicator used to identify trends
5. Continuation - a technical indicator used to identify trends
6. Volatility/Volume - a technical indicator used to identify volatility/volume breakouts/breakdown
7. Exit - a technical indicator used to determine when a trend is exhausted
What is Volatility in the NNFX trading system?
In the NNFX (No Nonsense Forex) trading system, ATR (Average True Range) is typically used to measure the volatility of an asset. It is used as a part of the system to help determine the appropriate stop loss and take profit levels for a trade. ATR is calculated by taking the average of the true range values over a specified period.
True range is calculated as the maximum of the following values:
-Current high minus the current low
-Absolute value of the current high minus the previous close
-Absolute value of the current low minus the previous close
ATR is a dynamic indicator that changes with changes in volatility. As volatility increases, the value of ATR increases, and as volatility decreases, the value of ATR decreases. By using ATR in NNFX system, traders can adjust their stop loss and take profit levels according to the volatility of the asset being traded. This helps to ensure that the trade is given enough room to move, while also minimizing potential losses.
Other types of volatility include True Range Double (TRD), Close-to-Close, and Garman-Klass
What is a Baseline indicator?
The baseline is essentially a moving average, and is used to determine the overall direction of the market.
The baseline in the NNFX system is used to filter out trades that are not in line with the long-term trend of the market. The baseline is plotted on the chart along with other indicators, such as the Moving Average (MA), the Relative Strength Index (RSI), and the Average True Range (ATR).
Trades are only taken when the price is in the same direction as the baseline. For example, if the baseline is sloping upwards, only long trades are taken, and if the baseline is sloping downwards, only short trades are taken. This approach helps to ensure that trades are in line with the overall trend of the market, and reduces the risk of entering trades that are likely to fail.
By using a baseline in the NNFX system, traders can have a clear reference point for determining the overall trend of the market, and can make more informed trading decisions. The baseline helps to filter out noise and false signals, and ensures that trades are taken in the direction of the long-term trend.
What is a Confirmation indicator?
Confirmation indicators are technical indicators that are used to confirm the signals generated by primary indicators. Primary indicators are the core indicators used in the NNFX system, such as the Average True Range (ATR), the Moving Average (MA), and the Relative Strength Index (RSI).
The purpose of the confirmation indicators is to reduce false signals and improve the accuracy of the trading system. They are designed to confirm the signals generated by the primary indicators by providing additional information about the strength and direction of the trend.
Some examples of confirmation indicators that may be used in the NNFX system include the Bollinger Bands, the MACD (Moving Average Convergence Divergence), and the MACD Oscillator. These indicators can provide information about the volatility, momentum, and trend strength of the market, and can be used to confirm the signals generated by the primary indicators.
In the NNFX system, confirmation indicators are used in combination with primary indicators and other filters to create a trading system that is robust and reliable. By using multiple indicators to confirm trading signals, the system aims to reduce the risk of false signals and improve the overall profitability of the trades.
What is a Continuation indicator?
In the NNFX (No Nonsense Forex) trading system, a continuation indicator is a technical indicator that is used to confirm a current trend and predict that the trend is likely to continue in the same direction. A continuation indicator is typically used in conjunction with other indicators in the system, such as a baseline indicator, to provide a comprehensive trading strategy.
What is a Volatility/Volume indicator?
Volume indicators, such as the On Balance Volume (OBV), the Chaikin Money Flow (CMF), or the Volume Price Trend (VPT), are used to measure the amount of buying and selling activity in a market. They are based on the trading volume of the market, and can provide information about the strength of the trend. In the NNFX system, volume indicators are used to confirm trading signals generated by the Moving Average and the Relative Strength Index. Volatility indicators include Average Direction Index, Waddah Attar, and Volatility Ratio. In the NNFX trading system, volatility is a proxy for volume and vice versa.
By using volume indicators as confirmation tools, the NNFX trading system aims to reduce the risk of false signals and improve the overall profitability of trades. These indicators can provide additional information about the market that is not captured by the primary indicators, and can help traders to make more informed trading decisions. In addition, volume indicators can be used to identify potential changes in market trends and to confirm the strength of price movements.
What is an Exit indicator?
The exit indicator is used in conjunction with other indicators in the system, such as the Moving Average (MA), the Relative Strength Index (RSI), and the Average True Range (ATR), to provide a comprehensive trading strategy.
The exit indicator in the NNFX system can be any technical indicator that is deemed effective at identifying optimal exit points. Examples of exit indicators that are commonly used include the Parabolic SAR, the Average Directional Index (ADX), and the Chandelier Exit.
The purpose of the exit indicator is to identify when a trend is likely to reverse or when the market conditions have changed, signaling the need to exit a trade. By using an exit indicator, traders can manage their risk and prevent significant losses.
In the NNFX system, the exit indicator is used in conjunction with a stop loss and a take profit order to maximize profits and minimize losses. The stop loss order is used to limit the amount of loss that can be incurred if the trade goes against the trader, while the take profit order is used to lock in profits when the trade is moving in the trader's favor.
Overall, the use of an exit indicator in the NNFX trading system is an important component of a comprehensive trading strategy. It allows traders to manage their risk effectively and improve the profitability of their trades by exiting at the right time.
How does Loxx's GKD (Giga Kaleidoscope Modularized Trading System) implement the NNFX algorithm outlined above?
Loxx's GKD v1.0 system has five types of modules (indicators/strategies). These modules are:
1. GKD-BT - Backtesting module (Volatility, Number 1 in the NNFX algorithm)
2. GKD-B - Baseline module (Baseline and Volatility/Volume, Numbers 1 and 2 in the NNFX algorithm)
3. GKD-C - Confirmation 1/2 and Continuation module (Confirmation 1/2 and Continuation, Numbers 3, 4, and 5 in the NNFX algorithm)
4. GKD-V - Volatility/Volume module (Confirmation 1/2, Number 6 in the NNFX algorithm)
5. GKD-E - Exit module (Exit, Number 7 in the NNFX algorithm)
(additional module types will added in future releases)
Each module interacts with every module by passing data between modules. Data is passed between each module as described below:
GKD-B => GKD-V => GKD-C(1) => GKD-C(2) => GKD-C(Continuation) => GKD-E => GKD-BT
That is, the Baseline indicator passes its data to Volatility/Volume. The Volatility/Volume indicator passes its values to the Confirmation 1 indicator. The Confirmation 1 indicator passes its values to the Confirmation 2 indicator. The Confirmation 2 indicator passes its values to the Continuation indicator. The Continuation indicator passes its values to the Exit indicator, and finally, the Exit indicator passes its values to the Backtest strategy.
This chaining of indicators requires that each module conform to Loxx's GKD protocol, therefore allowing for the testing of every possible combination of technical indicators that make up the six components of the NNFX algorithm.
What does the application of the GKD trading system look like?
Example trading system:
Backtest: Strategy with 1-3 take profits, trailing stop loss, multiple types of PnL volatility, and 2 backtesting styles
Baseline: Hull Moving Average
Volatility/Volume: Hurst Exponent
Confirmation 1: Vulkan Profit as shown on the chart above
Confirmation 2: Williams Percent Range
Continuation: Vulkan Profit
Exit: Rex Oscillator
Each GKD indicator is denoted with a module identifier of either: GKD-BT, GKD-B, GKD-C, GKD-V, or GKD-E. This allows traders to understand to which module each indicator belongs and where each indicator fits into the GKD protocol chain.
Giga Kaleidoscope Modularized Trading System Signals (based on the NNFX algorithm)
Standard Entry
1. GKD-C Confirmation 1 Signal
2. GKD-B Baseline agrees
3. Price is within a range of 0.2x Volatility and 1.0x Volatility of the Goldie Locks Mean
4. GKD-C Confirmation 2 agrees
5. GKD-V Volatility/Volume agrees
Baseline Entry
1. GKD-B Baseline signal
2. GKD-C Confirmation 1 agrees
3. Price is within a range of 0.2x Volatility and 1.0x Volatility of the Goldie Locks Mean
4. GKD-C Confirmation 2 agrees
5. GKD-V Volatility/Volume agrees
6. GKD-C Confirmation 1 signal was less than 7 candles prior
Volatility/Volume Entry
1. GKD-V Volatility/Volume signal
2. GKD-C Confirmation 1 agrees
3. Price is within a range of 0.2x Volatility and 1.0x Volatility of the Goldie Locks Mean
4. GKD-C Confirmation 2 agrees
5. GKD-B Baseline agrees
6. GKD-C Confirmation 1 signal was less than 7 candles prior
Continuation Entry
1. Standard Entry, Baseline Entry, or Pullback; entry triggered previously
2. GKD-B Baseline hasn't crossed since entry signal trigger
3. GKD-C Confirmation Continuation Indicator signals
4. GKD-C Confirmation 1 agrees
5. GKD-B Baseline agrees
6. GKD-C Confirmation 2 agrees
1-Candle Rule Standard Entry
1. GKD-C Confirmation 1 signal
2. GKD-B Baseline agrees
3. Price is within a range of 0.2x Volatility and 1.0x Volatility of the Goldie Locks Mean
Next Candle:
1. Price retraced (Long: close < close or Short: close > close )
2. GKD-B Baseline agrees
3. GKD-C Confirmation 1 agrees
4. GKD-C Confirmation 2 agrees
5. GKD-V Volatility/Volume agrees
1-Candle Rule Baseline Entry
1. GKD-B Baseline signal
2. GKD-C Confirmation 1 agrees
3. Price is within a range of 0.2x Volatility and 1.0x Volatility of the Goldie Locks Mean
4. GKD-C Confirmation 1 signal was less than 7 candles prior
Next Candle:
1. Price retraced (Long: close < close or Short: close > close )
2. GKD-B Baseline agrees
3. GKD-C Confirmation 1 agrees
4. GKD-C Confirmation 2 agrees
5. GKD-V Volatility/Volume Agrees
1-Candle Rule Volatility/Volume Entry
1. GKD-V Volatility/Volume signal
2. GKD-C Confirmation 1 agrees
3. Price is within a range of 0.2x Volatility and 1.0x Volatility of the Goldie Locks Mean
4. GKD-C Confirmation 1 signal was less than 7 candles prior
Next Candle:
1. Price retraced (Long: close < close or Short: close > close)
2. GKD-B Volatility/Volume agrees
3. GKD-C Confirmation 1 agrees
4. GKD-C Confirmation 2 agrees
5. GKD-B Baseline agrees
PullBack Entry
1. GKD-B Baseline signal
2. GKD-C Confirmation 1 agrees
3. Price is beyond 1.0x Volatility of Baseline
Next Candle:
1. Price is within a range of 0.2x Volatility and 1.0x Volatility of the Goldie Locks Mean
2. GKD-C Confirmation 1 agrees
3. GKD-C Confirmation 2 agrees
4. GKD-V Volatility/Volume Agrees
]█ Setting up the GKD
The GKD system involves chaining indicators together. These are the steps to set this up.
Use a GKD-C indicator alone on a chart
1. Inside the GKD-C indicator, change the "Confirmation Type" setting to "Solo Confirmation Simple"
Use a GKD-V indicator alone on a chart
**nothing, it's already useable on the chart without any settings changes
Use a GKD-B indicator alone on a chart
**nothing, it's already useable on the chart without any settings changes
Baseline (Baseline, Backtest)
1. Import the GKD-B Baseline into the GKD-BT Backtest: "Input into Volatility/Volume or Backtest (Baseline testing)"
2. Inside the GKD-BT Backtest, change the setting "Backtest Special" to "Baseline"
Volatility/Volume (Volatility/Volume, Backte st)
1. Inside the GKD-V indicator, change the "Testing Type" setting to "Solo"
2. Inside the GKD-V indicator, change the "Signal Type" setting to "Crossing" (neither traditional nor both can be backtested)
3. Import the GKD-V indicator into the GKD-BT Backtest: "Input into C1 or Backtest"
4. Inside the GKD-BT Backtest, change the setting "Backtest Special" to "Volatility/Volume"
5. Inside the GKD-BT Backtest, a) change the setting "Backtest Type" to "Trading" if using a directional GKD-V indicator; or, b) change the setting "Backtest Type" to "Full" if using a directional or non-directional GKD-V indicator (non-directional GKD-V can only test Longs and Shorts separately)
6. If "Backtest Type" is set to "Full": Inside the GKD-BT Backtest, change the setting "Backtest Side" to "Long" or "Short
7. If "Backtest Type" is set to "Full": To allow the system to open multiple orders at one time so you test all Longs or Shorts, open the GKD-BT Backtest, click the tab "Properties" and then insert a value of something like 10 orders into the "Pyramiding" settings. This will allow 10 orders to be opened at one time which should be enough to catch all possible Longs or Shorts.
Solo Confirmation Simple (Confirmation, Backtest)
1. Inside the GKD-C indicator, change the "Confirmation Type" setting to "Solo Confirmation Simple"
1. Import the GKD-C indicator into the GKD-BT Backtest: "Input into Backtest"
2. Inside the GKD-BT Backtest, change the setting "Backtest Special" to "Solo Confirmation Simple"
Solo Confirmation Complex without Exits (Baseline, Volatility/Volume, Confirmation, Backtest)
1. Inside the GKD-V indicator, change the "Testing Type" setting to "Chained"
2. Import the GKD-B Baseline into the GKD-V indicator: "Input into Volatility/Volume or Backtest (Baseline testing)"
3. Inside the GKD-C indicator, change the "Confirmation Type" setting to "Solo Confirmation Complex"
4. Import the GKD-V indicator into the GKD-C indicator: "Input into C1 or Backtest"
5. Inside the GKD-BT Backtest, change the setting "Backtest Special" to "GKD Full wo/ Exits"
6. Import the GKD-C into the GKD-BT Backtest: "Input into Exit or Backtest"
Solo Confirmation Complex with Exits (Baseline, Volatility/Volume, Confirmation, Exit, Backtest)
1. Inside the GKD-V indicator, change the "Testing Type" setting to "Chained"
2. Import the GKD-B Baseline into the GKD-V indicator: "Input into Volatility/Volume or Backtest (Baseline testing)"
3. Inside the GKD-C indicator, change the "Confirmation Type" setting to "Solo Confirmation Complex"
4. Import the GKD-V indicator into the GKD-C indicator: "Input into C1 or Backtest"
5. Import the GKD-C indicator into the GKD-E indicator: "Input into Exit"
6. Inside the GKD-BT Backtest, change the setting "Backtest Special" to "GKD Full w/ Exits"
7. Import the GKD-E into the GKD-BT Backtest: "Input into Backtest"
Full GKD without Exits (Baseline, Volatility/Volume, Confirmation 1, Confirmation 2, Continuation, Backtest)
1. Inside the GKD-V indicator, change the "Testing Type" setting to "Chained"
2. Import the GKD-B Baseline into the GKD-V indicator: "Input into Volatility/Volume or Backtest (Baseline testing)"
3. Inside the GKD-C 1 indicator, change the "Confirmation Type" setting to "Confirmation 1"
4. Import the GKD-V indicator into the GKD-C 1 indicator: "Input into C1 or Backtest"
5. Inside the GKD-C 2 indicator, change the "Confirmation Type" setting to "Confirmation 2"
6. Import the GKD-C 1 indicator into the GKD-C 2 indicator: "Input into C2"
7. Inside the GKD-C Continuation indicator, change the "Confirmation Type" setting to "Continuation"
8. Inside the GKD-BT Backtest, change the setting "Backtest Special" to "GKD Full wo/ Exits"
9. Import the GKD-E into the GKD-BT Backtest: "Input into Exit or Backtest"
Full GKD with Exits (Baseline, Volatility/Volume, Confirmation 1, Confirmation 2, Continuation, Exit, Backtest)
1. Inside the GKD-V indicator, change the "Testing Type" setting to "Chained"
2. Import the GKD-B Baseline into the GKD-V indicator: "Input into Volatility/Volume or Backtest (Baseline testing)"
3. Inside the GKD-C 1 indicator, change the "Confirmation Type" setting to "Confirmation 1"
4. Import the GKD-V indicator into the GKD-C 1 indicator: "Input into C1 or Backtest"
5. Inside the GKD-C 2 indicator, change the "Confirmation Type" setting to "Confirmation 2"
6. Import the GKD-C 1 indicator into the GKD-C 2 indicator: "Input into C2"
7. Inside the GKD-C Continuation indicator, change the "Confirmation Type" setting to "Continuation"
8. Import the GKD-C Continuation indicator into the GKD-E indicator: "Input into Exit"
9. Inside the GKD-BT Backtest, change the setting "Backtest Special" to "GKD Full w/ Exits"
10. Import the GKD-E into the GKD-BT Backtest: "Input into Backtest"
Baseline + Volatility/Volume (Baseline, Volatility/Volume, Backtest)
1. Inside the GKD-V indicator, change the "Testing Type" setting to "Baseline + Volatility/Volume"
2. Inside the GKD-V indicator, make sure the "Signal Type" setting is set to "Traditional"
3. Import the GKD-B Baseline into the GKD-V indicator: "Input into Volatility/Volume or Backtest (Baseline testing)"
4. Inside the GKD-BT Backtest, change the setting "Backtest Special" to "Baseline + Volatility/Volume"
5. Import the GKD-V into the GKD-BT Backtest: "Input into C1 or Backtest"
6. Inside the GKD-BT Backtest, change the setting "Backtest Type" to "Full". For this backtest, you must test Longs and Shorts separately
7. To allow the system to open multiple orders at one time so you can test all Longs or Shorts, open the GKD-BT Backtest, click the tab "Properties" and then insert a value of something like 10 orders into the "Pyramiding" settings. This will allow 10 orders to be opened at one time which should be enough to catch all possible Longs or Shorts.
Requirements
Inputs
Confirmation 1: GKD-V Volatility / Volume indicator
Confirmation 2: GKD-C Confirmation indicator
Continuation: GKD-C Confirmation indicator
Solo Confirmation Simple: GKD-B Baseline
Solo Confirmation Complex: GKD-V Volatility / Volume indicator
Solo Confirmation Super Complex: GKD-V Volatility / Volume indicator
Stacked 1: None
Stacked 2+: GKD-C, GKD-V, or GKD-B Stacked 1
Outputs
Confirmation 1: GKD-C Confirmation 2 indicator
Confirmation 2: GKD-C Continuation indicator
Continuation: GKD-E Exit indicator
Solo Confirmation Simple: GKD-BT Backtest
Solo Confirmation Complex: GKD-BT Backtest or GKD-E Exit indicator
Solo Confirmation Super Complex: GKD-C Continuation indicator
Stacked 1: GKD-C, GKD-V, or GKD-B Stacked 2+
Stacked 2+: GKD-C, GKD-V, or GKD-B Stacked 2+ or GKD-BT Backtest
Additional features will be added in future releases.

Plutus eXploration Index - PXIGreetings Fellow Traders!
We have developed this simple and easy to use indicator so that all users can benefit from it by:
• Reducing the amount of time spent trading.
• Minimizing the risk of loss.
• Accurate timing on entries and exits.
• Signals are accurate in volatile market conditions.
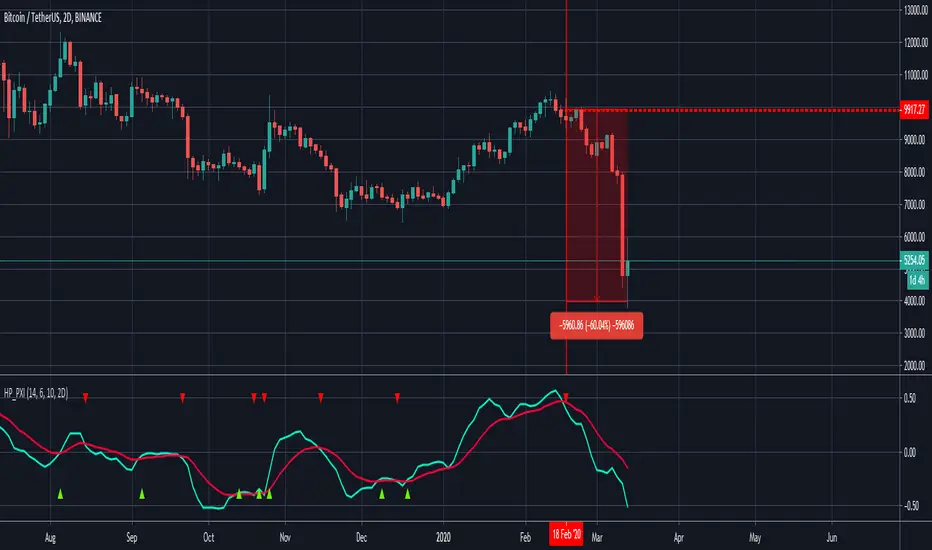
What is the PXI?
The Plutus eXploration Index falls under the centred momentum oscillator category which means that it fluctuates above and below a central point or line. Apex levels exist, where the indicator will reach a peak, and start moving in the opposite direction. Two lines move in unison and crossovers will signal a buy and a sell.
Setting up the indicator:
Once you have received your invite, the indicator will appear under your "my invite only" scripts in trading view detailed charts screen. Select PXI and add it to your chart. For free accounts on TradingView, the indicator limit is set to x3, so please de-activate something if you hit this limit.
You can access the PXI setting in the string of icons that follow after the indicators name in the top left corner of the indicator chart. In order:
Name | Visibility | Settings | Show source code | Delete | More
Under the settings, there are two tabs. One for the style, which you may freely change to suit your preferences. And then the first tab, for Inputs. The default settings for Long Minima, Short Maxima and Integrated EMA should not be changed.
The critical change to make in the input settings is the time frame !
The time frame on the price chart and the time frame on the indicator have to match! The range of allowable time frames is as follows:
15min | 30min | 1h | 4h | 12h | 1d | 2d | 1week
How to use the PXI:
The apex levels on the oscillator differ for each asset and vary depending on the selected time frame. The signals provided near apex points shall hold more weight. We recommend that traders assess these levels properly before considering a position.
Sell signal: Sell signals occur when the quick line (default blue) crosses over the slow line (default orange) from above.
A red arrow down will mark this point in time out on the chart.
Buy signal: Buy signals occur when the quick line (default blue) crosses the slow line (default orange) from bellow.
A green arrow down will mark this point in time out on the chart.
Maximizing Risk/Reward and profitability:
The indicator strives to keep positions open long enough to reap real rewards in the market. Maximum profit levels naturally occur around the apex points on the indicator chart, and the onus is on the trader to attempt an early exit once these levels are achieved.
Addition points to consider:
Most profitable trading signals occur on the daily time frames while considering the duration of trades and timing of the signals. For the lowest risk levels, weekly time frames are most suitable. From the weekly time frame down, the risk increases incrementally until you reach the 15min time frame. Signals at the lower levels occur more often and they are effective but, they should, however, be monitored closely. Also, the lower the time frame, the higher the chances of false-positive signals.
will not be liable for damages of any kind resulting from your use of or inability to use the indicator or content.
Average SL% Calculator with TP Levels by GorkiAverage Stop Loss And Take Profit Calculator For Futures Trading by Gorki
Description
The "Average SL% Calculator with TP Levels" script, is a simple tool for traders to plan the trades and check how much loss they are going to receive if they run this strategy. This script calculates the average price of up to four entry points, determines the percentage distance to the stop-loss level, and provides potential loss information based on margin and leverage. Additionally, it includes multiple take-profit levels to help traders systematically capture profits. Visual elements such as horizontal lines and labels make it easy to monitor key levels directly on the chart.
Why To Use This Indicator?
Risk Management: Automatically calculates the percentage distance to the stop-loss level, helping you to understand potential losses.
Profit Optimization: Supports up to four take-profit levels, enabling a structured approach to capturing gains.
Visual Clarity: Displays key levels and important information directly on the chart for easy monitoring.
Alerts: Generates alerts when the price crosses specified levels, ensuring you never miss critical trading signals.
How to Use the Script
Add the Script to Your Chart: Apply the script to your TradingView chart.
Set Input Values: Entry Points: Define up to four limit prices (LIMIT 1, LIMIT 2, LIMIT 3, LIMIT 4).
Stop-Loss: Set your stop-loss price (STOP LOSS).
Take Profits: Specify up to four take-profit levels (Take Profit 1, Take Profit 2, Take Profit 3, Take Profit 4).
Leverage: Input your leverage factor.
Margin: Enter the total margin amount for the trade.
View Calculations: The script will calculate the average entry price, the percentage distance to the stop-loss, and the potential loss based on margin and leverage.
Monitor Levels: Horizontal lines and labels will appear on the chart, showing entry points, stop-loss, and take-profit levels.
Set Alerts: Alerts will trigger when the price crosses your defined levels, helping you to take timely action.
Calculation Details
Average Price: Calculated as the mean of the specified limit prices.
Distance to Stop-Loss: Determined as the percentage difference between the average price and the stop-loss level.
Leveraged Distance: The stop-loss distance percentage multiplied by the leverage factor.
Potential Loss: Calculated by applying the leveraged distance percentage to the margin amount.
Take Profit Percentages: The percentage difference between the average price and each take-profit level.
This comprehensive indicator is a must-have for any trader looking to manage risks effectively while maximizing potential profits. Happy trading!

GA - Value at RiskGA Value at Risk is a multifunctional tool. Its main purpose is to plot on the chart the Value at Risk . But it shows also integrated features related to the Volatility.
Value at Risk is a measure of the risk of loss for investments, given normal market conditions, in a period.
It measures and quantifies the level of financial risk. In this case, the risk is within position over a specific time frame.
Defining p as VaR, the probability of a loss greater than VaR is p, at most. Instead, the probability of loss that is less than VaR is 1-p, at least.
The VaR Breach occurs when a loss exceeds the VaR threshold .
For this case, VaR calculation uses the volatility estimation in a time interval. It defines the Probability Confidence according to the Normal Distribution. VaR is a percentile of the Normal Distribution. This is a multiplier of the Standard Deviation that define a Volatility Range.
The Normal Distribution Area around +- the Standard Deviation gives 68% of Confidence. 2 times the Standard Deviation returns a 95% of probability area. 3 time the Standard Deviation the Area returns 99.7% of Confidence.
Knowing VaR modeling, it is possible to determine the amount of a potential loss . Then, it is possible to know if there is enough capital to cover losses. In the same way, higher-than-acceptable risks forces reducing exposure in a financial instrument.
One of its practical use is to estimate the risk of an investment that is already at portfolio. Indeed, this is the purpose of the Value at Risk calculated in this script.
At the VaR Breach that investment has reached its worst scenario. Then, it can be the case to manage that investment into the balanced portfolio.
The Value at Risk does not tell when to enter the market.
Moving Averages
GA Value at Risk bases its calculations on a set of Moving Averages. Every feature of the script uses one of these Moving Averages for its algorithm.
Moving Averages from MA0 to MA8, are the core of each feature of the script.
By default, from MA0 to MA8, Moving Averages use the Fibonacci Series to define their lengths. This happens because of the power of the Golden Ratio in the market behavior.
Instead, the first moving average is an extra resource. Its purpose is to plot a Signal Line on the chart.
The script does not consider plotting every Moving Average on the chart. But it lets you enable the plotting of 7 Moving Averages (from MA0 to MA5 + Signal Line).
It is possible to select the Moving Average Formula to use in the script. This is a setting that affects every Moving Average. Then, it changes also the result of every feature of the script.
The selection is between:
Exponential Moving Average.
Simple Moving Average.
Weighted moving Average.
Simple Moving Averages and Pointers - Full Visibility
Moving Averages and Partial Visibility
The plotting of each Moving Average can be total or partial.
By default, the plotting of Moving Averages and Signal Line is partial.
When the price approaches a Moving Average a little part of the curve becomes visible. This highlights supports or resistances.
Besides, this tracking remains on the chart. Then it shows supports and resistances that the price reached during its progression.
The Partial Visibility Algorithm is a great advantage, ruling how to plot curves. It uses a parameter to set how much of the curves is to plot.
Exponential Moving Averages and Pointers - Partial Visibility
Exponential Moving Averages and Pointers - Full Visibility
Moving Averages and Pointers
As it is clear, it is not necessary to plot entire curves of Moving Averages on the chart. But it becomes relevant to plot Pointers to Moving Averages.
Indeed, the script plots horizontal segments that point to the latest Average Prices.
Every segment has a Label that shows Average Price, Length, and its related Moving Average (from MA0 to MA8). Besides, it is possible to extend the segment to right.
These pointers are a very useful automatization. They point to the Moving Averages. In this way, they show Dynamic Supports and Resistances as horizontal segments.
They are adaptive. Used together with the Volume Profile their progression approaches Edges of High Nodes.
This adaptive behavior makes easy to see when the price reaches Volume High Nodes and slows down.
Moving Average Pointers use the Partial Visibility Algorithm. In this case, the algorithm shows pointers with higher frequency than curves.
Moving Averages Pointers have:
Horizontal Segment as a Pointer with Arrow.
Label with details.
Circle to the current Average Price.
Weighted Moving Averages and Pointers - Full Visibility
Volatility Channels
Having Moving Averages, from MA0 to MA8, it is possible to plot 9 Volatility Channels.
Each Volatility Channel uses one of the Moving Averages, from MA0 to MA8.
Indeed, each Volatility Channel has the same designation of the Moving Average used.
The Standard Deviation defines the Volatility Range. It uses the length of the Moving Average related to the Volatility Channel.
The Volatility Range is unique for each Volatility Channel. In the same way, each Volatility Channel is unique because of its relation to only one Moving Average.
By default, each volatility channel has the 2 value as Standard Deviation Multiplier. This gives 95% of Confidence that the price will stay into the Volatility Range.
Using the Simple Moving Average, each Volatility Channel becomes a Bollinger Bands envelop.
Volatility Channels work very well even using Exponential or Weighted Moving Averages.
MA0 - Volatility Channel
Volatility Channels - From MA0 to MA8
Value at Risk (VaR)
GA Value at Risk plots VaR according to the volatility. The VaR plotting follows the Trend Momentum or Buying-Selling Waves.
By default, VaR follows the Trend Momentum by 2 times the Standard Deviation of MA0. Where MA0 is the first Moving Average and Volatility Channel of the set.
Besides, by default, the calculation of the Value at Risk is adaptive. It does not follow the Volatility Channel Bands. But it changes according to the fast reaction of the price into the Volatility Range.
By default, VaR follows the main momentum even if the price is moving in opposition to it. This occurs as long as the Trend Momentum persists.
In the settings box, It is possible to select the following of the latest Buying Wave or Selling Wave.
In this case, VaR changes according to the change of Buying Wave or Selling Wave. This means that, on these conditions, VaR follows main swings. Then it follows the weakening and the strengthening of the trend momentum as long as it persists.
The plotting of the Value at Risk can show these features:
Red cycle to show the Value at Risk at the current price.
Look Back Red Line that shows the progression of the Value at Risk.
Label with details.
MA0 - Value at Risk - Not Adaptive
MA0 - Value at Risk - Adaptive
It is possible to use a different Moving Average and Volatility Channel from the set. This affects the calculation and the plotting of the Value at Risk. In this way, the algorithm return the Value at Risk for the short, middle, or long-term.
Then, you can get the Value at Risk for that Financial Instrument, calculated for ~1 year or more so as for 1 month.
The Value at Risk does not tell you when to enter the market. Besides, it does not show you that the trend is changing.
MA3 - Value at Risk - Adaptive
Value at Profit (VaP)
The Value at Profit has a descriptive purpose. It points the Volatility Band that is opposite to the Value at Risk.
I chose Value at Profit as a designation for this feature. It does not tell you where to exit the market.
But is shows what the price progression is pointing on. This happens following the switching between Volatility Ranges.
The VaP follows the Volatility Band where the price tends to converge.
An outperforming or underperforming price is running faster than the average trend. Then when the price runs enough to converge to the Volatility Band, it is over extended or under extended.
At these conditions, the increased buying or selling pressure affects the price behavior. This slows down the price progression.
The Algorithm behind the Value at Profit is adaptive. Then the pointer jumps up and down the Volatility Bands of the 9 Volatility Channels. This occurs according to the price progression, following the switching between Volatility Ranges.
So, the VaP points a Volatility Band as long as the price can have chances to converges on it. Instead, when the price has chances to exceed the Volatility Band, the VaP points to the next one.
The plotting of the Value at Profit occurs enabling its Label with details.
Value at Profit - MA0 Volatility Channel Upper Band
Value at Profit - MA6 Volatility Channel Upper Band
Price Extension
When the price runs far away from the average trend price, GA Value at Risk can plot the price extension.
It shows the distance in percentage of the price from a Moving Average of the set. This tends to highlight conditions where the price is over or under extended.
An overbought or oversold condition precedes the shortening of the Trust. It is a cause of the hesitation of the price to continue its progression. This includes also Climactic Points and Signs of Dominance.
The Price Extension plotting uses a variation of the Partial Visibility Algorithm. It plots the Price Extension Arrow only when there are specific volatility conditions.
When the Partial Visibility is set to 0, the Price Extension Arrow is always visible on the chart.
The plotting of the Price Extension includes a Label with details.
Over Extension - The Price is Outperforming MA0
Under Extension - The Price is Underperforming MA0
Price Extension Coloring for Bars and Line Chart
GA Value at Risk lets you enable the coloring of vertical charts. Green and Red colors mark the over and under extended price on bars, candle sticks, and also on the Line Chart.
The Price Extension Algorithm colors Bars and Line Chart by a momentum function.
Indeed, the coloring happens following Relative Strength Index or Bollinger Bands %B.
These 2 Momentum functions are different. Indeed, they color the chart according to the purpose of their curves.
Coloring the Line Chart, it is necessary to put on front the script visibility.
Overbought and Oversold Conditions on Line Chart by Bollinger Bands %B
Overbought and Oversold Conditions on Candlesticks Chart by Relative Strength Index
Note: I restrict access to the tool. Use the links in my signature field to gain access to the script. Feel free to send me a PM for any question.
Thank you
Girolamo Aloe
Founder of Profiting Me Finance Analytics
-
Disclaimer
Nobody in Girolamo Aloe websites and trading view profile is a Financial Advisor. Nothing therein is intended to be constructed as Financial Advice. The content on his websites is for information and educational purposes only.
Trading carries high risk. You should not invest money that you cannot afford to lose. Past performance is not an indication of future results.

GA - Comparative Relative StrengthGA - Comparative Relative Strength is an Oscillator. It shows the Relative Strength of a Financial Instrument .
It defines the Relative Strength in relation to Markets, Sectors, Sub-sectors ETFs . Besides, it includes also Currency Indices and the manual selection of Financial Instruments.
Groups of ETFs and Manual Selection
You enable the Group of Financial Instruments that collects the ETF in your interest. Besides, you can enable more that one group. This lets you show Relative Strength Curves related to ETFs of the groups selected.
For example, it can show the Relative Strength related to Market and Sector ETFs. Besides, you can show the Relative Strength related to Sector and Industry ETFs.
The Groups of ETFs are SPDR Categories:
SPDR Core ETFs.
SPDR Select Sector ETFs.
SPDR Industry ETFs.
An extra group includes Currency Indices.
Oscillator around Zero
The Relative Strength of 2 Financial Instruments waves around a borderline. This line is a mean. The GA - Comparative Relative Strength normalizes the curve to the borderline. This makes an Oscillator around Zero.
Upper and Lower Bands
Upper and Lower Bands can follow the full curve. But you can Enable or Disable the visualization of Partial Bands. They follow the curve only for positive waves or for negative waves.
Bands are dynamic levels. Their role is to define where the Relative Strength becomes relevant or normal. When the Relative Strength persists above the Upper Band, Financial Instrument is strong. When the Relative Strength persists below the Lower Band, Financial Instrument is weak.
The Upper and Lower Bands are relevant tools in the decision process to enter the market long or short.
You need to buy Financial Instrument that is outperforming the related market. In the same way, short/sell financial instruments that are under-performing the marketplace.
A Relative Strength that decreases below the Upper Band shows a weakening. A Relative Strength that increases above the Lower Band shows a reinforcement. These indications can precede an eventual change of sentiment of large investors.
Currency Indices
The difficult part is when you want to define the Relative Strength of a Currency Pair. In this case, you can compare a pair with a group of other related pairs. In the same way, you can try to use a Currency Index or a specific calculation.
The use of a Currency Index shows limitations to define the Relative Strength in a proper way.
But an expert trader can define it in different ways so as with different tools. Besides, an expert trader knows the pairs included in the currency index. Moreover, he knows the formula and the weights of the currency pairs included in the index.
The GA - Comparative Relative Strength gives you a collection of Currency Indices. You can enable it and use the Currency Index you need.
Note: I restrict access to the tool.
Regards
Girolamo Aloe
Founder of Profiting Me
------------
Examples
Comparative Relative Strength of APD on SPY (Market Composite Average)
Comparative Relative Strength of APD on XLB Materials Sector
Comparative Relative Strength of ADP on SPY and ADP on XLB

ATR Stop-Loss with Fibonacci Take-Profit [jpkxyz]ATR Stop-Loss with Fibonacci Take-Profit Indicator
This comprehensive indicator combines Average True Range (ATR) volatility analysis with Fibonacci extensions to create dynamic stop-loss and take-profit levels. It's designed to help traders set precise risk management levels and profit targets based on market volatility and mathematical ratios.
Two Operating Modes
Default Mode (Rolling Levels)
In default mode, the indicator continuously plots evolving stop-loss and take-profit levels based on real-time price action. These levels update dynamically as new bars form, creating rolling horizontal lines across the chart. I use this mode primarily to plot the rolling ATR-Level which I use to trail my Stop-Loss into profit.
Characteristics:
Levels recalculate with each new bar
All selected Fibonacci levels display simultaneously
Uses plot() functions with trackprice=true for price tracking
Custom Anchor Mode (Fixed Levels)
This is the primary mode for precision trading. You select a specific timestamp (typically your entry bar), and the indicator locks all calculations to that exact moment, creating fixed horizontal lines that represent your actual trade levels.
Characteristics:
Entry line (blue) marks your anchor point
Stop-loss calculated using ATR from the anchor bar
Fibonacci levels projected from entry-to-stop distance
Lines terminate when price breaks through them
Includes comprehensive alert system
Core Calculation Logic
ATR Stop-Loss Calculation:
Stop Loss = Entry Price ± (ATR × Multiplier)
Long positions: SL = Entry - (ATR × Multiplier)
Short positions: SL = Entry + (ATR × Multiplier)
ATR uses your chosen smoothing method (RMA, SMA, EMA, or WMA)
Default multiplier is 1.5, adjustable to your risk tolerance
Fibonacci Take-Profit Projection:
The distance from entry to stop-loss becomes the base unit (1.0) for Fibonacci extensions:
TP Level = Entry + (Entry-to-SL Distance × Fibonacci Ratio)
Available Fibonacci Levels:
Conservative: 0.618, 1.0, 1.618
Extended: 2.618, 3.618, 4.618
Complete range: 0.0 to 4.764 (23 levels total)
Multi-Timeframe Functionality
One of the indicator's most powerful features is timeframe flexibility. You can analyze on one timeframe while using stop-loss and take-profit calculations from another.
Best Practices:
Identify your entry point on execution timeframe
Enable "Custom Anchor" mode
Set anchor timestamp to your entry bar
Select appropriate analysis timeframe
Choose relevant Fibonacci levels
Enable alerts for automated notifications
Example Scenario:
Analyse trend on 4-hour chart
Execute entry on 5-minute chart for precision
Set custom anchor to your 5-minute entry bar
Configure timeframe setting to "4h" for swing-level targets
Select appropriate Fibonacci Extension levels
Result: Precise entry with larger timeframe risk management
Visual Intelligence System
Line Behaviour in Custom Anchor Mode:
Active levels: Lines extend to the right edge
Hit levels: Lines terminate at the breaking bar
Entry line: Always visible in blue
Stop-loss: Red line, terminates when hit
Take-profits: Green lines (1.618 level in gold for emphasis)
Customisation Options:
Line width (1-4 pixels)
Show/hide individual Fibonacci levels
ATR length and smoothing method
ATR multiplier for stop-loss distance

SMA Strategy Builder: Create & Prove Profitability📄 Pine Script Strategy Description (For Publishing on TradingView)
🎯 Strategy Title:
SMA Strategy Builder: Create & Prove Profitability
✨ Description:
This tool is designed for traders who want to build, customize, and prove their own SMA-based trading strategies. The strategy tracks capital growth in real-time, providing clear evidence of profitability after each trade. Users can adjust key parameters such as SMA period, take profit levels, and initial capital, making it a flexible solution for backtesting and strategy validation.
🔍 Key Features:
✅ SMA-Based Logic:
Core trading logic revolves around the Simple Moving Average (SMA).
SMA period is fully adjustable to suit various trading styles.
🎯 Customizable Take Profit (TP):
User-defined TP percentages per position.
TP line displayed as a Step Line with Breaks for clear segmentation.
Visual 🎯TP label for quick identification of profit targets.
💵 Capital Tracking (Proof of Profitability):
Initial capital is user-defined.
Capital balance updates after each closed trade.
Shows both absolute profit/loss and percentage changes for every position.
Darker green profit labels for better readability and dark red for losses.
📈 Capital Curve (Performance Visualization):
Capital growth curve available (hidden by default, can be enabled via settings).
📏 Dynamic Label Positioning:
Label positions adjust dynamically based on the price range.
Ensures consistent visibility across low and high-priced assets.
⚡ How It Works:
Long Entry:
Triggered when the price crosses above the SMA.
TP level is calculated as a user-defined percentage above the entry price.
Short Entry:
Triggered when the price crosses below the SMA.
TP level is calculated as a user-defined percentage below the entry price.
TP Execution:
Positions close immediately once the TP level is reached (no candle close confirmation needed).
🔔 Alerts:
🟩 Long Signal Alert: When the price crosses above the SMA.
🟥 Short Signal Alert: When the price crosses below the SMA.
🎯 TP Alert: When the TP target is reached.
⚙️ Customization Options:
📅 SMA Period: Choose the moving average period that best fits your strategy.
🎯 Take Profit (%): Adjust TP percentages for flexible risk management.
💵 Initial Capital: Set the starting capital for realistic backtesting.
📈 Capital Curve Toggle: Enable or disable the capital curve to track overall performance.
🌟 Why Use This Tool?
🔧 Flexible Strategy Creation: Adjust core parameters and create tailored SMA-based strategies.
📈 Performance Proof: Capital tracking acts as real proof of profitability after each trade.
🎯 Immediate TP Execution: No waiting for candle closures; profits lock in as soon as targets are hit.
💹 Comprehensive Performance Insights: Percentage-based and absolute capital tracking with dynamic visualization.
🏦 Clean Visual Indicators: Strategy insights made clear with dynamic labeling and adjustable visuals.
⚠️ Disclaimer:
This script is provided for educational and informational purposes only. Trading financial instruments carries risk, and past performance does not guarantee future results. Always perform your own due diligence before making any trading decisions.

HMA Buy Sell Signals - Profit ManagerNote : Settings should be adjusted according to the selected time frame. Try to find the best setting according to the profitability rate
Overall Functionality
This script combines several trading tools to create a comprehensive system for trend analysis, trade execution, and performance tracking. Users can identify market trends using specific moving averages and RSI indicators while managing profit and loss levels automatically.
Trend Detection and Trade Signals
Hull Moving Averages (HMA):
Two HMAs (a faster one and a slower one) are used to determine the market trend.
A buy signal is generated when the faster HMA crosses above the slower HMA.
Conversely, a sell signal is triggered when the faster HMA crosses below the slower one.
Visual Feedback:
Trend lines on the chart change color to reflect the trend direction (e.g., green for upward trends and red for downward trends).
Trade Levels and Management
Entry, Take-Profit, and Stop-Loss Levels:
When the trend shifts upwards, the script calculates entry, take-profit, and stop-loss levels based on the opening price.
Similarly, for downward trends, these levels are determined for short trades.
Commission Tracking:
Each trade includes a commission cost, which is factored into net profit and loss calculations.
Dynamic Labels:
Entry, take-profit, and stop-loss levels are visually marked on the chart for easier tracking.
Performance Tracking
Profit and Loss Tracking:
The script keeps a running total of profits, losses, and commissions for both long and short trades.
It also calculates the net profit after all costs are considered.
Performance Table:
A table is displayed on the chart summarizing:
The number of trades.
Total profit and loss for long and short positions.
Commission costs.
Net profit.
Fractal Support and Resistance
Dynamic Lines:
The script identifies the most recent significant highs and lows using fractals.
It draws support and resistance lines that automatically update as new fractals form.
Simplified Visuals:
The chart always shows the last two support and resistance lines, keeping the visualization clean and focused.
RSI-Based Signals
Overbought and Oversold Levels:
RSI is used to identify overbought (above 80) and oversold (below 20) conditions.
The script generates buy signals at oversold levels and sell signals at overbought levels.
Chart Indicators:
Arrows and labels appear on the chart to highlight these RSI-based opportunities.
Customization
The script allows users to customize key parameters such as:
Moving average lengths for trend detection.
Take-profit and stop-loss percentages.
Timeframes for backtesting.
Starting capital and commission rates.
Conclusion
This script is a versatile tool for traders, combining trend detection, automated trade management, and visual feedback. It simplifies decision-making by providing clear signals and tracking performance metrics, making it suitable for both beginners and experienced traders.
* The most recently drawn fractals represent potential support and resistance levels. If the price aligns with these levels at the time of entering a trade, it may indicate a likelihood of reversal. In such cases, it’s advisable to either avoid entering the trade altogether or proceed with increased caution.

TradeMaster SignalsTrading effectively requires a range of techniques, experience, and expertise. From technical analysis to market fundamentals, traders must navigate multiple factors, including market sentiment and economic conditions. However, traders often find themselves overwhelmed by market noise, making it challenging to filter out distractions and make informed decisions. To address this, we present a powerful indicator package designed to assist traders on their journey to success.
The TradeMaster indicator package encompasses a variety of trading strategies, including the SMC (Supply, Demand, and Price Action) approach, along with many other techniques. By leveraging concepts such as price action trading, support and resistance analysis, supply and demand dynamics, these indicators can empower traders to analyze entry and exit positions with precision. Unlike other forms of technical analysis that produce values or plots based on historical price data, Price Action brings you the facts straight from the source - the current price movements.
The indicator package consists of three powerful indicators that can be used individually or together to maximize trading effectiveness.
⭐ About the Signals Indicator
This indicator offers a unique opportunity for traders to design their own personalized trading strategy. It has a built-in backtesting system, which allows you to thoroughly analyze the performance of your strategy before implementing it in live trading. With the ability to customize and test your strategy using historical data, the Signals indicator empowers you to make data-driven decisions and refine your trading approach.
👉 How does it work?
The Signals indicator provides users with the ability to select trigger conditions and further narrow them down using confirmations.
Conditions are quantitative factors that influence the generation of signals on the chart and in the backtest table. You can enable multiple conditions to create a comprehensive set of criteria for signal generation.
Confirmations, on the other hand, are qualitative factors that selectively filter out conditions based on their alignment with the chosen confirmations. This helps refine the signals and provide more targeted trading opportunities. Multiple confirmations can be enabled to further enhance the precision of the signals.
A well-balanced strategy in the Signals indicator involves carefully selecting a combination of conditions and confirmations to generate accurate trading signals. Finding the right balance between them is crucial for consistent and profitable trading.
To offer even more flexibility, the Signals indicator includes two powerful main functions:
Target Placement System: This feature allows you to set up to 6 targets with a stop loss level and partial exit percentages. You can choose between automatic target creation or manual customization, giving you control over your profit targets.
Exit Strategy: With this feature, you can define your preferred trailing stop strategy, allowing you to implement a systematic approach to exiting trades. By setting appropriate trailing stop levels, you can limit potential losses, while the system secures profits by automatically closing positions partially when certain price targets are reached. This may help you to maintain discipline in your trading and optimize your risk-reward ratio.
With over 30 unique conditions, 10 confirmations, and the deep Target Placement and Exit Strategy systems, the Signals indicator offers a vast array of possibilities. In fact, there are potentially millions of different strategy outputs available for each ticker. Despite its complexity, the script remains lightweight and fast, ensuring smooth performance.
The Signals Backtest table provides a comprehensive overview of your strategy's performance. You can track your current position with all the necessary details, allowing you to monitor your trades effectively and make informed decisions based on the backtest results.
⚠️ WARNING!
Backtest results do not guarantee future performance. Strategies tested on synthetic data may not accurately represent real-world results. Testing should be conducted on charts that reflect actual closing prices.
The indicator displays buy/sell signals intended to support traders' analysis. There are numerous possibilities and combinations available to create your own unique strategies, whether trading with or against the trend or capturing oversold bounces. These are just a few of the many options! Our indicator can easily be tailored to fit your trading strategy.
The settings that influence the signal-generating algorithm play a crucial role in effectively utilizing the signals. We provide users with the flexibility to modify the settings to align with their trading style, while also offering simple adjustment methods using various techniques.
Each method for modifying the signal settings has been designed to meet specific user needs. It is important to understand that one method is not necessarily more accurate than another.
It is essential to understand that signal indications generally serve as trend confirmations, rather than direct entry and exit points. Focusing on the easy use of signal settings and utilizing other functionalities in our toolkit will likely be a better decision than attempting to find the "holy grail" of optimized signal settings and solely relying on following the signals.
⭐ Conclusion
We hold the view that the true path to success is the synergy between the trader and the tool, contrary to the common belief that the tool itself is the sole determinant of profitability. The actual scenario is more nuanced than such an oversimplification. Our aim is to offer useful features that meet the needs of the 21st century and that we actually use.
🛑 Risk Notice:
Everything provided by trademasterindicator – from scripts, tools, and articles to educational materials – is intended solely for educational and informational purposes. Past performance does not assure future returns.