BORSACA TRADERBORSACA TRADER does NOT REPAINT. If the signal occurs it will be forever. Easy and profitable strategy optimized for Crypto, Foreks and Stock Markets...
This indicator gives you Long and Exit signals all timeframes...
BORSACA TRADER is optimized to catch trend movements as soon as possible and maximize profitability.
Strategy tester results. 96% Profitable on BTCUSD Daily scale. Test other markets you want.
WE RELY ON OUR INDICATOR TO THE END. AND WE ASSURE YOU THERE IS NOTHING BETTER THAN THE BORSACA TRADER INDICATOR.
Best regards and happy trading.
Herif's winning strategy option. Check the strategy tester results success than %96
Safe Mode as optional parameter. You can enable this to prevent some riskier trades to happen at the cost of some profitability. Use it if you are more conservative in trading.
Normal Mode signals for Buy and Sell. Trade Mode signals for buy and sell use with support and resistance levels.
Auto Support And Resistance ..
Auto Fibonacci Levels...
BORSACA TRADER indicator is the best option for everybody in financial markets. Check my Profile Page for more information and follow me, like and favorite my indicator and support your positive response and take a message for 10 days trial.
UPDATED PINE SCRIPT V4
Happy trading. Good luck :)
In den Scripts nach "profit" suchen
Borsaca Demo Limited Time OnlyThis indicator does NOT REPAINT. If the signal occurs it will be forever. Easy and profitable strategy optimized for Crypto, Foreks and Stock Markets...
This indicator gives you Long and Exit signals all timeframes...
BORSACA TRADER is optimized to catch trend movements as soon as possible and maximize profitability.
Strategy tester results. 96% Profitable on BTCUSD Daily scale. Test other markets you want.
WE RELY ON OUR INDICATOR TO THE END. AND WE ASSURE YOU THERE IS NOTHING BETTER THAN THE BORSACA TRADER INDICATOR.
Best regards and happy trading.
Herif's winning strategy option. Check the strategy tester results success than %96
Safe Mode as optional parameter. You can enable this to prevent some riskier trades to happen at the cost of some profitability. Use it if you are more conservative in trading.
Normal Mode signals for Buy and Sell. Trade Mode signals for buy and sell use with support and resistance levels.
Auto Support And Resistance ..
Auto Fibonacci Levels...
BORSACA TRADER indicator is the best option for everybody in financial markets. Check my Profile Page for more information and follow me, like and favorite my indicator and support your positive response and take a message for 10 days trial.
Happy trading. Good luck :)

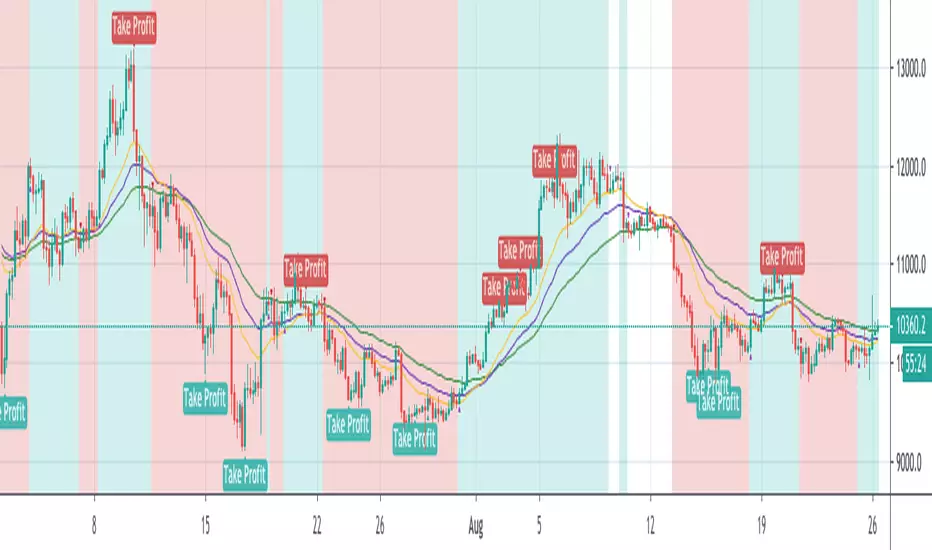
BorsacaThis indicator does NOT REPAINT. If the signal occurs it will be forever. Easy and profitable strategy optimized for Crypto, Foreks and Stock Markets...
This indicator gives you Long and Exit signals all timeframes...
BORSACA TRADER is optimized to catch trend movements as soon as possible and maximize profitability.
Strategy tester results. 96% Profitable on BTCUSD Daily scale. Test other markets you want.
WE RELY ON OUR INDICATOR TO THE END. AND WE ASSURE YOU THERE IS NOTHING BETTER THAN THE BORSACA TRADER INDICATOR.
Best regards and happy trading.
Herif's winning strategy option. Check the strategy tester results success than %96
Safe Mode as optional parameter. You can enable this to prevent some riskier trades to happen at the cost of some profitability. Use it if you are more conservative in trading.
Normal Mode signals for Buy and Sell. Trade Mode signals for buy and sell use with support and resistance levels.
Auto Support And Resistance ..
Auto Fibonacci Levels...
BORSACA TRADER indicator is the best option for everybody in financial markets. Check my Profile Page for more information and follow me, like and favorite my indicator and support your positive response and take a message for 10 days trial.
Happy trading. Good luck :)

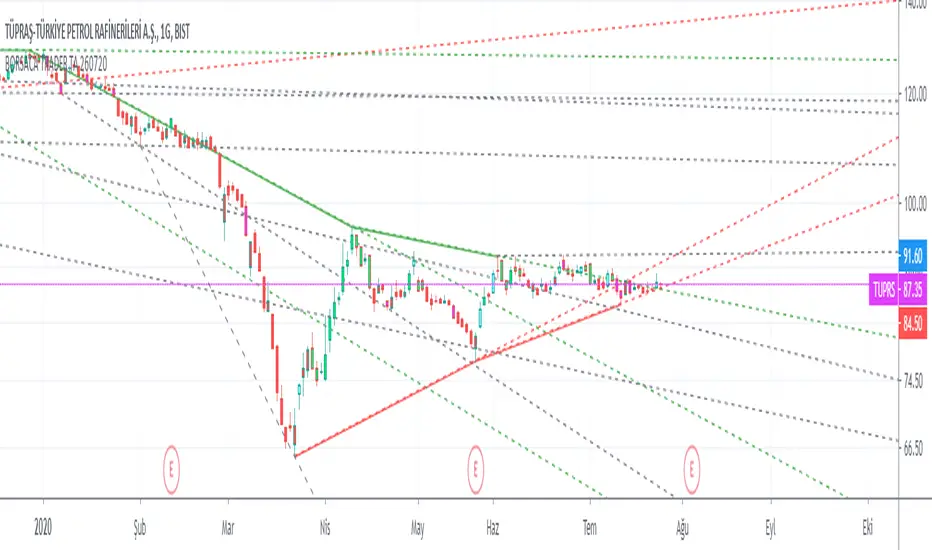
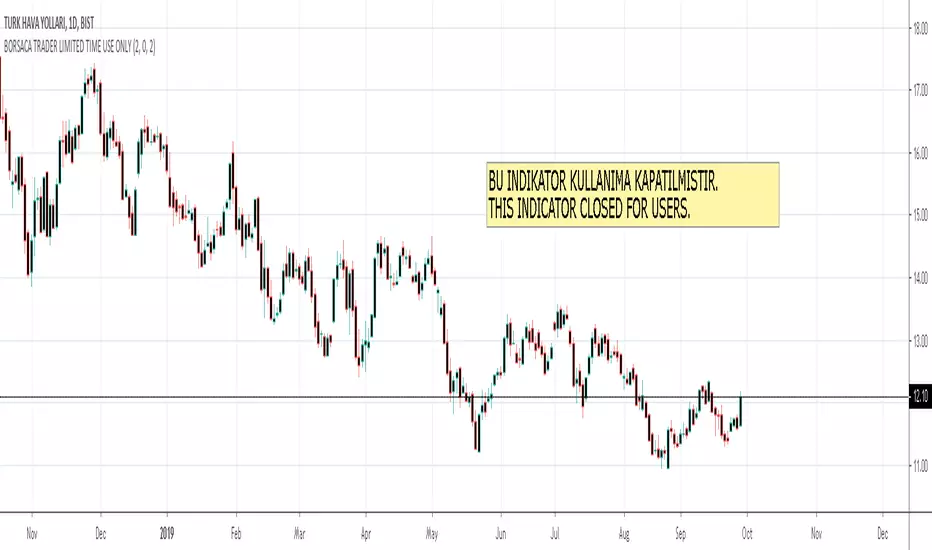
BORSACA TRADER LIMITED TIME USE ONLYThis indicator does NOT REPAINT. If the signal occurs it will be forever. Easy and profitable strategy optimized for Crypto, Foreks and Stock Markets...
This indicator gives you Long and Exit signals all timeframes...
BORSACA TRADER is optimized to catch trend movements as soon as possible and maximize profitability.
Strategy tester results. 96% Profitable on BTCUSD Daily scale. Test other markets you want.
WE RELY ON OUR INDICATOR TO THE END. AND WE ASSURE YOU THERE IS NOTHING BETTER THAN THE BORSACA TRADER INDICATOR.
Best regards and happy trading.
Herif's winning strategy option. Check the strategy tester results success than %96
Safe Mode as optional parameter. You can enable this to prevent some riskier trades to happen at the cost of some profitability. Use it if you are more conservative in trading.
Normal Mode signals for Buy and Sell.
Trade Mode signals for buy and sell use with support and resistance levels.
Auto Support And Resistance..
Auto Fibonacci Levels...
BORSACA TRADER indicator is the best option for everybody in financial markets. Check my Profile Page for more information and follow me, like and favorite my indicator and support your positive response and take a message for 10 days trial.
Happy trading. Good luck :)
PD Crypto Performer PRO (Alert)Description:
This indicator includes two strategies for crypto assets, a trend-identifying swing strategy and a low risk scalping strategy. For decision making, the Performer strategy mainly uses smoothed Simple Moving Averages (SMA) and divergences in Relative Strength Index (RSI), Moving Average Convergence Divergence (MACD), and histogram. A leading indicator (eg. BTCUSD for crypto) is also used for more accurate and timely market identification.
To assist the decision-making process, the code currently references BTCUSD. As a result, it is only suitable for crypto traders. However, we are working on the stock and forex versions, and the Performer will have these compatibilities soon.
Most importantly, our signals DO NOT REPAINT !
Recommended Use:
- Time Frame: 1HR
- Asset: Large cap crypto assets.
For lower risk tolerance, we recommend using the indicator on ETHUSD. For maximizing profits, we recommend using the indicator on BCHUSD.
- Always set stop loss according to your own risk tolerance
- Take profits along the way. Check out this video tutorial for when to reenter after our take profit signals.
Recommended Use for Advanced Traders:
- Position sizing:
Larger position if the 1HR signal is in the same direction compared to the 4HR trend.
Smaller position if the 1HR signal is in the opposite direction compared to the 4HR trend.
- Better entry/exit points:
Track the 1HR signal for the asset you are trading on other exchanges along with the BTCUSD 1HR signal. Sometimes, the signals from different exchanges occur with a 1-2 hour difference. You could use these earlier signals along with a lower time frame (eg. 15min) entry confirmation from your own exchange for better entry / exit points.
- Use “Take Profit” signals for counter trend scalps. Recover at the reentering opportunities . This works best with candlestick pattern confirmations.
Never use this if you suspect a flag / inverted flag pattern is forming.
Go to www.phi-deltalytics.com and sign up for a FREE trial today!
Let us know if you have any questions or recommendations. We are here for your success!
Disclaimer:
It should not be assumed that the methods, techniques, or indicators presented will be profitable or that they will not result in losses. Past results are not necessarily indicative of future results. This is not a solicitation of any order to buy or sell.
Intelligent Exponential Moving Average Private AccessView the full documentation on this indicator here: www.kenzing.com
Note: This indicator is now intended for those who have been granted private access and may be more frequently updated than the previous versions.
Introduction
This indicator uses machine learning (Artificial Intelligence) to solve a real human problem.
The Exponential Moving Average ( EMA ) is one of the most used indicators on the planet, yet no one really knows what pair of exponential moving average lengths works best in combination with each other.
A reason for this is because no two EMA lengths are always going to be the best on every instrument, time-frame, and at any given point in time.
The " Intelligent Exponential Moving Average " solves the moving average problem by adapting the period length to match the most profitable combination of exponential moving averages in real time.
How does the Intelligent Exponential Moving Average work?
The artificial intelligence that operates these moving average lengths was created by an algorithm that tests every single combination across the entire chart history of an instrument for maximum profitability in real-time.
No matter what happens, the combination of these exponential moving averages will be the most profitable.
Can we learn from the Intelligent Moving Average?
There are many lessons to be learned from the Intelligent EMA . Most will come with time as it is still a new concept. Adopting the usefulness of this AI will change how we perceive moving averages to work.
Limitations
Ultimately, there are no limiting factors within the range of combinations that has been programmed. The exponential moving averages will operate normally, but may change lengths in unexpected ways - maybe it knows something we don't?
Thresholds
The range of exponential moving average lengths is between 5 to 40.
Additional coverage resulted in TradingView server errors.
Future Updates!
Soon, I will be publishing tools to test the AI and visualise what moving average combination the AI is currently using.
Follow and like for more content!

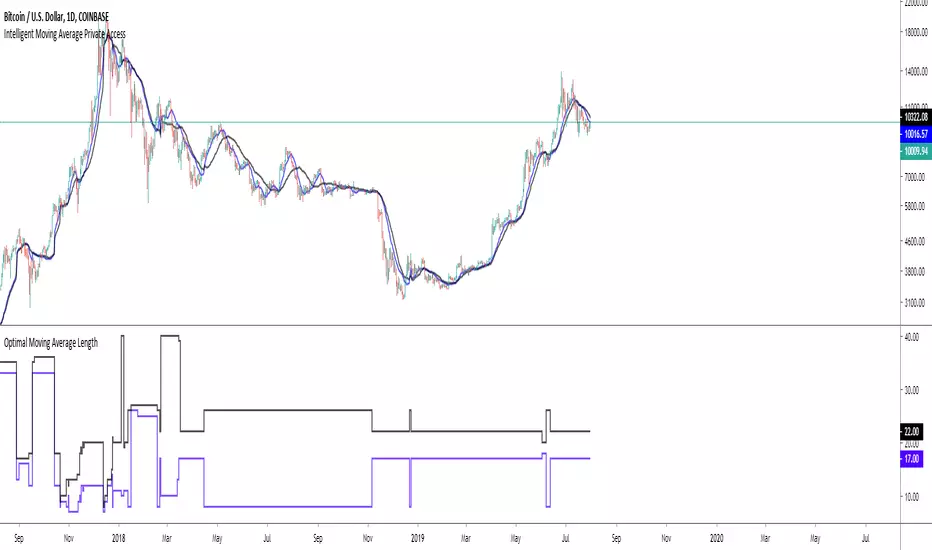
Intelligent Moving Average Private AccessNote: This indicator is intended for those who have been granted private access and may be more frequently updated than the previous versions.
Introduction
This indicator uses machine learning (Artificial Intelligence) to solve a real human problem.
The Moving Average is the most used indicator on the planet, yet no one really knows what pair of moving average lengths works best in combination with each other.
A reason for this is because no two moving averages are always going to be the best on every instrument, time-frame, and at any given point in time.
The " Intelligent Moving Average " solves the moving average problem by adapting the period length to match the most profitable combination of moving averages in real time.
How does the Intelligent Moving Average work?
The artificial intelligence that operates these moving average lengths was created by an algorithm that tests every single combination across the entire chart history of an instrument for maximum profitability in real-time.
No matter what happens, the combination of these moving averages will be the most profitable.
Can we learn from the Intelligent Moving Average?
There are many lessons to be learned from the Intelligent Moving Average. Most will come with time as it is still a new concept.
Adopting the usefulness of this AI will change how we perceive moving averages to work.
Limitations
Ultimately, there are no limiting factors within the range of combinations that has been programmed. The moving averages will operate normally, but may change lengths in unexpected ways - maybe it knows something we don't?
Thresholds
The range of moving average lengths is between 5 to 40.
Additional coverage resulted in TradingView server errors.
Future Updates!
This indicator will be maintained and many updates will come in the near future! Stay tuned.
View the documentation on this indicator here: www.kenzing.com
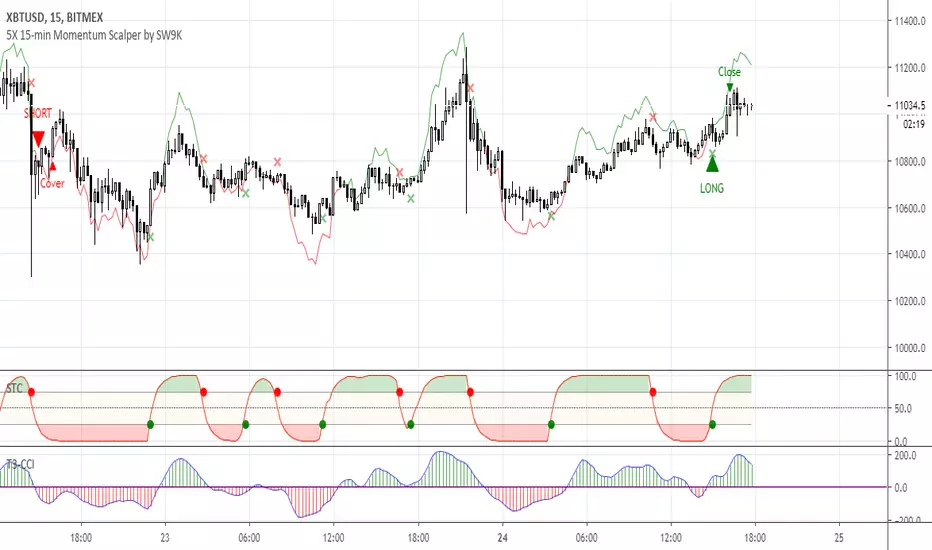
5X 15-min Momentum Scalper by SW9KThis is the alpha release-candidate study script with indicator alerts included. It is currently open for select individuals to test.
The core of this momentum scalper is primarily based on a modified Schaff Trend (which in itself is based on Stochastic elements and MACD) and a modified T3-CCI oscillator, specifically calibrated for 15-minute type movements -- do not apply to any other timeframes. Although it will take small scalps, it is designed to recognize when to ride out underwater positions so use maximum leverage or 5X or you may risk liquidation. Also, there is a stop loss setting feature, but it may reduce profits and win rate.
You can verify the highly accurate 75% win rate performance statistics with 100,000 XBTUSD contracts simulated at .
Features:
40% 3-month net profit, 74.48% win rate, 2.988 profit factor, 3.13% max drawdown, adjusted Sharpe ratio of ~3
Optimized for 15 minute timeframe scalping
Attempts to recognize when to keep position open and ride them out into profitable or breakeven
Profitable even with full Bitmex taker fees (0.075%)
Pyramiding Setting (default 3)
Aggressive Mode to increase entries and potential profits at higher risk
Easy-to-set binary Alerts
Follow SW9K at www.twitter.com
[HTI] Hiubris Trend Indicator 1.4Hiubris Trend Indicator is super easy to use.
The Indicator includes Long and Short signals on chart, based on the current Trend direction - These signals can be also set up as Alerts.
It also includes multiple partial Exit Points (Take Profits) that can be used to lock in the profit you have made - These signals can be also set up as Alerts.
The Take Profits have a custom input that can be adjusted by the user regarding the frequency of the take profits - (The risk involved in each trade)
The indicator has a special Stop Loss feature that activates after a certain custom number of Take Profit points passed, locking down your profits you have made so far - These signals can be also set up as Alerts.
Hiubris Trend Indicator is very profitable on higher timeframes (45min, 2h, 4h) - It can also be used on lower timeframes, together with another HigherTimeframe Trend indicator, acting as a filter for the alerts (Ex: Hiubris Long Term Trend)

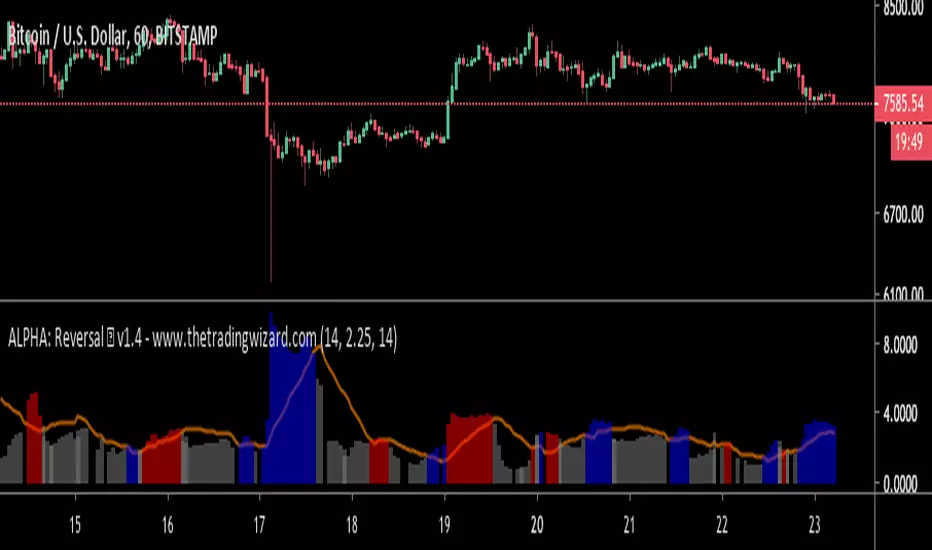
ALPHA: ReversalWhat is a divergence?
In the case of strength and momentum indicators, it is when the price deviates from the movement of the oscillator, it can have significant implications for trade management.
Divergences in an uptrend occurs when the price makes a higher high but the indicator does not. In a downtrend, divergence occurs when the price makes a lower low, but the indicator does not. When a divergence is spotted, there is a higher probability of a price reversal.
Divergences helps the trader recognize and react appropriately to a change in price action. It tells us something is changing and the trader must make a decision, such as tighten the stop-loss or take profit. Seeing divergences increases profitability by alerting the trader to protect profits or open a position.
Divergences indicate that something is changing, but it does not automatically mean the trend will reverse. It signals the trader must consider holding, tightening the stop loss, opening a position or take profit.
Introduction
The Alpha: Reversal is an indicator based off of the Stochastic, Relative Strength Index and Momentum indicator. Its sole purpose is to be able to identify divergences when they matter and identify high probability reversal areas. The formula used between the three indicators will be kept proprietary, in addition to the slight changes made on the Stochastic formula. The indicator plots the histogram with a divergence formula within a 14 period look-back on default. Additionally, there is a moving average of the histograms movement to identify the divergences when they matter.
Divergences exist on just about every candle, most of the time they are at a minuscule level. Rarely do the price and oscillator movement collude, the question becomes when do these divergences matter?
With that in mind I approached the task of finding a reliable reversal model. On default, the indicator has a moving average that measures the past histogram (the formula of the three indicators) movement to identify when a high potential trend shift may happen.
Keeping volatility in mind there is a feature called "Fixed Threshold" in settings. Various assets move at different speeds, so the indicator needs the ability to adjust to fit the assets speed. This "Threshold" option does not have a set of rules to use for each asset, the option is there though, so it may be adjusted by the analyst manually if the histogram moving average seems inaccurate due to volatility or lack thereof. In future publications (or possibly indicator updates) I plan on expanding on a fixed set of rules for various assets. This will take considerable time to research and backtest the various values needed for an asset's speed, so for now the default MA can be used until you are comfortable with adjusting the threshold level manually.
The look-back period on the histogram and threshold MA can be adjusted to whichever time period you would like. However, the default 14 is typically what is best considering the inputs of the three underlying indicators.
Analysis
The indicator is actually quite simple to read. When the price spikes blue, there is a high probability of reversal, same goes for red but in the opposite fashion. Now as always, you should use this indicator as an analysis tool and not rely on it by itself. Many times Cryptocurrencies couldn't care less about strength or oversold/overbought and volume explodes out of nowhere, I highly recommend you use price action in addition to Alpha: Exhaustion and Alpha: Volume with this tool. Oh wait, Alpha: Volume is not out yet.... SOON. :)
Point is, use proper analysis techniques with this indicator, nothing is perfect. NOTHING. But the Alpha: Reversal is a great tool to use for not only the beginner trader, but the advanced also. There is a ton of ways to use this indicator beyond the high probability reversal areas, I am discovering some really neat patterns within my new formula that I plan on expanding on in future publications, i.e. dead cat bounces and relief candles plus a few more.
Conclusion
The Alpha: Reversal is a great analysis tool that I now use on all my charts, as time goes on I plan on holding classes for its users on a regular basis to expand on the various techniques that can be implemented in addition to publishing research relevant to its purpose.
Access to the indicator can be purchased on my site www.thetradingwizard.com with either a monthly option for this & the Alpha: Exhaustion (), or a lifetime subscription independently. All updates and changes will be done automatically and included for every user. The Alpha series is designed to help you make your analysis easier to comprehend and more accurate, I really think this one will be enjoyed by many for years to come, I have enjoyed designing and using this immensely. As always, please make your own decisions when trading and use proper analysis techniques.
Note: The options within the Alpha: Reversal allow the indicator to be used on any timeframe & any asset. As with any indicator, the higher the timeframe, the higher the accuracy.
Disclaimer
Nothing in this post is to be used or construed as financial advice. This post is meant as an educational post to explain the functions of the indicator.
Bold PlotA remarkable algorithm creates entry, re-entry, take profit, safety exit signals. Nothing to set. There is only config code.All signals are being created when new candle opens. Ergo, never repaints. This also helps alarms to be set directly as "once per bar".
Now only for XBTUSD - Bitmex - 2h
Entries: When the algorithm creates an initial entry signal, it also follows the recent trend.
Re-Entries: If the algorithm senses a retracement or correction however the price movement within recent trend, the script creates re-entry signal.
Take Profit: Apart from the main entry algorithm, completely different algorithm has been developed for take profit signals. Expect maximum of 3 take profit signals after each initial entry and re-entries. Maximum of 3 TP signals aim to reach best profit levels rather than contingency.
Safety Exit Signals: Another individual algorithm apart from both entries and take profit signals. If the algorithm senses that the price movement might be in danger opposite to recent position, it creates safety exit signal for only once. This type of signals can also be considered as contingency signals. They can either be a take profit or stop loss. Be aware! This type of signals do not focus on exiting the position completely. They have designed to exit the position 60%-80% and re-enter if the the algorithm creates re-entry signals. There might be take profit signals following the safety exit signals as this situation does not affect take profits.
Current Config Codes:
XBTUSD - Bitmex - 2h / Config Code: 1

Efficient PriceTrading The Movements That Matters
Inspired by the Price Volume Trend indicator the Efficient Price aim to create a better version of the price containing only the information a trend trader must need.
Calculation
This indicator use the Efficiency Ratio as a smoothing constant, it is calculated as follow :
ER = abs(change(close,length))/sum(abs(change(close)),length)
The goal of the Efficiency Ratio is to show if the market is trending or ranging.If ER is high then the market is considered to be trending, if ER is low then the market is considered to be ranging.
Then the Efficient Price is calculated :
EP = cum(change(close)*ER)
When the price is trending, the indicator will show movements of the price with unchanged volatility, but if the price is not trending then the indicator will flatten those movements.Think of this indicator as both a filter and a compressor and the Efficient Price as some kind of threshold.
The Efficient Price As Input For Indicators/Strategies
If the indicator show the movement of the trending price, it can be interesting to use it as input in order to reduce the number of false signals in a strategy.
We will test 2 MACD strategy provided by tradingview, one using the closing price (In Red) and one with the efficient price (In White) as input
with both the following parameters :
fastLength = 50
slowlength = 200
MACDLength = 20
length = 50
Where length is the parameter of the Efficient Price.A spread of 2 pips is used.
Without Efficient Price : 26.88% of profitability, 69 pips of profit.
With Efficient Price : 38.46% of profitability, 336 pips of profit.
The difference of profitability is of 11.58%, the strategy with the Efficient Price made few trades and its equity have a lower variance than the equity of the MACD strategy using closing price.
Smoothed Version
It is possible to smooth the indicator output by using the following code :
EP = cum(change(close,length)*ER)
Hope you enjoy
For any questions/demands feel free to pm me, i would be happy to help you

Intelligent Volume-weighted Moving Average (AI)Introduction
This indicator uses machine learning (Artificial Intelligence) to solve a real human problem.
The volume-weighted moving average (VWMA) is one of the most used indicators on the planet, yet no one really knows what pair of volume-weighted moving average lengths works best in combination with each other. A reason for this is because no two VWMA lengths are always going to be the best on every instrument, time-frame, and at any given point in time.
The "Intelligent Volume-weighted Moving Average" solves the moving average problem by adapting the period length to match the most profitable combination of volume-weighted moving averages in real time.
How does the Intelligent Volume-weighted Moving Average work?
The artificial intelligence that operates these moving average lengths was created by an algorithm that tests every single combination across the entire chart history of an instrument for maximum profitability in real-time.
No matter what happens, the combination of these volume-weighted moving averages will be the most profitable.
Can we learn from the Intelligent Volume-weighted Moving Average?
There are many lessons to be learned from the Intelligent VWMA. Most will come with time as it is still a new concept. Adopting the usefulness of this AI will change how we perceive moving averages to work.
Limitations
This indicator does not change what has already been plotted and does not repaint in any way shape or form which means it is excellent for trading in real-time!
Ultimately, there are no limiting factors within the range of combinations that has been programmed. The volume-weighted moving averages will operate normally, but may change lengths in unexpected ways - maybe it knows something we don't?
Thresholds
The range of VWMA lengths is between 5 to 40.
The black crosses can be turned off in the settings panel.
Test this indicator!
I am also publishing tools that can be used to back-test this indicator and understand what period length is currently being used.
There will be many more updates to come so stay tuned!
Updated documentation and access to this indicator can be found at www.kenzing.com

Intelligent Exponential Moving Average (AI)Introduction
This indicator uses machine learning (Artificial Intelligence) to solve a real human problem.
The Exponential Moving Average (EMA) is one of the most used indicators on the planet, yet no one really knows what pair of exponential moving average lengths works best in combination with each other.
A reason for this is because no two EMA lengths are always going to be the best on every instrument, time-frame, and at any given point in time.
The "Intelligent Exponential Moving Average" solves the moving average problem by adapting the period length to match the most profitable combination of exponential moving averages in real time.
How does the Intelligent Exponential Moving Average work?
The artificial intelligence that operates these moving average lengths was created by an algorithm that tests every single combination across the entire chart history of an instrument for maximum profitability in real-time.
No matter what happens, the combination of these exponential moving averages will be the most profitable.
Can we learn from the Intelligent Moving Average?
There are many lessons to be learned from the Intelligent EMA. Most will come with time as it is still a new concept. Adopting the usefulness of this AI will change how we perceive moving averages to work.
Limitations
Ultimately, there are no limiting factors within the range of combinations that has been programmed. The exponential moving averages will operate normally, but may change lengths in unexpected ways - maybe it knows something we don't?
Thresholds
The range of exponential moving average lengths is between 5 to 40.
Additional coverage resulted in TradingView server errors.
Future Updates!
Soon, I will be publishing tools to test the AI and visualise what moving average combination the AI is currently using.

Intelligent Moving Average (AI)
Introduction
This indicator uses machine learning (Artificial Intelligence) to solve a real human problem.
The Moving Average is the most used indicator on the planet, yet no one really knows what pair of moving average lengths works best in combination with each other.
A reason for this is because no two moving averages are always going to be the best on every instrument, time-frame, and at any given point in time.
The " Intelligent Moving Average " solves the moving average problem by adapting the period length to match the most profitable combination of moving averages in real time.
How does the Intelligent Moving Average work?
The artificial intelligence that operates these moving average lengths was created by an algorithm that tests every single combination across the entire chart history of an instrument for maximum profitability in real-time.
No matter what happens, the combination of these moving averages will be the most profitable.
Can we learn from the Intelligent Moving Average?
There are many lessons to be learned from the Intelligent Moving Average. Most will come with time as it is still a new concept.
Adopting the usefulness of this AI will change how we perceive moving averages to work.
Limitations
Ultimately, there are no limiting factors within the range of combinations that has been programmed. The moving averages will operate normally, but may change lengths in unexpected ways - maybe it knows something we don't?
Thresholds
The range of moving average lengths is between 5 to 40.
Additional coverage resulted in TradingView server errors.
Future Updates!
Soon, I will be publishing tools to test the AI and visualise what moving average combination the AI is currently using.

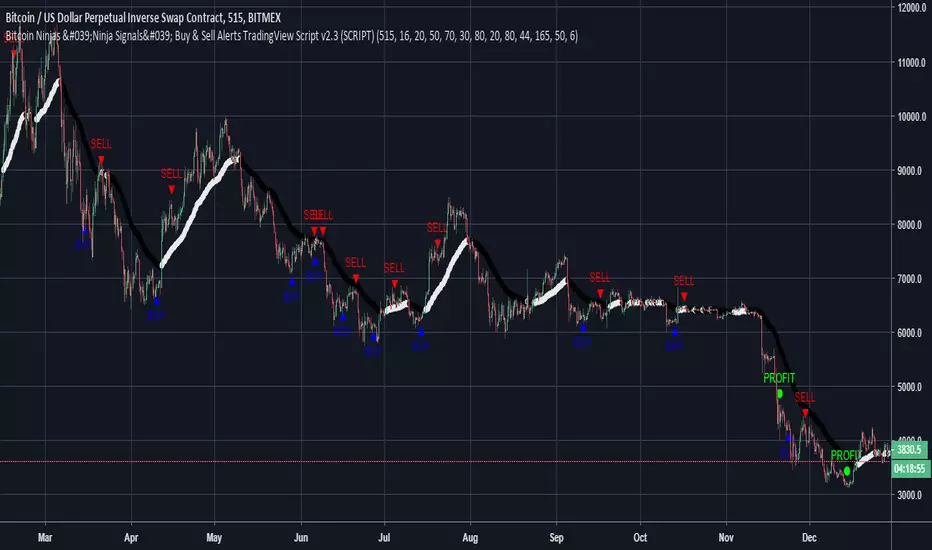
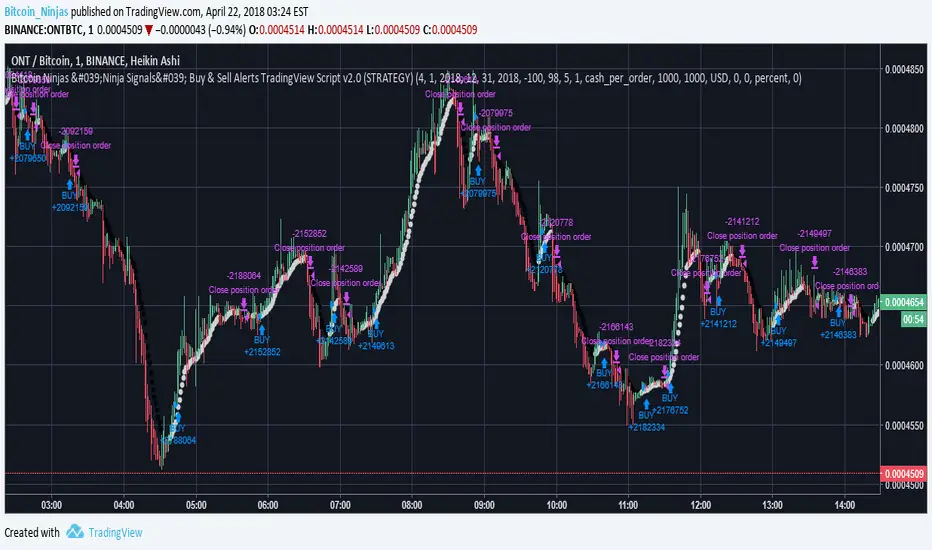
BitcoinNinjas 'Ninja Signals' Buy/Sell Alert Trading Script v3.0Bitcoin Ninjas 'Ninja Signals' Buy/Sell Alerts & Backtesting TradingView Script v3.0
(for Cryptocurrencies, Forex, GunBot, ProfitTrailer, automatic trading software, and more)
This is version 3 of our popular Ninja Signals trading script, which is similar to version 2, but with a new hard-coded calibration (resolution) setting that automatically matches candle size (period) to ensure that no repainting occurs regardless of the number or type of indicators and filters traders apply when configuring the script.
'Ninja Signals' v3.0 (SCRIPT)
'Ninja Signals' v3.0 (STRATEGY)
'Ninja Signals' v2.0 (SCRIPT)
'Ninja Signals' v2.0 (STRATEGY)
'Ninja Signals' v1.0 (SCRIPT)
'Ninja Signals' v1.0 (STRATEGY)
-Allows users to easily set automated buy and sell alerts on TradingView for use with automatic and manual trading of cryptocurrencies, Forex securities, and more (alerts are compatible with automatic trading software such as GunBot, ProfitTrailer, and more).
-Synthesizes many powerful indicators [e.g. Relative Strength Index (RSI), stochastic RSI, Money Flow Index (MFI), Moving Average Convergence Divergence (MACD), etc.) into one super script to generate very precise buy and sell signals in almost any market condition.
-Buy arrows (blue) and sell arrows (red) can be changed or hidden for ease of viewing.
-No lag EMA trendline featuring trend-reversal color-coding (white uptrend, black downtrend).
-Adjustable ‘calibration’ setting allows users to customize the script to work for any currency or security available through TradingView, on any exchange, simply by adjusting a number.
-Complete with backtesting strategy version of script which allows users to test various buy and sell strategies based on the alerts the script generates (see info and screenshots below).
-Backtesting strategy incorporates a user-defined adjustable date range, so users can estimate the script’s performance over specific periods of time, such as the last day, week, or month.
-Backtesting strategy utilizes a minimum protective gain setting to help you never sell for a loss. Simply adjust your minimum profit (%) per trade, and the test results will update.
-Backtesting strategy allows for pyramid buying to test various average down / double up buying strategies. Simply adjust the number of pyramid buys and the quantity of each buy.
- Free 7-day trial available for TradingView users who join our free BitcoinNinjas community.
-Free 24/7 support via BitcoinNinjas Telegram GunBot support group with script purchase.
-Fully compatible with GunBot automatic trading software (TradingView plugin is required).
-Special discount available for traders who purchase GunBot automatic trading software and the GunBot TradingView plugin from BitcoinNinjas, allowing for fully automatic trading.
-Contact us via Email or Telegram for more information, to request additional / custom screenshots, or to start your free trial.
DISCLAIMER: By using our BitcoinNinjas ‘Ninja Signals’ planning script, you agree to the BitcoinNinjas 'Terms of Use', as presented on our website (www.BitcoinNinjas.org) and as stated here. No sharing, copying, reselling, modifying, or any other forms of use are authorized for our documents, script / strategy, and the information published with them. This informational planning script / strategy is strictly for individual use and educational purposes only. This is not financial or investment advice. Investments are always made at your own risk and are based on your personal judgement. Bitcoin Ninjas is not responsible for any losses you may incur. Please invest wisely.

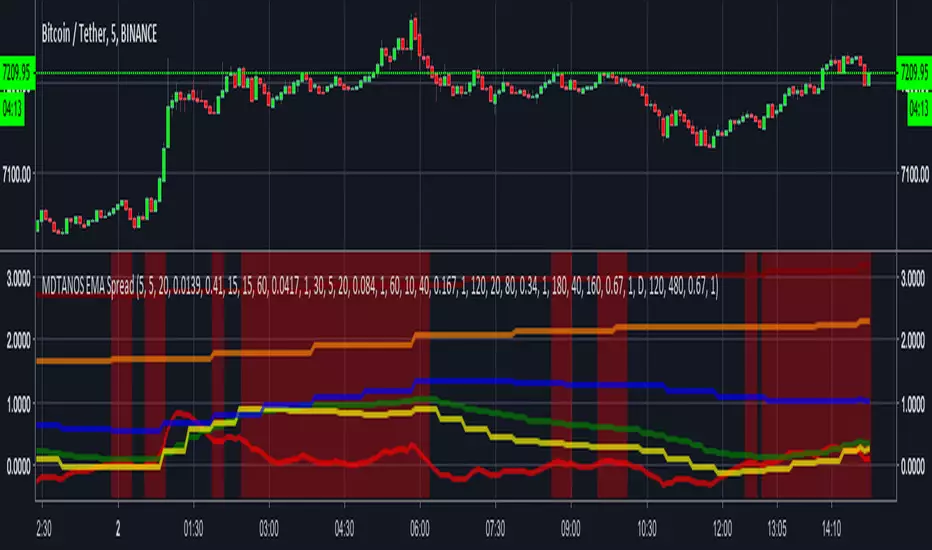
MDTANOS EMA Spread Indicator [v2018-09-01]Built an indicator providing buy / sell signals for MDTANOS from the
ProfitTrailer discord discord.gg as an educational exercise to
show him and the rest of the profit trailer community how to create an indicator
on TradingView using PineScript.
He requested:
i would like to know how to see on tradingview a combination of EMASPREADS
on 5 min and 15 min time frame is it possible?
i have a buy strategy from A to D that combines several time frames
all using EMASPREAD
and the bot buys when all them are true
each of them uses a different time frame
5 min, 15 min, 30 min, 1hour 2 hours 4 hours and 1 day
is there a way to visualize thid condition on tradingview?
Rather than build directly to the requested strategy I made this a
generic and more flexible indicator that can be used and configured
to work on any market, timeframe and trading pair.
Note it is using the timeframes defined for the CandlePeriod parameter
rather than the chart resolution.
I first published the basis of this indicator on the ProfitTrailer discord.
The script uses an EMA spread as its main signal and displays the
spread values as lines on the indicator based on whatever input
criteria you provide.
Based on the buy value and buy limit values it works out buy signals.
The display of the buy signals is optional as displaying them altogether
would not be particularly useful.
This software is provided under a commercial license that grants
personal use only, please refer:
github.com
Copyright (c) 2018, Grant Cause aka CryptoCoyn
BitcoinNinjas Ninja Signals Buy/Sell Alert Trading Script v2.0Bitcoin Ninjas 'Ninja Signals' Buy/Sell Alerts & Backtesting TradingView Script v2.0
(for Cryptocurrencies, Forex, GunBot, ProfitTrailer, automatic trading software, and more)
'Ninja Signals' v2.0 (STRATEGY)
'Ninja Signals' v2.0 (SCRIPT)
'Ninja Signals' v1.0 (STRATEGY)
'Ninja Signals' v1.0 (SCRIPT)
-Allows users to easily set automated buy and sell alerts on TradingView for use with automatic and manual trading of cryptocurrencies, Forex securities, and more (alerts are compatible with automatic trading software such as GunBot, ProfitTrailer, and more).
-Synthesizes many powerful indicators [e.g. Relative Strength Index (RSI), stochastic RSI, Money Flow Index (MFI), Moving Average Convergence Divergence (MACD), etc.) into one super script to generate very precise buy and sell signals in almost any market condition.
-Buy arrows (blue) and sell arrows (red) can be changed or hidden for ease of viewing.
-No lag EMA trendline featuring trend-reversal color-coding (white uptrend, black downtrend).
-Adjustable ‘calibration’ setting allows users to customize the script to work for any currency or security available through TradingView, on any exchange, simply by adjusting a number.
-Complete with backtesting strategy version of script which allows users to test various buy and sell strategies based on the alerts the script generates (see info and screenshots below).
-Backtesting strategy incorporates a user-defined adjustable date range, so users can estimate the script’s performance over specific periods of time, such as the last day, week, or month.
-Backtesting strategy utilizes a minimum protective gain setting to help you never sell for a loss. Simply adjust your minimum profit (%) per trade, and the test results will update.
-Backtesting strategy allows for pyramid buying to test various average down / double up buying strategies. Simply adjust the number of pyramid buys and the quantity of each buy.
- Free 7-day trial available for TradingView users who join our free BitcoinNinjas community.
-Free 24/7 support via BitcoinNinjas Telegram GunBot support group with script purchase.
-Fully compatible with GunBot automatic trading software (TradingView plugin is required).
-Special discount available for traders who purchase GunBot automatic trading software and the GunBot TradingView plugin from BitcoinNinjas, allowing for fully automatic trading.
-Contact us via Email or Telegram for more information, to request additional / custom screenshots, or to start your free trial.
DISCLAIMER: By using this BitcoinNinjas document or ‘Ninja Signals’ planning script, you agree to the BitcoinNinjas 'Terms of Use', as presented on our website (www.BitcoinNinjas.org) and as stated here. No sharing, copying, reselling, modifying, or any other forms of use are authorized for our documents, script / strategy, and the information published with them. This informational document and planning script / strategy is strictly for individual use and educational purposes only. This is not financial or investment advice. Investments are always made at your own risk and are based on your personal judgement. BitcoinNinjas is not responsible for any losses you may incur. Please invest wisely.
BitcoinNinjas Ninja Signals Buy/Sell Alert Trading Strategy v2.0Bitcoin Ninjas 'Ninja Signals' Buy/Sell Alerts & Backtesting TradingView Script v2.0
(for Cryptocurrencies, Forex, GunBot, ProfitTrailer, automatic trading software, and more)
'Ninja Signals' v2.0 (SCRIPT)
'Ninja Signals' v2.0 (STRATEGY)
'Ninja Signals' v1.0 (SCRIPT)
'Ninja Signals' v1.0 (STRATEGY)
-Allows users to easily set automated buy and sell alerts on TradingView for use with automatic and manual trading of cryptocurrencies, Forex securities, and more (alerts are compatible with automatic trading software such as GunBot, ProfitTrailer, and more).
-Synthesizes many powerful indicators [e.g. Relative Strength Index (RSI), stochastic RSI, Money Flow Index (MFI), Moving Average Convergence Divergence (MACD), etc.) into one super script to generate very precise buy and sell signals in almost any market condition.
-Buy arrows (blue) and sell arrows (red) can be changed or hidden for ease of viewing.
-No lag EMA trendline featuring trend-reversal color-coding (white uptrend, black downtrend).
-Adjustable ‘calibration’ setting allows users to customize the script to work for any currency or security available through TradingView, on any exchange, simply by adjusting a number.
-Complete with backtesting strategy version of script which allows users to test various buy and sell strategies based on the alerts the script generates (see info and screenshots below).
-Backtesting strategy incorporates a user-defined adjustable date range, so users can estimate the script’s performance over specific periods of time, such as the last day, week, or month.
-Backtesting strategy utilizes a minimum protective gain setting to help you never sell for a loss. Simply adjust your minimum profit (%) per trade, and the test results will update.
-Backtesting strategy allows for pyramid buying to test various average down / double up buying strategies. Simply adjust the number of pyramid buys and the quantity of each buy.
- Free 7-day trial available for TradingView users who join our free BitcoinNinjas community.
-Free 24/7 support via BitcoinNinjas Telegram GunBot support group with script purchase.
-Fully compatible with GunBot automatic trading software (TradingView plugin is required).
-Special discount available for traders who purchase GunBot automatic trading software and the GunBot TradingView plugin from BitcoinNinjas, allowing for fully automatic trading.
-Contact us via Email or Telegram for more information, to request additional / custom screenshots, or to start your free trial.
DISCLAIMER: By using this BitcoinNinjas document or ‘Ninja Signals’ planning script, you agree to the BitcoinNinjas 'Terms of Use', as presented on our website (www.BitcoinNinjas.org) and as stated here. No sharing, copying, reselling, modifying, or any other forms of use are authorized for our documents, script / strategy, and the information published with them. This informational document and planning script / strategy is strictly for individual use and educational purposes only. This is not financial or investment advice. Investments are always made at your own risk and are based on your personal judgement. BitcoinNinjas is not responsible for any losses you may incur. Please invest wisely.
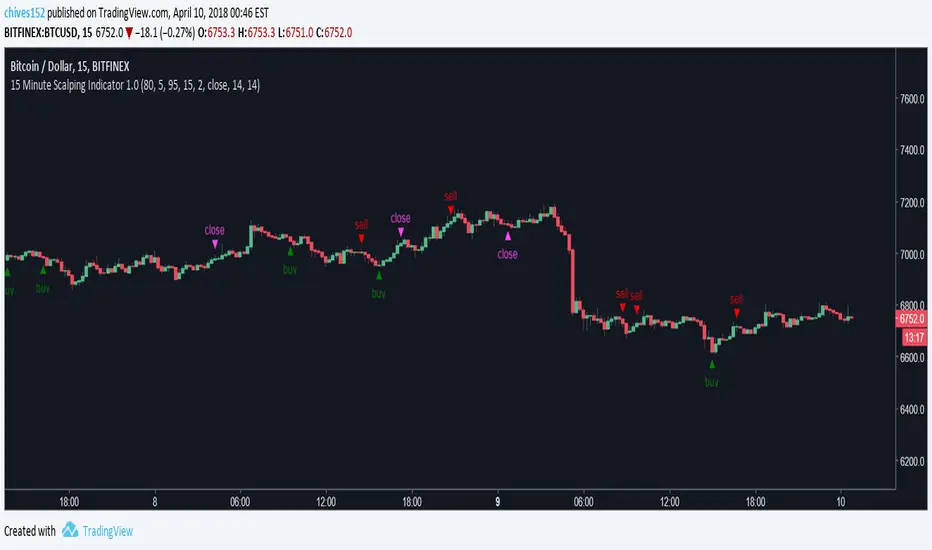
15 Minute Bitcoin Indicator 1.0Indicator Description:
This is a premium indicator that is intended for trading on the 15 minute time scale. This script uses ADX to judge the strength of trends. When a trend is confirmed by ADX, the indicator uses SRSI to find the optimal entry. The indicator works best on BITFINEX:BTCUSD .
Instructions:
Whenever there is a sell signal exit the current long and vice versa. If a close signal appears close the current position but do not open another trade in opposite direction. There is a indicator based stop loss system that is built into the signals, but no static stop loss based on % loss or pips moved in one direction.
Available Settings :
1. Buying and Selling Thresholds: These are the values that are used with SRSI to determine entries. The default values were experimentally determined
to be the most profitable.
2. Stacked Orders Allowed: This limits the amount of positions that can be entered in the same direction. This is useful for trading with leverage. This is defaulted to 2 because I limit myself to 2x leverage. Backtesting shows the more orders allowed, the more profitable, but also risk is increased.
3. ADX/DI Settings: These are settings the ADX smoothing and DI length.
Backtesting:
CLICK HERE
This is a strategy that enters and exits positions on the exact same criteria as this indicator. For the simulation the capital was 10,000 dollars and it was allowed to go up to 2x leverage. Each trade used 100% of available funds. The same simulation done from 1/1/2018 to 4/10/2018 resulted in:
3658.38 % Net Profit
316 Total Closed Trades
77.22 % Profitable
4.552 Profit Factor
24 % Max Drawdown
+11.58% Average Trade
20 15m candles in each trade on average.
Future Plans:
More robust stop loss system.
Factoring trend into trading signals.
EMA integration.
MULTI-TIMEFRAME SUPPORT
Availability
This indicator is currently in a testing stage of development with a full release planned for mid April. While the indicator is not completed, it currently is profitable for me to consider it ready for release. During this testing phase anyone can test it for free for three days, just comment below. Lifetime access currently costs .005 btc, and this price will increase once the full release occurs, if you are interested, DM me for further details.
Please comment with any ideas, suggestions, or criticisms.
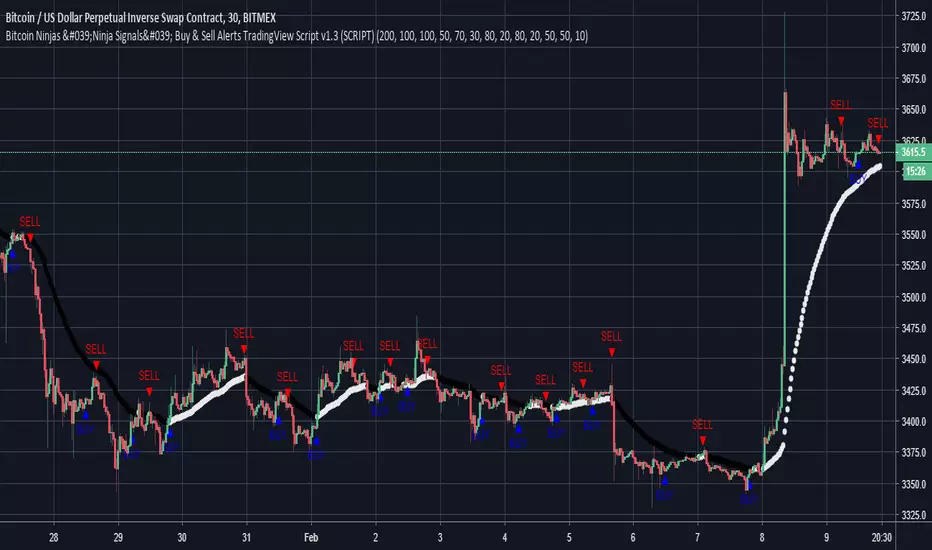
Bitcoin Ninjas 'Ninja Signals' Buy & Sell Alert Trading ScriptBitcoin Ninjas 'Ninja Signals' Buy/Sell Alerts & Backtesting TradingView Script
(for Cryptocurrencies, Forex, GunBot, ProfitTrailer, automatic trading software, and more)
-Allows users to easily set automated buy and sell alerts on TradingView for use with automatic and manual trading of cryptocurrencies, Forex securities, and more (alerts are compatible with automatic trading software such as GunBot, ProfitTrailer, and more).
-Synthesizes many powerful indicators [e.g. Relative Strength Index (RSI), stochastic RSI, Money Flow Index (MFI), Moving Average Convergence Divergence (MACD), etc.) into one super script to generate very precise buy and sell signals in almost any market condition.
-Buy arrows (blue) and sell arrows (red) can be changed or hidden for ease of viewing.
-No lag EMA trendline featuring trend-reversal color-coding (white uptrend, black downtrend).
-Adjustable ‘calibration’ setting allows users to customize the script to work for any currency or security available through TradingView, on any exchange, simply by adjusting a number.
-Complete with backtesting strategy version of script which allows users to test various buy and sell strategies based on the alerts the script generates (see info and screenshots below).
-Backtesting strategy incorporates a user-defined adjustable date range, so users can estimate the script’s performance over specific periods of time, such as the last day, week, or month.
-Backtesting strategy utilizes a minimum protective gain setting to help you never sell for a loss. Simply adjust your minimum profit (%) per trade, and the test results will update.
-Backtesting strategy allows for pyramid buying to test various average down / double up buying strategies. Simply adjust the number of pyramid buys and the quantity of each buy.
-Free 7-day trial available for TradingView users who join our free BitcoinNinjas community.
-Free 24/7 support via BitcoinNinjas Telegram GunBot support group with script purchase.
-Fully compatible with GunBot automatic trading software (TradingView plugin is required).
-Special discount available for traders who purchase GunBot automatic trading software and the GunBot TradingView plugin from BitcoinNinjas, allowing for fully automatic trading.
-Contact us for more information, to request additional / custom screenshots, or to start your free trial.
DISCLAIMER: By viewing and/or using this TradingView script, you agree to the BitcoinNinjas 'Terms of Use', as presented on our website and as stated here. No sharing, copying, reselling, modifying, or any other forms of use, are authorized for this document. This document is strictly for individual use and informational purposes only. This is not financial or investment advice. Investments are always made at your own risk, and are ba
Opening Power Bar Strategy (Trade Your Edge)💎 GENERAL OVERVIEW:
The Opening Power Bar Strategy indicator identifies high-momentum “Power Bars” during the first 60 minutes of the New York session and generates Long/Short signals using levels from the pre-market session. The indicator plots Stop-Loss and three Take-Profit levels, manages dynamic trailing stop-loss logic (optional), displays pre-market levels, and supports alerts.
This indicator was developed by Flux Charts in collaboration with Steven Adams (Trade Your Edge).
🔹What is the purpose of the Opening Power Bar Strategy?:
The purpose of the Opening Power Bar Strategy is to trade the most active and meaningful part of the trading day, the opening move. It’s designed to take advantage of the volume and volatility that happens right after the market opens, when traders react to overnight news and pre-market movement. The indicator helps identify when that early move has real strength by looking for a large, decisive candle (a Power Bar) forming around key pre-market levels. Once it detects one, it builds a full trade plan automatically with entry, stop-loss, and take-profits.
🔹Why are signals only during the first 60 minutes?:
Most of the day’s total trading volume happens within the first 60 minutes after the market opens. This period usually sets the high or low of the day and defines the bias: whether the market will trend or stay in a range. After this first hour, volume and volatility typically decrease, and price movement becomes less consistent.
🔹What’s the theory behind the Opening Power Bar Strategy?:
The Opening Power Bar Strategy is built on a simple principle: the first hour after the market open sets the tone for the rest of the day. This period consistently shows the highest trading volume, as traders react to overnight news, economic data releases, pre-market movements, etc.
These early reactions often establish the day’s high/low, revealing where buyers or sellers are strongest. When a large, decisive candle (a Power Bar) forms during this time near the pre-market high or low, it confirms that one side is taking control. The pre-market high and low define the range that institutions and short-term traders had already reacted to before the market open. Thus, when a Power Bar forms near one of these levels during the first hour, it often marks the start of a breakout or rejection that shapes the rest of the session.
🎯 OPENING POWER BAR STRATEGY FEATURES:
The Opening Power Bar Strategy indicator includes 5 main features:
Power Bars
Pre-Market High / Low / Mid Levels
Long / Short Signals + Risk Management
Simple Moving Average (SMA)
Alerts
1️⃣ Power Bars:
🔹What are Power Bars?:
Power Bars are large, high-momentum candles that show strength in one direction of the market. They form when a candle’s body (the distance between open and close) dominates most of the candle’s total range (the distance between high and low), meaning price moved strongly in one direction with little to no pullback. To qualify, the candle must also be large relative to nearby candles. This size difference confirms that the candle is a true burst of momentum. In short, Power Bars reveal where real strength has just entered the market and where momentum is most likely to continue.
🔹How to interpret and use Power Bars:
When a Power Bar forms, it signals that price just made a strong directional move with little to no pullback. Traders can use these bars to identify momentum shifts and potential trade setups during the opening session.
A bullish Power Bar means buyers controlled the entire candle, often marking the start of upward momentum. A bearish Power Bar means sellers were in control the entire candle, often signaling the start of downwards momentum. In the Opening Power Bar Strategy, these candles are only used for signals when they appear within the pre-market high and low range. Their location relative to the pre-market midline determines direction bias:
Bullish Power Bars forming near the pre-market low can signal potential long opportunities.
Bearish Power Bars forming near the pre-market high can signal potential short opportunities.
🔹How are Power Bars identified?:
Power Bars are detected and confirmed only after the candle closes, ensuring that the full candlestick body and range can be measured. The indicator does not repaint or change past bars. Once a Power Bar is confirmed, it stays fixed on the chart. Power Bars can be detected on any timeframe or symbol that produces standard candlestick data. However, since the Opening Power Bar Strategy focuses on the first 60 minutes of the trading session, they’re most meaningful on lower intraday timeframes such as 1-minute to 5-minute charts.
The indicator identifies Power Bars using two user-defined inputs: Sensitivity and Body %.
🔹Sensitivity:
The Sensitivity setting determines how large a candle’s body must be relative to nearby candles. It uses the Average True Range (ATR) to compare the current candle’s size with recent candles, and the Sensitivity value acts as a multiplier of that ATR. A higher Sensitivity value means the candle must be much larger than recent candles to qualify, so fewer Power Bars will form. A lower value makes the filter less strict, allowing more candles to qualify.
🔹Body %:
The Body % setting controls what percentage of the candle’s total range must be body rather than Wick. A higher value requires the body to take up more of the candle’s total range, so fewer candles pass the filter. A lower value allows candles with more wick to qualify, so more Power Bars will form.
Body % Example:
If Body % is set to 50, the candle body must cover at least half of the candle’s total range. For example, if a candle’s high is $11, its low is $10, its open is $10.20, and its close is $10.80, then the total range is $1 ($11 - $10) and the body is $0.60 ($10.80 - $10.20). Body % = (Body / Total Range) * 100 = (0.60 ÷ 1.00 × 100) = 60%. Since 60% is greater than the input of 50%, this candle passes the Body % criteria.
Once a candlestick closes and it meets both the Sensitivity and Body % requirements, it will be plotted in a different color, using barcolor() function. Users can adjust the bullish/bearish colors of Power Bars by adjusting the ‘Candle Coloring’ setting. The Power Bar candle coloring is purely visual and does not affect signal logic or strategy calculations.
🔹Do Power Bars form outside the first 60 minutes?:
Power Bars can technically form at any time of day, but the Opening Power Bar Strategy only uses those formed between 9:30 AM and 10:30 AM ET for trade signals.
2️⃣ Pre-Market Levels
The indicator tracks pre-market price action from 4:10 AM EST until 9:29 AM EST to determine the session’s High and Low. When pre-market ends, both levels are drawn and continuously projected to the right throughout the regular session. A midline is calculated as the midpoint between those levels and is used to determine bullish or bearish bias at the open. This midline is calculated in the indicator’s background and not visually plotted.
Long signals require price to be positioned below the midline before breaking upward, and Short signals require price to be positioned above the midline before breaking downward.
Users can enable retest labels, which appear if price touches the pre-market low, and closes above it, or if price touches the pre-market high, and closes below it. Users can also enable/disable the pre-market levels. If disabled, the pre-market high and pre-market low levels will not be displayed.
3️⃣Long/Short Signals:
Long and Short signals only trigger during the first hour of the New York trading session, between 9:30 AM and 10:30 AM EST. These signals form between the Pre-Market Low (PML) and Pre-Market High (PMH).
▫️ A Long entry requires:
1) A bullish power bar forms
1.a) The candle’s low is < the 50% area or Midpoint of the PML/PMH range
1.b) The candle closes above the PML, but below the PMH
2) If this candle occurs between 09:30 AM and 10:30 AM, a long signal will appear.
▫️ A Short Entry requires:
1) A bearish power bar forms
1a) The candle’s high is > the 50% area or Midpoint of the PML/PMH range
1b) The candle closes below the PMH, but above the PML
2) If this candle occurs between 09:30 AM and 10:30 AM, a short signal will appear.
Only one trade can be active at a time. Users can enable or disable Long Signals and Short Signals independently. Entry markers appear directly on the chart at confirmation.
When a signal is plotted on the Power Bar’s candle close, the indicator automatically builds a rule-based trade structure and plots the following information:
Stop-Loss (SL)
Take-Profit 1 (TP 1)
Take-Profit 2 (TP 2)
Take-Profit 3 (TP 3)
For Long signals, the SL is placed at the low of the bullish Power Bar and TP 1 is placed at the PMH. The distances for TP 2 and TP 3 are then measured using the move from the entry price to TP 1. That same distance is added once above TP 1 to set TP 2, and added again above TP 2 to set TP 3.
For Short signals, the SL is placed at the high of the bearish Power Bar, and TP 1 is placed at the PML. The distances for TP 2 and TP 3 are then measured using the absolute value of the move from the entry price to TP 1. That same distance is subtracted once below TP 1 to set TP 2, and subtracted again below TP 2 to set TP 3.
🔹Trailing Stop-Loss Feature:
When the Trailing Stop-Loss setting is enabled, the Stop-Loss (SL) automatically adjusts as price reaches take-profit levels. This feature helps secure profits while keeping the trade logic completely rule-based and non-discretionary.
Here’s exactly how it works step-by-step:
▫️ Initial Stop-Loss placement:
For a Long trade, the initial SL is set at the low of the Power Bar that triggered the entry.
For a Short trade, the initial SL is set at the high of the Power Bar that triggered the entry.
This level stays fixed until one of the Take-Profit targets is reached.
▫️ After TP 1 is hit:
The SL automatically moves to the entry price (breakeven).
This eliminates all downside risk on the trade.
▫️ After TP2 is hit:
The SL automatically moves to TP 1
This locks in a partial profit while allowing the trade to continue toward TP 3.
▫️ Final exit condition:
The trade is considered complete once either the trailing Stop-Loss or TP 3 is reached.
4️⃣Simple Moving Average (SMA)
In addition to the core trade logic, the indicator includes an optional Simple Moving Average (SMA) that provides extra confirmation and context for interpreting Power Bar signals. The SMA is not related to any of the signal generation logic. It does not influence when or where Power Bars or trade signals appear. Instead, it serves as a contextual confirmation tool and should be used as an additional way to interpret the strength and quality of a setup once a signal is triggered.
There are a few ways the SMA can be used for extra context with the Opening Power Bar Strategy:
▫️ #1 Directional Confirmation:
The SMA is mainly used as a confirmation tool for countertrend Power Bar setups. It helps traders identify when a strong reversal may be developing against the prior trend.
When the SMA is sloping downward but a bullish Power Bar closes above it, that can signal a potential shift from bearish to bullish momentum.
When the SMA is sloping upward but a bearish Power Bar closes below it, that can indicate a possible transition from bullish to bearish conditions.
▫️ #2 Timing Entries
When a large Power Bar prints a signal far away from the SMA, it often indicates that price has moved quickly and temporarily extended away from its average level. In these cases, the SMA can be used as a pullback area where price may retrace before resuming its move. Waiting for this pullback can often lead to a better risk-to-reward trade setup.
For example, in the chart below, a strong bullish Power Bar formed and triggered a Long signal while closing well above the SMA. Entering immediately after the signal would have produced a 0.22 risk-to-reward to TP 1. However, waiting for price to retrace back toward the SMA before entering would have resulted in a much stronger 2.46 risk-to-reward ratio.
The SMA provides a simple way to identify areas for safer pullback entries when a Power Bar signal forms too far from its average level. This helps traders maintain consistency with their risk-to-reward targets and align entries with their trading plan.
▫️ #3 Risk/Trade Management:
During active trades, the SMA can also be used to gauge the healthiness of a trend.
If price continues to respect the SMA after entry, it supports holding the position toward later Take-Profit levels. Additionally, the SMA can highlight areas where traders may consider adding to existing positions if price respects it.
If price closes strongly back through the SMA in the opposite direction, traders may use that as an early exit or a signal that momentum has shifted.
▫️ Optional and Visual Only:
The SMA is an optional visual overlay that can be turned on or off in the indicator’s settings. It is purely there for traders who want an added layer of confirmation and structure when evaluating setups from the Opening Power Bar Strategy.
Users can customize the length of the SMA and the color within the settings.
📢 Alerts:
The indicator supports alerts, so you never miss a key market move. You can choose to receive alerts for each of the following conditions:
Long Signal
Short Signal
TP 1 (Take-Profit 1)
TP 2 (Take-Profit 2)
TP 3 (Take-Profit 3)
SL (Stop-Loss)
Pre-Market Low Retest
Pre-Market High Retest
🚩UNIQUENESS:
This indicator automates a structured opening-range strategy that traders typically manage manually each morning. It identifies valid Power Bars only when they occur inside the pre-market high/low range, confirms direction using pre-market midline context, and automatically builds risk targets using the pre-market range itself. Once a valid trigger occurs during the defined trade window, the indicator immediately generates a complete trade idea (entry/SL/TP 1-3) with built-in trailing logic and alerts.

VWAP Multi-Timeframe Pro═══════════════════════════════════════════════════════════════════════════════
VWAP Multi-Timeframe Pro - 6 VWAP + Dynamic Levels - Alphaomega18
📝 COMPLETE DESCRIPTION
═══════════════════════════════════════════════════════════════════════════════
🎯 THE MOST COMPLETE VWAP INDICATOR ON THE MARKETPLACE
VWAP Multi-Timeframe Pro simultaneously displays 6 different VWAPs (Asia/London/NY Sessions + Daily/Weekly/Monthly) with key price levels and intelligent dynamic color for complete institutional market vision.
Designed for professional traders: futures, forex, crypto, stocks. Compatible all timeframes.
🔥 WHY THIS INDICATOR IS UNIQUE
Other VWAP indicators display 1 or 2 VWAPs maximum.
**VWAP MTF Pro gives you EVERYTHING in one indicator:**
✅ **6 Simultaneous VWAPs**: Asia, London, NY, Daily, Weekly, Monthly
✅ **3 Key Price Levels**: Previous VWAP, Daily Open, Previous Close
✅ **Dynamic Color**: GREEN line if price above, RED if below
✅ **Standard Deviation Bands**: ±1σ, ±2σ, ±3σ for extreme deviations
✅ **10 Configurable Alerts**: Crossovers and extreme zones
✅ **100% Customizable**: Colors, styles, selective display
One indicator = Complete 24/7 institutional flow vision!
📊 THE 6 DISPLAYED VWAPS
🔷 **1. VWAP ASIA SESSION** (Yellow default)
→ Customizable Asian session (00:00-08:00 default)
→ Visible only during Asia session
→ Identifies key Asian trading levels
🔷 **2. VWAP LONDON SESSION** (Cyan default)
→ European session (08:00-16:00 default)
→ Visible only during London session
→ Captures European institutional flow
🔷 **3. VWAP NY SESSION** (Orange default)
→ American session (15:30-22:00 default)
→ Visible only during NY session
→ Highest volume of the day
🔷 **4. VWAP DAILY** (Blue default)
→ Full day VWAP
→ Most important level for day traders
→ Major support/resistance
🔷 **5. VWAP WEEKLY** (Purple default)
→ Weekly VWAP
→ Medium-term trend
→ Key level for swing traders
🔷 **6. VWAP MONTHLY** (Fuchsia default)
→ Monthly VWAP
→ Long-term vision
→ Major institutional levels
📍 3 ESSENTIAL PRICE LEVELS (NEW)
🔷 **PREVIOUS DAY VWAP CLOSE** (Dashed line - Dynamic color!)
**The Revolutionary Feature:**
→ Displays previous day's VWAP Daily close
→ **GREEN line** when price ABOVE = Bullish signal ✅
→ **RED line** when price BELOW = Bearish signal ❌
→ Changes color in real-time at crossover!
**Why it's powerful:**
```
If you're trading LONG and line is GREEN:
→ You're on right side of market
→ Institutions are with you
→ Hold trade with confidence
If line turns RED:
→ EXIT immediately
→ Momentum has changed
→ Institutions selling now
```
🔷 **DAILY OPEN** (White dotted default)
→ Current day's opening price
→ Major psychological level
→ Intraday support/resistance
🔷 **PREVIOUS DAY CLOSE** (Purple dotted default)
→ Previous day's close
→ Gap analysis (up/down/none)
→ Critical institutional level
📏 STANDARD DEVIATION BANDS
**3 Bands on each side of VWAP:**
→ ±1σ (68% of distribution)
→ ±2σ (95% of distribution)
→ ±3σ (99.7% of distribution)
**VWAP selection for bands:**
Choose from: Asia / London / NY / Daily / Weekly / Monthly
**Usage:**
```
Price reaches +3σ:
→ Extreme overbought
→ Reversal or consolidation likely
→ Take LONG profits or prepare SHORT
Price reaches -3σ:
→ Extreme oversold
→ Reversal or consolidation likely
→ Take SHORT profits or prepare LONG
Price between ±1σ:
→ "Normal" zone
→ Trading range
→ Wait for breakout
```
🎯 REAL USE CASES
📌 **CASE 1: MNQ Day Trading with Dynamic Color**
**Morning Setup:**
```
08:00 - Market opens
→ Price at 16,300
→ Prev Day VWAP Close at 16,250
→ Line = GREEN ✅ (price above)
→ Signal: Bullish sentiment confirmed
Action: Look for LONG setups only
Avoid: SHORT trades against trend
```
**Momentum Change:**
```
10:30 - Price drops rapidly
→ Price drops to 16,240
→ Line turns RED ❗
→ Signal: Momentum changed!
Action: EXIT LONG positions immediately
Look for: SHORT setups now
```
**Result:**
→ You stay on right side of market permanently
→ No fighting institutions
→ Profits maximized, losses minimized
📌 **CASE 2: Gap Analysis with Daily Open + Prev Close**
**Gap UP:**
```
Daily Open (white): 16,320
Prev Day Close (purple): 16,280
Gap = +40 points
Analysis:
→ Bullish gap
→ If VWAP prev line = GREEN = Continuation
→ If price retests Prev Close (purple) and bounces = LONG entry
```
**Gap DOWN:**
```
Daily Open (white): 16,240
Prev Day Close (purple): 16,280
Gap = -40 points
Analysis:
→ Bearish gap
→ If VWAP prev line = RED = Continuation
→ If price rallies to Prev Close (purple) and rejects = SHORT entry
```
📌 **CASE 3: Multi-Timeframe Confirmation**
**LONG Setup Maximum Conviction:**
```
✅ Price > VWAP Monthly (fuchsia) → Long-term bullish trend
✅ Price > VWAP Weekly (purple) → Medium-term bullish trend
✅ Price > VWAP Daily (blue) → Short-term bullish trend
✅ Prev Day VWAP = GREEN → Today's momentum bullish
✅ Price > Daily Open (white) → Positive opening
Signal: ALL timeframes aligned LONG!
Action: LONG entry with strong conviction
Stop: Below VWAP Daily
```
**SHORT Setup Maximum Conviction:**
```
✅ Price < VWAP Monthly (fuchsia) → Long-term bearish trend
✅ Price < VWAP Weekly (purple) → Medium-term bearish trend
✅ Price < VWAP Daily (blue) → Short-term bearish trend
✅ Prev Day VWAP = RED → Today's momentum bearish
✅ Price < Daily Open (white) → Negative opening
Signal: ALL timeframes aligned SHORT!
Action: SHORT entry with strong conviction
Stop: Above VWAP Daily
```
📌 **CASE 4: Session Trading (London/NY Overlap)**
**15:30 - NY Session Opens:**
```
Before 15:30:
→ Price in VWAP London (cyan)
→ Consolidation, range
15:30 - NY opens:
→ VWAP NY (orange) appears
→ Volume explodes
→ Price breaks above VWAP Daily (blue)
→ Prev Day VWAP = GREEN ✅
Action:
→ LONG entry on breakout
→ Stop below VWAP Daily
→ Target +3σ upper band
```
⚙️ COMPLETE CUSTOMIZATION
🎨 **EACH VWAP IS CONFIGURABLE:**
**For each VWAP (6 groups):**
→ Show/Hide (On/Off)
→ Customizable color
→ Line thickness (1-5)
**Asia/London/NY Sessions:**
→ Configurable start/end hours
→ Adapt to your timezone
→ Customize per market
**Forex Example:**
```
Asia: 00:00-08:00 (Tokyo)
London: 08:00-16:00 (London)
NY: 13:00-20:00 (New York)
```
**US Futures Example:**
```
Asia: 18:00-02:00 (overnight)
London: 02:00-08:30
NY: 08:30-15:00 (RTH)
```
🎨 **PREVIOUS DAY VWAP - Dynamic Color:**
→ **Dynamic Color (Green/Red)**: On/Off
• ON = Line changes color (GREEN/RED)
• OFF = Fixed color
→ **Color Above**: Color when price above (default: Green)
→ **Color Below**: Color when price below (default: Red)
→ **Static Color**: If Dynamic Color OFF (default: White)
→ **Line Width**: Thickness (1-5)
→ **Line Style**: Solid / Dashed / Dotted
🎨 **DAILY PRICE LEVELS:**
**Daily Open:**
→ Show/Hide
→ Color (default: White)
→ Thickness
→ Style (Solid/Dashed/Dotted)
**Previous Day Close:**
→ Show/Hide
→ Color (default: Purple/Fuchsia)
→ Thickness
→ Style (Solid/Dashed/Dotted)
📏 **STANDARD DEVIATION BANDS:**
→ **Show Bands**: On/Off
→ **Bands Timeframe**: Choose VWAP (Asia/London/NY/Daily/Weekly/Monthly)
→ **Standard Deviation 1/2/3**: σ values (default: 1.0 / 2.0 / 3.0)
→ **Upper Colors**: Customizable
→ **Lower Colors**: Customizable
👁️ **DISPLAY:**
→ **Show Labels**: Display price labels (On/Off)
→ **Label Size**: Tiny / Small / Normal / Large
🔔 COMPLETE ALERTS (10 ALERTS)
**VWAP Daily Crossovers:**
1. Price > VWAP Daily
2. Price < VWAP Daily
**Extreme Bands:**
3. Price reaches +3σ
4. Price reaches -3σ
**Previous Day VWAP:**
5. Price > Previous Day VWAP
6. Price < Previous Day VWAP
**Daily Open:**
7. Price > Daily Open
8. Price < Daily Open
**Previous Day Close:**
9. Price > Previous Close
10. Price < Previous Close
💡 MARKETS AND TIMEFRAMES
✅ **ALL markets compatible:**
• Futures (ES, NQ, YM, RTY, MNQ, MES, etc.)
• Forex (EUR/USD, GBP/USD, USD/JPY, etc.)
• Crypto (BTC, ETH, altcoins - 24/7)
• Stocks (Tesla, Apple, Nvidia, etc.)
• Indices (S&P 500, Nasdaq, Dow Jones)
• Commodities (Gold, Oil, etc.)
✅ **All timeframes:**
• Scalping: 1min, 5min
• Day Trading: 15min, 30min, 1H ⭐ (optimal!)
• Swing Trading: 4H, Daily
• Position Trading: Weekly
Note: More reliable with real volume data
→ TradingView Premium recommended for tick data
🏆 UNIQUE ADVANTAGES
✅ **6 Simultaneous VWAPs**: Complete multi-timeframe vision
✅ **Dynamic color**: GREEN/RED for instant vision
✅ **3 Price levels**: Prev VWAP + Open + Prev Close
✅ **Standard deviation bands**: ±3σ for extreme zones
✅ **Customizable sessions**: Asia/London/NY adaptable
✅ **10 alerts**: All key crossovers
✅ **100% customizable**: Colors, styles, display
✅ **Automatic labels**: Real-time price display
✅ **Optimized code**: Light, fast, no lag
✅ **No repaint**: Reliable and stable signals
📊 RECOMMENDED CONFIGURATION
**For MNQ/ES Day Trading (15min):**
```
═══ VWAP Sessions ═══
Asia: ✅ ON (Yellow)
London: ✅ ON (Cyan)
NY: ✅ ON (Orange)
═══ VWAP Timeframes ═══
Daily: ✅ ON (Blue)
Weekly: ✅ ON (Purple)
Monthly: ❌ OFF (too long-term)
═══ Previous Day VWAP ═══
Show: ✅ ON
Dynamic Color: ✅ ON (CRITICAL!)
Color Above: Green
Color Below: Red
Width: 2-3
═══ Daily Price Levels ═══
Daily Open: ✅ ON (White dotted)
Prev Day Close: ✅ ON (Purple dotted)
═══ Bands ═══
Show Bands: ✅ ON
Timeframe: Daily
σ: 1.0 / 2.0 / 3.0
═══ Display ═══
Labels: ✅ ON
Size: Small
```
**For Scalping (1-5min):**
```
Sessions: Asia/London/NY by hour
Daily/Weekly: ON
Monthly: OFF
Prev Day VWAP: ON with Dynamic Color
Bands: Daily, ±2σ max
Labels: Small or Tiny
```
**For Swing Trading (4H-Daily):**
```
Sessions: OFF (not relevant)
Daily: ON
Weekly: ON
Monthly: ON
Prev Day VWAP: ON
Bands: Weekly, ±3σ
Labels: Normal or Large
```
🎓 QUICK USAGE GUIDE
**Simple Rules for Day Traders:**
1. **Prev VWAP Line Color = Day Direction**
→ GREEN = Trade LONG only
→ RED = Trade SHORT only
2. **Price above ALL VWAPs = Maximum bullish**
→ Look for LONG setups only
→ No SHORT counter-trend
3. **Price below ALL VWAPs = Maximum bearish**
→ Look for SHORT setups only
→ No LONG counter-trend
4. **Price between VWAPs = Neutral zone**
→ Wait for clear breakout
→ Range-bound, careful scalp
5. **±3σ bands = Extreme zones**
→ Take profits
→ Or wait for reversal
💪 TRADER PSYCHOLOGY
**What this indicator solves:**
❌ "I don't know if trend continues"
→ Check prev VWAP line color: GREEN = continues
❌ "I take profits too early from fear"
→ As long as line GREEN, hold LONG with confidence
❌ "I hold my losses too long"
→ Line turns RED? EXIT immediately!
❌ "I trade counter-trend"
→ 6 VWAPs visible = Impossible to mistake direction
❌ "I don't know where to put stop"
→ Stop below VWAP Daily for LONG, above for SHORT
**Result:**
✅ Increased confidence
✅ Reinforced discipline
✅ Maximized profits
✅ Trading with institutions
🔗 PERFECT COMPLEMENT
**Combine VWAP MTF Pro with:**
• **Order Flow Signals** → Institutional absorptions (💎▲🚀)
• **Order Flow CVD** → Real-time order flow
• **Fair Value Gaps** → Inefficiency zones
• **Market Profile** → POC/VPOC
**VWAP MTF Pro** = Institutional price levels
**Order Flow** = Flow confirmation
→ Complete trading system!
⚠️ DISCLAIMER
Technical indicators are decision support tools. No indicator guarantees profits. Always use:
• Appropriate risk management
• Stop loss on every trade
• Proper position sizing
• Demo account testing first
VWAP MTF Pro improves your analysis but doesn't replace a complete strategy with money management.
🚀 INSTALLATION
1. Copy the Pine Script code
2. Open Pine Editor in TradingView
3. Paste the code
4. Click "Add to Chart"
5. Indicator displays on chart (overlay)
6. Configure parameters to your preferences
7. Activate desired alerts
8. Trade with complete institutional vision!
💡 PRO TIP
**The Golden VWAP Rule:**
"NEVER trade against ALL aligned VWAPs"
If Monthly + Weekly + Daily ALL point down:
→ Bearish market on ALL timeframes
→ Trade SHORT only
→ No LONG = Suicide
If Monthly + Weekly + Daily ALL point up:
→ Bullish market on ALL timeframes
→ Trade LONG only
→ No SHORT = Lost money
This simple rule can **save your account**!
📞 CONTACT AND SUPPORT
Created by Alphaomega18
For questions, bugs or suggestions:
Find my other indicators:
• Order Flow Signals (institutional signals)
• Order Flow Dashboard (CVD oscillator)
• Order Flow CVD Simple (trend vision)
• Fair Value Gap Detector
• Volume & Volatility Crisis Detector
