Patient Trendfollower (7)(alpha)Patient Trendfollower consists of 21 and 55 EMA, Commodity Channel Index and Supertrend indicator. It confirms a trend and gives you a signal on a pullback. Original creation worked on 1h EURUSD chart.
►Long setup:
• 21 EMA is above 55 EMA, which is above the Supertrend indicator.
• Commodity Channel Index is an oscillator, which prints into the chart if extreme levels are reached. Green is for a level above 100 or below -100, red is above 140 or below -140 and black is above 180 or below -180.
• If 21 EMA > 55EMA > Supertrend and an oversold signal appear, you can buy into the trend.
• When backtesting on 1h EURUSD, profit target 400 pips worked best with a stop-loss below Supertrend's bottom and the size of your spread.
• A picture shows two valid entries.
: This part still malfunctions and shows red dots over some green ones. It is important to disable red ones in the settings to see green ones.
Some more long signals:
Some short signals:
►Backtesting data with default settings and trading only green CCI signals with mentioned risk management strategy:
• 212 closed trades
• 58.96% profitable with average win trade 348 USD and average loss trade 263 USD when only green signals are followed.
• Profit factor 1.903, Sharpee 0.792
• 20 bars is average for all trades, short trades were 18 bars long on average.
With given data, you can see the strategy is profitable by itself. However, original risk management settings do work only on 1h charts of EURUSD and would need to be adjusted for other instruments based on average volatility.
Even though the profitability is low, you can increase your odds by a great margin, if you properly use price action (impulsive and corrective moves, patterns, bar analysis), if you trade when major exchanges are open, you may also use wave analysis such as Elliot Waves or Market Profiles to predict whether the next day might be a trending day. My backtesting program didn't consider these ideas.
Unfortunately, I won't be making backtesting strategy public with it anytime soon, because it still has some parts that do not work. I am ok with that since I understand the code and know what does malfunction and how. Then, there are parts which I am not sure how to fix yet. This is why the indicator is still considered alpha.
In the future when a strategy is published, you will also be able to set your own overbought/oversold values without entering the code itself and probably some other features. But I am not in a hurry for that. You can give me feedback on UX and try to figure out the best setups for other symbols, it might help to improve the automatic testing script when I know what I should achieve. My main point is to make this public for friends who can already be using it on EURUSD at least.
Close doesn't always have to be 400 pips, you might want to close on a logical level such as strong resistance or a trendline too.
Thanks to:
• @everget for providing Supertrend solution.
• Satik FX who hand-tested the system by hand and reported results in this article . He is my main inspiration for creating the complete indicator as one because I want to be able to show and hide it with a single click. My future scripts will also work as a whole strategy each by itself.
• The number in the script's name comes from Satik's numbering. A mentioned article was his seventh shared strategy.
In den Scripts nach "profit factor" suchen

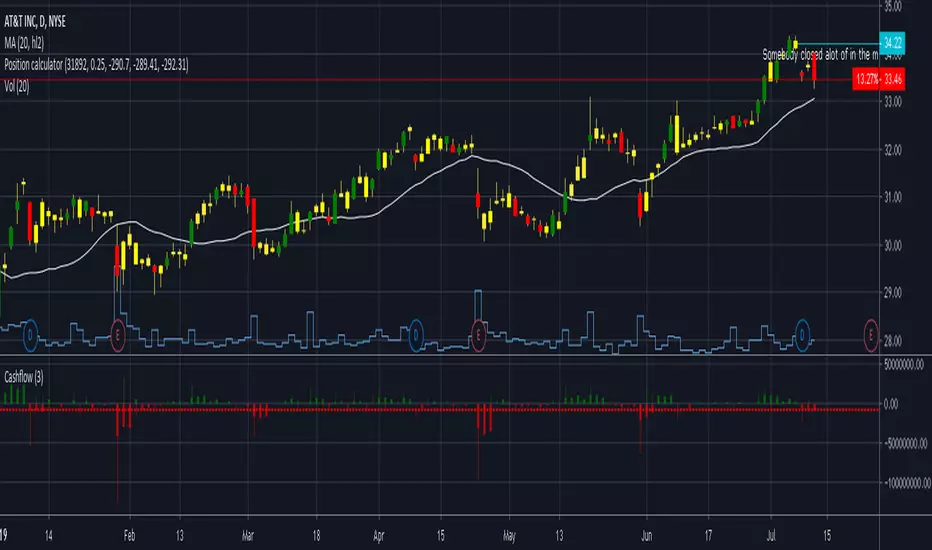
Position calculatorThis position calculator can be used to see if the potential trade is a good one. Enter the values as inputs and the output will be listed next to the settings of the indicator. Nearest support/resistance is meant to be your price target. I have found running this analysis prior to a trade to be helpful. This will output number of shares to buy/sell based on your risk percent and then also give a potential profit factor. I wish the outputs in Tradingview were cleaner but this works for now. Let me know if you have any questions or suggestions. Happy trading!
TrendPulse Scalper by We C2 Software LtdTrendPulse Scalper
High-frequency momentum + breakout scalper (1m – 1h)
Captures strong directional moves with strict multi-filter confirmation:
• EMA 9/21 momentum crossover
• Stochastic + RSI direction filter
• VWAP session bias
• 8-bar high/low breakout
• Optional elevated volume confirmation
• Instant reversal on opposite signal
Risk: 1.5 % SL / 3.5 % TP (fully adjustable)
Real backtest results (TSLA 5-minute, Sep–Nov 2025):
• 949 trades
• +210 % net profit
• 69 % win rate
• Profit factor 1.10
• Max drawdown ~20 %
Fully customizable position sizing: Fixed Shares · Fixed $ · % of Equity
Works on any liquid stock/ETF (TSLA, NVDA, SPY, QQQ, etc.)
Clean, aggressive, universal — one strategy for all markets and timeframes.
ETH Short-Term VWAP+EMA/RSI (ATR Risk, <1h) (James Logan)ETH Short-Term VWAP + EMA / RSI Strategy (ATR-based Risk Control)
A short-term (< 1 hour) ETH trading system designed for intraday scalps and momentum swings on 5- to 15-minute charts.
It blends trend confirmation (EMA 50 / 200) with intrabar structure (EMA 21 pullback & VWAP filter) and RSI momentum triggers, managing exits dynamically through ATR-based stop, take-profit, and trailing stop targets.
Core logic
• Long when RSI crosses above the threshold within an up-trend (EMA 50 > EMA 200) and price is above VWAP.
• Short when RSI crosses below threshold within a down-trend (EMA 50 < EMA 200) and price is below VWAP.
• Optional pullback confirmation to the 21-EMA for cleaner entries.
• Risk defined by ATR-multiples for stop-loss, take-profit, and an adaptive trailing stop.
• Automatic flat-out exit after a set number of bars (time-based close).
Best use
• 5 min – 15 min ETH/USDT charts (Binance, Bybit, Coinbase, etc.)
• Works with both spot and perpetual data.
• Tune ATR and RSI thresholds per venue; defaults are balanced for 0.05 % per-side fees.
Key parameters
• ATR SL × 1.6 ATR TP × 2.2 ATR Trail × 2.0
• RSI 50 cross | EMA 50/200 trend filter | VWAP confirmation
• Default position sizing = USD-based (e.g. $1 000 per trade).
Notes
• All orders and exits are simulated at bar close; use 1-minute bar magnifier for finer fill modeling.
• No repainting—uses only confirmed bar data.
• Best validated with ≥ 200 trades and profit factor > 1.25 over multi-month backtests.

Trend Catch STFR - whipsaw Reduced### Summary of the Setup
This trading system combines **SuperTrend** (a trend-following indicator based on ATR for dynamic support/resistance), **Range Filter** (a smoothed median of the last 100 candles to identify price position relative to a baseline), and filters using **VIX Proxy** (a volatility measure: (14-period ATR / 14-period SMA of Close) × 100) and **ADX** (Average Directional Index for trend strength). It's designed for trend trading with volatility safeguards.
- **Entries**: Triggered only in "tradeable" markets (VIX Proxy ≥ 15 OR ADX ≥ 20) when SuperTrend aligns with direction (green for long, red for short), price crosses the Range Filter median accordingly, and you're not already in that position.
- **Exits**: Purely price-based—exit when SuperTrend flips or price crosses back over the Range Filter median. No forced exits from low volatility/trend.
- **No Trade Zone**: Blocks new entries if both VIX Proxy < 15 AND ADX < 20, but doesn't affect open positions.
- **Overall Goal**: Enter trends with confirmed strength/volatility, ride them via price action, and avoid ranging/choppy markets for new trades.
This creates a filtered trend-following strategy that prioritizes quality entries while letting winners run.
### Advantages
- **Reduces Noise in Entries**: The VIX Proxy and ADX filters ensure trades only in volatile or strongly trending conditions, avoiding low-momentum periods that often lead to false signals.
- **Lets Winners Run**: Exits based solely on price reversal (SuperTrend or Range Filter) allow positions to stay open during temporary lulls in volatility/trend, potentially capturing longer moves.
- **Simple and Balanced**: Combines trend (SuperTrend/ADX), range (Filter), and volatility (VIX Proxy) without overcomplicating—easy to backtest and adapt to assets like stocks, forex, or crypto.
- **Adaptable to Markets**: The "OR" logic for VIX/ADX provides flexibility (e.g., enters volatile sideways markets if ADX is low, or steady trends if VIX is low).
- **Risk Control**: Implicitly limits exposure by blocking entries in calm markets, which can preserve capital during uncertainty.
### Disadvantages
- **Whipsaws in Choppy Markets**: As you noted, SuperTrend can flip frequently in ranging conditions, leading to quick entries/exits and small losses, especially if the Range Filter isn't smoothing enough noise.
- **Missed Opportunities**: Strict filters (e.g., requiring VIX ≥ 15 or ADX ≥ 20) might skip early-stage trends or low-volatility grinds, reducing trade frequency and potential profits in quiet bull/bear markets.
- **Lagging Exits**: Relying only on price flips means you might hold losing trades longer if volatility drops without a clear reversal, increasing drawdowns.
- **Parameter Sensitivity**: Values like VIX 15, ADX 20, or Range Filter's 100-candle lookback need tuning per asset/timeframe; poor choices could amplify whipsaws or over-filter.
- **No Built-in Risk Management**: Lacks explicit stops/targets, so it relies on user-added rules (e.g., ATR-based stops), which could lead to oversized losses if not implemented.
### How to Use It
This system can be implemented in platforms like TradingView (via Pine Script), Python (e.g., with TA-Lib or Pandas), or MT4/5. Here's a step-by-step guide, assuming TradingView for simplicity—adapt as needed. (If coding in Python, use libraries like pandas_ta for indicators.)
1. **Set Up Indicators**:
- Add SuperTrend (default: ATR period 10, multiplier 3—adjust as suggested in prior tweaks).
- Create Range Filter: Use a 100-period SMA of (high + low)/2, smoothed (e.g., via EMA if desired).
- Calculate VIX Proxy: Custom script for (ATR(14) / SMA(close, 14)) * 100.
- Add ADX (period 14, standard).
2. **Define Rules in Code/Script**:
- **Long Entry**: If SuperTrend direction < 0 (green), close > RangeFilterMedian, (VIX Proxy ≥ 15 OR ADX ≥ 20), and not already long—buy on bar close.
- **Short Entry**: If SuperTrend direction > 0 (red), close < RangeFilterMedian, (VIX Proxy ≥ 15 OR ADX ≥ 20), and not already short—sell short.
- **Exit Long**: If in long and (SuperTrend > 0 OR close < RangeFilterMedian)—sell.
- **Exit Short**: If in short and (SuperTrend < 0 OR close > RangeFilterMedian)—cover.
- Monitor No Trade Zone visually (e.g., plot yellow background when VIX < 15 AND ADX < 20).
3. **Backtest and Optimize**:
- Use historical data on your asset (e.g., SPY on 1H chart).
- Test metrics: Win rate, profit factor, max drawdown. Adjust thresholds (e.g., ADX to 25) to reduce whipsaws.
- Forward-test on demo account to validate.
4. **Live Trading**:
- Apply to a chart, set alerts for entries/exits.
- Add risk rules: Position size 1-2% of capital, stop-loss at SuperTrend line.
- Monitor manually or automate via bots—avoid overtrading; use on trending assets.
For the adjustments I suggested earlier (e.g., ADX 25, 2-bar confirmation), integrate them into entries only—test one at a time to isolate improvements. If whipsaws persist, combine 2-3 tweaks.

my_strategy_2.0Overview:
This is a high-speed scalping strategy optimized for volatile crypto assets (BTC, ETH, etc.) on timeframes 1m–5m. It combines trend-following SuperTrend with confirmations from MACD, RSI, Bollinger Bands, and volume spikes for precise entries. Focus on quick profits (1–3 ATR) with strict risk control: partial take-profits, stop-loss, and trailing breakeven after the first TP.
Key Signals:
Long: SuperTrend flip up + MACD crossover up + RSI >50 + BB Upper breakout + volume spike + volatility filter (ATR >0.5%).
Short: Similar but downward.
Exits and Risks:
TP: 33% at +1 ATR, 33% at +2 ATR, 34% at +3 ATR (customizable).
SL: Initial at -1 ATR, after TP1 — to breakeven with trailing on BB midline (optional).
Filters: Minimum ATR to avoid flat markets; realistic commissions in backtests.
Recommendations:
Test on 2020–2025 data (out-of-sample 2024+). Expected Win Rate ~55%, Profit Factor >1.8, Drawdown <10%. Ideal for 1–2% risk per trade. Not for beginners — use paper trading.
Disclaimer: Past results do not guarantee future performance. Trade at your own risk.
(Pine v6 code, ready for publication. Author: gopog777 with expert fixes.)

EMA20 Cross Strategy with countertrades and signalsEMA20 Cross Strategy Documentation
Overview
The EMA20 Cross Strategy with Counter-Trades and Instant Signals is a Pine Script (version 6) trading strategy designed for the TradingView platform. It implements an Exponential Moving Average (EMA) crossover system to generate buy and sell signals, with optional trend filtering, session-based trading, instant signal processing, and visual/statistical feedback. The strategy supports counter-trades (closing opposing positions before entering new ones) and operates with a fixed trade size in EUR.
Features
EMA Crossover Mechanism:
Uses a short-term EMA (configurable length, default: 1) and a long-term EMA (default: 20) to detect crossovers.
A buy signal is generated when the short EMA crosses above the long EMA.
A sell signal is generated when the short EMA crosses below the long EMA.
Instant Signals:
If enabled (useInstantSignals), signals are based on the current price crossing the short EMA, rather than waiting for the candle close.
This allows faster trade execution but may increase sensitivity to price fluctuations.
Trend Filter:
Optionally filters trades based on the trend direction (useTrendFilter).
Long trades are allowed only when the short EMA (or price, for instant signals) is above the long EMA.
Short trades are allowed only when the short EMA (or price) is below the long EMA.
Session Filter:
Restricts trading to specific market hours (sessionStart, default: 09:00–17:00) if enabled (useSessionFilter).
Ensures trades occur only during active market sessions, reducing exposure to low-liquidity periods.
Customizable Timeframe:
The EMA calculations can use a higher timeframe (e.g., 5m, 15m, 1H, 4H, 1D, default: 1H) via request.security.
This allows the strategy to base signals on longer-term trends while operating on a shorter-term chart.
Trade Management:
Fixed trade size of €100,000 per trade (tradeAmount), with a maximum quantity cap (maxQty = 10,000) to prevent oversized trades.
Counter-trades: Closes short positions before entering a long position and vice versa.
Trades are executed with a minimum quantity of 1 to ensure valid orders.
Visualization:
EMA Lines: The short EMA is colored based on the last signal (green for buy, red for sell, gray for neutral), and the long EMA is orange.
Signal Markers: Displays buy/sell signals as arrows (triangles) above/below candles if enabled (showSignalShapes).
Background/Candle Coloring: Optionally colors the chart background or candles green (bullish) or red (bearish) based on the trend (useColoredBars).
Statistics Display:
If enabled (useStats), a label on the chart shows:
Total closed trades
Open trades
Win rate (%)
Number of winning/losing trades
Profit factor (gross profit / gross loss)
Net profit
Maximum drawdown
Configuration Inputs
EMA Short Length (emaLength): Length of the short-term EMA (default: 1).
Trend EMA Length (trendLength): Length of the long-term EMA (default: 20).
Enable Trend Filter (useTrendFilter): Toggles trend-based filtering (default: true).
Color Candles (useColoredBars): Colors candles instead of the background (default: true).
Enable Session Filter (useSessionFilter): Restricts trading to specified hours (default: false).
Trading Session (sessionStart): Defines trading hours (default: 09:00–17:00).
Show Statistics (useStats): Displays performance stats on the chart (default: true).
Show Signal Arrows (showSignalShapes): Displays buy/sell signals as arrows (default: true).
Use Instant Signals (useInstantSignals): Generates signals based on live price action (default: false).
EMA Timeframe (emaTimeframe): Timeframe for EMA calculations (options: 5m, 15m, 1H, 4H, 1D; default: 1H).
Strategy Logic
Signal Generation:
Standard Mode: Signals are based on EMA crossovers (short EMA crossing long EMA) at candle close.
Instant Mode: Signals are based on the current price crossing the short EMA, enabling faster reactions.
Trade Execution:
On a buy signal, closes any short position and opens a long position.
On a sell signal, closes any long position and opens a short position.
Position size is calculated as the minimum of €100,000 or available equity, divided by the current price, capped at 10,000 units.
Filters:
Trend Filter: Ensures trades align with the trend direction (if enabled).
Session Filter: Restricts trades to user-defined market hours (if enabled).
Visual Feedback
EMA Lines: Provide a clear view of the short and long EMAs, with the short EMA’s color reflecting the latest signal.
Signal Arrows: Large green triangles (buy) below candles or red triangles (sell) above candles for easy signal identification.
Chart Coloring: Highlights bullish (green) or bearish (red) trends via background or candle colors.
Statistics Label: Displays key performance metrics in a label above the chart for quick reference.
Usage Notes
Initial Capital: €100,000 (configurable via initial_capital).
Currency: EUR (set via currency).
Order Processing: Orders are processed at candle close (process_orders_on_close=true) unless instant signals are enabled.
Dynamic Requests: Allows dynamic timeframe adjustments for EMA calculations (dynamic_requests=true).
Platform: Designed for TradingView, compatible with any market supported by the platform (e.g., stocks, forex, crypto).
Example Use Case
Scenario: Trading on a 5-minute chart with a 1-hour EMA timeframe, trend filter enabled, and session filter set to 09:00–17:00.
Behavior: The strategy will:
Calculate EMAs on the 1-hour timeframe.
Generate buy signals when the short EMA crosses above the long EMA (and price is above the long EMA).
Generate sell signals when the short EMA crosses below the long EMA (and price is below the long EMA).
Execute trades only during 09:00–17:00.
Display green/red candles and performance stats on the chart.
Limitations
Instant Signals: May lead to more frequent signals, increasing the risk of false positives in volatile markets.
Fixed Trade Size: Does not adjust dynamically based on market conditions beyond equity and max quantity limits.
Session Filter: Simplified and may not account for complex session rules or holidays.
Statistics: Displayed on-chart, which may clutter the view in smaller charts.
Customization
Adjust emaLength and trendLength to suit different market conditions (e.g., shorter for scalping, longer for swing trading).
Toggle useInstantSignals for faster or more stable signal generation.
Modify sessionStart to align with specific market hours.
Disable useStats or showSignalShapes for a cleaner chart.
This strategy is versatile for both manual and automated trading, offering flexibility for various markets and trading styles while providing clear visual and statistical feedback.

NAS100 and gold Smart Scalping Strategy PRO [Enhanced v2]It works on both Gold, Platinum and USTEC100. Profit factor between 6-9. Great Profit making with risk management

Daily Performance Analysis [Mr_Rakun]The Daily Performance Analysis indicator is a comprehensive trading performance tracker that analyzes your strategy's success rate and profitability across different days of the week and month. This powerful tool provides detailed statistics to help traders identify patterns in their trading performance and optimize their strategies accordingly.
Weekly Performance Analysis:
Tracks wins/losses for each day of the week (Monday through Sunday)
Calculates net profit/loss for each trading day
Shows profit factor (gross profit ÷ gross loss) for each day
Displays win rate percentage for each day
Monthly Performance Analysis:
Monitors performance for each day of the month (1-31)
Provides the same detailed metrics as weekly analysis
Helps identify monthly patterns and trends
Add to Your Strategy:
Copy the performance analysis code and integrate it into your existing Pine Script strategy
Optimize Strategy: Use insights to refine entry/exit timing or avoid trading on poor-performing days
Pattern Recognition: Identify which days of the week/month work best for your strategy
Risk Management: Avoid trading on historically poor-performing days
Strategy Optimization: Fine-tune your approach based on empirical data
Performance Tracking: Monitor long-term trends in your trading success
Data-Driven Decisions: Make informed adjustments to your trading schedule

S4_IBS_Mean_Rev_3candleExitOverview:
This is a rules-based, mean reversion strategy designed to trade pullbacks using the Internal Bar Strength (IBS) indicator. The system looks for oversold conditions based on IBS, then enters long trades , holding for a maximum of 3 bars or until the trade becomes profitable.
The strategy includes:
✅ Strict entry rules based on IBS
✅ Hardcoded exit conditions for risk management
✅ A clean visual table summarizing key performance metrics
How It Works:
1. Internal Bar Strength (IBS) Setup:
The IBS is calculated using the previous bar’s price range:
IBS = (Previous Close - Previous Low) / (Previous High - Previous Low)
IBS values closer to 0 indicate price is near the bottom of the previous range, suggesting oversold conditions.
2. Entry Conditions:
IBS must be ≤ 0.25, signaling an oversold setup.
Trade entries are only allowed within a user-defined backtest window (default: 2024).
Only one trade at a time is permitted (long-only strategy).
3. Exit Conditions:
If the price closes higher than the entry price, the trade exits with a profit.
If the trade has been open for 3 bars without showing profit, the trade is forcefully exited.
All trades are closed automatically at the end of the backtest window if still open.
Additional Features:
📊 A real-time performance metrics table is displayed on the chart, showing:
- Total trades
- % of profitable trades
- Total P&L
- Profit Factor
- Max Drawdown
- Best/Worst trade performance
📈 Visual markers indicate trade entries (green triangle) and exits (red triangle) for easy chart interpretation.
Who Is This For?
This strategy is designed for:
✅ Traders exploring systematic mean reversion approaches
✅ Those who prefer strict, rules-based setups with no subjective decision-making
✅ Traders who want built-in performance tracking directly on the chart
Note: This strategy is provided for educational and research purposes. It is a backtested model and past performance does not guarantee future results. Users should paper trade and validate performance before considering real capital.

Trend Scanner ProTrend Scanner Pro, Robust Trend Direction and Strength Estimator
Trend Scanner Pro is designed to evaluate the current market trend with maximum robustness, providing both direction and strength based on statistically reliable data.
This indicator builds upon the core logic of a previous script I developed, called Best SMA Finder. While the original script focused on identifying the most profitable SMA length based on backtested trade performance, Trend Scanner Pro takes that foundation further to serve a different purpose: analyzing and quantifying the actual trend state in real time.
It begins by testing hundreds of SMA lengths, from 10 to 1000 periods. Each one is scored using a custom robustness formula that combines profit factor, number of trades, and win rate. Only SMAs with a sufficient number of trades are retained, ensuring statistical validity and avoiding curve fitting.
The SMA with the highest robustness score is selected as the dynamic reference point. The script then calculates how far the price deviates from it using rolling standard deviation, assigning a trend strength score from -5 (strong bearish) to +5 (strong bullish), with 0 as neutral.
Two detection modes are available:
Slope mode, based on SMA slope reversals
Bias mode, based on directional shifts relative to deviation zones
Optional features:
Deviation bands for visual structure
Candle coloring to reflect trend strength
Compact table showing real-time trend status
This tool is intended for traders who want an adaptive, objective, and statistically grounded assessment of market trend conditions.

5EMA_BB_ScalpingWhat?
In this forum we have earlier published a public scanner called 5EMA BollingerBand Nifty Stock Scanner , which is getting appreciated by the community. That works on top-40 stocks of NSE as a scanner.
Whereas this time, we have come up with the similar concept as a stand-alone indicator which can be applied for any chart, for any timeframe to reap the benifit of reversal trading.
How it works?
This is essentially a reversal/divergence trading strategy, based on a widely used strategy of Power-of-Stocks 5EMA.
To know the divergence from 5-EMA we just check if the high of the candle (on closing) is below the 5-EMA. Then we check if the closing is inside the Bollinger Band (BB). That's a Buy signal. SL: low of the candle, T: middle and higher BB.
Just opposite for selling. 5-EMA low should be above 5-EMA and closing should be inside BB (lesser than BB higher level). That's a Sell signal. SL: high of the candle, T: middle and lower BB.
Along with we compare the current bar's volume with the last-20 bar VWMA (volume weighted moving average) to determine if the volume is high or low.
Present bar's volume is compared with the previous bar's volume to know if it's rising or falling.
VWAP is also determined using `ta.vwap` built-in support of TradingView.
The Bolling Band width is also notified, along with whether it is rising or falling (comparing with previous candle).
What's special?
We love this reversal trading, as it offers many benifits over trend following strategies:
Risk to Reward (RR) is superior.
It _Does Hit_ stop losses, but the stop losses are tiny.
Means, althrough the Profit Factor looks Nahh , however due to superior RR, end of day it ended up in green.
When the day is sideways, it's difficult to trade in trending strategies. This sort of volatility, reversal strategies works better.
It's always tempting to go agaist the wind. Whole world is in Put/PE and you went opposite and enter a Call/CE. And turns out profitable! That's an amazing feeling, as a trader :)
How to trade using this?
* Put any chart
* Apply this screener from Indicators (shortcut to launch indicators is just type / in your keyboard).
* It will show you the Green up arrow when buy alert comes or red down arrow when sell comes. * Also on the top right it will show the latest signal with entry, SL and target.
Disclaimer
* This piece of software does not come up with any warrantee or any rights of not changing it over the future course of time.
* We are not responsible for any trading/investment decision you are taking out of the outcome of this indicator.

ORB 5M + VWAP + Braid Filter + TP 2R o Niveles PreviosORB 5-Minute Breakout Strategy Summary
Strategy Name:
ORB 5M + VWAP + Braid Filter + TP 2R or Previous Levels
Timeframe:
5-minute chart
Trading Window:
9:35 AM to 11:00 AM (New York time)
✅ Entry Conditions:
Opening Range: Defined from 9:30 to 9:35 AM (first 5-minute candle).
Breakout Entry:
Long trade: Price breaks above the opening range high.
Short trade: Price breaks below the opening range low.
Confirmation Filters (All must be met):
Strong candle (green for long, red for short).
VWAP in the direction of the trade.
Braid Filter by Mango2Juice supports the breakout direction (green for long, red for short).
📉 Stop Loss:
Placed at the opposite side of the opening range.
🎯 Take Profit (TP):
+2R (Risk-to-Reward Ratio of 2:1),
or
Closest of the following: previous day’s high/low or premarket levels.
⚙️ Additional Rules:
Only valid signals between 9:35 and 11:00 AM.
Only one trade per breakout direction per day.
Filter out "trap candles" (very small or indecisive candles).
Avoid trading after 11:00 AM.
📊 Performance Goals:
Maintain a high Profit Factor (above 3 ideally).
Focus on tickers with good historical performance under this strategy (e.g., AMZN, PLTR, CVNA).

EMA Pullback Speed Strategy 📌 **Overview**
The **EMA Pullback Speed Strategy** is a trend-following approach that combines **price momentum** and **Exponential Moving Averages (EMA)**.
It aims to identify high-probability entry points during brief pullbacks within ongoing uptrends or downtrends.
The strategy evaluates **speed of price movement**, **relative position to dynamic EMA**, and **candlestick patterns** to determine ideal timing for entries.
One of the key concepts is checking whether the price has **“not pulled back too much”**, helping focus only on situations where the trend is likely to continue.
⚠️ This strategy is designed for educational and research purposes only. It does not guarantee future profits.
🧭 **Purpose**
This strategy addresses the common issue of **"jumping in too late during trends and taking unnecessary losses."**
By waiting for a healthy pullback and confirming signs of **trend resumption**, traders can enter with greater confidence and reduce false entries.
🎯 **Strategy Objectives**
* Enter in the direction of the prevailing trend to increase win rate
* Filter out false signals using pullback depth, speed, and candlestick confirmations
* Predefine Take-Profit (TP) and Stop-Loss (SL) levels for safer, rule-based trading
✨ **Key Features**
* **Dynamic EMA**: Reacts faster when price moves quickly, slower when market is calm – adapting to current momentum
* **Pullback Filter**: Avoids trades when price pulls back too far (e.g., more than 5%), indicating a trend may be weakening
* **Speed Check**: Measures how strongly the price returns to the trend using candlestick body speed (open-to-close range in ticks)
📊 **Trading Rules**
**■ Long Entry Conditions:**
* Current price is above the dynamic EMA (indicating uptrend)
* Price has pulled back toward the EMA (a "buy the dip" situation)
* Pullback depth is within the threshold (not excessive)
* Candlesticks show consecutive bullish closes and break the previous high
* Price speed is strong (positive movement with momentum)
**■ Short Entry Conditions:**
* Current price is below the dynamic EMA (indicating downtrend)
* Price has pulled back up toward the EMA (a "sell the rally" setup)
* Pullback is within range (not too deep)
* Candlesticks show consecutive bearish closes and break the previous low
* Price speed is negative (downward momentum confirmed)
**■ Exit Conditions (TP/SL):**
* **Take-Profit (TP):** Fixed 1.5% target above/below entry price
* **Stop-Loss (SL):** Based on recent price volatility, calculated using ATR × 4
💰 **Risk Management Parameters**
* Symbol & Timeframe: BTCUSD on 1-hour chart (H1)
* Test Capital: \$3000 (simulated account)
* Commission: 0.02%
* Slippage: 2 ticks (minimal execution lag)
* Max risk per trade: 5% of account balance
* Backtest Period: Aug 30, 2023 – May 9, 2025
* Profit Factor (PF): 1.965 (Net profit ÷ Net loss, including spreads & fees)
⚙️ **Trading Parameters & Indicator Settings**
* Maximum EMA Length: 50
* Accelerator Multiplier: 3.0
* Pullback Threshold: 5.0%
* ATR Period: 14
* ATR Multiplier (SL distance): 4.0
* Fixed TP: 1.5%
* Short-term EMA: 21
* Long-term EMA: 50
* Long Speed Threshold: ≥ 1000.0 (ticks)
* Short Speed Threshold: ≤ -1000.0 (ticks)
⚠️Adjustments are based on BTCUSD.
⚠️Forex and other currency pairs require separate adjustments.
🔧 **Strategy Improvements & Uniqueness**
Unlike basic moving average crossovers or RSI triggers, this strategy emphasizes **"momentum-supported pullbacks"**.
By combining dynamic EMA, speed checks, and candlestick signals, it captures trades **as if surfing the wave of a trend.**
Its built-in filters help **avoid overextended pullbacks**, which often signal the trend is ending – making it more robust than traditional trend-following systems.
✅ **Summary**
The **EMA Pullback Speed Strategy** is easy to understand, rule-based, and highly reproducible – ideal for both beginners and intermediate traders.
Because it shows **clear visual entry/exit points** on the chart, it’s also a great tool for practicing discretionary trading decisions.
⚠️ Past performance is not a guarantee of future results.
Always respect your Stop-Loss levels and manage your position size according to your risk tolerance.

Smart Fib StrategySmart Fibonacci Strategy
This advanced trading strategy combines the power of adaptive SMA entries with Fibonacci-based exit levels to create a comprehensive trend-following system that self-optimizes based on historical market conditions. Credit goes to Julien_Eche who created the "Best SMA Finder" which received an Editors Pick award.
Strategy Overview
The Smart Fibonacci Strategy employs a two-pronged approach to trading:
1. Intelligent Entries: Uses a self-optimizing SMA (Simple Moving Average) to identify optimal entry points. The system automatically tests multiple SMA lengths against historical data to determine which period provides the most robust trading signals.
2. Fibonacci-Based Exits: Implements ATR-adjusted Fibonacci bands to establish precise exit targets, with risk-management options ranging from conservative to aggressive.
This dual methodology creates a balanced system that adapts to changing market conditions while providing clear visual reference points for trade management.
Key Features
- **Self-Optimizing Entries**: Automatically calculates the most profitable SMA length based on historical performance
- **Adjustable Risk Parameters**: Choose between low-risk and high-risk exit targets
- **Directional Flexibility**: Trade long-only, short-only, or both directions
- **Visualization Tools**: Customizable display of entry lines and exit bands
- **Performance Statistics**: Comprehensive stats table showing key metrics
- **Smoothing Option**: Reduces noise in the Fibonacci bands for cleaner signals
Trading Rules
Entry Signals
- **Long Entry**: When price crosses above the blue center line (optimal SMA)
- **Short Entry**: When price crosses below the blue center line (optimal SMA)
### Exit Levels
- **Low Risk Option**: Exit at the first Fibonacci band (1.618 * ATR)
- **High Risk Option**: Exit at the second Fibonacci band (2.618 * ATR)
Strategy Parameters
Display Settings
- Toggle visibility of the stats table and indicator components
Strategy Settings
- Select trading direction (long, short, or both)
- Choose exit method (low risk or high risk)
- Set minimum trades threshold for SMA optimization
SMA Settings
- Option to use auto-optimized or fixed-length SMA
- Customize SMA length when using fixed option
Fibonacci Settings
- Adjust ATR period and SMA basis for Fibonacci bands
- Enable/disable smoothing function
- Customize Fibonacci ratio multipliers
Appearance Settings
- Modify colors, line widths, and transparency
Optimization Methodology
The strategy employs a sophisticated optimization algorithm that:
1. Tests multiple SMA lengths against historical data
2. Evaluates performance based on trade count, profit factor, and win rate
3. Calculates a "robustness score" that balances profitability with statistical significance
4. Selects the SMA length with the highest robustness score
This ensures that the strategy's entry signals are continuously adapting to the most effective parameters for current market conditions.
Risk Management
Position sizing is fixed at $2,000 per trade, allowing for consistent exposure across all trading setups. The Fibonacci-based exit system provides two distinct risk management approaches:
- **Conservative Approach**: Using the first Fibonacci band for exits produces more frequent but smaller wins
- **Aggressive Approach**: Using the second Fibonacci band allows for larger potential gains at the cost of increased volatility
Ideal Usage
This strategy is best suited for:
- Trending markets with clear directional moves
- Timeframes from 4H to Daily for most balanced results
- Instruments with moderate volatility (stocks, forex, commodities)
Traders can further enhance performance by combining this strategy with broader market analysis to confirm the prevailing trend direction.

Daily Breakout + Daily Shadow By RouroThis script is a Pine v5 strategy designed to detect daily candle body breakouts and execute them on any intraday timeframe, while also providing:
Daily Data Retrieval
Using request.security(..., "D", ...) it fetches the OHLC and timestamp of the daily candle, regardless of the chart’s current timeframe.
Calculation of Yesterday’s and Day-Before-Yesterday’s Bodies
b1High and b1Low → the high/low of yesterday’s daily candle body
b2High and b2Low → the high/low of the previous day’s body
Detection of the First Intraday Bar After a New Day
By using ta.change(time("D")), it marks the start of each new trading day.
Drawing the Previous Day’s “Shadow” on the Chart
It overlays a box (box.new) and two wick lines (line.new) with configurable colors and transparency, so you can clearly see the full range of yesterday’s candle on any intraday chart.
Automatic End-of-Day Position Closure
It will automatically close any open position at the start of the next day to avoid unintended rollovers.
Entry Signals
On the very first intraday bar after the daily close:
Long if yesterday’s close broke above the body of the day before yesterday
Short if yesterday’s close broke below the body of the day before yesterday
…which triggers a strategy.entry at the intraday open.
Fully Customizable Stop-Loss and Take-Profit
SL options:
Opposite end of yesterday’s body
Fixed pips from entry
A risk-reward ratio on yesterday’s wick
Optional “safety SL” in fixed pips that overrides the above
TP options:
Fixed pips
Yesterday’s wick extreme (high/low)
Partial exit on the wick (TP1), then second exit (TP2) either:
At a multiplied RR
Or at the daily close (“Close of Day”)
You can also choose to move SL to breakeven after TP1 is hit.
Live Metrics Table
In the upper-right corner it displays in real time:
Start of backtest (date of first trade)
Number of ✅ Winning trades and ❌ Losing trades
Total number of trades
Win rate (%)
Profit Factor
All within a fixed table layout so it never runs out of rows or columns.

MACD Aggressive Scalp SimpleComment on the Script
Purpose and Structure:
The script is a scalping strategy based on the MACD indicator combined with EMA (50) as a trend filter.
It uses the MACD histogram's crossover/crossunder of zero to trigger entries and exits, allowing the trader to capitalize on short-term momentum shifts.
The use of strategy.close ensures that positions are closed when specified conditions are met, although adjustments were made to align with Pine Script version 6.
Strengths:
Simplicity and Clarity: The logic is straightforward and focuses on essential scalping principles (momentum-based entries and exits).
Visual Indicators: The plotted MACD line, signal line, and histogram columns provide clear visual feedback for the strategy's operation.
Trend Confirmation: Incorporating the EMA(50) as a trend filter helps avoid trades that go against the prevailing trend, reducing the likelihood of false signals.
Dynamic Exit Conditions: The conditional logic for closing positions based on weakening momentum (via MACD histogram change) is a good way to protect profits or minimize losses.
Potential Improvements:
Parameter Inputs:
Make the MACD (12, 26, 9) and EMA(50) values adjustable by the user through input statements for better customization during backtesting.
Example:
pine
Copy code
macdFast = input(12, title="MACD Fast Length")
macdSlow = input(26, title="MACD Slow Length")
macdSignal = input(9, title="MACD Signal Line Length")
emaLength = input(50, title="EMA Length")
Stop Loss and Take Profit:
The strategy currently lacks explicit stop-loss or take-profit levels, which are critical in a scalping strategy to manage risk and lock in profits.
ATR-based or fixed-percentage exits could be added for better control.
Position Size and Risk Management:
While the script uses 50% of equity per trade, additional options (e.g., fixed position sizes or risk-adjusted sizes) would be beneficial for flexibility.
Avoid Overlapping Signals:
Add logic to prevent overlapping signals (e.g., opening a new position immediately after closing one on the same bar).
Backtesting Optimization:
Consider adding labels or markers (label.new or plotshape) to visualize entry and exit points on the chart for better debugging and analysis.
The inclusion of performance metrics like max drawdown, Sharpe ratio, or profit factor would help assess the strategy's robustness during backtesting.
Compatibility with Live Trading:
The strategy could be further enhanced with alert conditions using alertcondition to notify the trader of buy/sell signals in real-time.

Williams %R StrategyThe Williams %R Strategy implemented in Pine Script™ is a trading system based on the Williams %R momentum oscillator. The Williams %R indicator, developed by Larry Williams in 1973, is designed to identify overbought and oversold conditions in a market, helping traders time their entries and exits effectively (Williams, 1979). This particular strategy aims to capitalize on short-term price reversals in the S&P 500 (SPY) by identifying extreme values in the Williams %R indicator and using them as trading signals.
Strategy Rules:
Entry Signal:
A long position is entered when the Williams %R value falls below -90, indicating an oversold condition. This threshold suggests that the market may be near a short-term bottom, and prices are likely to reverse or rebound in the short term (Murphy, 1999).
Exit Signal:
The long position is exited when:
The current close price is higher than the previous day’s high, or
The Williams %R indicator rises above -30, indicating that the market is no longer oversold and may be approaching an overbought condition (Wilder, 1978).
Technical Analysis and Rationale:
The Williams %R is a momentum oscillator that measures the level of the close relative to the high-low range over a specific period, providing insight into whether an asset is trading near its highs or lows. The indicator values range from -100 (most oversold) to 0 (most overbought). When the value falls below -90, it indicates an oversold condition where a reversal is likely (Achelis, 2000). This strategy uses this oversold threshold as a signal to initiate long positions, betting on mean reversion—an established principle in financial markets where prices tend to revert to their historical averages (Jegadeesh & Titman, 1993).
Optimization and Performance:
The strategy allows for an adjustable lookback period (between 2 and 25 days) to determine the range used in the Williams %R calculation. Empirical tests show that shorter lookback periods (e.g., 2 days) yield the most favorable outcomes, with profit factors exceeding 2. This finding aligns with studies suggesting that shorter timeframes can effectively capture short-term momentum reversals (Fama, 1970; Jegadeesh & Titman, 1993).
Scientific Context:
Mean Reversion Theory: The strategy’s core relies on mean reversion, which suggests that prices fluctuate around a mean or average value. Research shows that such strategies, particularly those using oscillators like Williams %R, can exploit these temporary deviations (Poterba & Summers, 1988).
Behavioral Finance: The overbought and oversold conditions identified by Williams %R align with psychological factors influencing trading behavior, such as herding and panic selling, which often create opportunities for price reversals (Shiller, 2003).
Conclusion:
This Williams %R-based strategy utilizes a well-established momentum oscillator to time entries and exits in the S&P 500. By targeting extreme oversold conditions and exiting when these conditions revert or exceed historical ranges, the strategy aims to capture short-term gains. Scientific evidence supports the effectiveness of short-term mean reversion strategies, particularly when using indicators sensitive to momentum shifts.
References:
Achelis, S. B. (2000). Technical Analysis from A to Z. McGraw Hill.
Fama, E. F. (1970). Efficient Capital Markets: A Review of Theory and Empirical Work. The Journal of Finance, 25(2), 383-417.
Jegadeesh, N., & Titman, S. (1993). Returns to Buying Winners and Selling Losers: Implications for Stock Market Efficiency. The Journal of Finance, 48(1), 65-91.
Murphy, J. J. (1999). Technical Analysis of the Financial Markets: A Comprehensive Guide to Trading Methods and Applications. New York Institute of Finance.
Poterba, J. M., & Summers, L. H. (1988). Mean Reversion in Stock Prices: Evidence and Implications. Journal of Financial Economics, 22(1), 27-59.
Shiller, R. J. (2003). From Efficient Markets Theory to Behavioral Finance. Journal of Economic Perspectives, 17(1), 83-104.
Williams, L. (1979). How I Made One Million Dollars… Last Year… Trading Commodities. Windsor Books.
Wilder, J. W. (1978). New Concepts in Technical Trading Systems. Trend Research.
This explanation provides a scientific and evidence-based perspective on the Williams %R trading strategy, aligning it with fundamental principles in technical analysis and behavioral finance.

Moving Average Trap Strategy by D. BrigagliaThis is a strategy that follows the 200 periods moving average and fades the cross of ma3, ma5 and ma8. It is designed for profiting by mean reversion while at the same time respecting long term trend. It is designed for long term trending markets such as stocks and stock indices.
In this backtest, the strategy shows the ability to beat the S&P500 index with an average slippage set to 2 ticks. The number of trades is good (350), the profit factor is acceptable (1.67). The drawdowns are also reduced compared to the underlying asset.
Nothing of my content is financial advice.

Nifty36ScannerThis code is written for traders to be able to automatically scan 36 stocks of their choice for MACD , EMA200 + SuperTrend and Half Trend . Traders can be on any chart, and if they keep this scanner/indicator on , it will start displaying stocks meeting scanning criteria on the same window without having to go to Screener section and running it again and again. It will save time for traders and give them real time signals.
Indicators for scanning stocks are:
MACD
EMA200
Supertrend
HalfTrend - originally developed by EVERGET
Combination of EMA200 crossover/under and MACD crossover/under has worked well for me for long time, so using this combination as one of the criteria to
Scan the stocks. Using Everget's Half Trend method confirms the signal given by MACD , EMA200 and Supertrend Crossover.
I have added 36 of my favourite stocks from Nifty 50 lot. Users of this script can use the same stocks or change it by going into the settings of this scanner.
The Code is divided into 3 Sections
Section 1: Accepting input from users as boolean so that they can scan on the basis of one of the criteria or any combination of the criteria.
Section 2: "Screener function" to calculate Buy/ Sell on the basis of scanning criteria selected y the user.
screener=>
= ta.supertrend(2.5,10)
Buy/Sell on the basis of Supertrend crossing Close of the candle
//using ta.macd function to calculate MACD and Signal
= ta.macd(close, 12, 26, 9)
using HalfTrend indicator to calculate Buy/Sell signals , removed all the plotting functions from the code of Half Trend
Bringing Stock Symbols in S series variables
s1=input.symbol('NSE:NIFTY1!', title='Symbol1', group="Nifty50List", inline='0')
Assigning Bull/Bear ( Buy/Sell) signals to each stocks selected
=request.security(s1, tf, screener())
Assign BUY to all the stocks showing Buy signals using
buy_label1:= c1?buy_label1+str.tostring(s1)+'\n': buy_label1
Follow the same process for SELL Signals
Section 3: Plotting labels for the BUY/SELL result on the in terms of label for any stocks meeting the criteria with deletion of any previous signals to avoid clutter on the chart with so many signals generated in each candle
Display Buy siganaling stocks in teh form of label using Label.new function with parameters as follows:
barindex
close as series
color
textcolor
style as label_up,
yloc =price
textalign=left
Delete all the previous labels
label.delete(lab_buy )
STOCKS SELECTION
We have given range f 36 stocks from NIFTY 50 that can be selected at anytime,. User can chose their own 36 stocks using setting button.
INDICATORS SELECTION
1. MACD: It i sone of the most reliable trading strategy with 39.3% Success rate with 1.187 as profit factor for NIFTY Index on Daily time frame
2. EAM200 + Super trend : Combination of EMA200 crossover and Super trend removes any false positives and considered a very reliable way of scanning for Buy/Sell signals
3. HALF TREND: Originally developed as an indicator by Everget and modified as strategy by AlgoMojo, it generates Buy/Sell signals with 40.2% success rate with 1.469 as profit faction, on 15 minutes timeframe.

Open High Low StrategyThis is a very simple, yet effective and to some extend widely followed scalping strategy to capture the underling sentiments of the counter whether it will go up or down.
What is it?
This is Open-High-Low (OLH) strategy.
As you already aware of Candlestick patterns, there is patterns called as Marubozu patterns where the sell wick or buy wick either ceases to exists (or very small). This is exactly in the same principle.
In OLH strategy: The buy signal appears when the Open Price is the Low Price. It means if you draw the candlestick, there is no bottom wick. So after the opening of the candle, the demand drives the price up to the level, some selling may or may not come and closes in green. This indicates a strong upward biasness of the underlying counter.
Similarly, a sell signal appears when the Open price is the High Price. It means there is no upper wick. So there is no buying pressure, since the opening of the candle, sellers are in force and pulls down the price to a closing.
This strategy generates the signal at the close of the candle (technically barstate.isconfirmed). Because until the bar is real-time there is no option to know the final closing or high. So you will see the bar on which it generates the buy or sell signal is actually indicates the previous bar as OLH bar.
To determine the Stop-Loss, it uses the most widely known SL calculation of:
For buy signal, it takes the low of the last 7 candles and substract the ATR (Average True Range) of 14-period.
For sell signal, it takes the high of the last 7 candles and add it to the ATR (Average True Range) of 14-period.
One can plot the SL lines as dotted green and red lines as well to see visually.
Default Risk:Reward is 1:2, Can be customizable.
What is Unique?
Of course the utter simplistic nature of this strategy is it's key point. Very easy and intuitive to understand.
There are awesome strategies in this forum that talks about the various indicators combinations and what not.
Instead of all this, in a 15m NSE:NIFTY chart, it generates a good ~ 47% profit-factor with 1:2 Risk Reward ratio. Means if you loose a trade you will loose 1% of account and if you win you will gain 2%. Means 3 trades (2 profits and 1 loss) in a trading session result 3% overall gain for the day. (Assuming you are ready with 1% draw down of your account per trade, at max).
Disclaimer:
This piece of software does not come up with any warrantee or any rights of not changing it over the future course of time.
We are not responsible for any trading/investment decision you are taking out of the outcome of this indicator.

Vin's Playzone Strategy How it works
Playzone is a very simple system, utilizing just two exponential moving
averages. The 'Zones' in which different 'actions' should be taken is
highlighted with different colors on the chart. Calculations for the zones
are based on the relative position of price to the two EMA lines and the
relationship between the two EMAs
How to use
The basic method for using Playzone is to follow the green/red color.
Buy when bar closes in green.
Sell when bar closes in red.
Using it this way is safe but slow and is expected to have around 35-40%
accuracy, while yielding around 2-3 profit factors. The system works best
on larger time frames.
The more advanced method uses the zones to switch between different
trading system and biases, or in conjunction with other indicators.
example 1:
Buy when Yellow-Green and Bullish Divergence between price and RSI is visible,
if not Buy on Green and vise-versa
example 2:
Set up a long-biased grid and trade long only when actionzone is in green
change the bias to short when actionzone turns to te bearish side(red)
(Look at colors on a larger time frame)
"We let the market tell us what to do, Not to outguess what the market gonna do."

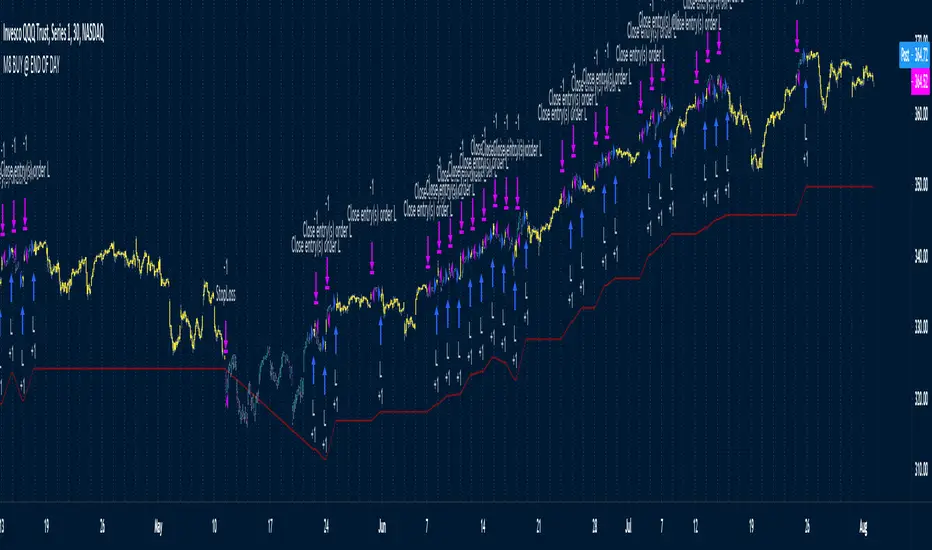
M8 BUY @ END OF DAYI've read a couple of times at a couple of different places that most of the move in the market happens after hours, meaning during non-standard trading hours.
After-market and pre-market hours and have seen data presented showing that systems which bought just before end normal market hours and sold the next morning had really amazing resutls.
But when testing those I found the results to be quite poor compared to the pretty graphs I saw, and after much tweaking and trying different ideas I gave up on the idea until I recently decided to try a new position management system.
The System
Buys at the end of the trading day before the close
Sells the next morning at the open IF THE CLOSE OF THE CURRENT BAR IS HIGHER THAN THE ENTRY PRICE
When the current price is not higher, the system will keep the position open until it EITHER gets stops out or closes on profit <<< this is WHY it has the high win %
The system has a high win ratio because it will keep that one position open until it either reaches profit or stops out
This "system" of waiting, and keeping the trade open, actually turned out to be a fantastic way to kind of put the complete trading strategy in a kind of limbo mode. It either waits for market failure or for a profit.
I don't really care about win % at all, almost always high win % ratio systems are just nonsense. What I look for is a PF -- profit factor of 1.5 or above, and a relatively smooth equity curve. -- This has both.
The Stop Loss setting is set @ .95, meaning a 5% stop loss. The Red Line on the chart is the stop loss line.
There is no set profit target -- it simply takes what the market gives.
Non-Repainting System
This does use a 200D Simple Moving Average as a filter. Like a Green Light / Red Light traffic light, the system will only trade long when the price is above its 200 Moving average.
Here is the code: "F1 = close > sma(security(syminfo.tickerid, "D", close ), MarketFilterLen) // HIGH OF OLD DATA -- SO NO REPAINTING"
I use "close ", so that's data from two days ago, it's fixed, confirmed, non-repainting data from the higher timeframe.
-- I would only suggest using this on direction tickers like SPY, QQQ, SSO, TQQQ, market sectors with additional filters in place.