Close v Open Moving Averages Strategy (Variable) [divonn1994]This is a simple moving average based strategy that works well with a few different coin pairings. It takes the moving average 'opening' price and plots it, then takes the moving average 'closing' price and plots it, and then decides to enter a 'long' position or exit it based on whether the two lines have crossed each other. The reasoning is that it 'enters' a position when the average closing price is increasing. This could indicate upwards momentum in prices in the future. It then exits the position when the average closing price is decreasing. This could indicate downwards momentum in prices in the future. This is only speculative, though, but sometimes it can be a very good indicator/strategy to predict future action.
What I've found is that there are a lot of coins that respond very well when the appropriate combination of: 1) type of moving average is chosen (EMA, SMA, RMA, WMA or VWMA) & 2) number of previous bars averaged (typically 10 - 250 bars) are chosen.
Depending on the coin.. each combination of MA and Number of Bars averaged can have completely different levels of success.
Example of Usage:
An example would be that the VWMA works well for BTCUSD (BitStamp), but it has different successfulness based on the time frame. For the 12 hour bar timeframe, with the 66 bar average with the VWMA I found the most success. The next best successful combo I've found is for the 1 Day bar timeframe with the 35 bar average with the VWMA.. They both have a moving average that records about a month, but each have a different successfulness. Below are a few pair combos I think are noticeable because of the net profit, but there are also have a lot of potential coins with different combos:
It's interesting to see the strategy tester change as you change the settings. The below pairs are just some of the most interesting examples I've found, but there might be other combos I haven't even tried on different coin pairs..
Some strategy settings:
BTCUSD (BitStamp) 12 Hr Timeframe : 66 bars, VWMA=> 10,387x net profit
BTCUSD (BitStamp) 1 Day Timeframe : 35 bars, VWMA=> 7,805x net profit
BNBUSD (Binance) 12 Hr Timeframe : 27 bars, VWMA => 15,484x net profit
ETHUSD (BitStamp) 16 Hr Timeframe : 60 bars, SMA => 5,498x net profit
XRPUSD (BitStamp) 16 Hr Timeframe : 33 bars, SMA => 10,178x net profit
I only chose these coin/combos because of their insane net profit factors. There are far more coins with lower net profits but more reliable trade histories.
Also, usually when I want to see which of these strategies might work for a coin pairing I will check between the different Moving Average types, for example the EMA or the SMA, then I also check between the moving average lengths (the number of bars calculated) to see which is most profitable over time.
Features:
-You can choose your preferred moving average: SMA, EMA, WMA, RMA & VWMA.
-You can also adjust the previous number of calculated bars for each moving average.
-I made the background color Green when you're currently in a long position and Red when not. I made it so you can see when you'd be actively in a trade or not. The Red and Green background colors can be toggled on/off in order to see other indicators more clearly overlayed in the chart, or if you prefer a cleaner look on your charts.
-I also have a plot of the Open moving average and Close moving average together. The Opening moving average is Purple, the Closing moving average is White. White on top is a sign of a potential upswing and purple on top is a sign of a potential downswing. I've made this also able to be toggled on/off.
Please, comment interesting pairs below that you've found for everyone :) thank you!
I will post more pairs with my favorite settings as well. I'll also be considering the quality of the trades.. for example: net profit, total trades, percent profitable, profit factor, trade window and max drawdown.
*if anyone can figure out how to change the date range, I woul really appreciate the help. It confuses me -_- *
In den Scripts nach "profit factor" suchen

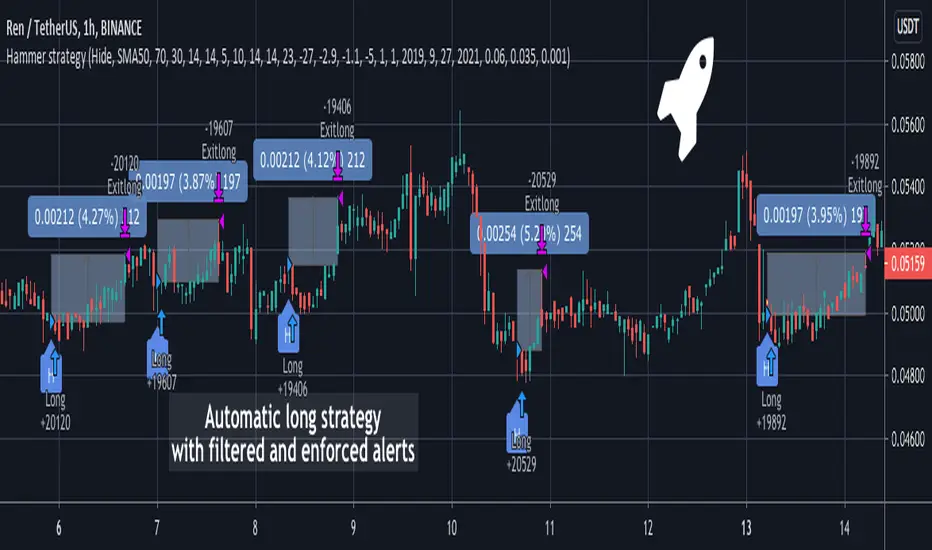
Hammer Long strategy with filtered and enforced alertsA Hammer Long strategy is a price pattern in candlestick charting that occurs when a security trades significantly lower than its opening, but rallies within the period to close near opening price. This pattern forms a hammer-shaped candlestick , in which the lower shadow is at least twice the size of the real body. The body of the candlestick represents the difference between the open and closing prices, while the shadow shows the high and low prices for the period.
Key takeaways:
Hammers have a small real body and a long lower shadow.
Hammers occur after a price decline.
The hammer candlestick shows sellers came into the market during the period but by the close the selling had been absorbed and buyers had pushed the price back to near the open.
The close can be above or below the open, although the close should be near the open in order for the real body to remain small.
The lower shadow should be at least two times the height of the real body.
Hammer candlesticks indicate a potential price reversal to the upside.
The strategy enhances standard Hammer pattern accuracy by clearing out market noises and manipulations from the indicator's triggers. Combination of Volume oscillator filter and Directional Movement Index (DMI) components values adjustments allows to detect only strong signals. The strategy is developed to forecast Long positions entries and exits. The strategy supports spot, futures, options and marginal trading exchanges. It works accurately with BTC, USD, USDT, ETH and BNB quote currencies. Best to use with 30 and 60 minutes timeframe charts. The strategy can be and should be configured for each particular asset. You can change filters and risk management settings to receive the most advanced accurate alerts
Advantages of this script:
1. Weak signals and market noises are filtered. This allows to receive only strong and confirmed alerts
2. Strategy can be easily configured in user interface for each particular asset
3. High performance. At the chart you can see examples of strategy entries and exits, you also can check strategy backtest for RENUSDT position:
Net profit: 26.95%
Percent profitable: 90%
Profit factor: 7.418
Duration of trade: 16 hours
How to use?
1. Apply indicator to the trading pair your are interested in at 30m or 60m timeframe chart
2. Configure the strategy: change filters values and risk management settings until Strategy tester shows good results according to mathematical expectation
3. Set up a TradingView alert to trigger when Hammer strategy conditions are met
4. Strategy will send alerts when to enter and when to exit positions
If you want to obtain access to the indicator please send us a personal message
Super Algorithm Strategy (Joy Bangla)This is the strategy tester for the
Below are the performance results
Starting with $10,000
Net Profit: 88%
66% profitable trades
34% losing trades. Do look at the losing trades. If one did careful moment management, some of those may end up profitable as well.
4.158 Profit factor.
16.1% drawdown. I would go a bit more and say if I am using this, my risk management should ensure for a stop loss of 20%.
66 bars on average (aka it holds for a long time. So, one needs to look into the funding factor in money management)
Sharpe Ratio: 0.291
Only 7 trades done (with 6 closed) in 2 and a half years. So this absolutely reduces noise as much as possible.
In short, if I had $10000 of BTC beginning of 2018, I would be having $18,878 worth of btc right now.
With 4x leverage, this could be a huge potential.
For info on gaining access see the ⬇ link below ⬇ in our signature field & direct message me. I have a busy schedule at my own workplace. Trading is my hobby. Hence, please be kind to me if I am late in replying.

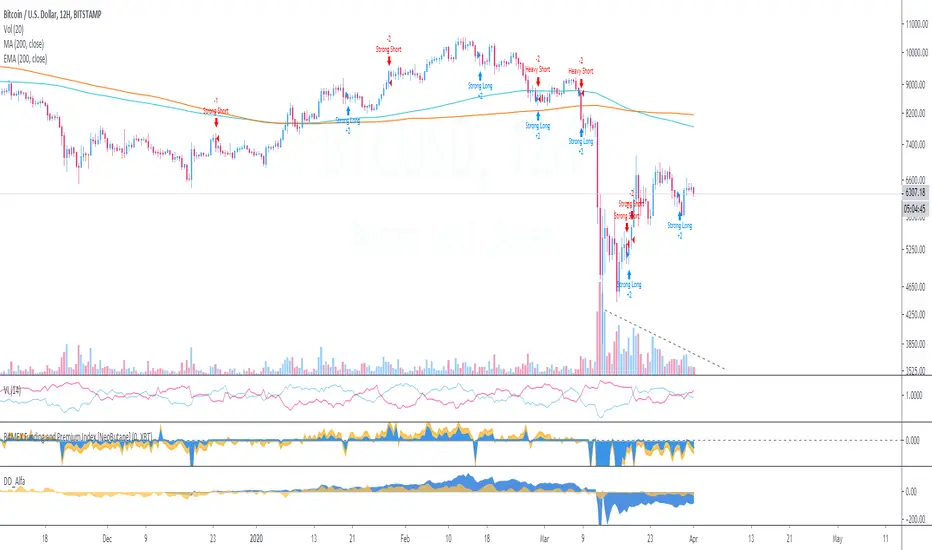
DD_Alfa_StrategyThis is my alfa strategy.
Backtested on the 12H timeframe from June 14, 2019 to November 11, 2019.
Summary:
Net Profit: 50.99%
B&H Return: - 4.49%
Max Drawdown: - 5.41%
Sharpe Ratio: 1.309
Profit Factor: 3.979
Hit Rate: 61.33% (Overall), 47.5% (Longs), 77.14% (Shorts)
Message me for access.
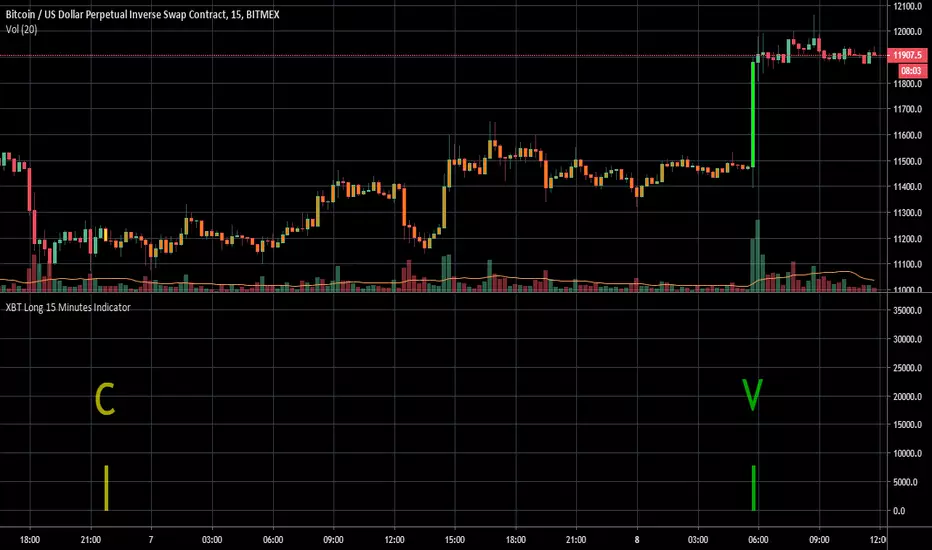
XBT Long 15 Minutes IndicatorXBT Long 15 Minutes Indicator shows Buy and Sell signals on XBT / Bitmex.
Open Long position with "C" and close it with "V".
It was designed to use it in 15 Minutes Scale.
Stop Loss: 3.3%.
Stop Gain: 4.3%.
Statistics from 5/1/19 untill 7/8/19.
23 Win Trades.
8 Loss Trades.
Effectiveness: 74.2%.
Profit: 66.3%.
I use it with 10X leverage.
PROFIT FACTOR: 3.75.
I am using it from 6/1/19.
You are responsible for the use.
I can not assure the future success.
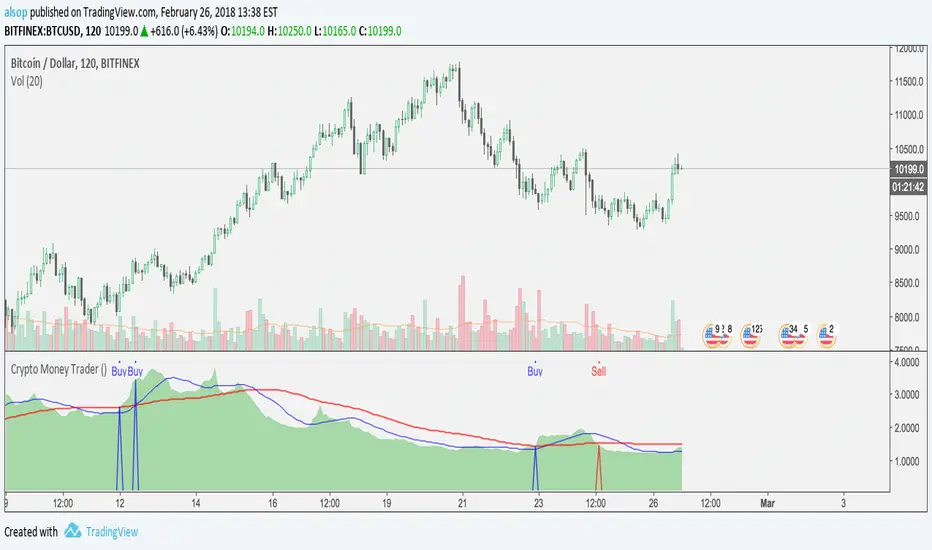
Crypto Money Trader - Indicator for Buy and Sell SignalsThis is it... the one that many have been waiting for.
We have taken everything we have learned from the Crypto Money Index and Crypto Money Bot and combined it into the best indicator possible for trading crypto currencies. This version also includes logic for shorts (sell) and another criteria for longs (buys).
The code is cleaner as well so there is less signal noise and more precise entries.
Before we released this script, we did backtesting on all the current supported USD pairs for optimal results.
Here is one set of results for BTC on 2 hour chats using $5,000 starting balance, 1 trade at once maximum, and 1 contract size:
www.cryptosignalsbot.com
Net Profit: $25,582, 511.64%
Total Trades: 17
Percent Profitable: 70.59%
Profit Factor: 4.304
Maximum Downdraw: $6,629
AvgTrade: $1,504.82, 30.1%
These results get even crazier when you get into settings where you can have 4 trades at once - beyond 700% return... crazy...
The indicator also includes alerts that you can setup so you are aware when a Buy or Sell signal is triggered. Just set an indicator alert for the Trigger Buy or Trigger Sell greater then a value of 0 and you will always know when it is time to look at the charts.
--== STRATEGY ==--
You can combine this indicator with other indicators in your strategy. Many of our most successful users of our previous scripts do just that as it helps them tune a perfect time for an entry.
Personally, we use the indicator and simple trendline entries. When a Buy or Sell triggers, draw a trendline and support / resistance lines and enter on a breakout. That's it.
Please note: this is not a "buy it or sell it now" kind of indicator. Sometimes it will signal a few hours early before a move.
--== SUPPORTED PAIRS ==--
We are always adding pairs, but as of February, 2018 this is our supported USD based pairs: BTC, ETH, LTC, XRP, NEO, BCH, IOT, EOS, BTG, ETC, ETP, OMG, EDO, ZEC, XMR, TRX, SAN, DSH, SNG
--== TELEGRAM CHANNEL ==--
All subscribers to this indicator will get access to our Exclusive Telegram Group where all the signals are analyzed and posted for you to see how we are playing the calls. You can either use this to learn how we use the indicator, or to trade from (at your own risk of course).
The alerts are all posted in this channel automatically and only the timeframes with the highest returns from extensive backtests are posted here automatically. However, we will sometimes post analysis on other timeframes as well.
--== BONUS ==--
As a subscriber, not only do you get this amazing indicator, but as a subscriber you will get access to our Crypto Money Index and the Crypto Money Bot
--== ACCESS ==--
Access is simple, go to our new website and register: Crypto Signals Bot
We will work to get you access to everything as quickly as possible. If you have any issues or questions, use the contact form on the website.
DNSE VN301!, ADX Momentum StrategyDiscover the tailored Pine Script for trading VN30F1M Futures Contracts intraday.
This strategy applies the Statistical Method (IQR) to break down the components of the ADX, calculating the threshold of "normal" momentum fluctuations in price to identify potential breakouts for entry and exit signals. The script automatically closes all positions by 14:30 to avoid overnight holdings.
www.tradingview.com
Settings & Backtest Results:
- Chart: 30-minute timeframe
- Initial capital: VND 100 million
- Position size: 4 contracts per trade (includes trading fees, excludes tax)
- Backtest period: Sep-2021 to Sep-2025
- Return: over 270% (with 5 ticks slippage)
- Trades executed: 1,000+
- Win rate: ~40%
- Profit factor: 1.2
Default Script Settings:
Calculates the acceleration of changes in the +DI and -DI components of the ADX, using IQR to define "normal" momentum fluctuations (adjustable via Lookback period).
Calculates the difference between each bar’s Open and Close prices, using IQR to define "normal" gaps (adjustable via Lookback period).
Entry & Exit Conditions:
Entry Long: Change in +DI or -DI > Avg IQR Value AND Close Price > Previous Close
Exit Long: (all 4 conditions must be met)
- Change in +DI or -DI > Avg IQR Value
- RSI < Previous RSI
- Close–Open Gap > Avg IQR Gap
- Close Price < Previous Close
Entry Short: Change in +DI or -DI > Avg IQR Value AND Close Price < Previous Close
Exit Short: (all 4 conditions must be met)
- Change in +DI or -DI > Avg IQR Value
- RSI > Previous RSI
- Close–Open Gap > Avg IQR Gap
- Close Price > Previous Close
Disclaimers:
Trading futures contracts carries a high degree of risk, and price movements can be highly volatile. This script is intended as a reference tool only. It should be used by individuals who fully understand futures trading, have assessed their own risk tolerance, and are knowledgeable about the strategy’s logic.
All investment decisions are the sole responsibility of the user. DNSE bears no liability for any potential losses incurred from applying this strategy in real trading. Past performance does not guarantee future results. Please contact us directly if you have specific questions about this script.

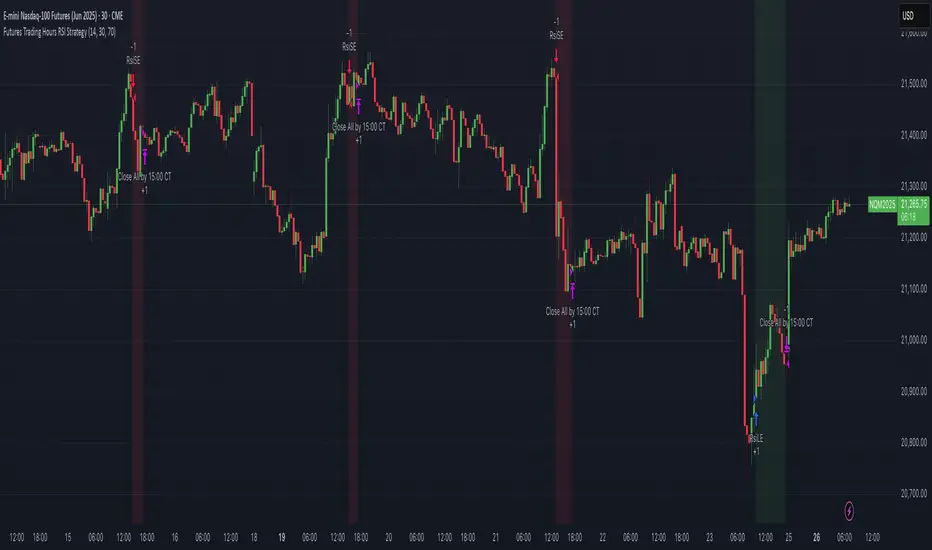
Futures Trading Hours RSI StrategyFutures Trading Hours RSI Strategy
A lightweight, session-filtered RSI strategy designed for equity-index futures (e.g. NQ, ES, YM) on a 30-minute chart. It dynamically enters long when RSI crosses above your oversold threshold and short when RSI crosses below your overbought threshold—but only during regular U.S. trading hours (08:30–15:00 CT, Monday–Friday). All positions are set to close at 15:00 CT to avoid overnight risk, and optional background shading highlights your open longs (green) and shorts (red).
⸻
Key Features
• RSI-based entries: configurable length, oversold, and overbought levels
• Session filter: trades only between 08:30–15:00 CT, Monday through Friday
• Automatic exit: closes all positions at or after 15:00 CT each day
• Visual cues: optional background shading for open long/short positions
• Easy customization: adjust length, overSold, overBought, and time offsets
Backtest Performance (NQ Jun 2025, 30 min)
• Total P&L: +$10,230 (+1.02%)
• Profit Factor: 4.61
• Win Rate: 57.1% (4 wins / 7 trades)
• Max Drawdown: $2,215 (0.22%)
(Results shown are for illustrative purposes only; past performance does not guarantee future returns.)
How to Use
1. Add this script to your 30-minute futures chart.
2. Tweak the RSI parameters and time-zone offset to suit your instrument.
3. Enable “background shading” if you’d like a visual reminder of open positions.
4. Run in paper-trade mode to validate performance before going live.
⸻
⚠️ Disclaimer: Trading carries risk. Always backtest and paper-trade before using real capital. Adjust position sizing and risk controls to your own tolerance.
Equities Risk Tool [vnhilton]To quickly apply this indicator onto the chart, open the source code in Pine Editor & click 'Add to chart'. Perhaps in the future, TradingView will add a feature where you can have favourited indicators on the favourites toolbar alongside the favourited drawing tools. 🤔
Traders will need to calculate how many shares are needed for their position, where if price goes against them towards their stop loss, then they'll lose the amount that they risked on that trade. The formula for this is: Amount willing to risk / Stop loss distance. Traders can carry out these calculations via a calculator, spreadsheet or a simple program with outputs generated from inputs. These 3 methods have 1 thing in common, & it's that you have to manually input the the values, which isn't very convenient, especially for traders trading in a fast paced environment, where milliseconds matter. This indicator is similar to TradingView's Long & Short Position tools, & removes this inconvenience by allowing you to only click to submit your entry & stop out levels, without having to type a single thing (the only thing that would require typing is your account equity in the settings).
This indicator will display lines on the chart showing the entry, stop-out & several profit target levels. The entry & stop-out levels can be moved in any direction as desired, & the profit target levels following suit. You're able to adjust the different profit factors if you're aiming for different reward targets (e.g. You want a 1:2 RR trade, so the profit factor here will be 2 - 2 times the distance between the entry level & stop out level).
A table will also be displayed showing the direction of the position, alongside the shares required for several account risks which is useful if trading different quality setups from A-D for example. The calculated shares displayed are also shown in proportions as well. Here, you're able to see 25%-50%-75%-100% of calculated shares, which may be useful when scaling in/out of trades. All mentioned features are customisable.
Calculated shares for long & short positions can be rounded down to any decimal places. This can be useful if you intend to trade e.g. in batches of 100, then you would use a round down factor of -2.

PineScript v4 - Forex Pin-Bar Trading StrategyPineScript v4, forex trading robot based on the commonly used bullish / bearish pin-bar piercing the moving averages strategy.
I coded this robot to stress-test the PineScript v4 language to see how advanced it is, and whether I could port a forex trading strategy from MT4 to TradingView.
In my opinion, PineScript v4 is still not a professional coding language; for example you cannot use IF-statements to modify the contents of global variables; this makes complex robot behaviour difficult to implement. In addition, it is unclear if the programmer can use nested IF-ELSE, or nested FOR within IF.
The sequence of program execution is also unclear, and although complex order entry and exit appears to function properly, I am not completely comfortable with it.
Recommended Chart Settings:
Asset Class: Forex
Time Frame: H1
Long Entry Conditions:
a) Moving Average up trend, fast crosses above slow
b) Presence of a Bullish Pin Bar
c) Pin Bar pierces either Moving Average
d) Moving Averages must be sloping up, angle threshold (optional)
Short Entry Conditions:
a) Moving Average down trend, fast crosses below slow
b) Presence of a Bearish Pin Bar
c) Pin Bar pierces either Moving Average
d) Moving Averages must be sloping down, angle threshold (optional)
Exit Conditions:
a) Stoploss level is hit
b) Takeprofit level is hit
c) Moving Averages cross-back (optional)
Default Robot Settings:
Equity Risk (%): 3 //how much account balance to risk per trade
Stop Loss (x*ATR, Float): 2.1 //stoploss = x * ATR, you can change x
Risk : Reward (1 : x*SL, Float): 3.1 //takeprofit = x * stop_loss_distance, you can change x
Fast MA (Period): 20 //fast moving average period
Slow MA (Period): 50 //slow moving average period
ATR (Period): 14 //average true range period
Use MA Slope (Boolean): true //toggle the requirement of the moving average slope
Bull Slope Angle (Deg): 1 //angle above which, moving average is considered to be sloping up
Bear Slope Angle (Deg): -1 //angle below which, moving average is considered to be sloping down
Exit When MA Re-Cross (Boolean): true //toggle, close trade if moving average crosses back
Cancel Entry After X Bars (Period): 3 //cancel the order after x bars not triggered, you can change x
Backtest Results (2019 to 2020, H1, Default Settings):
EURJPY - 111% profit, 2.631 profit factor, 16.43% drawdown
EURUSD - 103% profit, 2.899 profit factor, 14.95% drawdown
EURAUD - 76.75% profit, 1.8 profit factor, 17.99% drawdown
NZDUSD - 64.62% profit, 1.727 profit factor, 19.14% drawdown
GBPUSD - 58.73% profit, 1.663 profit factor, 15.44% downdown
AUDJPY - 48.71% profit, 1.635 profit factor, 11.81% drawdown
USDCHF - 30.72% profit, 1.36 profit factor, 22.63% drawdown
AUDUSD - 8.54% profit, 1.092 profit factor, 19.86% drawdown
EURGBP - 0.03% profit, 1.0 profit factor, 29.66% drawdown
USDJPY - 1.96% loss, 0.972 profit factor, 28.37% drawdown
USDCAD - 6.36% loss, 0.891 profit factor, 21.14% drawdown
GBPJPY - 28.27% loss, 0.461 profit factor, 39.13% drawdown
To reduce the possibility of curve-fitting, this robot was backtested on 12 popular forex currencies, as shown above. The robot was profitable on 8 out of 12 currencies, breakeven on 1, and made a loss on 3.
The default robot settings could be over-fitting for the EUR, as we can see out-sized performance for the EUR pairs, with the exception of the EURGBP. We can see that GBPJPY made the largest loss, so these two pairs could be related.
Risk Warning:
This is a forex trading strategy that involves high risk of equity loss, and backtest performance will not equal future results. You agree to use this script at your own risk.

SPY - SPX - S&P --- DAILY MODELThis model is optimized for SPY on a daily time-frame.
Even though it is still profitable (Profit factor > 1) on other time-frames, such as 1h or weekly, I strongly advise you to NOT consider these signals.
You might also get positive returns on other assets, and time-frames, and I also strongly advise you to NOT consider them for your trades. For example:
AAPL-1h
GOOGL-D-W
TSLA-D-W
PYPL-D
INTC-W
MSFT-D-W
FDN-D-W
And so on …
This model is an optimization (parameters tuning) of a meta-model (generic model) for the SPY. It is mainly based on a conjunction of price & volume personal indicators for both entry and exit signals.
The relative portability of the model to other assets and time-frames, coupled with a "Development set -> Validation set" approach, confers it a stronger reliability, and a better warranty of not being « over-optimized ». The meta-model has also served for other model buildings, about 100 as of today.
Be advised that this model applied to real data will get much lower profit factors. During high-volatility periods (such as current times), the model might also be less accurate, as "News streams", more than "prices and volumes", make the market.
As always, this model is for an educational purpose only, and should never be considered as a single decision tool. So, study it, and make sure your decisions are still your own choice.

MACD + SMA 200 Strategy (by ChartArt)Here is a combination of the classic MACD (moving average convergence divergence indicator) with the classic slow moving average SMA with period 200 together as a strategy.
This strategy goes long if the MACD histogram and the MACD momentum are both above zero and the fast MACD moving average is above the slow MACD moving average. As additional long filter the recent price has to be above the SMA 200. If the inverse logic is true, the strategy goes short. For the worst case there is a max intraday equity loss of 50% filter.
Save another $999 bucks with my free strategy.
This strategy works in the backtest on the daily chart of Bitcoin, as well as on the S&P 500 and the Dow Jones Industrial Average daily charts. Current performance as of November 30, 2015 on the SPX500 CFD daily is percent profitable: 68% since the year 1970 with a profit factor of 6.4. Current performance as of November 30, 2015 on the DOWI index daily is percent profitable: 51% since the year 1915 with a profit factor of 10.8.
All trading involves high risk; past performance is not necessarily indicative of future results. Hypothetical or simulated performance results have certain inherent limitations. Unlike an actual performance record, simulated results do not represent actual trading. Also, since the trades have not actually been executed, the results may have under- or over-compensated for the impact, if any, of certain market factors, such as lack of liquidity. Simulated trading programs in general are also subject to the fact that they are designed with the benefit of hindsight. No representation is being made that any account will or is likely to achieve profits or losses similar to those shown.

TheRookAlgoPROThe Rook Algo PRO is an automated strategy that uses ICT dealing ranges to get in sync with potential market trends. It detects the market sentiment and then place a sell or a buy trade in premium/discount or in breakouts with the desired risk management.
Why is useful?
This algorithm is designed to help traders to quickly identify the current state of the market and easily back test their strategy over longs periods of time and different markets its ideal for traders that want to profit on potential expansions and want to avoid consolidations this algo will tell you when the expansion is likely to begin and when is just consolidating and failing moves to avoid trading.
How it works and how it does it?
The Algo detects the current and previous market structure to identify current ranges and ICT dealing ranges that are created when the market takes buyside liquidity and sellside liquidity, it will tell if the market is in a consolidation, expansion, retracement or in a potential turtle soup environment, it will tell if the range is small or big compared to the previous one. Is important to use it in a trending markets because when is ranging the signals lose effectiveness.
This algo is similar to the previously released the Rook algo with the additional features that is an automated strategy that can take trades using filters with the desired risk reward and different entry types and trade management options.
Also this version plots FVGS(fair value gaps) during expansions, and detects consolidations with a box and the mid point or average. Some bars colors are available to help in the identification of the market state. It has the option to show colors of the dealing ranges first detected state.
How to use it?
Start selecting the desired type of entry you want to trade, you can choose to take Discount longs, premium sells, breakouts longs and sells, this first four options are the selected by default. You can enable riskier options like trades without confirmation in premium and discount or turtle soup of the current or previous dealing range. This last ones are ideal for traders looking to enter on a counter trend but has to be used with caution with a higher timeframe reference.
In the picture below we can see a premium sell signal configuration followed by a discount buy signal It display the stop break even level and take profit.
This next image show how the riskier entries work. Because we are not waiting for a confirmation and entering on a counter trend is normal to experience some stop losses because the stop is very tight. Should only be used with a clear Higher timeframe reference as support of the trade idea. This algo has the option to enable standard deviations from the normal stop point to prevent liquidity sweeps. The purple or blue arrows indicate when we are in a potential turtle soup environment.
The algo have a feature called auto-trade enable by default that allow for a reversal of the current trade in case it meets the criteria. And also can take all possible buys or all possible sells that are riskier entries if you just want to see the market sentiment. This is useful when the market is very volatile but is moving not just ranging.
Then we configure the desired trade filters. We have the options to trade only when dealing ranges are in sync for a more secure trend, or we can disable it to take riskier trades like turtle soup trades. We can chose the minimum risk reward to take the trade and the target extension from the current range and the exit type can be when we hit the level or in a retracement that is the default setting. These setting are the most important that determine profitability of the strategy, they has be adjusted depending on the timeframe and market we are trading.
The stop and target levels can also be configured with standard deviations from the current range that way can be adapted to the market volatility.
The Algo allow the user to chose if it want to place break even, or trail the stop. In the picture below we can see it in action. This can work when the trend is very strong if not can lead to multiple reentries or loses.
The last option we can configure is the time where the trades are going to be taken, if we trade usually in the morning then we can just add the morning time by default is set to the morning 730am to 1330pm if you want to trade other times you should change this. Or if we want to enter on the ICT macro times can also be added in a filter. Trade taken with the macro times only enable is visible in the picture below.
Strategy Results
The results are obtained using 2000usd in the MNQ! In the 15minutes timeframe 1 contract per trade. Commission are set to 2USD, slippage to 1tick, the backtesting range is from May 2 2024 to March 2025 for a total of 119 trades, this Strategy default settings are designed to take trades on the daily expansions, trail stop and Break even is activated the exit on profit is on a retracement, and for loses when the stop is hit. The auto-trade option is enable to allow to detect quickly market changes. The strategy give realistic results, makes around 200% of the account in around a year. 1.4 profit factor with around 37% profitable trades. These results can be further improve and adapted to the specific style of trading using the filters.
Remember entries constitute only a small component of a complete winning strategy. Other factors like risk management, position-sizing, trading frequency, trading fees, and many others must also be properly managed to achieve profitability. Past performance doesn’t guarantee future results.
Summary of features
-Easily Identify the current dealing range and market state to avoid consolidations
-Recognize expansions with FVGs and consolidation with shaded boxes
-Recognize turtle soups scenarios to avoid fake out breakout
-Configurable automated trades in premium/discount or breakouts
-Auto-trade option that allow for reversal of the current trade when is no longer valid
-Time filter to allow only entries around the times you trade or on the macro times.
-Risk Reward filter to take the automated trades with visible stop and take profit levels
-Customizable trade management take profit, stop, breakeven level with standard deviations
-Trail stop option to secure profit when price move in your favor
-Option to exit on a close, retracement or reversal after hitting the take profit level
-Option to exit on a close or reversal after hitting stop loss
-Dashboard with instant statistics about the strategy current settings and market sentiment

ThePawnAlgoPROThe Pawn algo PRO is an automated strategy that is useful to trade retracements and expansions using any higher timeframe reference.
Why is useful?
This algorithm is helpful to trade with the higher timeframe Bias and to see the HTF manipulations of the highs or lows once the candle open, usually in a normal buy candle will be a manipulation lower to end up higher. In a normal sell candle will be a manipulation higher to close lower. Once the potential direction of the Higher time frame candle is clear the algo will just enter on a trade on the lower timeframe aligned with the higher timeframe trend.
You can select any HTF you want from 1-365Days, 1-12Months or 1-52W ranges. Making this algorithm very flexible to adapt to any trader specialized timeframe.
How it works and how it does it?
It works with a simple but powerful pattern a close above previous candle high means higher prices and a close below previous candle low means lower prices, Close inside previous candle range means price is going to consolidate do some kind of retracement or reversal. The algo plots the candles with different colors to identify each of these states. And it does this in the HTF range plot.
This algo is similar to the previously released Pawn algo with the additional features that is an automated strategy that can take trade using desired risk reward and different entry types and trade management options. When the simple pattern is detected.
Also this version allows to plot the current developing HTF levels meaning the high, low and the 50%, plus the first created FVG(fair value gap introduced by ICT) in the range allowing to easily track any change in the potential direction of the HTF candle.
How to use it?
First select a higher timeframe reference and then select a lower timeframe, to visualize it better is recommended that the LTF is at least 10 times lower. Default HTF is 1 Week and LTF is 60min for trading the weekly expansions intraday.
Then we configure the HTF visualization it can be configure to show different HTF levels the premium/discount, wicks midpoints, previous levels, actual developing range or both. The Shade of the HTF range can be the body or the whole HTF range.
After that we configure the automated entries we can chose between buys only ,sell only entries or both and minimum risk reward to take a trade. Default value is 1.8RR and both entries selected. We can choose the maximum Risk Reward to avoid unrealistic targets default is 10RR. The maximum trades per HTF candle is also possible to select around this section.
Then we got the option to select which type of trade you want to take a trade around the open, the 50% or 75-80% or around the previous High for shorts or Low for longs. And off course the breakout entry that is for taking expansions outside previous HTF range. The picture below showcase an option using only entries on previous candles High or lows and 1Day as a HTF. You can also see the actual and previous HTF levels plotted.
Is important to take into account that these default settings are optimized for the MNQ! the 1W and 1H timeframes, but traders can adjust these settings to their desire timeframes or market and find a profitable configuration adjusting the parameters as they prefer. Initial balance, order size and commissions might be needed to be configured properly depending of the market. The algo provides a dashboard that make it easy to find a profitable configuration. It specifies the total trades, ARR that is an approximate value of the accumulative risk reward assuming all loses are 1R. The profit factor(PF) and percent profitable trades(PP) values are also available plus consecutives take profits and consecutives loses experimented in the simulation.
Finally there is an option to allow the algo to just trade following the direction of the trend if you just want to use it for sentiment or potential trend detection, this will place a trade in the most probable direction using the HTF reference levels, first FVG and LTF price action.
In the picture below you can see it in action in the 1min chart using 1H as HTF. When its trending works pretty well but when is consolidating is better to avoid using this option. Configuration below uses a time filter with the macro times specified by ICT that is also an available filter for taking trades. And the risk reward is set to minimum 2RR.
The cyan dotted line is the stop loss and the blue one above is the take profit level. The algo allows for different ways to exit in this case is using exit on a reversal, but can also be when the take profit is hit, or in a retracement. For the stop loss we can chose to exit on a close, reversal or when price hit the level.
Strategy Results
The results are obtained using 2000usd in the MNQ! 1 contract per trade. Commission are set to 2USD,slippage to 1tick,
The backtesting range is from April 19 2021 to the present date that is march 2025 for a total of 180 trades, this Strategy default settings are designed to take trades on retracements only, in any of the available options meaning around 50% to the extreme HTF high or low following the HTF trend, but can only take 2 trades per HTF candle and the risk reward must be minimum 1.8RR and maximum 8RR. Break even is set when price reaches 2RR and the exit on profit is on a reversal, and for loses when the stop is hit. The HTF range is 1 Week and LTF is 1H. The strategy give decent results, makes around 2 times the money is lost with around 30% profitable. It experiments drawdown when the market makes quick market structure shifts or consolidates for long periods of time. So should be used with caution, remember entries constitute only a small component of a complete winning strategy. Other factors like risk management, position-sizing, trading frequency, trading fees, and many others must also be properly managed to achieve profitability. Past performance doesn’t guarantee future results.
Summary of features
-Take advantage of market fractality select HTF from 1-365Days, 1-12Months or 1-52W ranges
-Easily identify manipulations in the LTF using any HTF key levels, from previous or actual HTF range
-LTF Candles and shaded HTF boxes change color depending of previous candle close and price action
-Plot the first presented FVG of the selected HTF range plus 50% developing range of the HTF
-Configurable automated trades for retracements into the previous close, around 50%,75-80% or using the HTF high or low
-Option to enable automated breakout entries for expansions of the HTF range
-Trend follower algo that automatically place a trade where is likely to expand.
-Time filter to allow only entries around the times you trade or the macro times.
-Risk Reward filter to take the automated trades with visible stop and take profit levels
- Customizable trade management take profit, stop, breakeven level with standard deviations
-Option to exit on a close, retracement or reversal after hitting the take profit level
-Option to exit on a close or reversal after hitting stop loss
-Dashboard with instant statistics about the strategy current settings

TheHorsyAlgoPROThe Horsy algo is an automated strategy that uses any minute Higher timeframe range as reference and search for a purge of liquidity on the HTF high or low where buyside or sell side liquidity is, the algo only search this at specific desired times that can be configured according to the time you usually trade, the strategy is known as Turtle soup purge and reverse or lately as CRT.
Why is useful?
The purpose of this Algorithm is to help turtle soup traders to quickly identify when the market is likely to reverse the algo evaluates if the opportunity is worth it, base on risk reward and other desired filters. Also this strategy can help to quickly backtest the trader strategy it can be configured in different timeframes and adapt to the trader personality, they can easily see the results and statistics and notice if its profitable or not.
This algo is useful for intraday traders looking for a purge and reverse at a key times and at key HTF price levels this only looks the previous HTF highs and lows but is important to also monitor Order blocks, FVGs, gaps, or wicks to have the best results.
How it works and how it does it?
The Horsy algo simply Jumps from one type of liquidity to another one buyside to sell side or vice versa. In order for the algo to trigger an entry it has to meet these conditions
1. Take HTF liquidity, trade above a HTF high or below a HTF low in the selected time window
2. Make a change in the state of delivery with a close below the previous candle low for shorts and close above previous candle high for longs.
3. Allow for a reasonable risk reward, it will use the highest high for shorts and the lowest low for longs. The default take profit is the opposite side of the range.
4. Validate others user filters this include enter only trades aligned with the HTF bias, or trades aligned with the LTF bias or booth. The algo have the option to enter only premium and discount entries. And finally, an option to allow for different contract sizes depending of the maximum percent of the account we want to risk default is 1%. For this last option is important to check the initial balance and leverage are configured correctly, is disable by default because it requires more capital to perform well.
We can see the algo performing in the picture below with a short trade, notice there are some white lines, they are the high or the low of HTF candle that start generating inside candles in the HTF meaning a possible consolidation. The algo plots the HTF ranges in a shaded boxes as you can see below
The HTF bias as you can see in the picture is calculated based on the last close of the HTF meaning close above previous HTF high is bullish close below previous HTF low is bearish. This HTF bias level is also the last HTF mid-price or 50%. By default, this line is enabled.
The LTF bias is calculated based on the range created from the expansion outside the previous HTF range is also the mid-price. If the LTF close above previous HTF high is bullish and if the LTF close below previous HTF low is bearish. By default this LTF bias line is disable.
This strategy includes an original and personal developed code that uses dealing ranges to recognize if the market is expanding, retracing, reversing or consolidating. This allow the algo to exit the position when it detects a retracement or at the end of the expansion. This is the default exit type.
You can monitor the previous dealing ranges created in history with an option than can be enable, by default is disable, this ranges are created after price takes buyside and then sell side or vice versa. So this dealing ranges can be useful also to identify minor pools of liquidity and premium and discount in the lower timeframe.
The picture below is a long example, the exit in this case is just at the high of the range. The normal take profit is in a blue line for longs.
How to use it?
First select the desired HTF timeframe recommended is from 30min to 240min then you setup the chart on the lower timeframe you want to trade recommended is from 1min to 15min to enter. By default This strategy is designed to work for intraday during key times when price take stops and then moves quickly away from them. You can select as much as 6 different times or just one. After you select the desired time window where the algo will look for the purge and reverse, They are highlighted in the candles that change colors excluding the gray ones that indicates consolidation.
Then the Algo allow to performs several additional filters in the entries you can select if you want to trade only longs or shorts trades, you can select when to move the stop loss to Break even. In deviations of the risk or you can just select to remove risk when price hits the 50% of previous HTF range.
You can select the minimum desired risk reward of the trade before is allow to be taken. Once is configured correctly the algo should trigger signals with a triangle up or down plus the strategy entry.
At the beginning of the picture there are some blue lines in the HTF high low and close, this is to easily identify that the market is in the Asia session, the time can be configured by the user, these lines are normally gray.
On the right top of the screen you can see some statistics about the strategy how many trades it took, ARR is an approximated value of the accumulated total risk reward of all the trades when they get closed in the simulation.
Profit factor and percent profitable are also shown should be green it means that the strategy makes money over time. But apart from that is important to notice how it makes money it is stable over time? it is a roller coaster? that why I Include this other measurements MxcsTps is the maximum consecutives take profits and Mxcsls is the maximum consecutive stop losses it takes, the slash number after it is the consecutive Break evens. So this way you know what to expect and what is normal in the strategy.
The algo shows all the times the stop loss, take profit and break even level if enable in the colored red lines for short and blue lines for longs. You can also select how price will manage the profit or stoploss point meaning that you can choose to wait for the candle to close to invalidate your idea or to take profit. This is good to avoid liquidity sweeps but can also lead to mayor loses if the idea is wrong. The default setting is to close the trade when price takes the high or low where the stoploss is, the take profit is taken after a retracement to allow to profit on expansions. You can select also to exit on a reversal if you want to ride all the move. This last option has to be used with caution because sometimes price just retrace or reverse very fast decreasing the trade profit and overall strategy performance.
The algo have the option to use standard deviation from the normal risk if you prefer to prevent liquidity sweeps near the stop level this make wider stops but can lead to increased loses so it has to be used carefully.
Below is a picture that show the entry stop and take profit levels with an exit on a retracement activated.
Strategy Results
The backtesting results are obtained simulating a 2000usd account in the Micro Nasdaq using 1 contract per trade. Commission are set to 2usd per contract, slippage to 1tick. You can see in list of trades we are not risking more than 1 % percent of the account. The backtested range is from august to November 2024. This strategy doesn’t generate too much trades because of the time filters and conditions that has to be meet to take an entry but you can see the results of the last 4months with the available data that are around 32 trades.
The default settings for this strategy is HTF as 240min designed to work on a LTF 5min chart, the default purge times are 245-300, 745-800, 845-900, 1045-1100 and 1245-1300 UTC-4, the algo will look for shorts or longs, with a minimum risk reward of 2.0. With an additional filter of the HTFBias. The take profit is by default taken on the first retracement after hitting the target. The default settings are optimized to work on the Nasdaq or Spy, but can also perform well in other assets with the correct adjustments.
Remember entries constitute only a small component of a complete winning strategy. Other factors like risk management, position-sizing, trading frequency, trading fees, and many others must also be properly managed to achieve profitability. Past performance doesn’t guarantee future results. To really take advantage of this strategy you have to study turtle soup and the HTF key levels use this only as a confirmation that your overall idea will play out and use it to backtest your model.
Summary of features
·Adaptable strategy to different HTF timeframes from 1-1440min
· Select up to 6 different purge time windows UTC-4, UTC-5
· Choose desired Risk Reward per trade
· Easily see the HTF high low close and 50% key levels in the LTF
· Identify HTF consolidations that generate key major liquidity pools
· HTF/LTF bias filters to trade in favor of the big trend or in sync
· Shaded boxes that indicate if the market is bullish, bearish or consolidating
· See the current midpoint of the last expansion move
· Optimal trade entry filter to trade only in a discount or premium
· Customizable trade management take profit, stop, breakeven level
· Option to exit on a close, retracement or reversal after hitting the take profit level
· Option to exit on a close or reversal after hitting stop loss
· Configurable breakeven point with standard deviations or at 50% of the HTF
· Calculate different contract sizes depending of a percentage of the initial balance
· Standard deviations from normal risk can be used to prevent liquidity sweeps
· See dealing ranges history to check minor pools of liquidity and premium or discount
· Dashboard with instant statistics about the strategy current settings

TradingIQ - Reversal IQIntroducing "Reversal IQ" by TradingIQ
Reversal IQ is an exclusive trading algorithm developed by TradingIQ, designed to trade trend reversals in the market. By integrating artificial intelligence and IQ Technology, Reversal IQ analyzes historical and real-time price data to construct a dynamic trading system adaptable to various asset and timeframe combinations.
Philosophy of Reversal IQ
Reversal IQ integrates IQ Technology (AI) with the timeless concept of reversal trading. Markets follow trends that inevitably reverse at some point. Rather than relying on rigid settings or manual judgment to capture these reversals, Reversal IQ dynamically designs, creates, and executes reversal-based trading strategies.
Reversal IQ is designed to work straight out of the box. In fact, its simplicity requires just one user setting, making it incredibly straightforward to manage.
AI Aggressiveness is the only setting that controls how Reversal IQ works.
Traders don’t have to spend hours adjusting settings and trying to find what works best - Reversal IQ handles this on its own.
Key Features of Reversal IQ
Self-Learning Reversal Detection
Employs AI and IQ Technology to identify trend reversals in real-time.
AI-Generated Trading Signals
Provides reversal trading signals derived from self-learning algorithms.
Comprehensive Trading System
Offers clear entry and exit labels.
AI-Determined Profit Target and Stop Loss
Position exit levels are clearly defined and calculated by the AI once the trade is entered.
Performance Tracking
Records and presents trading performance data, easily accessible for user analysis.
Configurable AI Aggressiveness
Allows users to adjust the AI's aggressiveness to match their trading style and risk tolerance.
Long and Short Trading Capabilities
Supports both long and short positions to trade various market conditions.
IQ Channel
The IQ Channel represents what Reversal IQ considers a tradable long opportunity or a tradable short opportunity. The channel is dynamic and adjusts from chart to chart.
IQMA – Proprietary Moving Average
Introduces the IQ Moving Average (IQMA), designed to classify overarching market trends.
IQCandles – Trend Classification Tool
Complements IQMA with candlestick colors designed for trend identification and analysis.
How It Works
Reversal IQ operates on a straightforward heuristic: go long during an extended downside move and go short during an extended upside move.
What defines an "extended move" is determined by IQ Technology, TradingIQ's exclusive AI algorithm. For Reversal IQ, the algorithm assesses the extent to which historical high and low prices are breached. By learning from these price level violations, Reversal IQ adapts to trade future, similar violations in a recurring manner. It calculates a price area, distant from the current price, where a reversal is anticipated.
In simple terms, price peaks (tops) and troughs (bottoms) are stored for Reversal IQ to learn from. The degree to which these levels are violated by subsequent price movements is also recorded. Reversal IQ continuously evaluates this stored data, adapting to market volatility and raw price fluctuations to better capture price reversals.
What classifies as a price top or price bottom?
For Reversal IQ, price tops are considered the highest price attained before a significant downside reversal. Price bottoms are considered the lowest price attained before a significant upside reversal. The highest price achieved is continuously calculated before a significant counter trend price move renders the high price as a swing high. The lowest price achieved is continuously calculated before a significant counter trend price move renders the low price as a swing low.
The image above illustrates the IQ channel and explains the corresponding prices and levels
The blue lower line represents the Long Reversal Level, with the price highlighted in blue showing the Long Reversal Price.
The red upper line represents the Short Reversal Level, with the price highlighted in red showing the Short Reversal Price.
Limit orders are placed at both of these levels. As soon as either level is touched, a trade is immediately executed.
The image above shows a long position being entered after the Long Reversal Level was reached. The profit target and stop loss are calculated by Reversal IQ
The blue line indicates where the profit target is placed (acting as a limit order).
The red line shows where the stop loss is placed (acting as a stop loss order).
Green arrows indicate that the strategy entered a long position at the highlighted price level.
You can also hover over the trade labels to get more information about the trade—such as the entry price, profit target, and stop loss.
The image above demonstrates the profit target being hit for the trade. All profitable trades are marked by a blue arrow and blue line. Hover over the blue arrow to obtain more details about the trade exit.
The image above depicts a short position being entered after the Short Reversal Level was touched. The profit target and stop loss are calculated by the AI
The blue line indicates where the profit target is placed (acting as a limit order).
The red line shows where the stop loss is placed (acting as a stop loss order).
The image above shows the profit target being hit for the short trade. Profitable trades are indicated by a blue arrow and blue line. Hover over the blue arrow to access more information about the trade exit.
Long Entry: Green Arrow
Short Entry: Red Arrow
Profitable Trades: Blue Arrow
Losing Trades: Red Arrow
IQMA
The IQMA implements a dynamic moving average that adapts to market conditions by adjusting its smoothing factor based on its own slope. This makes it more responsive in volatile conditions (steeper slopes) and smoother in less volatile conditions.
The IQMA is not used by Reversal IQ as a trade condition; however, the IQMA can be used by traders to characterize the overarching trend and elect to trade only long positions during bullish conditions and only short positions during bearish conditions.
The IQMA is an adaptive smoothing function that applies a combination of multiple moving averages to reduce lag and noise in the data. The adaptiveness is achieved by dynamically adjusting the Volatility Factor (VF) based on the slope (derivative) of the price trend, making it more responsive to strong trends and smoother in consolidating markets.
This process effectively makes the moving average a self-adjusting filter, the IQMA attempts to track both trending and ranging market conditions by dynamically changing its sensitivity in response to price movements.
When IQMA is blue, an overarching uptrend is in place. When IQMA is red, an overarching downtrend is in place.
IQ Candles
IQ Candles are price candles color-coordinated with IQMA. IQ Candles help visualize the overarching trend and are not used by Reversal IQ to determine trade entries and trade exits.
AI Aggressiveness
Reversal IQ has only one setting that controls its functionality.
AI Aggressiveness controls the aggressiveness of the AI. This setting has three options: Sniper, Aggressive, and Very Aggressive.
Sniper Mode
In Sniper Mode, Reversal IQ will prioritize trading large deviations from established reversal levels and extracting the largest countertrend move possible from them.
Aggressive Mode
In Aggressive Mode, Reversal IQ still prioritizes quality but allows for strong, quantity-based signals. More trades will be executed in this mode with tighter stops and profit targets. Aggressive mode forces Reversal IQ to learn from narrower raw-dollar violations of historical levels.
Very Aggressive Mode
In Very Aggressive Mode, Reversal IQ still prioritizes the strongest quantity-based signals. Stop and target distances aren't inherently affected, but entries will be aggressive while prioritizing performance. Very Aggressive mode forces Reversal IQ to learn from narrower raw-dollar violations of historical levels and also forces it to embrace volatility more aggressively.
AI Direction
The AI Direction setting controls the trade direction Reversal IQ is allowed to take.
“Both” allows for both long and short trades.
“Long” allows for only long trades.
“Short” allows for only short trades.
Verifying Reversal IQ’s Effectiveness
Reversal IQ automatically tracks its performance and displays the profit factor for the long strategy and the short strategy it uses. This information can be found in a table located in the top-right corner of your chart.
The image above shows the long strategy profit factor and the short strategy profit factor for Reversal IQ.
A profit factor greater than 1 indicates a strategy profitably traded historical price data.
A profit factor less than 1 indicates a strategy unprofitably traded historical price data.
A profit factor equal to 1 indicates a strategy did not lose or gain money when trading historical price data.
Using Reversal IQ
While Reversal IQ is a full-fledged trading system with entries and exits, it was designed for the manual trader to take its trading signals and analysis indications to greater heights - offering numerous applications beyond its built-in trading system.
The hallmark feature of Reversal IQ is its sniper-like reversal signals. While exits are dynamically calculated as well, Reversal IQ simply has a knack for "sniping" price reversals.
When performing live analysis, you can use the IQ Channel to evaluate price reversal areas, whether price has extended too far in one direction, and whether price is likely to reverse soon.
Of course, in times of exuberance or panic, price may push through the reversal levels. While infrequent, it can happen to any indicator.
The deeper price moves into the bullish reversal area (blue) the better chance that price has extended too far and will reverse to the upside soon. The deeper price moves into the bearish reversal area (red) the better chance that price has extended too far and will reverse to the downside soon.
Of course, you can set alerts for all Reversal IQ entry and exit signals, effectively following along its systematic conquest of price movement.

Advanced Trend Strategy [BITsPIP]The BITsPIP team is super excited to share our latest trading gem with you all. We're all about diving deep and ensuring our strategies can stand the test of time. So, we invite you to join us in exploring the awesome potential of this new strategy and really put it through its pace with some deep backtesting. This isn't just another strategy; it boasts a profit factor hovering around 1.5 across over 1000 trades, which is quite an achievement. Consider integrating it with your trading bots to further enhance your trading efficiency and profit generation. Curious? Ask for trial access or drop by our website for more details.
I. Deep Backtesting
We're all in on transparency and solid results, which is why we didn't stop at 100... or even 500 trades. We went over 1000, making sure this strategy is as robust as they come. No flimsy forecasts or sneaky repainting here. Just good, solid strategy that's ready for the real deal. Curious about the details? Check out our detailed backtesting screenshot for the BINANCE:BTCUSDT in a 5-minute timeframe. It's all about giving you the clear picture.
#No Overfitting
#No Repainting
Backtesting Screenshot
II. Algorithmic Trading
Thinking of trading as a manual game? Think again! Manual trading is a bit like rolling the dice - fun, but kind of risky if you're aiming for consistent wins. Instead, why not lean into the future with algorithmic trading? It's all about trusting the market's rhythm over the long term. By integrating your strategy with a trading bot, you can enjoy peace of mind, rest easy, and keep those emotional trades at bay.
III) Applications
Dive into the Advanced Trend Strategy, your versatile tool for navigating the market's waters. This strategy shines in under an hour timeframes, offering adaptability across stocks, commodities, forex, and cryptocurrencies. Initially fine-tuned for low-volatility cryptos like BINANCE:BTCUSDT , its default settings are a solid starting point.
But here's where your expertise comes into play. Each market beats to its own drum, necessitating nuanced adjustments to stop loss and take profit settings. This customization is key to maximizing the strategy's effectiveness in your chosen arena.
IV) Strategy's Logic
The Advanced Trend Strategy is a powerhouse, blending the precision of Hull Suite, RSI, and our unique trend detector technique. At its core, it’s designed for savvy risk management, aiming to lock in substantial profits while steering clear of minor market ripples. It utilizes stop-loss and take-profit thresholds to form a profit channel, providing a safety net for each trade. This is a trend-following strategy at heart, where these profit channels play a critical role in maximizing returns by securing positions within these "warranty channels."
1. Trend-Following
The market's complexity, influenced by countless factors, makes small movements seem almost chaotic. Yet, the principle of #Trend-Following shines in less volatile markets in long term. The strategy excels by pinpointing the ideal moments to enter the market, coupled with refined risk management to secure profits. It’s tailored for you, the individual trader, enabling you to ride the waves of market trends upwards or downwards.
2. Risk Management
A key facet of the strategy is its emphasis on pragmatic risk management. Traders are empowered to establish practical stop-loss and take-profit levels, tailoring these crucial parameters to the specific market they are engaging in. This customization is instrumental in optimizing long-term profitability, ensuring that the strategy adapts fluidly to the unique characteristics and volatility patterns of different trading environments.
V) Strategy's Input Settings and Default Values
1. Alerts
The strategy comes equipped with a flexible alert system designed to keep you informed and ready to act. Within the settings, you’ll find options to configure order/exit and comment/alert messages to your preference. This feature is particularly useful for staying on top of the strategy’s activities without constant manual oversight.
2. Hull Suite
i. Hull Suite Length: Designed for capturing long-term trends, the Hull Suite Length is configured at 1000. Functioning comparably to moving averages, the Hull Suite features upper and lower bands. Currently, it is set to 1000.
ii. Length Multiplier: It's advisable to maintain a minimal value for the Length Multiplier, prioritizing the optimization of the Hull Suite Length. Presently, it is set to 1.
3. RSI Indicator
i. The RSI is a widely recognized tool in trading. Adapt the oversold and overbought thresholds to better match the specifics of your market for optimal results.
4. StopLoss and TakeProfit
i. StopLoss and TakeProfit Settings: Two distinct approaches are available. Semi-Automatic StopLoss/TakeProfit Setting and Manual StopLoss/TakeProfit Setting. The Semi-Automatic mode streamlines the process by allowing you to input values for a 5-minute timeframe, subsequently auto-adjusting these values across various timeframes, both lower and higher. Conversely, the Manual mode offers full control, enabling you to meticulously define TakeProfit values for each individual timeframe.
ii. TakeProfit Threshold # and TakeProfit Value #: Imagine this mechanism as an ascending staircase. Each step represents a range, with the lower boundary (TakeProfit Value) designed to close the trade upon being reached, and the upper boundary (TakeProfit Threshold) upon being hit, propelling the trade to the next level, and forming a new range. This stair-stepping approach enhances risk management and increases profitability. The pre-set configurations are tailored for $BINANCE:BTCUSDT. It's advisable to devote time to tailoring these settings to your specific market, aiming to achieve optimal results based on backtesting.
iii. StopLoss Value: In line with its name, this value marks the limit of loss you're prepared to accept should the market trend go against your expectations. It's crucial to note that once your asset reaches the first TakeProfit range, the initial StopLoss value becomes obsolete, supplanted by the first TakeProfit Value. The default StopLoss value is pegged at 1.6(%), a figure worth considering in your trading strategy.
VI) Entry Conditions
The primary signal for entry is generated by our custom trend detection mechanism and hull suite values (ascending/descending). This is supported by additional indicators acting as confirmation.
VII) Exit Conditions
The strategy stipulates exit conditions primarily governed by stop loss and take profit parameters. On infrequent occasions, if the trend lacks confirmation post-entry, the strategy mandates an exit upon the issuance of a reverse signal (whether confirmed or unconfirmed) by the strategy itself.
BITsPIP

Supertrend - Optimised Exit We created a small script that will allow you to have a quick look into static SL/PT to choose from. This might save you time, replacing the manual search for optimal SL/PT.
We're checking signals of the strategy and computing its performance with a grid of SL/PT selected.
We used SuperTrend signals in this example, but it will be straightforward to integrate your signals.
In addition to total Return, we compute MAX Dd and Profit Factor. Other metrics can be implemented as well.
Thanks to @MUQWISHI for helping code it.
Disclaimer
Please remember that past performance may not indicate future results.
Due to various factors, including changing market conditions, the strategy may no longer perform as well as in historical backtesting.
This post and the script don’t provide any financial advice.

Kioseff Trading - AI-Optimized Supertrend
AI-Optimized Supertrend
Introducing AI-Optimized Supertrend: a streamlined solution for traders of any skill level seeking to rapidly test and optimize Supertrend. Capable of analyzing thousands of strategies, this tool cuts through the complexity to identify the most profitable, reliable, or efficient approaches.
Paired with TradingView's native backtesting capabilities, the AI-Optimized Supertrend learns from historical performance data. Set up is easy for all skill levels, and it makes fine-tuning trading alerts and Supertrend straightforward.
Features
Rapid Supertrend Strategy Testing : Quickly evaluate thousands of Supertrend strategies to find the most effective ones.
AI-Assisted Optimization : Leverage AI recommendations to fine-tune strategies for superior results.
Multi-Objective Optimization : Prioritize Supertrend based on your preference for the highest win rate, maximum profit, or efficiency.
Comprehensive Analytics : The strategy script provides an array of statistics such as profit factor, PnL, win rate, trade counts, max drawdown, and an equity curve to gauge performance accurately.
Alerts Setup : Conveniently set up alerts to be notified about critical trade signals or changes in performance metrics.
Versatile Stop Strategies : Experiment with profit targets, trailing stops, and fixed stop losses.
Binary Supertrend Exploration : Test binary Supertrend strategies.
Limit Orders : Analyze the impact of limit orders on your trading strategy.
Integration with External Indicators : Enhance strategy refinement by incorporating custom or publicly available indicators from TradingView into the optimization process.
Key Settings
The image above shows explanations for a list of key settings for the optimizer.
Set the Factor Range Limits : The AI suggests optimal upper and lower limits for the Factor range, defining the sensitivity of the Supertrend to price fluctuations. A wider range tests a greater variety, while a narrower range focuses on fine-tuning.
Adjust the ATR Range : Use the AI's recommendations to establish the upper and lower bounds for the Average True Range (ATR), which influences the Supertrend's volatility threshold.
ATR Flip : This option lets you interchange the order of ATR and Factor values to quicky test different sequences, giving you the flexibility to explore various combinations and their impact on the Supertrend indicator's performance.
Strategies Evaluated : Adjust this setting to determine how many Supertrend strategies you want to assess and compare.
Enable AI Mode : Turn this feature on to allow the AI to determine and employ the optimal Supertrend strategy with the desired performance metric, such as the highest win rate or maximum profitability.
Target Metric : Adjust this to direct the AI towards optimizing for maximum profit, top win rates, or the most efficient profits.
AI Mode Aggressiveness : Set how assertively the AI pursues the chosen performance goal, such as highest profit or win rate.
Strategy Direction : Choose to focus the AI's testing and optimization on either long or short Supertrend strategies.
Stop Loss Type : Specify the stop loss approach for optimization—fixed value, a trailing stop, or Supertrend direction changes.
Limit Order : Decide if you want to execute trades using limit orders for setting your profit targets, stop losses, or apply them to both.
Profit Target : Define your desired profit level when using either a fixed stop loss or a trailing stop.
Stop Loss : Define your desired stop loss when using either a fixed stop loss or a trailing stop.
How to: Find the best Supertrend for trading
It's important to remember that merely having the AI-Optimized Supertrend on your chart doesn't automatically provide you with the best strategy. You need to follow the AI's guidance through an iterative process to discover the optimal Supertrend settings and strategy.
Optimizing Supertrend involves adjusting two key parameters: the Factor and the Average True Range (ATR). These parameters significantly influence the Supertrend indicator's sensitivity and responsiveness to price movements.
Factor : This parameter multiplies the ATR to determine the distance of the Supertrend line from the price. Higher values will create a wider band, potentially leading to fewer trade signals, while lower values create a narrower band, which may result in more signals but also more noise.
ATR (Average True Range) : ATR measures market volatility. By using the ATR, the Supertrend adapts to changing market volatility; a higher ATR value means a more volatile market, so the Supertrend adjusts accordingly.
During the optimization process, these parameters are systematically varied to determine the combination that yields the best performance based on predefined criteria such as profitability, win rate, or risk management efficiency. The optimization aims to find the optimal Factor and ATR settings.
1.Starting Your Strategy Setup
Begin by deciding your goals for each trade: your profit target and stop loss, or if all trades exit when Supertrend changes direction. You'll also choose how to manage your stops – whether they stay put (fixed) or move with the price (trailing), and whether you want to exit trades at a specific price (limit orders). Keep the initial settings for Supertrend Factor Range and Supertrend ATR Range at their default to give the tool a broad testing field. The AI's guidance will refine these settings to pinpoint the most effective ones through a process of comprehensive testing.
Demonstration Start: We'll begin with the settings outlined in the key settings section, using Supertrend's direction change to the downside as our exit signal for all trades.
2. Continue applying the AI’s suggestions
Keep updating your optimization settings based on the AI's recommendations. Proceed with this iterative optimization until the "Best Found" message is displayed, signaling that the most effective strategy has been identified.
While following the AI's suggestions, we've been prompted with a new suggestion: increase the
number of strategies evaluated. Keep following the AI's new suggestions to evaluate more strategies. Do this until the "Best Found" message shows up.
Success! We continued to follow the AI’s suggestions until “Best Found” was indicated!
AI Mode
AI Mode incorporates Heuristic-Based Adaptive Learning to fine-tune trading strategies in a continuous manner. This feature consists of two main components:
Heuristic-Based Decision Making: The algorithm evaluates multiple Supertrend-based trading strategies using metrics such as Profit and Loss (PNL), Win Rate, and Most Efficient Profit. These metrics act as heuristics to assist the algorithm in identifying suitable strategies for trade execution.
Online Learning: The algorithm updates the performance evaluations of each strategy based on incoming market data. This enables the system to adapt to current market conditions.
Incorporating both heuristic-based decision-making and online learning, this feature aims to provide a framework for trading strategy optimization.
AI Mode Settings
AI Mode Aggressiveness:
Description: The "AI Mode Aggressiveness" setting allows you to fine-tune the AI's trading behavior. This setting ranges from “Low” to “High”, with “High” indicating a more assertive trading approach.
Functionality: This feature filters trading strategies based on a proprietary evaluation method. A higher setting narrows down the strategies that the AI will consider, leaning towards more aggressive trading. Conversely, a lower setting allows for a more conservative approach by broadening the pool of potential strategies.
Optimization
Trading system optimization is immensely advantageous when executed with prudence.
Technical-oriented, mechanical trading systems work when a valid correlation is methodical to the extent that an objective, precisely-defined ruleset can consistently exploit it. If no such correlation exists, or a technical-oriented system is erroneously designed to exploit an illusory correlation (absent predictive utility), the trading system will fail.
Evaluate results practically and test parameters rigorously after discovery. Simply mining the best-performing parameters and immediately trading them is unlikely a winning strategy. Put as much effort into testing strong-performing parameters and building an accompanying system as you would any other trading strategy. Automated optimization involves curve fitting - it's the responsibility of the trader to validate a replicable sequence or correlation and the trading system that exploits it.

The Lazy Trader - Index (ETF) Trend Following Robot50/150 moving average, index (ETF) trend following robot. Coded for people who cannot psychologically handle dollar-cost-averaging through bear markets and extreme drawdowns (although DCA can produce better results eventually), this robot helps you to avoid bear markets. Be a fair-weathered friend of Mr Market, and only take up his offer when the sun is shining! Designed for the lazy trader who really doesn't care...
Recommended Chart Settings:
Asset Class: ETF
Time Frame: Daily
Necessary ETF Macro Conditions:
a) Country must have healthy demographics, good ratio of young > old
b) Country population must be increasing
c) Country must be experiencing price-inflation
Default Robot Settings:
Slow Moving Average: 50 (integer) //adjust to suit your underlying index
Fast Moving Average: 150 (integer) //adjust to suit your underlying index
Bullish Slope Angle: 5 (degrees) //up angle of moving averages
Bearish Slope Angle: -5 (degrees) //down angle of moving averages
Average True Range: 14 (integer) //input for slope-angle formula
Risk: 100 (%) //100% risk means using all equity per trade
ETF Test Results (Default Settings):
SPY (1993 to 2020, 27 years), 332% profit, 20 trades, 6.4 profit factor, 7% drawdown
EWG (1996 to 2020, 24 years), 310% profit, 18 trades, 3.7 profit factor, 10% drawdown
EWH (1996 to 2020, 24 years), 4% loss, 26 trades, 0.9 profit factor, 36% drawdown
QQQ (1999 to 2020, 21 years), 232% profit, 17 trades, 3.6 profit factor, 2% drawdown
EEM (2003 to 2020, 17 years), 73% profit, 17 trades, 1.1 profit factor, 3% drawdown
GXC (2007 to 2020, 13 years), 18% profit, 14 trades, 1.3 profit factor, 26% drawdown
BKF (2009 to 2020, 11 years), 11% profit, 13 trades, 1.2 profit factor, 33% drawdown
A longer time in the markets is better, with the exception of EWH. 6 out of 7 tested ETFs were profitable, feel free to test on your favourite ETF (default settings) and comment below.
Risk Warning:
Not tested on commodities nor other financial products like currencies (code will not work), feel free to leave comments below.
Moving Average Slope Angle Formula:
Reproduced and modified from source:

Crypto Scalper Pro Study / Alerts===========
Crypto Scalper Pro Study Script with Alerts
===========
Our Crypto Scalper Pro Study with Alerts Script is a carbon copy of our tried and tested Crypto Scalper Pro Strategy , but now with the option of setting TradingView Alerts for your chosen trading plan. Making missing trades a thing of the past, and helping you to automate your own trading strategy using AutoView, 3Commas or similar 3rd party Auto Trading Software.
-----------
Crypto Scalper Pro is a scalping strategy developed to work alongside our Crypto Tipster Strategy, now you can trade the D markets with our Tipster, and Intra-Day markets with our Scalper!
This strategy works very well on shorter time frames across multiple crypto pairs, everything from 4H all the way down to a 5m chart, our Crypto Scalper will find the best Entry and Exit points for consistent and reliable returns.
We've added a few variables for you to play with to fine tune this scalper to suit your chosen trading plan - however, these will only adjust the strategy to a certain degree, as there are many algorithms and indicators doing their thing hidden in the background that take precedence.
-----------
What's Included?
Crypto Scalper Pro comes with a host of features and is being continually updated, these features include (but are not limited to):
- Date Range Settings
Setting custom Start/End dates can help hone your strategy to suit the current times, or get a general overview of the market over the years.
- Heikin Ashi Confirmation
We added HA confirmation for both Entry & Exit of trades. This started as a form of "Safe Mode", we have since adapted our safe mode far beyond Heikin Ashi; but kept this confirmation as an added extra.
- Variable Indicator Settings
As well as our Fixed Indicators and Price Action analysis going on in the background of the strategy, we've also included some Variable Indicators that you have access to edit.
Lookback Period will help establish how far back you'd want to be confirming price indications on the strategy - the higher the number the further back it will look, making the Scalping Strategy appear smoother with less trades during choppy times, the downside with a higher lookback is you might miss the start of a potentially epic trade, and only be shown an Entry after the event has already happened.
We find Lookback Lengths of between 5 and 100 could work depending on various other settings, the market being traded, and the timeframe being used.
MA Length (Length of Moving Average) - We use a few MA's to best determine various factors involved with successfully scalping a market, overall trend direction, current price movements and fake-out detection to name just a few. You've got the option of determining a good average length for a few of these variables.
Again, a short MA Length will catch every big move right at the start, but you're almost guaranteed a Negative Expected Value with that method, due to the vast quantity of losing trades in times of chop/ranging markets. A Higher MA Length will remove a lot of chop, reduce the quantity of trades, and therefore (should) result in a higher Percent of Trades Profitable; it will however add a certain lag to the strategy, meaning those highly profitable trades we're looking for may turn out to be not so highly profitable!
- Safe Mode
Enabling Safe Mode will add a couple more confirmation indicators to the strategy - the aim of Safe Mode is, in essence, to remove any trading signals that would end of being false/bad moves. Usually resulting in less Overall Trades, a higher Net Profit, higher % Profitable, higher Profit Factor AND a lower Drawdown. Use Safe Mode to help eliminate orders that would otherwise be placed in choppy markets.
- Stop Loss/Take Profit Settings
This is where Crypto Scalper Pro really proves itself, Money Management. We have an editable Fixed SL/TP, as well as Trailing Stops for Long or Short orders, all of which you can use on their own, or combined with each other. Playing with these settings can turn an un-profitable system into a very-profitable trading plan!
-----------
What's Included within Crypto Scalper Study / Alerts Script?
Our Study script will find Entry and Exit points exactly as our Pro Strategy would find them. The same indicators, methods and chart reading techniques are used, there are 2 big differences however...
The first difference is that our Pro Strategy has the ability to manage your money, Fixed Stops, Take Profit and Trailing Stops to name just a few. Our Study does not (yet) have these functions added due to the way TradingView's charting platform operates.
That's the bad news, the good news for our Crypto Scalper Study Script is that you can add Alerts to your trading plan! This is super handy if you decide to implement our methods into different time frames across various markets and are looking for Intra-day Alerts, or if you're looking to Automate your trading strategy using external software.
Help and Advice for setting up Alerts or to Automate your Strategy can be found on our website.
----------
For more information on the Crypto Scalper Pro Strategy visit the link in our signature.
Good Luck and Happy Trading!

Crypto Scalper Pro===========
Crypto Scalper Pro Strategy
===========
Crypto Scalper Pro is a scalping strategy developed to work alongside our Crypto Tipster Strategy, now you can trade the D markets with our Tipster, and Intra-Day markets with our Scalper!
This strategy works very well on shorter time frames across multiple crypto pairs, everything from 4H all the way down to a 5m chart, our Crypto Scalper will find the best Entry and Exit points for consistent and reliable returns.
We've added a few variables for you to play with to fine tune this scalper to suit your chosen trading plan - however, these will only adjust the strategy to a certain degree, as there are many algorithms and indicators doing their thing hidden in the background that take precedence.
Check out the Crypto Scalper Pro Alert Indicator to automate this strategy!
-----------
What's Included?
Crypto Scalper Pro comes with a host of features and is being continually updated, these features include (but are not limited to):
- Date Range Settings
Setting custom Start/End dates can help hone your strategy to suit the current times, or get a general overview of the market over the years.
- Heikin Ashi Confirmation
We added HA confirmation for both Entry & Exit of trades. This started as a form of "Safe Mode", we have since adapted our safe mode far beyond Heikin Ashi; but kept this confirmation as an added extra.
- Variable Indicator Settings
As well as our Fixed Indicators and Price Action analysis going on in the background of the strategy, we've also included some Variable Indicators that you have access to edit.
Lookback Period will help establish how far back you'd want to be confirming price indications on the strategy - the higher the number the further back it will look, making the Scalping Strategy appear smoother with less trades during choppy times, the downside with a higher lookback is you might miss the start of a potentially epic trade, and only be shown an Entry after the event has already happened.
We find Lookback Lengths of between 5 and 100 could work depending on various other settings, the market being traded, and the timeframe being used.
MA Length (Length of Moving Average) - We use a few MA's to best determine various factors involved with successfully scalping a market, overall trend direction, current price movements and fake-out detection to name just a few. You've got the option of determining a good average length for a few of these variables.
Again, a short MA Length will catch every big move right at the start, but you're almost guaranteed a Negative Expected Value with that method, due to the vast quantity of losing trades in times of chop/ranging markets. A Higher MA Length will remove a lot of chop, reduce the quantity of trades, and therefore (should) result in a higher Percent of Trades Profitable; it will however add a certain lag to the strategy, meaning those highly profitable trades we're looking for may turn out to be not so highly profitable!
- Safe Mode
Enabling Safe Mode will add a couple more confirmation indicators to the strategy - the aim of Safe Mode is, in essence, to remove any trading signals that would end of being false/bad moves. Usually resulting in less Overall Trades, a higher Net Profit, higher % Profitable, higher Profit Factor AND a lower Drawdown. Use Safe Mode to help eliminate orders that would otherwise be placed in choppy markets.
- Stop Loss/Take Profit Settings
This is where Crypto Scalper Pro really proves itself, Money Management. We have an editable Fixed SL/TP, as well as Trailing Stops for Long or Short orders, all of which you can use on their own, or combined with each other. Playing with these settings can turn an un-profitable system into a very-profitable trading plan!
-----------
For more information and a FREE 7-Day Trial with the Crypto Scalper Pro Strategy visit the link in our signature.
Good Luck and Happy Trading!
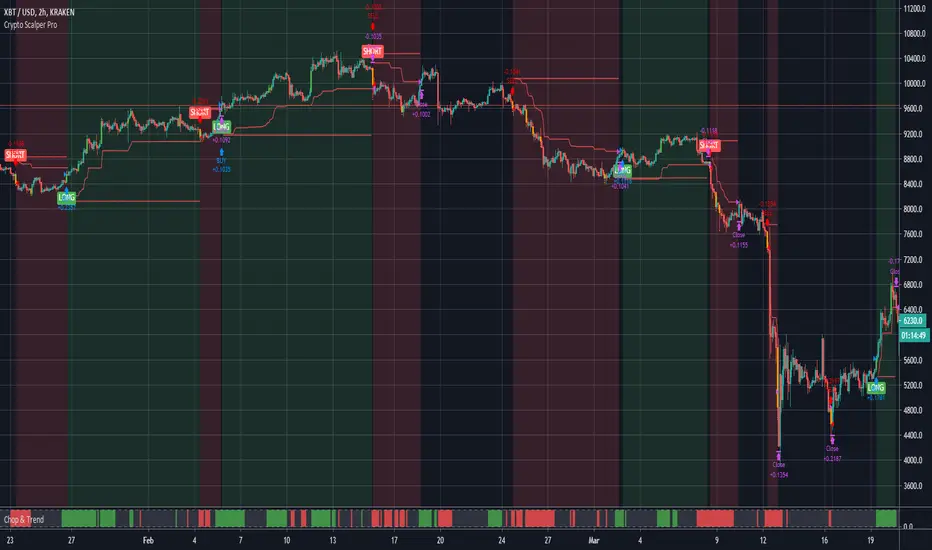
SPX-1D (Strategy) - S&P daily modelWith 2000 likes I will publish the "Study version" that allows you to get alerts and and pre-alerts (triggered a few minutes before the end of the previous day).
Be advised that this model applied to real data will get lower factors. My guesstimate would be a profit factor between 3 and 7, for a percent profitability around 66%.
Invest wisely, a model can only predict some of the predictable moves. In case of doubt, get out of the risk.
