TradeVision Pro - Multi-Factor Analysis System═══════════════════════════════════════════════════════════════════
TRADEVISION PRO - MULTI-FACTOR ANALYSIS SYSTEM
Created by Zakaria Safri
═══════════════════════════════════════════════════════════════════
A comprehensive technical analysis tool combining multiple factors for
signal generation, trend analysis, and dynamic risk management visualization.
Designed for educational purposes to study multi-factor convergence trading
strategies across all markets and timeframes.
⚠️ IMPORTANT DISCLAIMER:
This indicator is provided for EDUCATIONAL and INFORMATIONAL purposes only.
It does NOT constitute financial advice, investment advice, or trading advice.
Past performance does not guarantee future results. Trading involves
substantial risk of loss. Always do your own research and consult a
financial advisor before making trading decisions.
🎯 KEY FEATURES
═══════════════════════════════════════════════════════════════════
✅ MULTI-FACTOR SIGNAL GENERATION
• Price Volume Trend (PVT) analysis
• Rate of Change (ROC) momentum confirmation
• Volume-Weighted Moving Average (VWMA) trend filter
• Simple Moving Average (SMA) price smoothing
• Signals only when all factors align
✅ DYNAMIC RISK VISUALIZATION (Educational Only)
• ATR-based stop loss calculation
• Risk-reward based take profit levels (1-5 targets)
• Visual lines and labels showing entry, SL, and TPs
• Automatically adapts to market volatility
• ⚠️ VISUAL REFERENCE ONLY - Does not execute trades
✅ SUPPORT & RESISTANCE DETECTION
• Automatic pivot-based level identification
• Red dashed lines for resistance zones
• Green dashed lines for support areas
• Helps identify key price levels
✅ VWMA TREND BANDS
• Volume-weighted moving average with standard deviation
• Color-changing bands (Green = Uptrend, Red = Downtrend)
• Filled band area for easy visualization
• Volume-confirmed trend strength
✅ TREND DETECTION SYSTEM
• Counting-based trend confirmation
• Three states: Up Trend, Down Trend, Ranging
• Requires threshold of consecutive bars
• Independent trend validation
✅ PRICE RANGE VISUALIZATION
• High/Low range lines showing market structure
• Filled area highlighting price volatility
• Helps identify breakout zones
✅ COMPREHENSIVE INFO TABLE
• Real-time trend status
• Last signal type (BUY/SELL)
• Entry price display
• Stop loss level
• All active take profit levels
• Clean, professional layout
✅ OPTIONAL FEATURES
• Bar coloring by trend direction
• Customizable alert notifications
• Toggle visibility for all components
• Fully configurable parameters
📊 HOW IT WORKS
═══════════════════════════════════════════════════════════════════
SIGNAL METHODOLOGY:
BUY SIGNAL generates when ALL conditions are met:
• Smoothed price > Moving Average (upward price trend)
• PVT > PVT Average (volume supporting uptrend)
• ROC > 0 (positive momentum)
• Close > VWMA (above volume-weighted average)
SELL SIGNAL generates when ALL conditions are met:
• Smoothed price < Moving Average (downward price trend)
• PVT < PVT Average (volume supporting downtrend)
• ROC < 0 (negative momentum)
• Close < VWMA (below volume-weighted average)
This multi-factor approach filters out weak signals and waits for
strong convergence before generating alerts.
RISK CALCULATION:
Stop Loss = Entry ± (ATR × SL Multiplier)
• Uses Average True Range for volatility measurement
• Automatically adjusts to market conditions
Take Profit Levels = Entry ± (Risk Distance × TP Multiplier × Level)
• Risk Distance = |Entry - Stop Loss|
• Creates risk-reward based targets
• Example: TP Multiplier 1.0 = 1:1, 2:2, 3:3 risk-reward
⚠️ NOTE: All risk levels are VISUAL REFERENCES for educational study.
They do not execute trades automatically.
⚙️ SETTINGS GUIDE
═══════════════════════════════════════════════════════════════════
SIGNAL SETTINGS:
• Signal Length (14): Main calculation period for averages
• Smooth Length (8): Price data smoothing period
• PVT Length (14): Price Volume Trend calculation period
• ROC Length (9): Rate of Change momentum period
RISK MANAGEMENT (Visual Only):
• ATR Length (14): Volatility measurement lookback
• SL Multiplier (2.2): Stop loss distance (× ATR)
• TP Multiplier (1.0): Risk-reward ratio per TP level
• TP Levels (1-5): Number of take profit targets to display
• Show TP/SL Lines: Toggle visual reference lines
SUPPORT & RESISTANCE:
• Pivot Lookback (10): Sensitivity for S/R detection
• Show SR: Toggle support/resistance lines
VWMA BANDS:
• VWMA Length (20): Volume-weighted average period
• Show Bands: Toggle band visibility
TREND DETECTION:
• Trend Threshold (5): Consecutive bars required for trend
PRICE LINES:
• Period (20): High/low calculation lookback
• Show: Toggle price range visualization
DISPLAY OPTIONS:
• Signals: Show/hide BUY/SELL labels
• Table: Show/hide information panel
• Color Bars: Enable trend-based bar coloring
ALERTS:
• Enable: Activate alert notifications for signals
💡 USAGE INSTRUCTIONS
═══════════════════════════════════════════════════════════════════
RECOMMENDED APPROACH:
• Works on all timeframes (1m to Monthly)
• Suitable for all markets (Stocks, Forex, Crypto, etc.)
• Best used with additional analysis and confirmation
• Always practice proper risk management
ENTRY STRATEGY:
1. Wait for BUY or SELL signal to appear
2. Check trend table for trend confirmation
3. Verify VWMA band color matches signal direction
4. Look for nearby support/resistance confluence
5. Consider entering on next candle open
6. Use visual SL level for risk management
EXIT STRATEGY:
1. Use TP levels as potential exit zones
2. Consider scaling out at multiple TP levels
3. Exit on opposite signal
4. Adjust stops as trade progresses
5. Account for spread and slippage
TREND TRADING:
• "Up Trend" → Focus on BUY signals
• "Down Trend" → Focus on SELL signals
• "Ranging" → Wait for clear trend or use range strategies
🎨 VISUAL ELEMENTS
═══════════════════════════════════════════════════════════════════
• GREEN VWMA BANDS → Bullish trend indication
• RED VWMA BANDS → Bearish trend indication
• ORANGE DASHED LINE → Entry price reference
• RED SOLID LINE → Stop loss level
• GREEN DOTTED LINES → Take profit targets
• RED DASHED LINES → Resistance levels
• GREEN DASHED LINES → Support levels
• GREY FILLED AREA → Price high/low range
• GREEN BUY LABEL → Long signal
• RED SELL LABEL → Short signal
• BLUE INFO TABLE → Current trade details
• GREEN/RED BARS → Trend direction (optional)
⚠️ IMPORTANT NOTES
═══════════════════════════════════════════════════════════════════
RISK WARNING:
• Trading involves substantial risk of loss
• You can lose more than your initial investment
• Past performance does not guarantee future results
• No indicator is 100% accurate
• Always use proper position sizing
• Never risk more than you can afford to lose
EDUCATIONAL PURPOSE:
• This tool is for learning and research
• Not a complete trading system
• Should be combined with other analysis
• Requires interpretation and context
• Test thoroughly before live use
• Consider consulting a financial advisor
TECHNICAL LIMITATIONS:
• Signals lag price action (all indicators lag)
• False signals occur in choppy markets
• Works better in trending conditions
• Support/resistance levels are approximate
• TP/SL levels are suggestions, not guarantees
📚 METHODOLOGY
═══════════════════════════════════════════════════════════════════
This indicator combines established technical analysis concepts:
• Price Volume Trend (PVT): Volume-weighted price momentum
• Rate of Change (ROC): Momentum measurement
• Volume-Weighted Moving Average (VWMA): Trend identification
• Average True Range (ATR): Volatility measurement (J. Welles Wilder)
• Pivot Points: Support/resistance detection
All methods are based on publicly available technical analysis
principles. No proprietary or "secret" algorithms are used.
⚖️ FULL DISCLAIMER
═══════════════════════════════════════════════════════════════════
LIABILITY:
The creator (Zakaria Safri) assumes NO liability for:
• Trading losses or damages of any kind
• Loss of capital or profits
• Incorrect signal interpretation
• Technical issues, bugs, or errors
• Any consequences of using this tool
USER RESPONSIBILITY:
By using this indicator, you acknowledge that:
• You are solely responsible for your trading decisions
• You understand the substantial risks involved
• You will not hold the creator liable for losses
• You will conduct your own research and analysis
• You may consult a licensed financial professional
• You are using this tool entirely at your own risk
AS-IS PROVISION:
This indicator is provided "AS IS" without warranty of any kind,
express or implied, including but not limited to warranties of
merchantability, fitness for a particular purpose, or non-infringement.
The creator is not a registered investment advisor, financial planner,
or broker-dealer. This tool is not approved or endorsed by any
financial authority.
📞 ABOUT THE CREATOR
═══════════════════════════════════════════════════════════════════
Created by: Zakaria Safri
Specialization: Technical analysis indicator development
Focus: Multi-factor analysis, risk visualization, trend detection
This is an educational tool designed to demonstrate technical
analysis concepts and multi-factor signal generation methods.
📋 VERSION INFO
═══════════════════════════════════════════════════════════════════
Version: 1.0
Platform: TradingView Pine Script v5
License: Mozilla Public License 2.0
Creator: Zakaria Safri
Year: 2024
═══════════════════════════════════════════════════════════════════
Study Carefully, Trade Wisely, Manage Risk Properly
TradeVision Pro - Educational Trading Tool
Created by Zakaria Safri
═══════════════════════════════════════════════════════════════════
In den Scripts nach "pro" suchen

Smart Structure Pro - Market Structure & Smart Money Concepts═══════════════════════════════════════════════════════════════════════════════
SMART STRUCTURE PRO
═══════════════════════════════════════════════════════════════════════════════
A comprehensive market structure analysis tool that identifies institutional trading
patterns and smart money concepts for improved trade timing and decision-making.
═══════════════════════════════════════════════════════════════════════════════
📊 WHAT IT DOES
═══════════════════════════════════════════════════════════════════════════════
This indicator automatically detects and visualizes key market structure elements:
🔹 BOS (Break of Structure)
- Identifies trend continuation patterns
- Marks when price breaks above previous highs (bullish) or below previous lows (bearish)
- Confirms trend strength and momentum
🔹 CHoCH (Change of Character)
- Detects potential trend reversals
- Alerts when market structure shifts from bullish to bearish or vice versa
- Helps identify early reversal opportunities
🔹 Order Blocks
- Highlights institutional entry zones
- Identifies the last opposite candle before a structure break
- Shows areas where smart money likely entered positions
🔹 Fair Value Gaps (FVG)
- Detects price imbalances and inefficiencies
- Shows areas where price moved rapidly leaving gaps
- Often act as support/resistance when retested
🔹 Liquidity Zones
- Marks swing high and low levels
- Identifies areas where stop losses likely cluster
- Shows potential stop hunt and liquidity grab zones
═══════════════════════════════════════════════════════════════════════════════
🎯 HOW TO USE
═══════════════════════════════════════════════════════════════════════════════
BULLISH SETUP:
1. Wait for Bullish CHoCH (trend reversal signal) or BOS ↑ (continuation)
2. Look for price to pull back into an Order Block or Fair Value Gap
3. Enter long when price bounces from these zones
4. Place stop loss below the Order Block
5. Target the next liquidity zone or resistance level
BEARISH SETUP:
1. Wait for Bearish CHoCH (trend reversal signal) or BOS ↓ (continuation)
2. Look for price to retrace into an Order Block or Fair Value Gap
3. Enter short when price rejects from these zones
4. Place stop loss above the Order Block
5. Target the next liquidity zone or support level
DASHBOARD INTERPRETATION:
• Trend: Current market direction (Bullish/Bearish)
• Volume: Confirmation strength (High volume = stronger signals)
• Signal: Latest structure break detected
• Key High/Low: Critical levels for the current trend
• Position: Price location (Premium = expensive, Discount = cheap)
═══════════════════════════════════════════════════════════════════════════════
⚙️ SETTINGS GUIDE
═══════════════════════════════════════════════════════════════════════════════
STRUCTURE DETECTION:
• Pivot Length (Default: 10)
- Lower values = More signals but potentially weaker
- Higher values = Fewer signals but stronger/more reliable
- Recommended: 8-12 for intraday, 10-15 for higher timeframes
• Structure Line Extension
- Visual preference for how far lines extend
- Does not affect signal detection
SMART MONEY CONCEPTS:
• Order Block Extension: How long OB boxes remain visible
• FVG Extension: How long gap boxes remain visible
• Min FVG Size: Filter out small gaps (0 = show all)
- Set to 10-20% to reduce noise
- Set to 0 to see all gaps
VOLUME FILTER:
• Volume Confirmation (Recommended: ON)
- Filters weak signals without volume support
- Reduces false breakouts
• Volume Multiplier (Default: 1.5)
- Higher = Stricter filtering (fewer but stronger signals)
- Lower = More signals (but may include weak ones)
DISPLAY:
• Dashboard: Toggle information panel
• Trend Background: Subtle color tint showing current trend
• Dashboard Position: Choose corner placement
═══════════════════════════════════════════════════════════════════════════════
🔔 ALERTS
═══════════════════════════════════════════════════════════════════════════════
Available alert conditions:
✓ Bullish BOS - Uptrend continuation confirmed
✓ Bearish BOS - Downtrend continuation confirmed
✓ Bullish CHoCH - Reversal to uptrend detected
✓ Bearish CHoCH - Reversal to downtrend detected
✓ Structure Break - Any significant market structure change
To set up alerts:
1. Click the "⏰" alert icon
2. Select "Smart Structure Pro"
3. Choose your desired condition
4. Configure notification method
5. Click "Create"
═══════════════════════════════════════════════════════════════════════════════
⚠️ IMPORTANT DISCLOSURES
═══════════════════════════════════════════════════════════════════════════════
REPAINTING BEHAVIOR:
• Pivot points WILL repaint until confirmed (this is by design and unavoidable)
• Structure breaks (BOS/CHoCH) use CLOSED candles and do NOT repaint after confirmation
• Order Blocks and FVGs are drawn on confirmed signals and do NOT repaint
• All signals wait for candle close before triggering
BEST PRACTICES:
• Use on higher timeframes (15min+) for more reliable signals
• Combine with other analysis (support/resistance, volume profile, etc.)
• Wait for candle close confirmation before acting on signals
• Use proper risk management - this is not a standalone trading system
• Backtest on your preferred instrument and timeframe
PERFORMANCE:
• Limited to 100 boxes, 100 lines, 100 labels for optimal performance
• Older objects automatically removed as new ones appear
• Works on all markets (Forex, Crypto, Stocks, Indices, Commodities)
═══════════════════════════════════════════════════════════════════════════════
📚 CONCEPTS EXPLAINED
═══════════════════════════════════════════════════════════════════════════════
MARKET STRUCTURE:
Market structure refers to the pattern of price movements creating swing highs
and lows. Understanding structure helps identify trend direction and potential
reversal points.
SMART MONEY CONCEPTS:
These are trading techniques based on tracking institutional order flow and
understanding where large players (banks, funds, institutions) enter and exit
positions.
ORDER BLOCKS:
The last opposing candle before a strong directional move. Institutions often
leave unfilled orders in these zones, which can act as support/resistance when
price returns.
FAIR VALUE GAPS:
Areas where price moved so quickly that it left an imbalance. These gaps often
get "filled" as price returns to find equilibrium, creating trading opportunities.
═══════════════════════════════════════════════════════════════════════════════
🎓 EDUCATIONAL VALUE
═══════════════════════════════════════════════════════════════════════════════
This indicator helps traders:
✓ Understand market structure mechanics
✓ Identify institutional trading patterns
✓ Improve trade timing and entry precision
✓ Recognize trend continuation vs reversal
✓ Learn smart money concepts through visualization
═══════════════════════════════════════════════════════════════════════════════
📋 TECHNICAL DETAILS
═══════════════════════════════════════════════════════════════════════════════
• Version: 1.0.0
• Pine Script Version: 5
• Indicator Type: Overlay
• No Repainting: Structure breaks use confirmed candles
• Performance Optimized: Limited drawing objects
• Works On: All markets and timeframes
• Alerts: Yes, fully customizable
═══════════════════════════════════════════════════════════════════════════════
👤 AUTHOR
═══════════════════════════════════════════════════════════════════════════════
Created by: Zakaria Safri
Original Work: All code and concepts are original implementations
Based On: ICT (Inner Circle Trader) educational concepts
License: © 2024 Zakaria Safri - Personal Use Only
═══════════════════════════════════════════════════════════════════════════════
⚖️ DISCLAIMER
═══════════════════════════════════════════════════════════════════════════════
This indicator is for educational and informational purposes only. It does not
constitute financial advice. Trading involves substantial risk of loss. Past
performance does not guarantee future results. Always conduct your own research
and consult with a licensed financial advisor before making trading decisions.
The author is not responsible for any losses incurred from using this indicator.
═══════════════════════════════════════════════════════════════════════════════
If you find this indicator helpful, please:
👍 Like and favorite
⭐ Leave a review
📢 Share with other traders
💬 Comment with feedback or suggestions
Happy Trading! 📈

TrendShield Pro | DinkanWorldSmart Trailing Trend System Powered by EMA + ATR
TrendShield Pro is a powerful trend detection and trailing stop indicator designed for traders who rely on pure price movement and volatility tracking.
It dynamically adapts to market conditions using a combination of EMA (Exponential Moving Average) and ATR (Average True Range) to identify the active trend and place a visual trailing stop line.
🔍 How It Works
TrendShield Pro combines trend direction and volatility to create a self-adjusting trailing system:
EMA (Exponential Moving Average):
Smooths price fluctuations and identifies the overall market bias.
ATR (Average True Range):
Measures volatility to determine how far the trailing stop should follow the trend.
Dynamic Bands:
Two invisible thresholds are formed — up and down — around the EMA using the ATR and your chosen Factor value.
Trailing Logic:
When the EMA is rising, the Trailing Stop (TUp) locks in higher lows.
When the EMA is falling, the Trailing Stop (TDown) locks in lower highs.
The indicator switches trend automatically based on price crossing these trailing levels.
🧭 Visuals & Features
Green Trailing Line (Demand Trend): Indicates an active bullish trend.
Red Trailing Line (Supply Trend): Indicates an active bearish trend.
Arrow Signals:
🟢 Up Arrow → Bullish Trend Reversal
🔴 Down Arrow → Bearish Trend Reversal
Diamond Markers: Show points where the trailing line shifts, marking dynamic volatility changes.
⚙️ Inputs
Input Description
EMA Period Length of the Exponential Moving Average
ATR Period Period used for Average True Range calculation
Factor Multiplier for ATR-based volatility expansion

ALMASTO – Pro Trend & Momentum (v1.1)ALMASTO — Pro Trend & Momentum Strategy
Description:
This strategy is designed for precision trading in both Forex (FX) and Crypto markets.
It combines multi-timeframe trend confirmation (EMA200), momentum filters (RSI, MACD, ADX), and ATR-based dynamic risk management.
ALMASTO — Pro Trend & Momentum Strategy automatically manages take-profit levels, stop-loss, and breakeven adjustments once TP1 is reached — providing a structured and emotion-free trading approach.
Optimal Use
Works best on lower timeframes (5m–15m) with strong liquidity sessions.
Optimized for pairs like EURUSD, XAUUSD, and BTCUSDT.
Built for trend-following setups and momentum reversals with high volatility confirmation.
Recommended Settings
🔹 Forex – 5m
EMA Fast = 34, EMA Slow = 200, HTF = 1H
RSI (14): Long ≥ 55 / Short ≤ 45
MACD (8 / 21 / 5), ADX Len 10 / Min 27
ATR Len 7, Stop Loss = ATR × 2.1
TP1 = 1.1 RR, TP2 = 2.3 RR
Session = 07:00–11:00 & 12:30–16:00 (Exchange Time)
Risk = 0.8% per trade
🔹 Forex – 15m
EMA Fast = 50, EMA Slow = 200, HTF = 4H
RSI (14): Long ≥ 53 / Short ≤ 47
MACD (12 / 26 / 9), ADX Min 24
ATR Len 10, SL = ATR × 1.9
TP1 = 1.2 RR, TP2 = 2.6 RR
Risk = 1.0% per trade
🔹 Crypto – 5m (BTC/USDT)
EMA Fast = 34, EMA Slow = 200, HTF = 4H
RSI (14): Long ≥ 56 / Short ≤ 44
MACD (8 / 21 / 5), ADX Min 30
ATR Len 7, SL = ATR × 2.2
TP1 = 1.0 RR, TP2 = 2.5 RR
Session = 00:00–06:00 & 12:00–22:00 (UTC)
Risk = 0.5% per trade
Core Features
✅ Auto breakeven after TP1
✅ Dual take-profit system (1:1 & 1:2 RR)
✅ ATR-based stop & trailing logic
✅ Filters for session time, volume, and volatility
✅ Candle-body vs ATR size filter to avoid noise
✅ Optional cooldown between trades
Important Notes
Use bar close confirmation only (barstate.isconfirmed) to avoid repainting on lower timeframes.
Adjust commission (0.01–0.03%) and slippage (1–2 ticks) in Strategy Tester for realistic results.
Avoid low-liquidity hours (after 21:00 UTC for FX / after midnight for crypto).
Backtest using realistic broker data (e.g., BlackBull Markets / Bybit / Binance Futures).
Best results occur during London & New York sessions with moderate volatility.
⚠️ Disclaimer
This script is for educational and research purposes only.
It does not constitute financial advice.
Use proper risk management and test thoroughly before using on live accounts.
Developed by KING FX Labs
Built and optimized by Yousef Almasto — combining advanced price-action logic, multi-timeframe EMA structure, and volatility-adaptive ATR management.
Tested across Forex, Gold, and Crypto markets to ensure consistent performance and minimal drawdown.
📈 “Precision Trading. Zero Emotion. Pure Momentum.”

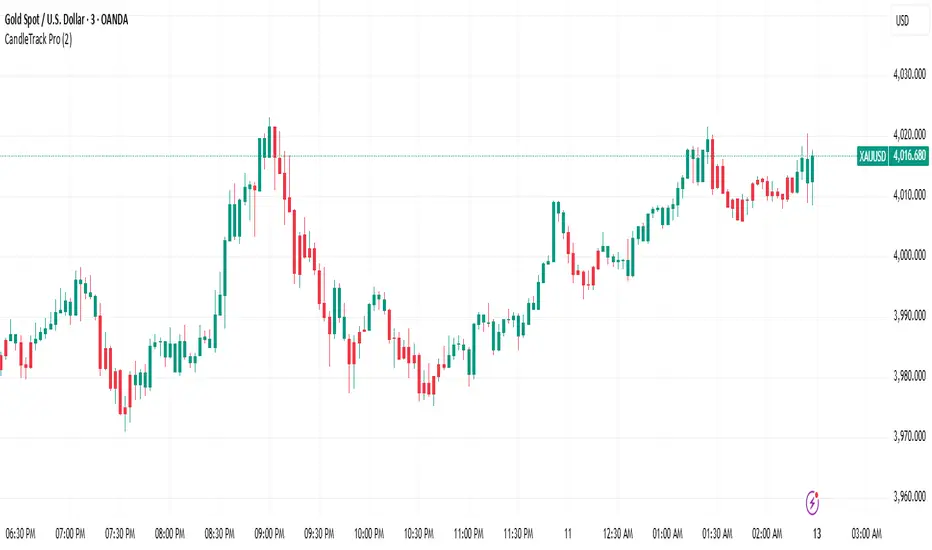
CandleTrack Pro | Pure Price Action Trend Detection📖 CandleTrack Pro | Pure Price Action Trend Detection
CandleTrack Pro is a clean, non-repainting trend detection tool built purely on price action logic.
It uses a dynamic ATR-based trailing system to detect trend shifts while keeping the chart visually simple.
🧠 How It Works
Tracks volatility using ATR.
Identifies trend shifts when price crosses trailing stops.
Highlights bullish and bearish bars visually for easy reading.
⚙️ Inputs
ATR Sensitivity: Controls how fast the trend adapts.
Use High/Low for Stop: Enables candle wick–based structure tracking.
📊 Ideal For
Traders who want a minimalist price action view with clear trend direction — no clutter, no lagging oscillators.
⚠️ Disclaimer
This script is for educational and technical analysis purposes only.
It is not financial advice. Always confirm setups using your own judgment and risk management.
FVG Scanner ProFVG Scanner Pro — Smart Fair Value Gap Detector (with HTF context & proximity alerts)
What it does
FVG Scanner Pro automatically finds Fair Value Gaps (FVGs) on your current chart and (optionally) on a higher timeframe (HTF), draws them as color-coded zones, and notifies you when price comes close to a gap boundary using an ADR-based proximity trigger and (optional) volume confirmation. It’s designed for ICT-style gap trading, confluence building, and clean visual execution.
How it works:
FVG definition
* Bullish FVG (gap up): low > high (the current candle’s low is above the high 2 bars ago).
* Bearish FVG (gap down): high < low (the current candle’s high is below the low 2 bars ago).
* Gaps smaller than your Min FVG Size (%) are ignored. (Gap size = (top-bottom)/bottom * 100.)
Higher-timeframe logic (auto-selected)
The script auto picks a sensible HTF:
1–5m → 15m, 15m → 1H, 1H → 4H, 4H → 1D, 1D → 1W, 1W → 1M, small 1M → 3M, big ≥3M → 12M.
You can display HTF FVGs and even filter so current-TF FVGs only show when they overlap an HTF gap.
Proximity alerts (ADR-based)
The script computes ADR on the current chart timeframe over a user-set lookback (default 20 bars).
An alert fires when price moves toward the closest actionable boundary and comes within ADR × Multiplier:
Bullish: price moving down, within distance of the bottom of a bullish FVG.
Bearish: price moving up, within distance of the top of a bearish FVG.
Yellow ▲/▼ markers show where a proximity alert triggered.
Volume filter (optional)
Require volume to be greater than SMA(20) × multiplier to accept a newly formed FVG.
Lifecycle
Each gap remains active for Extend FVG Box (Bars) bars.
You can delete the box after fill, or keep filled gaps visible as gray zones, or hide them.
Color legend
Current-TF Bullish: Pink/Magenta box
Current-TF Bearish: Cyan/Turquoise box
HTF Bullish: Gold box
HTF Bearish: Orange box
Filled (if shown): Gray box
Alert markers: Yellow ▲ (bullish), Yellow ▼ (bearish)
Inputs (what to tweak)
Show FVGs: Bullish / Bearish / Both
Max Bars Back to Find FVG: collection window & cleanup guard
Extend FVG Box (Bars): how long a zone stays tradable/active
Min FVG Size (%): ignore micro gaps
Delete Box After Fill & Show Filled FVGs: choose how you want completed gaps handled
Show Alert Markers: show/hide the yellow proximity arrows
Show Higher Timeframe FVG: overlay HTF gaps (auto TF)
HTF Filter: only display current-TF gaps that overlap an HTF gap
ADR Lookback & Proximity Multiplier: tune alert sensitivity to your market & timeframe
Volume Filter & Volume > MA Multiple: require above-average volume for new gaps
Built-in alerts (ready to use)
Create alerts in TradingView (⚠️ “Once per bar” or “Once per bar close”, your choice) and select from:
🟢 Bullish FVG Proximity — price approaching a bullish gap bottom
🔴 Bearish FVG Proximity — price approaching a bearish gap top
✅ New Bullish FVG Formed
⚠️ New Bearish FVG Formed
The alert messages include the symbol and price; proximity markers are also plotted on chart.
Tips & best practices
Use FVGs with market structure (break of structure, swing points), order blocks, or liquidity pools for confluence.
On very low timeframes, raise Min FVG Size and/or lower Max Bars Back to reduce noise and keep things fast.
Extend FVG Box controls how long a zone is considered valid; align it with your holding horizon (scalp vs swing).
Information panel (top-right)
Shows your mode, current HTF, number of gaps in memory, active bull/bear counts, and current-TF ADR.

Katana_Fox RSI Pro - Advanced Momentum Indicator with Clear BUOverview:
Connors RSI Pro is a sophisticated enhancement of the classic Connors RSI indicator, designed for traders who demand professional-grade tools. This premium version combines multiple momentum components with intelligent signaling and beautiful visualization to give you an edge in the markets.
Key Features:
🎯 Clear BUY/SELL Signal System
BUY signals in green when CRSI crosses above oversold level
SELL signals in red when CRSI crosses below overbought level
Clean, professional labels that are easy to read
Customizable overbought/oversold levels (70/30 default)
🎨 Professional Visualization
Modern color scheme that adapts to market conditions
Customizable background fills for better readability
Smooth, easy-to-read line plotting
⚡ Enhanced Calculations
Triple-component momentum analysis (RSI, UpDown RSI, Percent Rank)
EMA smoothing for reduced noise and false signals
Configurable lengths for each component
🔔 Advanced Alert System
4 distinct alert conditions for various market scenarios
Compatible with TradingView's native alert system
Perfect for automated trading strategies
Input Parameters:
RSI Length (3): Period for standard RSI calculation
UpDown Length (2): Period for UpDown RSI component
ROC Length (100): Period for Rate of Change percentile ranking
Signal Alerts: Toggle BUY/SELL signals on/off
Custom Colors: Choose between classic and modern color schemes
Trading Signals:
BUY (Green Label): Bullish signal when CRSI crosses above oversold level
SELL (Red Label): Bearish signal when CRSI crosses below overbought level
Background Colors: Visual zones indicating momentum strength
Ideal For:
Swing traders seeking momentum reversals
Day traders looking for overbought/oversold conditions
Algorithmic traders needing reliable signals
Technical analysts wanting multi-timeframe confirmation
How to Use:
Oversold Bounce: Enter long when CRSI shows BUY signal above 30
Overbought Rejection: Enter short when CRSI shows SELL signal below 70
Trend Confirmation: Use the 50-level crossover for trend direction
Divergence Trading: Look for price/indicator divergences at extremes
Upgrade your trading arsenal with Connors RSI Pro - where professional analytics meet clear trading signals!

ORB + Session VWAP Pro (London & NY) — fixedORB + Session VWAP Pro (London & NY) — Listing copy (EN)
What it is
A clean, non-repainting intraday tool that fuses the classic Opening Range Breakout (ORB) with a session-anchored VWAP filter for London and New York. It highlights only the higher-quality breakouts (above/below session VWAP), adds an optional retest confirmation, and scores each signal with an intuitive Confidence metric (0–100).
Why it works
• ORB provides the day’s first actionable structure (range high/low).
• Session VWAP filters “cheap” breaks and favors flows aligned with session value.
• Optional retest reduces first-tick whipsaws.
• Confidence blends breakout depth (vs ATR), VWAP slope and band distance.
Key visuals
• LDN/NY OR High/Low (line break style) + optional OR boxes.
• Active Session VWAP (resets per signal window; falls back to daily VWAP outside).
• Optional VWAP bands (stdev or %).
• Session shading (London/NY windows).
• Signal markers (LDN BUY/SELL, NY BUY/SELL) fired with cooldown.
Signals
• London Long / Short: Break of LDN OR High/Low ± ATR buffer, aligned with VWAP side.
• NY Long / Short: Same logic during NY window.
• Retest (optional): Requires a tag back to the OR level ± tolerance before confirmation.
• Confidence: 0–100; gate via Min Confidence (default 55).
Inputs that matter
• Open Range Length (min): Default 15.
• London/NY times & timezones.
• ATR buffer & retest tolerance.
• Bands mode: Stdev (with lookback) or % (e.g., 1%).
• Signal cooldown: Avoids clutter on fast moves.
Non-repaint policy
• OR lines build within fixed time windows using the current bar’s timestamp.
• VWAP is cumulative within the session window; no lookahead.
• All ta.crossover/ta.crossunder are precomputed every bar (no conditional execution).
• Signals are based on live bar values, not future bars.
⸻
Quick start (examples)
1) EURUSD, London momentum
• Chart: 5m or 15m.
• OR: 15 min starting 08:00 Europe/London.
• Signals: Use defaults; keep ATR buffer = 0.2 and Retest = ON, Min Confidence ≥ 55.
• Play:
• BUY when price breaks LDN OR High + buffer and stays above VWAP; retest confirms.
• Trail behind VWAP or band #1; partials into band #2.
2) NAS100, New York breakout & run
• Chart: 5m.
• NY window: 09:30 America/New_York, OR = 15 min.
• Retest OFF on high momentum days; Min Confidence ≥ 60.
• Use band mode Stdev, bandLen=50, show ±1/±2.
• Momentum continuation: add on pullbacks that hold above VWAP after the breakout.
3) XAUUSD, London fake & VWAP fade
• Chart: 5m.
• Keep Retest ON; accept only shorts that break OR Low but retest fails back under VWAP.
• Confidence gate ≥ 50 to allow more mean-reversion setups.
⸻
Pro tips
• Adjust ATR buffer to the instrument: FX 0.15–0.25, indices 0.20–0.35, metals 0.20–0.30.
• Retest ON for choppy conditions; OFF for news momentum.
• Use VWAP bands: take partials at ±1; stretch targets at ±2/±3.
• Session timezones are explicit (London/New York). Ensure they match your instrument’s behavior.
• Pair with a higher-TF bias (e.g., 1H/4H trend) for directional filtering.
⸻
Alerts (ready to use)
• ORB+SVWAP — LDN Long, LDN Short, NY Long, NY Short
(Respect your cooldown; alerts fire only after confirmation and confidence gate.)
⸻
Known limits & notes
• Designed for intraday. On 1D+ charts, session windows compress.
• If your broker session differs from London/NY clocks on a holiday, adjust input times.
• Session-anchored VWAP uses the script’s signal window, not exchange sessions, by design.

Liquidity Pro Map [ChartPrime]⯁ OVERVIEW
Liquidity Pro Map is a market-structure tool that simulates liquidity distribution by splitting price history into buy-side and sell-side profiles. Using candle volume and the standard deviation of close, the indicator builds two mirrored volume maps on the right-hand side of the chart. It also extends liquidity levels backwards in time until they are crossed by price, allowing you to see which zones remain untouched and where liquidity is most likely resting. Cumulative skew lines and highlighted POC levels give additional clarity on imbalance between buyers and sellers.
⯁ KEY FEATURES
Dual Liquidity Profiles: The chart is divided into buy-side (green) and sell-side (red) liquidity profiles, letting you instantly compare both sides of order flow.
Level Extension Logic: Each liquidity level is extended back in time until price crosses it. If not crossed, it persists all the way to the indicator’s lookback period, marking zones that remain “untapped.”
Dynamic Binning with Standard Deviation: The indicator distributes candle volumes into bins using close-price deviation, creating a more realistic liquidity map than static price levels.
priceDeviation = ta.stdev(close, 25) * 2
priceReference = close > open ? low - priceDeviation : high + priceDeviation
Cumulative Volume Skew Lines: Polylines on the right-hand side show the aggregated buy and sell volume profiles, making it easy to spot imbalance.
POC Identification: Highest-volume levels on both sides are marked as POC (Point of Control) , providing key zones of interest.
Clear Color Coding: Gradient shading intensifies with volume concentration—dark teal/green for buy zones, dark pink/red for sell zones.
⯁ HOW IT WORKS (UNDER THE HOOD)
Volume Distribution: Each bar’s volume is assigned to a price bin based on its reference price (close ± standard deviation offset).
Buy vs. Sell Splitting: If bins above last close price, volume is allocated to sell-side liquidity; otherwise, it’s allocated to buy-side liquidity.
Level Extension: Boxes marking liquidity bins extend back until crossed by price. If uncrossed, they anchor all the way to the start of the lookback window.
Cumulative Polylines: As bins are stacked, cumulative buy and sell values form skew polylines plotted at the right edge.
POC Levels: The highest-volume bin on each side is highlighted with labels and arrows, marking where the heaviest liquidity is concentrated.
⯁ USAGE
Use buy/sell profiles to see where liquidity is likely resting. Green shelves suggest potential support zones; red shelves suggest resistance or sell liquidity pools.
Watch untouched extended levels —these often become magnets for price as liquidity is swept.
Track POC levels as primary liquidity targets, where reactions or fakeouts are most common.
Compare cumulative skew lines to judge which side dominates in volume. Heavy buy skew may indicate absorption of sell pressure, and vice versa.
Adjust lookback period to switch between intraday liquidity maps and larger swing-based profiles.
Use separator feature to hide bins borders for better visual clarity.
Use as a confluence tool with OBs, support/resistance, and liquidity sweep setups.
⯁ CONCLUSION
Liquidity Pro Map transforms candle volume into a structured simulation of where liquidity may rest across the chart. By dividing buy vs. sell profiles, extending untouched levels, and marking cumulative skew and POC, it equips traders with a clear visual map of potential liquidity pools. This allows for better anticipation of sweeps, reversals, and areas of high market activity.

MGY Smart Fibonacci ProMGY Smart Fibonacci Pro Indicator
Overview:
MGY Smart Fibonacci Pro is an advanced multi-timeframe Fibonacci indicator that automatically adapts to your current chart timeframe. It intelligently displays the most relevant Fibonacci retracement levels based on the higher timeframes, providing traders with dynamic support and resistance levels.

EMA inFusion Pro - Multiple SourcesEMA Fusion Pro: Dynamic Trend & Momentum Strategy with Three Exit Modes
EMA Fusion Pro is a highly customizable, multi-exit trend-following strategy designed for traders who value both precision and flexibility. By leveraging exponential moving averages (EMA), average directional index (ADX), and volume analysis, this strategy aims to capture trending market moves while offering three distinct exit modes for optimal risk management across varying market conditions.
Strategy Overview
This strategy systematically identifies potential entry points using a moving average crossover with highly configurable data sources (including price, volume, rate of change, or their Heikin Ashi versions) and filters signal quality with ADX trend strength and volume spikes. Each trade is managed with one of three advanced exit methodologies—reverse signal, ATR-based stop/take profit, or fixed percentage—giving you the control to adapt your risk profile to different market regimes.
Key Features
Customizable EMA Source: Calculate the core trend-filtering EMA from price (default), volume, rate of change, or their Heikin Ashi counterparts for unique market perspectives.
Trend Filter with ADX: Confirm entries only when the trend is strong, as measured by the user-adjustable ADX threshold.
Volume Spike Confirmation: Optional filter to only take trades with above-average volume activity, reducing false signals.
Three Exit Modes:
Reverse Signal: Exit trades when a new, opposite entry signal occurs.
ATR-Based Stop/Take Profit: Dynamic risk management using multiples of the average true range (ATR) for both take profit and stop loss.
Percent-Based Stop/Take Profit: Fixed-percentage risk management with user-defined thresholds.
Visual Annotations: Signal markers, EMA line color-coded by source, trend background coloring, and optional ATR/percent-based TP/SL levels.
Info Panel: Real-time display of all core indicators, current trading mode, exit parameters, and position status for quick oversight.
How It Works
Entry Logic: A crossover signal (above/below the EMA) triggers a new entry, but only if both ADX trend strength and (optionally) volume spike conditions are met.
Exit Logic: Three selectable modes allow you to exit trades on reverse signals, at a dynamic ATR-based profit or loss, or at a fixed percentage gain/loss.
Flexible Data Analysis: The EMA source can be chosen from six options—standard price, volume, rate of change, or their Heikin Ashi variants—allowing experimentation with different market dimensions.
Risk Management: All exits are precisely controlled, either by the next opposing signal, by volatility-adjusted levels, or by fixed risk/reward ratios.
Backtest & Optimization: The strategy is fully backtestable within TradingView’s Strategy Tester, with adjustable parameters for optimization.
Customization & Usage
Indicator Source: Select your preferred data type for EMA calculation, opening the door to creative strategy variations (e.g., volume momentum, pure price trend, rate of change divergence).
Filter Toggles: Enable/disable ADX and volume filters as desired—useful for different market environments.
Exit Mode Selection: Switch between reverse, ATR, or percent-based exits with a single parameter—ideal for adapting to ranging vs. trending markets.
Visual Clarity: The EMA line color reflects its underlying source, and the info panel summarizes all critical values for easy monitoring.
Who Should Use This Strategy?
Trend Followers seeking to ride strong moves with multiple exit options.
Experienced Traders who want to experiment with different data types (volume, momentum, Heikin Ashi) for trend analysis.
Algorithmic Traders looking for a robust, flexible base to build upon with their own ideas.
Getting Started
Apply the script to your chart and review default settings.
Customize parameters—EMA length, ADX threshold, volume settings, exit type—as desired.
Backtest on multiple instruments and timeframes to evaluate performance.
Optimize filters, exit rules, and risk parameters for your preferred trading style.
Monitor with the real-time info panel and trade alerts.
Disclaimer
This script is for educational and entertainment purposes only. It is not financial advice. Past performance is not indicative of future results. Always conduct thorough testing and consider your risk tolerance before trading real capital.
— Happy Trading —
Feel free to adapt, share, and contribute to this open-source strategy!

HorizonSigma Pro [CHE]HorizonSigma Pro
Disclaimer
Not every timeframe will yield good results . Very short charts are dominated by microstructure noise, spreads, and slippage; signals can flip and the tradable edge shrinks after costs. Very high timeframes adapt more slowly, provide fewer samples, and can lag regime shifts. When you change timeframe, you also change the ratios between horizon, lookbacks, and correlation windows—what works on M5 won’t automatically hold on H1 or D1. Liquidity, session effects (overnight gaps, news bursts), and volatility do not scale linearly with time. Always validate per symbol and timeframe, then retune horizon, z-length, correlation window, and either the neutral band or the z-threshold. On fast charts, “components” mode adapts quicker; on slower charts, “super” reduces noise. Keep prior-shift and calibration enabled, monitor Hit Rate with its confidence interval and the Brier score, and execute only on confirmed (closed-bar) values.
For example, what do “UP 61%” and “DOWN 21%” mean?
“UP 61%” is the model’s estimated probability that the close will be higher after your selected horizon—directional probability, not a price target or profit guarantee. “DOWN 21%” still reports the probability of up; here it’s 21%, which implies 79% for down (a short bias). The label switches to “DOWN” because the probability falls below your short threshold. With a neutral-band policy, for example ±7%, signals are: Long above 57%, Short below 43%, Neutral in between. In z-score mode, fixed z-cutoffs drive the call instead of percentages. The arrow length on the chart is an ATR-scaled projection to visualize reach; treat it as guidance, not a promise.
Part 1 — Scientific description
Objective.
The indicator estimates the probability that price will be higher after a user-defined horizon (a chosen number of bars) and emits long, short, or neutral decisions under explicit thresholds. It combines multi‑feature, z‑normalized inputs, adaptive correlation‑based weighting, a prior‑shifted sigmoid mapping, optional rolling probability calibration, and repaint‑safe confirmation. It also visualizes an ATR‑scaled forward projection and prints a compact statistics panel.
Data and labeling.
For each bar, the target label is whether price increased over the past chosen horizon. Learning is deliberately backward‑looking to avoid look‑ahead: features are associated with outcomes that are only known after that horizon has elapsed.
Feature engineering.
The feature set includes momentum, RSI, stochastic %K, MACD histogram slope, a normalized EMA(20/50) trend spread, ATR as a share of price, Bollinger Band width, and volume normalized by its moving average. All features are standardized over rolling windows. A compressed “super‑feature” is available that aggregates core trend and momentum components while penalizing excessive width (volatility). Users can switch between a “components” mode (weighted sum of individual features) and a “super” mode (single compressed driver).
Weighting and learning.
Weights are the rolling correlations between features (evaluated one horizon ago) and realized directional outcomes, smoothed by an EMA and optionally clamped to a bounded range to stabilize outliers. This produces an adaptive, regime‑aware weighting without explicit machine‑learning libraries.
Scoring and probability mapping.
The raw score is either the weighted component sum or the weighted super‑feature. The score is standardized again and passed through a sigmoid whose steepness is user‑controlled. A “prior shift” moves the sigmoid’s midpoint to the current base rate of up moves, estimated over the evaluation window, so that probabilities remain well‑calibrated when markets drift bullish or bearish. Probabilities and standardized scores are EMA‑smoothed for stability.
Decision policy.
Two modes are supported:
- Neutral band: go long if the probability is above one half plus a user‑set band; go short if it is below one half minus that band; otherwise stay neutral.
- Z‑score thresholds: use symmetric positive/negative cutoffs on the standardized score to trigger long/short.
Repaint protection.
All values used for decisions can be locked to confirmed (closed) bars. Intrabar updates are available as a preview, but confirmed values drive evaluation and stats.
Calibration.
An optional rolling linear calibration maps past confirmed probabilities to realized outcomes over the evaluation window. The mapping is clipped to the unit interval and can be injected back into the decision logic if desired. This improves reliability (probabilities that “mean what they say”) without necessarily improving raw separability.
Evaluation metrics.
The table reports: hit rate on signaled bars; a Wilson confidence interval for that hit rate at a chosen confidence level; Brier score as a measure of probability accuracy; counts of long/short trades; average realized return by side; profit factor; net return; and exposure (signal density). All are computed on rolling windows consistent with the learning scheme.
Visualization.
On the chart, an arrowed projection shows the predicted direction from the current bar to the chosen horizon, with magnitude scaled by ATR (optionally scaled by the square‑root of the horizon). Labels display either the decision probability or the standardized score. Neutral states can display a configurable icon for immediate recognition.
Computational properties.
The design relies on rolling means, standard deviations, correlations, and EMAs. Per‑bar cost is constant with respect to history length, and memory is constant per tracked series. Graphical objects are updated in place to obey platform limits.
Assumptions and limitations.
The method is correlation‑based and will adapt after regime changes, not before them. Calibration improves probability reliability but not necessarily ranking power. Intrabar previews are non‑binding and should not be evaluated as historical performance.
Part 2 — Trader‑facing description
What it does.
This tool tells you how likely price is to be higher after your chosen number of bars and converts that into Long / Short / Neutral calls. It learns, in real time, which components—momentum, trend, volatility, breadth, and volume—matter now, adjusts their weights, and shows you a probability line plus a forward arrow scaled by volatility.
How to set it up.
1) Choose your horizon. Intraday scalps: 5–10 bars. Swings: 10–30 bars. The default of 14 bars is a balanced starting point.
2) Pick a feature mode.
- components: granular and fast to adapt when leadership rotates between signals.
- super: cleaner single driver; less noise, slightly slower to react.
3) Decide how signals are triggered.
- Neutral band (probability based): intuitive and easy to tune. Widen the band for fewer, higher‑quality trades; tighten to catch more moves.
- Z‑score thresholds: consistent numeric cutoffs that ignore base‑rate drift.
4) Keep reliability helpers on. Leave prior shift and calibration enabled to stabilize probabilities across bullish/bearish regimes.
5) Smoothing. A short EMA on the probability or score reduces whipsaws while preserving turns.
6) Overlay. The arrow shows the call and a volatility‑scaled reach for the next horizon. Treat it as guidance, not a promise.
Reading the stats table.
- Hit Rate with a confidence interval: your recent accuracy with an uncertainty range; trust the range, not only the point.
- Brier Score: lower is better; it checks whether a stated “70%” really behaves like 70% over time.
- Profit Factor, Net Return, Exposure: quick triage of tradability and signal density.
- Average Return by Side: sanity‑check that the long and short calls each pull their weight.
Typical adjustments.
- Too many trades? Increase the neutral band or raise the z‑threshold.
- Missing the move? Tighten the band, or switch to components mode to react faster.
- Choppy timeframe? Lengthen the z‑score and correlation windows; keep calibration on.
- Volatility regime change? Revisit the ATR multiplier and enable square‑root scaling of horizon.
Execution and risk.
- Size positions by volatility (ATR‑based sizing works well).
- Enter on confirmed values; use intrabar previews only as early signals.
- Combine with your market structure (levels, liquidity zones). This model is statistical, not clairvoyant.
What it is not.
Not a black‑box machine‑learning model. It is transparent, correlation‑weighted technical analysis with strong attention to probability reliability and repaint safety.
Suggested defaults (robust starting point).
- Horizon 14; components mode; weight EMA 10; correlation window 500; z‑length 200.
- Neutral band around seven percentage points, or z‑threshold around one‑third of a standard deviation.
- Prior shift ON, Calibration ON, Use calibrated for decisions OFF to start.
- ATR multiplier 1.0; square‑root horizon scaling ON; EMA smoothing 3.
- Confidence setting equivalent to about 95%.
Disclaimer
No indicator guarantees profits. HorizonSigma Pro is a decision aid; always combine with solid risk management and your own judgment. Backtest, forward test, and size responsibly.
The content provided, including all code and materials, is strictly for educational and informational purposes only. It is not intended as, and should not be interpreted as, financial advice, a recommendation to buy or sell any financial instrument, or an offer of any financial product or service. All strategies, tools, and examples discussed are provided for illustrative purposes to demonstrate coding techniques and the functionality of Pine Script within a trading context.
Any results from strategies or tools provided are hypothetical, and past performance is not indicative of future results. Trading and investing involve high risk, including the potential loss of principal, and may not be suitable for all individuals. Before making any trading decisions, please consult with a qualified financial professional to understand the risks involved.
By using this script, you acknowledge and agree that any trading decisions are made solely at your discretion and risk.
Enhance your trading precision and confidence 🚀
Best regards
Chervolino

Signal Hunter Pro - GKDXLSignal Hunter Pro - GKDXL combines four powerful technical indicators with trend strength filtering and volume confirmation to generate reliable BUY/SELL signals. This indicator is perfect for traders who want a systematic approach to market analysis without the noise of conflicting signals.
🔧 Core Features
📈 Multi-Indicator Signal System
Moving Averages: EMA 20, EMA 50, and SMA 200 for trend analysis
Bollinger Bands: Dynamic support/resistance with price momentum detection
RSI: Enhanced RSI logic with smoothing and multi-zone analysis
MACD: Traditional MACD with signal line crossovers and zero-line analysis
🎛️ Advanced Filtering System
ADX Trend Strength Filter: Only signals when trend strength exceeds threshold
Volume Confirmation: Ensures signals occur with adequate volume participation
Multi-Timeframe Logic: Works on any timeframe from 1m to 1D and beyond
🚨 Intelligent Signal Generation
Requires 3 out of 4 indicators to align for signal confirmation
Separate bullish and bearish signal conditions
Real-time signal strength scoring (1/4 to 4/4)
Built-in alert system for automated notifications
⚙️ Customizable Parameters
📊 Technical Settings
Moving Averages: Adjustable EMA and SMA periods
Bollinger Bands: Configurable length and multiplier
RSI: Customizable length, smoothing, and overbought/oversold levels
MACD: Flexible fast, slow, and signal line settings
🎯 Risk Management
Risk Percentage: Set your risk per trade (0.1% to 10%)
Reward Ratio: Configure risk-to-reward ratios (1:1 to 1:5)
ADX Threshold: Control minimum trend strength requirements
🖥️ Display Options
Indicator Visibility: Toggle individual indicators on/off
Information Table: Optional detailed status table (off by default)
Volume Analysis: Real-time volume vs. average comparison
🎨 Visual Elements
📈 Chart Indicators
EMA Lines: Blue (20) and Orange (50) exponential moving averages
SMA 200: Gray long-term trend line
Bollinger Bands: Upper/lower bands with semi-transparent fill
Clean Interface: Minimal visual clutter for clear analysis
📋 Information Table (Optional)
Real-time indicator status with ✓/✗/— symbols
Current signal strength and direction
ADX trend strength measurement
Volume confirmation status
No-signal reasons when conditions aren't met
🔔 Alert System
📢 Three Alert Types
BUY Signal: Triggered when 3+ indicators align bullishly
SELL Signal: Triggered when 3+ indicators align bearishly
General Alert: Any signal detection for broader monitoring
📱 Alert Messages
Clear, actionable alert text
Includes indicator name for easy identification
Compatible with webhook integrations
🎯 How It Works
📊 Signal Logic
Indicator Assessment: Each of the 4 indicators is evaluated as Bullish/Bearish/Neutral
Consensus Building: Counts aligned indicators (minimum 3 required)
Filter Application: Applies trend strength and volume filters
Signal Generation: Generates BUY/SELL when all conditions are met
🔍 Indicator States
Moving Averages: Price position, EMA alignment, and crossovers
Bollinger Bands: Price relative to bands and momentum shifts
RSI: Multi-zone analysis with momentum and crossover detection
MACD: Signal line crossovers and zero-line positioning
🎉 Why Choose Signal Hunter Pro?
✅ Multi-Indicator Confirmation reduces false signals
✅ Trend Strength Filtering improves win rate
✅ Volume Confirmation ensures market participation
✅ Customizable Parameters adapt to any trading style
✅ Clean Visual Design doesn't clutter your charts
✅ Professional Alert System for automated trading
✅ No Repainting - reliable historical signals
✅ Works on All Timeframes from scalping to investing

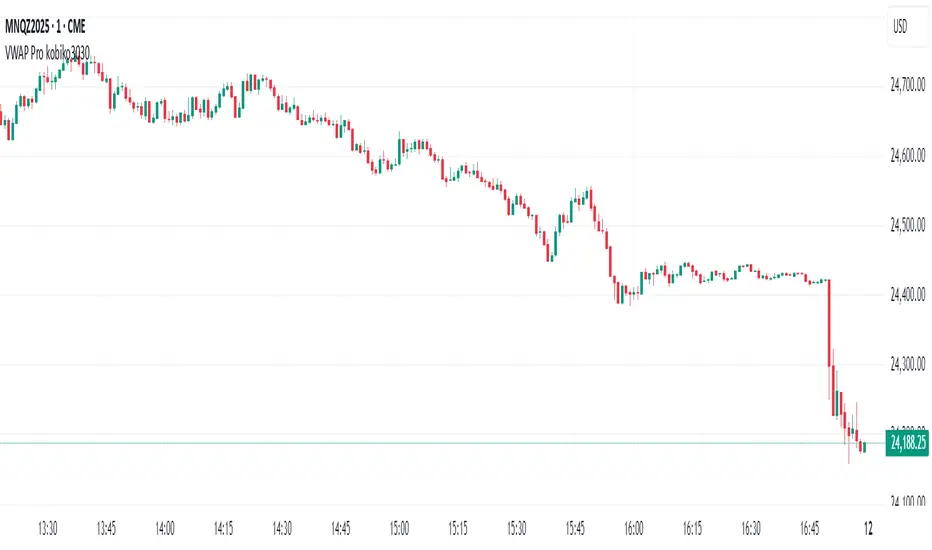
VWAP Bands Pro - Session Based by kobiko3030
📊 Advanced Professional Trading Indicator
VWAP Bands Pro is an advanced indicator that combines the power of VWAP with 4 dynamic bands for precise identification of support and resistance zones. This indicator is designed for professional traders who want deep and accurate market movement analysis.
✨ Key Features
🎯 Smart VWAP Bands
4 adjustable bands based on standard deviation
Optional band 4 hiding for beginner traders
Precise calculation based on volume-weighted price
🌏 Global Session Support
New York Session (9:30 EST)
Asia Session (18:00 EST)
Automatic reset at the beginning of each session
📱 Flexible User Interface
Dynamic labels (V, VR1-4, VS1-4)
Custom color selection
Adjustable line thickness for each band
Multiple display modes
🔔 Advanced Alert System
VWAP breakout alerts
Alerts for all bands (3 & 4)
Clear and precise messages
🛠️ Customization Options
Band Settings
Standard deviation multipliers: 1.0, 2.0, 3.0, 4.0 (default)
Each band independently adjustable
Range: 0.1 to 5.0
Display Settings
Continuous trading start - display from session beginning
Limited candle count - show last X candles
Current day only - no historical data
Visual Design
VWAP, support, and resistance colors
Individual line thickness
Hideable labels
📈 Trading Strategies
Support and Resistance Zones
VS1-VS4: Support bands (green)
VR1-VR4: Resistance bands (red)
V: Central VWAP line
Entry Points
Breakouts above/below VWAP
Bounces from outer bands
Band retests
Risk Management
Use bands as Stop Loss levels
Identify oversold/overbought zones
Adapt to different market conditions
🎖️ Indicator Advantages
✅ Precise calculation based on volume weighting
✅ Complete flexibility in customization
✅ Global session support
✅ User-friendly interface
✅ Built-in alert system
✅ Suitable for all trading styles
📋 Usage Instructions
Add the indicator to your chart
Select trading session (New York/Asia)
Adjust bands according to your trading style
Set up alerts for important breakouts
Start trading with precise key zone identification
💡 Trading Tips
Use outer bands to identify extremes
Combine with additional indicators for confirmation
Adjust bands to asset volatility
Follow alerts to spot opportunities
Consider session-specific behavior patterns
🔧 Technical Specifications
Pine Script Version: 5
Overlay: Yes
Timeframe: All timeframes supported
Markets: Suitable for all markets (Forex, Stocks, Crypto, Futures)
Session Support: New York & Asia with EST timezone
Volume Calculation: HLC3 * Volume weighted
📊 What Makes This Different
Unlike standard VWAP indicators, this pro version offers:
Session-based reset for intraday precision
4 customizable bands instead of basic 2
Professional labeling system for quick identification
Advanced alert conditions for all key levels
Flexible display options for different trading approaches
⚡ Performance Features
Efficient calculation - minimal lag
Clean visual design - no chart clutter
Responsive labels - update in real-time
Session breaks - clear visual separation
Volume validation - ensures accurate VWAP calculation
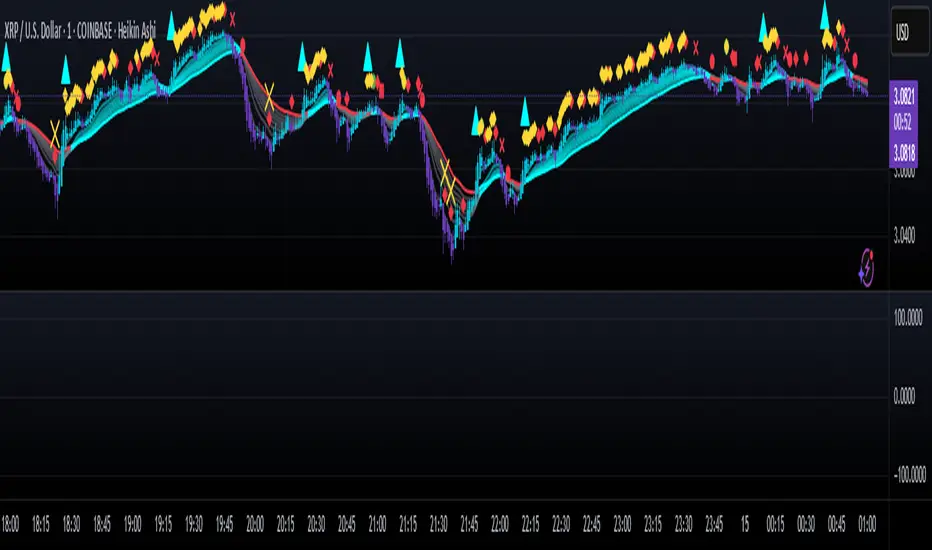
Aethix Cipher ProAethix Cipher Pro: AI-Enhanced Crypto Signal Indicator grok Ai made signal created for aethix users.
Unlock the future of crypto trading with Aethix Cipher Pro—a powerhouse indicator inspired by Market Cipher A, turbocharged for Aethix.io users! Built on WaveTrend Oscillator, 8-EMA Ribbon, RSI+MFI, and custom enhancements like Grok AI confidence levels (70-100%), on-chain whale volume thresholds, and fun meme alerts ("To the moon! 🌕").
Key Features:
WaveTrend Signals: Spot overbought/oversold with levels at ±53/60/100—crosses trigger red diamonds, blood diamonds, yellow X's for high-prob buy/sell entries.
Neon Teal EMA Ribbon: Dynamic 5-34 EMA gradient (bullish teal/bearish red) for trend direction—crossovers plot green/red circles, blue triangles.
RSI+MFI Fusion: Overbought (70+)/oversold (30-) with long snippets for sentiment edges.
NQ Phantom Scalper Pro# 👻 NQ Phantom Scalper Pro
**Advanced VWAP Mean Reversion Strategy with Volume Confirmation**
## 🎯 Strategy Overview
The NQ Phantom Scalper Pro is a sophisticated mean reversion strategy designed specifically for Nasdaq 100 (NQ) futures scalping. This strategy combines Volume Weighted Average Price (VWAP) bands with intelligent volume spike detection to identify high-probability reversal opportunities during optimal market hours.
## 🔧 Key Features
### VWAP Band System
- **Dynamic VWAP Bands**: Automatically adjusting standard deviation bands based on intraday volatility
- **Multiple Band Levels**: Configurable Band #1 (entry trigger) and Band #2 (profit target reference)
- **Flexible Anchoring**: Choose from Session, Week, Month, Quarter, or Year-based VWAP calculations
### Volume Intelligence
- **Volume Spike Detection**: Only triggers entries when volume exceeds SMA by configurable multiplier
- **Relative Volume Display**: Real-time volume strength indicator in info panel
- **Optional Volume Filter**: Can be disabled for testing alternative setups
### Advanced Time Management
- **12-Hour Format**: User-friendly time inputs (9 AM - 4 PM default)
- **Lunch Filter**: Automatically avoids low-liquidity lunch period (12-2 PM)
- **Visual Time Zones**: Color-coded background for active/inactive periods
- **Market Hours Focus**: Optimized for peak NQ trading sessions
### Smart Risk Management
- **ATR-Based Stops**: Volatility-adjusted stop losses using Average True Range
- **Dual Exit Strategy**: VWAP mean reversion + fixed profit targets
- **Adjustable Risk-Reward**: Configurable target ratio to opposite VWAP band
- **Position Sizing**: Percentage-based equity allocation
### Optional Trend Filter
- **EMA Trend Alignment**: Optional trend filter to avoid counter-trend trades
- **Configurable Period**: Adjustable EMA length for trend determination
- **Toggle Functionality**: Enable/disable based on market conditions
## 📊 How It Works
### Entry Logic
**Long Entries**: Triggered when price touches lower VWAP band + volume spike during active hours
**Short Entries**: Triggered when price touches upper VWAP band + volume spike during active hours
### Exit Strategy
1. **VWAP Mean Reversion**: Early exit when price returns to VWAP center line
2. **Profit Target**: Fixed target based on percentage to opposite VWAP band
3. **Stop Loss**: ATR-based protective stop
### Visual Elements
- **VWAP Center Line**: Blue line showing volume-weighted fair value
- **Green Bands**: Entry trigger levels (Band #1)
- **Red Bands**: Extended levels for target reference (Band #2)
- **Orange EMA**: Trend filter line (when enabled)
- **Background Colors**: Yellow (lunch), Gray (after hours), Clear (active trading)
- **Info Panel**: Real-time metrics display
## ⚙️ Recommended Settings
### Timeframes
- **Primary**: 1-5 minute charts for scalping
- **Validation**: Test on 15-minute for swing applications
### Market Conditions
- **Best Performance**: Ranging/choppy markets with good volume
- **Trend Markets**: Enable trend filter to avoid counter-trend trades
- **High Volatility**: Increase ATR multiplier for stops
### Session Optimization
- **Pre-Market**: Generally avoided (low volume)
- **Morning Session**: 9:30 AM - 12:00 PM (high activity)
- **Lunch Period**: 12:00 PM - 2:00 PM (filtered by default)
- **Afternoon Session**: 2:00 PM - 4:00 PM (good volume)
- **After Hours**: Generally avoided (wide spreads)
## ⚠️ Risk Disclaimer
This strategy is for educational purposes only and does not constitute financial advice. Past performance does not guarantee future results. Trading futures involves substantial risk of loss and is not suitable for all investors. Users should:
- Thoroughly backtest on historical data
- Start with small position sizes
- Understand the risks of leveraged trading
- Consider transaction costs and slippage
- Never risk more than you can afford to lose
## 📈 Performance Tips
1. **Volume Threshold**: Adjust volume multiplier based on average NQ volume patterns
2. **Band Sensitivity**: Modify band multipliers for different volatility regimes
3. **Time Filters**: Customize trading hours based on your timezone and preferences
4. **Trend Alignment**: Use trend filter during strong directional markets
5. **Risk Management**: Always maintain consistent position sizing and risk parameters
**Version**: 6.0 Compatible
**Asset**: Optimized for NASDAQ 100 Futures (NQ)
**Style**: Mean Reversion Scalping
**Frequency**: High-Frequency Trading Ready

Gold 3min Trading Pro [XAU/USD]# Gold 3min Trading Pro - User Guide
## Overview
This is a professional scalping indicator specifically designed for Gold (XAU/USD) trading on 3-minute timeframes. It combines multiple technical analysis methods to provide high-probability entry signals for short-term trading.
## Key Features
### 1. Multi-Timeframe Trend Analysis
- **Major Trend**: Analyzes 15min, 1H, and 4H timeframes using moving averages
- **Short-term Trend**: Focuses on 3-minute price action and moving average alignment
- **Trend Strength**: Rated from 1-3 based on timeframe agreement
### 2. Core Indicators
- **RSI (9-period)**: Momentum oscillator for overbought/oversold conditions
- **Stochastic (9-period)**: %K and %D lines for entry timing
- **MACD**: Additional trend confirmation
- **Volume Analysis**: Detects volume spikes for signal validation
- **ATR-based Volatility Filter**: Ensures adequate market movement
### 3. Signal Types
- **Primary Signals**: Green triangles (LONG) and Red triangles (SHORT)
- **Enhanced Signals**: Stronger signals with multiple confirmations
- **Confirmation Signals**: Small circles for stochastic crossovers
## How to Use
### 1. Setup
- **Timeframe**: Use on 3-minute charts for Gold (XAU/USD)
- **Settings**: Default settings are optimized for Gold scalping
- **Session Filter**: Enable for London/New York sessions (recommended)
### 2. Entry Conditions
#### LONG Entry:
- Major trend is bullish (green background)
- Short-term trend is up or neutral
- RSI shows bullish momentum
- Stochastic indicates oversold recovery
- Volume spike confirmation
- Strong price action (bullish candle)
#### SHORT Entry:
- Major trend is bearish (red background)
- Short-term trend is down or neutral
- RSI shows bearish momentum
- Stochastic indicates overbought reversal
- Volume spike confirmation
- Strong price action (bearish candle)
### 3. Trade Management
- **Quick Target**: 50% of ATR-based calculation
- **Main Target**: Full ATR-based target
- **Stop Loss**: 60% of ATR below/above entry
- **Time Limit**: Exit if no progress within 20 bars (60 minutes)
### 4. Risk Management
- **Position Size**: Risk 1-2% of account per trade
- **Maximum Trades**: 3-5 trades per session
- **Avoid**: Low volatility periods and major news events
## Visual Elements
### Background Colors
- **Light Green**: Bullish major trend
- **Light Red**: Bearish major trend
- **Yellow**: Volume spike detected
- **Intense Colors**: Very strong trend alignment
### Chart Indicators
- **RSI Line (Blue)**: Main momentum indicator
- **Stochastic %K (Orange)**: Fast stochastic line
- **Stochastic %D (Yellow)**: Slow stochastic line
- **Horizontal Lines**: 70 (overbought), 30 (oversold), 50 (midline)
### Information Table (Top Right)
- Total signal count and performance statistics
- Current market conditions and trend strength
- RSI levels and volatility status
- Trading session information
- Last signal timing
## Alert System
### Standard Alerts
- **Scalp Long Signal**: Basic long entry signal
- **Scalp Short Signal**: Basic short entry signal
- **Premium Signals**: High-quality signals with strong confirmation
- **Trend Reversal**: Major trend change notifications
### Alert Setup
1. Right-click on chart → "Add Alert"
2. Select desired alert condition
3. Configure notification method (popup, email, webhook)
4. Set alert frequency to "Once Per Bar Close"
## Best Practices
### 1. Trading Sessions
- **Optimal**: London-NY overlap (3:00-5:00 PM EST)
- **Good**: London session (2:00-11:00 AM EST)
- **Avoid**: Asian session and major news releases
### 2. Market Conditions
- **Best**: Trending markets with normal to high volatility
- **Moderate**: Ranging markets during active sessions
- **Avoid**: Extremely low volatility or choppy conditions
### 3. Confirmation Rules
- Wait for signal triangle to appear
- Check that major trend aligns with signal direction
- Verify volume spike (yellow background)
- Ensure volatility is adequate (check info table)
### 4. Entry Timing
- Enter immediately after signal confirmation
- Use market orders for scalping speed
- Set stop loss and take profit levels immediately
## Settings Customization
### Essential Settings
- **MA Type**: EMA (recommended) or SMA
- **RSI Length**: 9 (default, can adjust 5-14)
- **Volume Threshold**: 1.8 (higher = fewer but stronger signals)
- **Volatility Filter**: Keep enabled for better signal quality
### Display Options
- **Show Scalping Signals**: Main entry signals
- **Show Performance Stats**: Information table
- **Show Trend Filter**: Background trend colors
- **Use Time Filter**: Session-based filtering
## Performance Optimization
### 1. Backtesting Tips
- Test on different market conditions
- Analyze win rate and average profit/loss
- Adjust settings based on historical performance
### 2. Signal Quality
- Higher trend strength (2-3) = better signals
- Volume confirmation improves success rate
- Enhanced signals have higher probability
### 3. Risk Control
- Never risk more than 2% per trade
- Use proper position sizing
- Stop trading after 3 consecutive losses
## Troubleshooting
### Common Issues
1. **No Signals**: Check volatility filter and session timing
2. **Too Many Signals**: Increase volume threshold or enable filters
3. **Poor Performance**: Verify timeframe (must be 3-minute) and symbol (XAU/USD)
### Support
- Ensure TradingView Pro+ subscription for multi-timeframe data
- Verify Gold symbol matches your broker's format
- Update to latest TradingView version
This indicator is designed for experienced traders familiar with scalping techniques and risk management. Always practice on demo accounts before live trading.

Trend Tracker ProTrend Tracker Pro - Advanced Trend Following Indicator
Overview
Trend Tracker Pro is a sophisticated trend-following indicator that combines the power of Exponential Moving Average (EMA) and Average True Range (ATR) to identify market trends and generate precise buy/sell signals. This indicator is designed to help traders capture trending moves while filtering out market noise.
🎯 Key Features
✅ Dynamic Trend Detection
Uses EMA and ATR-based bands to identify trend direction
Automatically adjusts to market volatility
Clear visual trend line that changes color based on market direction
✅ Precise Signal Generation
Buy signals when trend changes to bullish
Sell signals when trend changes to bearish
Reduces false signals by requiring actual trend changes
✅ Visual Clarity
Green trend line: Bullish trend
Red trend line: Bearish trend
Gray trend line: Sideways/neutral trend
Triangle arrows for buy/sell signals
Clear BUY/SELL text labels
✅ Customizable Settings
Trend Length: Adjustable period for EMA and ATR calculation (default: 14)
ATR Multiplier: Controls sensitivity of trend bands (default: 2.0)
Show/Hide Signals: Toggle signal arrows on/off
Show/Hide Labels: Toggle text labels on/off
✅ Built-in Information Panel
Real-time trend direction display
Current trend level value
ATR value for volatility reference
Last signal information
✅ TradingView Alerts
Buy signal alerts
Sell signal alerts
Customizable alert messages
🔧 How It Works
Algorithm Logic:
1.
Calculate EMA: Uses exponential moving average for trend baseline
2.
Calculate ATR: Measures market volatility
3.
Create Bands: Upper band = EMA + (ATR × Multiplier), Lower band = EMA - (ATR × Multiplier)
4.
Determine Trend:
Price above upper band → Bullish trend (trend line = lower band)
Price below lower band → Bearish trend (trend line = upper band)
Price between bands → Continue previous trend
5.
Generate Signals: Signal occurs when trend direction changes
📊 Best Use Cases
✅ Trending Markets
Excellent for capturing strong directional moves
Works well in both bull and bear markets
Ideal for swing trading and position trading
✅ Multiple Timeframes
Effective on all timeframes from 15 minutes to daily
Higher timeframes provide more reliable signals
Can be used for both scalping and long-term investing
✅ Various Asset Classes
Stocks, Forex, Cryptocurrencies, Commodities
Particularly effective in volatile markets
Adapts automatically to different volatility levels
⚙️ Recommended Settings
Conservative Trading (Lower Risk)
Trend Length: 20
ATR Multiplier: 2.5
Best for: Long-term positions, lower frequency signals
Balanced Trading (Default)
Trend Length: 14
ATR Multiplier: 2.0
Best for: Swing trading, moderate frequency signals
Aggressive Trading (Higher Risk)
Trend Length: 10
ATR Multiplier: 1.5
Best for: Day trading, higher frequency signals
🎨 Visual Elements
Trend Line: Main indicator line that follows the trend
Signal Arrows: Triangle shapes indicating buy/sell points
Text Labels: Clear "BUY" and "SELL" text markers
Information Table: Real-time status panel in top-right corner
Color Coding: Intuitive green/red color scheme
⚠️ Important Notes
Risk Management
Always use proper position sizing
Set stop-losses based on ATR values
Consider market conditions and volatility
Not recommended for ranging/sideways markets
Signal Confirmation
Consider using with other indicators for confirmation
Pay attention to volume and market structure
Be aware of major news events and market sessions
Backtesting Recommended
Test the indicator on historical data
Optimize parameters for your specific trading style
Consider transaction costs in your analysis

RSI Divergence Pro+ VolumeRSI Divergence Pro+ Volume
What It Does:
RSI Divergence Pro+ Volume is a non-repainting indicator that helps traders spot potential bullish and bearish reversal zones using a classic technical analysis concept—RSI divergence—combined with advanced volume confirmation. The script highlights moments when price and RSI disagree, filtering for signals only when there is a significant volume spike, which helps reduce false positives in quiet or illiquid markets.
How It Works:
Bullish Divergence: Triggered when price makes a lower low but RSI forms a higher low, suggesting possible exhaustion in selling pressure.
Bearish Divergence: Triggered when price makes a higher high but RSI forms a lower high, signaling potential buying exhaustion.
Volume Confirmation: Signals only appear when trading volume exceeds a dynamic threshold (based on a user-defined moving average and multiplier), making alerts more reliable.
Visual Features: Customizable labels and optional gradient highlights mark the exact bars where divergence with volume confirmation occurs, making signals easy to see.
Alert System: Built-in alerts for both bullish and bearish divergences so traders can receive instant notifications.
How to Use:
Apply the script to any timeframe or liquid asset (15m–4H recommended for best results).
Watch for green “BULL↑” labels below bars (bullish divergence) and red “BEAR↓” labels above bars (bearish divergence).
Blue/violet background highlights confirm volume-verified signals.
Combine with your own risk management and confirmation tools for trade entries/exits.
Adjust lookback and volume settings to match your asset and style.
Originality & Usefulness:
This indicator stands out by combining traditional RSI divergence with advanced volume filtering, giving more credible and actionable reversal alerts. All logic is non-repainting and calculated on closed bars only. Settings are fully grouped and customizable, with professional visuals for clarity.
Limitations & Disclaimers:
Not every divergence results in a major reversal—use with other analysis.
More effective in trending or volatile markets; may produce more false signals in choppy/range conditions.
Signals are generated on bar close and do not repaint.
No indicator is a substitute for proper trading discipline and risk management.
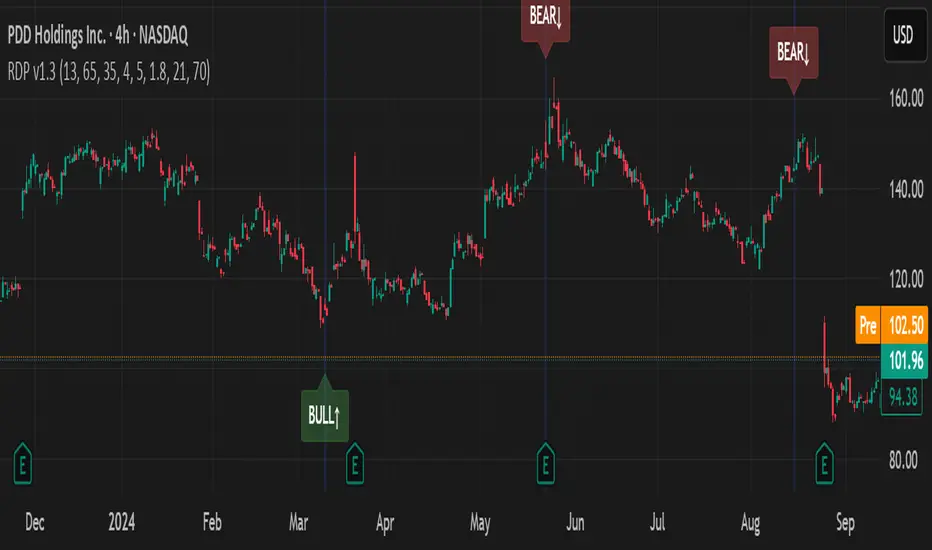
Mongoose EMA Ribbon — Pro EditionMongoose EMA Ribbon — Pro Edition
The Mongoose EMA Ribbon is a precision tool designed to support directional bias, trend integrity, and momentum alignment through a structured multi-EMA system. It is built for traders seeking clarity across high-timeframe trend conditions without sacrificing speed or simplicity.
Key Features:
Five customizable EMAs optimized for layered ribbon analysis
Configurable color logic for clean visual separation
Built-in ribbon compression and expansion visibility
Support for ribbon-based trend continuation zones
Optional label and visual tag for real-time trend state
Applications:
Identify trend strength and reversals with ribbon alignment
Detect compression zones that precede directional moves
Support discretionary or system-based trading strategies
Integrates well with price structure and macro overlays
This script is part of the Mongoose Capital toolkit and was developed to meet internal standards for clarity, execution readiness, and cross-asset compatibility.
Version: Pro Edition
Timeframes: Optimized for 1H, 4H, Daily, Weekly
Momentum Flip Pro - Advanced ZigZag Trading SystemMomentum Flip Pro - Advanced ZigZag Trading System
Complete User Guide
📊 What This Indicator Does
The Momentum Flip Pro is an advanced position-flipping trading system that automatically identifies trend reversals using ZigZag patterns combined with momentum analysis. It's designed for traders who want to always be in the market, flipping between long and short positions at optimal reversal points.
Key Features:
Automatically flips positions at each ZigZag reversal point
Dynamic stop loss placement at exact ZigZag levels
Real-time trading dashboard with performance metrics
Capital tracking and ROI calculation
Three momentum engines to choose from
🎯 How It Works
Entry Signal: When a ZigZag point appears (circle on chart), the indicator:
Exits current position (if any)
Immediately enters opposite position
Places stop loss at the exact ZigZag price
Exit Signal: Positions are closed when the next ZigZag appears, then immediately reversed
Position Management:
Long Entry: ZigZag bottom (momentum turns UP)
Short Entry: ZigZag peak (momentum turns DOWN)
Stop Loss: Always at the ZigZag entry price
Take Profit: Next ZigZag point (automatic position flip)
⚙️ Recommended Settings
For Day Trading (5m-15m timeframes):
Momentum Engine: Quantum
- RSI Length: 9-12
- Quantum Factor: 3.5-4.0
- RSI Smoothing: 3-5
- Threshold: 8-10
For Swing Trading (1H-4H timeframes):
Momentum Engine: MACD
- Fast Length: 12
- Slow Length: 26
- Signal Smoothing: 9
- MA Type: EMA
For Position Trading (Daily):
Momentum Engine: Moving Average
- Average Type: EMA or HMA
- Length: 20-50
📈 How to Use for Trading
Add to Chart:
Add indicator to your chart
Set your starting capital
Choose your preferred momentum engine
Understanding Signals:
Green circles: Strong bullish momentum reversal
Red circles: Strong bearish momentum reversal
Purple circles: Normal momentum reversal
Entry labels: Show exact entry points with tooltips
Trading Rules:
Enter LONG when you see an up arrow + green/purple circle
Enter SHORT when you see a down arrow + red/purple circle
Stop loss is automatically at the ZigZag level
Hold until next ZigZag appears (exit + reverse)
Risk Management:
Risk per trade = Entry Price - Stop Loss
Position size = (Capital * Risk %) / Risk per trade
Recommended risk: 1-2% per trade
💡 Best Practices
Market Conditions:
Works best in trending markets
Excellent for volatile pairs (crypto, forex majors)
Avoid during low volume/consolidation
Timeframe Selection:
Lower timeframes (5m-15m): More signals, higher noise
Higher timeframes (1H+): Fewer signals, higher reliability
Sweet spot: 15m-1H for most traders
Momentum Engine Selection:
Quantum: Best for volatile markets (crypto, indices)
MACD: Best for trending markets (forex, stocks)
Moving Average: Best for smooth trends (commodities)
📊 Dashboard Interpretation
The trading dashboard shows:
Current Capital: Your running balance
Position: Current trade direction
Entry/Stop: Your risk levels
Statistics: Win rate and performance
ROI: Overall return on investment
⚠️ Important Notes
Always Active: This system is always in a position (long or short)
No Neutral: You're either long or short, never flat
Automatic Reversal: Positions flip at each signal
Stop Loss: Fixed at entry ZigZag level (doesn't trail)
🎮 Quick Start Guide
Beginners: Start with default settings on 1H timeframe
Test First: Use paper trading to understand the signals
Small Size: Begin with 1% risk per trade
Track Results: Monitor the dashboard statistics
Adjust: Fine-tune momentum settings based on results
🔧 Customization Tips
Color Signals: Enable to see momentum strength
Dashboard Position: Move to preferred screen location
Visual Settings: Adjust colors for your theme
Alerts: Set up for automated notifications
This indicator is ideal for traders who prefer an always-in-market approach with clear entry/exit rules and automated position management. The key to success is choosing the right momentum engine for your market and maintaining disciplined risk management.

Market Pulse ProMarket Pulse Pro (Pulse‑X) — User Guide
Market Pulse Pro, also known as Pulse‑X, is an advanced momentum indicator that combines SMI, Stochastic RSI, and a smoothed signal line to identify zones of buying and selling strength in the market. It is designed to assess the balance of power between bulls and bears with clear visualizations.
How It Works
The indicator calculates three main components:
SMI (Stochastic Momentum Index) – measures price position relative to its recent range.
Stochastic RSI – captures overbought/oversold extremes of the RSI.
Smoothed Signal Line – based on closing price, smoothed using various methods (such as HMA, EMA, etc.).
Each component is normalized to create two final values:
Bull Herd (Buying Strength) – green line.
Bear Winter (Selling Strength) – red line.
Interpretation
Bull Herd (high green values): Bulls dominate the market. May indicate the start or continuation of an uptrend.
Bear Winter (high red values): Bears dominate. May indicate reversal or continuation of a downtrend.
Convergence around 50%: Market is balanced. Signals are weaker or indecisive.
Tip: Combine with price action analysis or support/resistance levels to confirm entries.
Customizable Settings
You can adjust:
SMI Period, Smooth K, and D – control the sensitivity of the SMI.
RSI Period – sets the RSI calculation window.
Signal Period – period for the price-based signal line.
Smoothing Methods – choose between HMA, EMA, WMA, JMA, SMMA, etc.
Line Width – thickness of the plotted lines.
Note: The JMA (Jurik Moving Average) used in this script is not the original proprietary version.
It is a custom public version, based on open-source code shared by the TradingView community.
The original JMA is copyrighted and owned by Jurik Research.
How to Use It in Practice
Buy Entries
When the green Bull Herd line crosses above 60 and the red Bear Winter line falls below 40.
Entry is more reliable if the green line is rising steadily.
Sell Entries
When the red Bear Winter line crosses above 60 and the green Bull Herd line falls.
Signals are stronger when there is a clear crossover and divergence between the two lines.
Avoid trading near the neutral zone (~50%), where the market shows indecision.
Additional Tips
Combine with volume analysis or reversal candlestick patterns for higher accuracy.
Test different smoothing methods: HMA is more responsive, SMMA is smoother and slower.

Super Arma Institucional PRO v6.3Super Arma Institucional PRO v6.3
Description
Super Arma Institucional PRO v6.3 is a multifunctional indicator designed for traders looking for a clear and objective analysis of the market, focusing on trends, key price levels and high liquidity zones. It combines three essential elements: moving averages (EMA 20, SMA 50, EMA 200), dynamic support and resistance, and volume-based liquidity zones. This integration offers an institutional view of the market, ideal for identifying strategic entry and exit points.
How it Works
Moving Averages:
EMA 20 (orange): Sensitive to short-term movements, ideal for capturing fast trends.
SMA 50 (blue): Represents the medium-term trend, smoothing out fluctuations.
EMA 200 (red): Indicates the long-term trend, used as a reference for the general market bias.
Support and Resistance: Calculated based on the highest and lowest prices over a defined period (default: 20 bars). These dynamic levels help identify zones where the price may encounter barriers or supports.
Liquidity Zones: Purple rectangles are drawn in areas of significantly above-average volume, indicating regions where large market participants (institutional) may be active. These zones are useful for anticipating price movements or order absorption.
Purpose
The indicator was developed to provide a clean and institutional view of the market, combining classic tools (moving averages and support/resistance) with modern liquidity analysis. It is ideal for traders operating swing trading or position trading strategies, allowing to identify:
Short, medium and long-term trends.
Key support and resistance levels to plan entries and exits.
High liquidity zones where institutional orders can influence the price.
Settings
Show EMA 20 (true): Enables/disables the 20-period EMA.
Show SMA 50 (true): Enables/disables the 50-period SMA.
Show EMA 200 (true): Enables/disables the 200-period EMA.
Support/Resistance Period (20): Sets the period for calculating support and resistance levels.
Liquidity Sensitivity (20): Period for calculating the average volume.
Minimum Liquidity Factor (1.5): Multiplier of the average volume to identify high liquidity zones.
How to Use
Moving Averages:
Crossovers between the EMA 20 and SMA 50 may indicate short/medium-term trend changes.
The EMA 200 serves as a reference for the long-term bias (above = bullish, below = bearish).
Support and Resistance: Use the red (resistance) and green (support) lines to identify reversal or consolidation zones.
Liquidity Zones: The purple rectangles highlight areas of high volume, where the price may react (reversal or breakout). Consider these zones to place orders or manage risks.
Adjust the parameters according to the asset and timeframe to optimize the analysis.
Notes
The chart should be configured only with this indicator to ensure clarity.
Use on timeframes such as 1 hour, 4 hours or daily for better visualization of liquidity zones and support/resistance levels.
Avoid adding other indicators to the chart to keep the script output easily identifiable.
The indicator is designed to be clean, without explicit buy/sell signals, following an institutional approach.
This indicator is perfect for traders who want a visually clear and powerful tool to trade based on trends, key levels and institutional behavior.
