Scalping The Bull - BTC Chart for Trend AnalysisName: BTC Chart for Trend Analysis
Category: Scalping, Trend Analysis .
Timeframe: 1M, 5M, 30M, 1D depending on the specific technique.
Technical Analysis: The indicator supports the operations of the trader named "Scalping The Bull" who uses BTC as an Index for Crypto trading.
Suggested usage: When trading on altcoins, to check whether or not they are trending with Bitcoin and whether those anticipate its movements.
It is therefore possible to see Bitcoin specifically if it makes red or green candles and how it is positioned with respect to the EMA 5, 10, 60, 223, however configurable from the panel.
Used in conjunction with Scalping The Bull Indicator or PRO Indicator, on the main panel.
Configuration:
EMA Length:
- EMA 1: by default 5, configurable
- EMA 2: by default 10, configurable
- EMA 3: by default 60, configurable
- EMA 4: by default 223, configurable
Colors can be modified from "Settings" > "Style"
Designed to be used with the following the indicator:
In den Scripts nach "pro" suchen

DCA After Downtrend v2 (by BHD_Trade_Bot)The purpose of the strategy is to identify the end of a short-term downtrend . So that you can easily to DCA certain amount of money for each month.
ENTRY
The buy orders are placed on a monthly basis for assets at the end of a short-term downtrend:
- Each month condition: In 1-hour time frame, each month has 24 * 30 candles
- The end of short-term downtrend condition: use MACD for less delay
CLOSE
The sell orders are placed when:
- Is last bar
The strategy use $1000 and trading fee is 1.1% for each order.
Pro tip: The 1-hour time frame has the best results on average:
- Total spent: $1000 x 33 = $33,000
- Total profit: $65,578

DCA After Downtrend (by BHD_Trade_Bot)The purpose of the strategy is to identify the end of a short-term downtrend . So that you can easily to DCA certain amount of money for each month.
ENTRY
The buy orders are placed on a monthly basis for assets at the end of a short-term downtrend:
- Each month condition: In 1-hour time frame, each month has 240 candles
- The end of short-term downtrend condition: use MACD for less delay
CLOSE
The sell orders are placed when:
- Is last bar
The strategy use $1000 and trading fee is 0.1% for each order.
Pro tip: The 1-hour time frame for TSLA has the best results on average:
- Total spent: $1000 x 85 = $85,000
- Total profit: $790,556

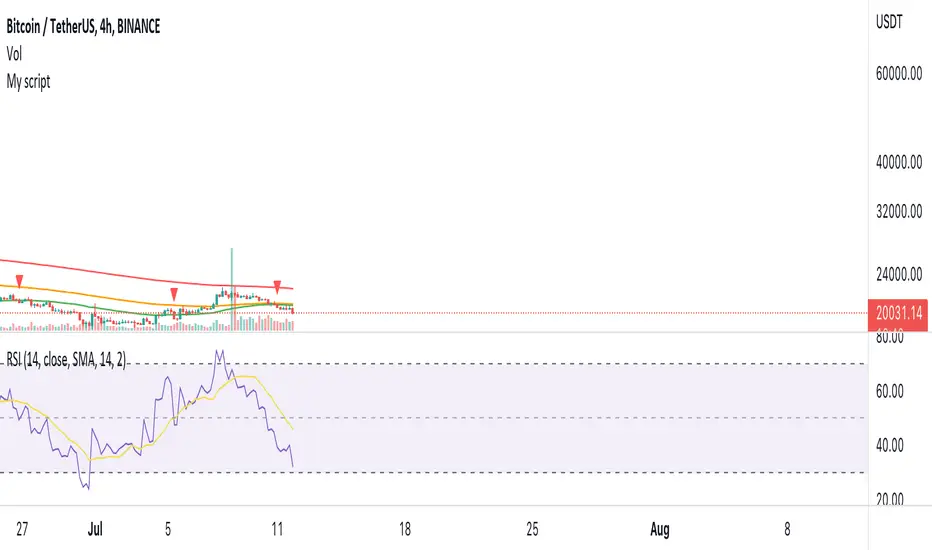
Take Profit On Trend v2 (by BHD_Trade_Bot)The purpose of strategy is to detect long-term uptrend and short-term downtrend so that you can easy to take profit.
The strategy also using BHD unit to detect how big you win and lose, so that you can use this strategy for all coins without worry about it have different percentage of price change.
ENTRY
The buy order is placed on assets that have long-term uptrend and short-term downtrend:
- Long-term uptrend condition: ema200 is going up
- Short-term downtrend condition: 2 last candles are down price (use candlestick for less delay)
CLOSE
The sell order is placed when take profit or stop loss:
- Take profit: price increase 2 BHD unit
- Stop loss: price decrease 3 BHD unit
The strategy use $1000 for initial capital and trading fee is 0.1% for each order.
Pro tip: The 1-hour time frame for ETH/USDT has the best results on average.

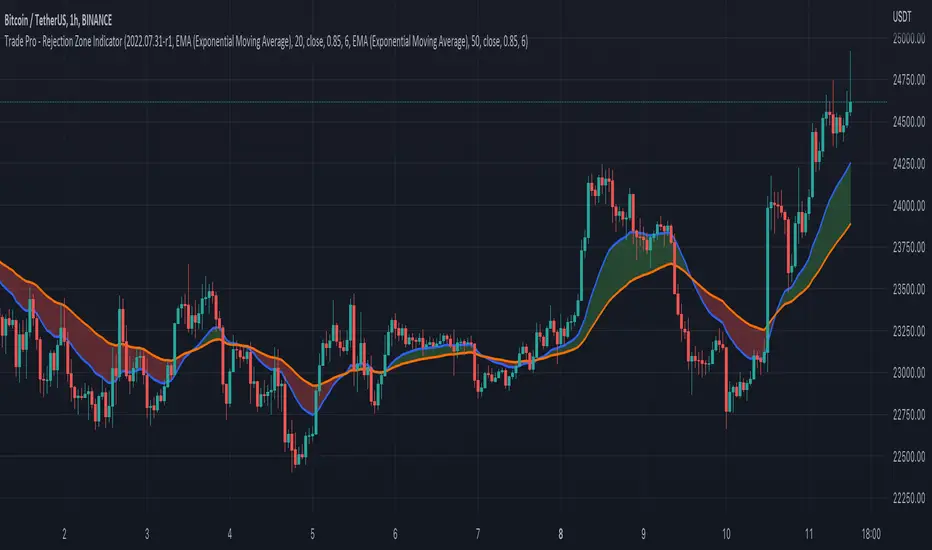
Trade Pro - Rejection Zone IndicatorThe Rejection Zone Indicator can be used to help trend following traders know when to buy dips in up trends, and when to sell pull backs in down trends.
The Rejection Zone Indicator is made up of the 20 and 50 period Exponential Moving Averages. This indicator has colored shading in between these two EMAs, which acts as a nice visual. When the 20 period Exponential Moving Average is below the 50 period Exponential Moving Average, the shaded cloud will be red, and when the 20 EMA is over the 50 EMA the cloud will be green. It is called the Rejection Zone indicator, because often in trends when price pulls back to the colored cloud, it will act as an area of support or resistance.
The suggested use of the Rejection Zone Indicator is to look for long trades when the cloud is green, and once price has pulled back into the green cloud. If the cloud is red one can look for short trading opportunity when price pulls back into the red cloud.
LLHC/HHLC - Simple ArrowsA simple script for analyzing two types of reversal candles. HHLC and LLHC reversal candles.
HHLC
If a candle has a higher high and a lower close than the previous candle, it is marked with a red HHLC downward pointing arrow.
LLHC
If a candle has a lower low and a higher close than the previous candle, it is marked with a green LLHC upward pointing arrow.
The script's first iteration helps identify candles that MIGHT be reversal candles.
Remember to check:
1. What market cycle the price action for a stock is in.
2. Which reversal you're looking for as a result of that market cycle.
I'm not a pro, so hopefully, the stuff to remember is correct. Please examine the candles to determine if they fit your parameters for a reversal candle.
Shout out to TJ for teaching about these reversal candles! He's a freaking boss!!

Mexnepal price convert By Np Trader's ProThis indicator converts the trading view price of commodity items to mexnpal price by multiplying the price by its conversion value for eg : it converts price of FXOPEN:XAUUSD (ounce) by multiplying by 32.22 gives value in kg hence it helps to put stoplosses and target points to Nepali traders who trades in mexnepal (commodity trading platform based in Nepal ) . People are selling such indicators to new traders so i decided to publish one for free to help neplese Commodity trading community lets hope trading view moderators approves this.
Features
1. converts price of all mexnepal trading items available in tradingview in real time
2. plots candels according to converted price hence giving better view of price fluxuation
3. All in one tool for all item listed in mex nepal like FXOPEN:XAUUSD FXOPEN:XAGUSD CAPITALCOM:COPPER
TVC:USOIL

Fractal Potential EntryFractal Potential Entry combine 3 ema and fractal and follow the strategy from Trade Pro on YouTube:
www.youtube.com
with good performance on the 1 minute chart
Feature:
Alert Sell and buy Potential Entry
Happy Trading

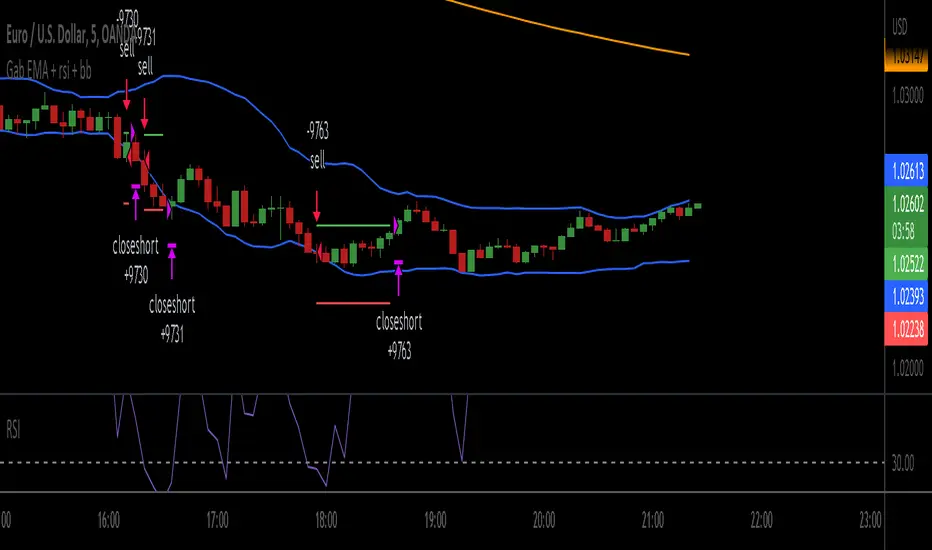
Gab EMA + rsi + bbscrypt I made for a friend
you are welcome bro ;)
simple strategy
BB Default
RSI 3
200 ema
200 EMA gives the trend direction.
if RSI is over bought and candle touch BB upper band then there will be buy entry. (Price must be above 200 ema)
If RSI is over sold and price touch bb lower band then there will be sell entry. (Price must be below the 200 ema)
SL will be 1 ATR of the entry candle. Tp will 2:1.
***Missing TP and SL values
Fib and RSI Strategy PineconnectorUse on 1m only For best results
strategy check for RSI overbought or oversold when key Fib levels are hit
Optimisez to use with Pineconnector using alerts with {{strategy.order.alert_message}}
Feel free to comment or DM if you want to improve
Enjoy

Directional Movement IndexADX is an oscillating indicator, displayed as a single line, ranging from 0 to 100, it only indicates the strength of the trend and does not indicate its direction. In other words, the ADX is non-directional, meaning that it measures the strength of a trend, but doesn’t distinguish between uptrend and downtrends. So, during a strong uptrend, the ADX rises and during a strong downtrend, the ADX also rises.
Here is how you correctly read what ADX is saying about the market. Here are 5 aspects regarding the interpretation of the ADX:
1- When ADX is above 25, trend strength is strong. Usually, once the ADX gets above 25 this signals the beginning of a trend. Big moves (upwards or downwards) tend to happen when ADX is right around this number. You can experiment with this number, some traders that want faster signals, tend to use a 20 threshold when trading with the ADX.
2- When ADX is below 25, traders must avoid trend trading strategies as the market is in accumulation or distribution phase. So, when we see the ADX line below 20 or 25 level, we forget about trend following strategies and we apply strategies suitable for a ranging market.
3- When ADX is above 25 and Positive Directional Movement Indicator (+DMI) is above the Negative Directional Movement Indicator (-DMI). ADX measures the strength of an uptrend. The crossover between the 2 Directional Movement Indicator, as the ADX line is well above 25 can result in an excellent bullish move.
4- The Positive Directional Movement Indicator (+DMI) should be above the Negative Directional Movement and the ADX should be above 25 signals for a strong upward trend for long opportunities. When ADX is above 25 and Positive Directional Movement Indicator is below the Negative Directional Movement Indicator, ADX measures the strength of a downtrend and short opportunities.
5- Values over 50 of the ADX indicate a very strong trend
There are pros and cons of ADX.
So, why is the ADX useful for traders: First, is excellent at quantifying trend strength. Also, it allows traders to see the strength of bulls and bears at the same time. It is good at filtering out trades, during accumulation periods and is good at identifying trending conditions.
But the ADX also has its limitations. The most important disadvantage is the fact that ADX is a lagging indicator that follows the price, so we must be very careful when we apply this indicator, because we might miss the inception of the trend and join it when it’s nearly over.
Also, it offers many false signals when used on shorter time frames, so it’s advisable to trade it on higher time frames Also, the ADX does not contain all of the data necessary a for proper analysis of price action, so it must be used in combination with other tools or indicators.
Now that we fully covered the good and the bad regarding ADX, let’s see how it is used in a trading strategy.
The trading strategy involves a DMI crossover, confirmed by ADX above consolidation threshold. If +DMI crossover, we take long position and if -DMI crosses over, we take a short position.
Candles are re-colored for easy demonstration of uptrend, downtrend and consolidation periods.
Green candles – ADX > Consolidation Threshold and +DMI > -DMI
Red candles – ADX > Consolidation Threshold and +DMI < -DMI
Black candles – ADX < Consolidation Threshold
Repaint – This is a non-repainting strategy - All the signals are generated at candle closing. All the calculations are made on previous candle’s open, high, low, close. No request security function is used. No data is being used from higher time frame. Trade exit uses close function instead of exit to avoid limit orders. Only one long trade at a time (no pyramiding) is allowed.
Strategy Time frame – D (To filter out false signals, higher time frame is recommended)
Strategy For – Swing Traders
Assets – Cryptocurrencies + Stocks

Boom Hunter + Hull Suite + Volatility Oscillator StrategyTRADE CONDITIONS
Long entry:
Boom Hunter (leading indicator): Trigger line crosses over Quotient 2 line (white cross over red)
Hull Suite (trend confirmation): Price closed above hull suite line and hull suite is green (represented by horizontal line at -10 in strategy pane)
Volatility Oscillator (volatility confirmation): Volatility spike trigger line is above upper band (represented by horizontal line at -30 in strategy pane)
Short entry:
Boom Hunter (leading indicator): Trigger line crosses under Quotient 2 line (white cross under red)
Hull Suite (trend confirmation): Price closed below hull suite line and hull suite is red (represented by horizontal line at -10 in strategy pane)
Volatility Oscillator (volatility confirmation): Volatility spike trigger line is below lower band (represented by horizontal line at -30 in strategy pane)
Risk management:
Each trade risks 3% of account (configurable in settings)
SL size determined by swing low/high of previous X candles (configurable in settings) or 1 ATR if swing is less than 1 ATR
TP is calculated by Risk:Reward ratio (configurable in settings)
TIPS
Timeframe: I have found good results running on BTC/USDT 5M chart
Note: To help visual identification of trade entries and exits you may wish to add the Hull Suite and Volatility Oscillator to the chart separately. It was not possible to display them in a clear way within a single panel for the strategy. Make sure you set the settings of the auxiliary indicators to match what is in the settings of this indicator if you do decide to add them.
CREDITS
Boom Hunter Pro by veryfid
Hull Suite by InSilico
Volatility Oscillator by veryfid

Template Signal IndicatorThis script is an example on how to create a custom indicator that produce start/end long/short deal signals based on configurable conditions from internal and external indicators.
This indicator can be used as an external indicator to other strategies like "Template Trailing Strategy" that will execute the deals and enter the desired positions based on the signals produced by this script.
Combining this script with the aforementioned strategy (or any other compatible) has the advantage that you can backrest the results of your custom deal conditions. Also additional functionality that is provided by the strategy can be utilized (e.g. Take Profit Targets, Trailing Stop Loss etc.).
In this particular example I combined the RSI and Stoch RSI indicators (internal) with the "Trend Explorer" indicator (external) so it produces buy and sell signals based on the logic I defined in the input tab of this indicator. To combine "indicators on indicators" you need Pro+ TV subscription.
The convention I use to communicate the signals is the following (2 -> enter long, 1 -> exit long, -2 -> enter short, -1 ->exit short). However, this convention is also configurable in the consumer/strategy script "Template Trailing Strategy" so make sure that both script "speak the same language" before procced.

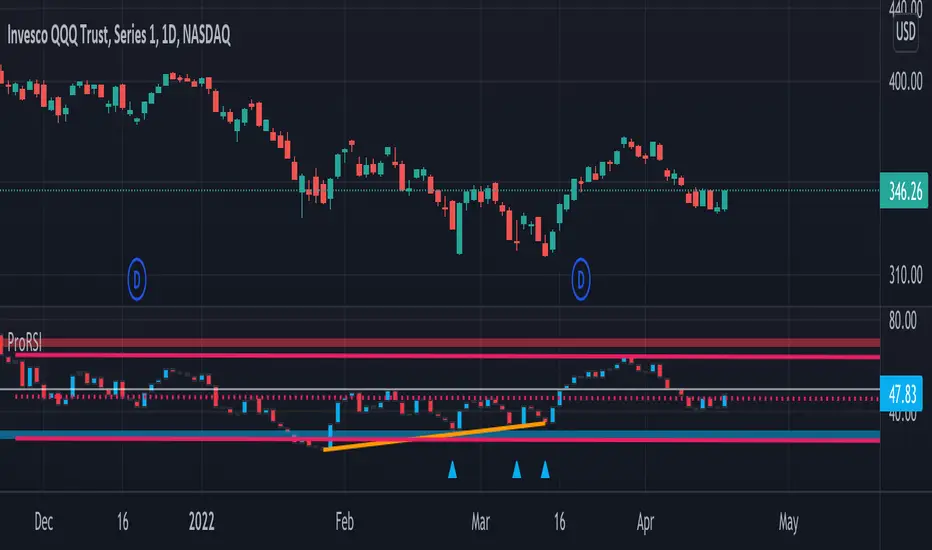
ProRSIProRSI is another in indicator to add to the Pro Indicator suite by DynaProTrading. This algo is made up of a few key components referenced below.
RSI: The primary function of the algo is to plot the candles of the ticker of choice on an oscillator pane to show how price compared to the various key levels. As you can see the red and blue arrows indicator oversold and overbought levels in conjunction with price.
Divergences: In addition to the RSI alerts, there is also a divergence functions where price could be making a higher high but the RSI indicator is making a lower high which is indicating a divergence in price. This is displayed by the lines in the lower window pane from one peak to another.
Trend Lines: Trend lines exist in all technical analysis but in this indicator, it shows the trend lines of the candles in the RSI pane which can help find support and resistance just like with normal price action.
Regression Model: The last key component of the indicator is a regression model which acts as a trend channel for more recent price action.
Super OrderBlock / FVG / BoS Tools by makuchaku & eFeThis super indicator is a Swiss army knife for Smart Money traders for OrderBlocks / FVG / BoS
It provides many options for drawing (non-repainting) boxes for OrderBlocks, Fair Value Gaps (FVG) and Break of Structures. The boxes are extended into the future, until the first retest/mitigation.
Some of the additional options (not explained in the diagrams above)
PPDD OB : An order block which is formed after interacting with Liquidity (old low/high, fractal low/high, etc). Since these OB's are in the most premium or most discount, they are Premium Premium Discount Discount OB's (PPDD OB)
HVB Bars : When the volume of any bar is higher than the average volume of last N bars, it could mean something important (in the right context). Hence, the indicator allows for coloring them differently.
This indicator was built as a collaboration between @makuchaku & eFe
Pro tip : This indicator is a simply a tool to visualize trading concepts on the candle stick chart. It is the job of the trader to sequence these effectively into a profitable trade.
If you come across any bug or have a question on how to effectively use the indicator, please don't hesitate to ask questions.
Good luck & good trading!
