Volume Candle Rings [CHE]Volume Candle Rings – Spot Volume Extremes Fast 🔍
Marks exceptionally high volume right on the candle as concentric rings. Instantly see how extreme the spike is (levels 1–10), where it happens (anchor on HL2/Close/BodyMid), and how big it is relative to volatility (ATR-scaled). No magic, no blind signals—just clean context for better decisions.
Why it helps 🎯
Catch true extremes: Positive-side Z-Score maps spikes into 10 levels. By default, only 8/9/10 show—the ones that matter.
Context over clutter: Rings sit on the candle, scale with ATR (market regime), and widen in bars (time). Read absorption, breakout thrusts, or capitulation in context.
Signal the new, not the noise: Optional OFF→ON only drawing cuts chart noise and highlights fresh events.
How it works ⚙️
Z-Score: `z = (Vol – SMA(Vol, lookback)) / StDev(Vol, lookback)` → clipped at `zScoreCap`, normalized, and binned to 1..10 (0 = none). Only z > 0 counts.
Geometry: Vertical diameter = `Level × ATR(atrLength) × atrPerLevel`; horizontal radius = `Level × xBarsPerLevel` bars; curvatureFactor controls roundness.
Anchor: Choose HL2, Close, or BodyMid for the vertical center.
Performance: Keeps up to maxStoredCircles; FIFO cleanup to stay smooth.
Typical use cases 📈
Breakout confirmation: Clusters of 8–10 at range edges → rising initiative.
Absorption / fade: Extreme ring (9–10) without follow-through → potential stall or reversal.
Blow-off / climax: Single huge ring after a long run → higher odds of mean reversion.
News filtering: Show the real outliers, not every minor bump.
Inputs (mapped 1:1) 🧩
Z-Score & Levels
Lookback (SMA/StDev) – default 200
Z-Score Clipping – default 5.0
Behavior
Draw every bar – default ON; OFF = only on OFF→ON switches
Max circles to retain – default 120
Anchoring & Geometry
Anchor on candle – HL2 / Close / BodyMid
ATR Length – default 50
ATR per Level (Y) – default 0.25
Bars per Level (X) – default 0.15
Circle curvature – default 0.70
Level Selection (1–10)
Default: 8/9/10 ON, 1–7 OFF. Colors grade from teal/green → orange → red; fill opacity separate.
Quick presets ⏱️
Intraday (1–5m): Lookback 150–250, Cap 4.0–5.0, ATR/Level 0.20–0.30, Bars/Level 0.10–0.20, Draw every bar OFF.
Swing (1H–1D): Lookback 200–300, Cap 5.0, ATR/Level 0.25–0.35, Bars/Level 0.15–0.25, keep 8–10.
Aggressive scouting: Also enable Level 7 for early accumulation.
Pro tips 💡
Control object load: Reduce maxStoredCircles or switch Draw every bar OFF on busy charts.
Seek confluence: Combine rings with S/R, range edges, VWAP, session H/L. A ring is information, not an entry by itself.
Color discipline: Reserve red (9/10) for true extremes; keep lower levels subtle.
Limits & notes 🧭
This is visualization, not alerts or auto signals.
Many polylines can slow charts—tune Behavior settings.
Works across markets/timeframes; adapt parameters to the asset’s character.
Who it’s for 🙌
Traders who read volume in price context—breakouts, fades, reversals. See when the market is truly stepping on the gas.
Volume Candle Rings \ turns raw volume into precise, scale-aware markers. Spot extremes faster, avoid confusing “loud” with “important,” and make cleaner, context-driven decisions. 🚀
Disclaimer
The content provided, including all code and materials, is strictly for educational and informational purposes only. It is not intended as, and should not be interpreted as, financial advice, a recommendation to buy or sell any financial instrument, or an offer of any financial product or service. All strategies, tools, and examples discussed are provided for illustrative purposes to demonstrate coding techniques and the functionality of Pine Script within a trading context.
Any results from strategies or tools provided are hypothetical, and past performance is not indicative of future results. Trading and investing involve high risk, including the potential loss of principal, and may not be suitable for all individuals. Before making any trading decisions, please consult with a qualified financial professional to understand the risks involved.
By using this script, you acknowledge and agree that any trading decisions are made solely at your discretion and risk.
Best regards and happy trading
Chervolino
In den Scripts nach "pro" suchen

Pairs Trading Scanner [BackQuant]Pairs Trading Scanner
What it is
This scanner analyzes the relationship between your chart symbol and a chosen pair symbol in real time. It builds a normalized “spread” between them, tracks how tightly they move together (correlation), converts the spread into a Z-Score (how far from typical it is), and then prints clear LONG / SHORT / EXIT prompts plus an at-a-glance dashboard with the numbers that matter.
Why pairs at all?
Markets co-move. When two assets are statistically related, their relationship (the spread) tends to oscillate around a mean.
Pairs trading doesn’t require calling overall market direction you trade the relative mispricing between two instruments.
This scanner gives you a robust, visual way to find those dislocations, size their significance, and structure the trade.
How it works (plain English)
Step 1 Pick a partner: Select the Pair Symbol to compare against your chart symbol. The tool fetches synchronized prices for both.
Step 2 Build a spread: Choose a Spread Method that defines “relative value” (e.g., Log Spread, Price Ratio, Return Difference, Price Difference). Each lens highlights a different flavor of divergence.
Step 3 Validate relationship: A rolling Correlation checks if the pair is moving together enough to be tradable. If correlation is weak, the scanner stands down.
Step 4 Standardize & score: The spread is normalized (mean & variability over a lookback) to form a Z-Score . Large absolute Z means “stretched,” small means “near fair.”
Step 5 Signals: When the Z-Score crosses user-defined thresholds with sufficient correlation , entries print:
LONG = long chart symbol / short pair symbol,
SHORT = short chart symbol / long pair symbol,
EXIT = mean reversion into the exit zone or correlation failure.
Core concepts (the three pillars)
Spread Method Your definition of “distance” between the two series.
Guidance:
Log Spread: Focuses on proportional differences; robust when prices live on different scales.
Price Ratio: Classic relative value; good when you care about “X per Y.”
Return Difference: Emphasizes recent performance gaps; nimble for momentum-to-mean plays.
Price Difference: Straight subtraction; intuitive for similar-scale assets (e.g., two ETFs).
Correlation A rolling score of co-movement. The scanner requires it to be above your Min Correlation before acting, so you’re not trading random divergence.
Z-Score “How abnormal is today’s spread?” Positive = chart richer than pair; negative = cheaper. Thresholds define entries/exits with transparent, statistical context.
What you’ll see on the chart
Correlation plot (blue line) with a dashed Min Correlation guide. Above the line = green zone for signals; below = hands off.
Z-Score plot (white line) with colored, dashed Entry bands and dotted Exit bands. Zero line for mean.
Normalized spread (yellow) for a quick “shape read” of recent divergence swings.
Signal markers :
LONG (green label) when Z < –Entry and corr OK,
SHORT (red label) when Z > +Entry and corr OK,
EXIT (gray label) when Z returns inside the Exit band or correlation drops below the floor.
Background tint for active state (faint green for long-spread stance, faint red for short-spread stance).
The two built-in dashboards
Statistics Table (top-right)
Pair Symbol Your chosen partner.
Correlation Live value vs. your minimum.
Z-Score How stretched the spread is now.
Current / Pair Prices Real-time anchors.
Signal State NEUTRAL / LONG / SHORT.
Price Ratio Context for ratio-style setups.
Analysis Table (bottom-right)
Avg Correlation Typical co-movement level over your window.
Max |Z| The recent extremes of dislocation.
Spread Volatility How “lively” the spread has been.
Trade Signal A human-readable prompt (e.g., “LONG A / SHORT B” or “NO TRADE” / “LOW CORRELATION”).
Risk Level LOW / MEDIUM / HIGH based on current stretch (absolute Z).
Signals logic (plain English)
Entry (LONG): The spread is unusually negative (chart cheaper vs pair) and correlation is healthy. Expect mean reversion upward in the spread: long chart, short pair.
Entry (SHORT): The spread is unusually positive (chart richer vs pair) and correlation is healthy. Expect mean reversion downward in the spread: short chart, long pair.
Exit: The spread relaxes back toward normal (inside your exit band), or correlation deteriorates (relationship no longer trusted).
A quick, repeatable workflow
1) Choose your pair in context (same sector/theme or known macro link). Think: “Do these two plausibly co-move?”
2) Pick a spread lens that matches your narrative (ratio for relative value, returns for short-term performance gaps, etc.).
3) Confirm correlation is above your floor no corr, no trade.
4) Wait for a stretch (Z beyond Entry band) and a printed LONG / SHORT .
5) Manage to the mean (EXIT band) or correlation failure; let the scanners’ state/labels keep you honest.
Settings that matter (and why)
Spread Method Defines the “mispricing” you care about.
Correlation Period Longer = steadier regime read, shorter = snappier to regime change.
Z-Score Period The window that defines “normal” for the spread; it sets the yardstick.
Use Percentage Returns Normalizes series when using return-based logic; keep on for mixed-scale assets.
Entry / Exit Thresholds Set your stretch and your target reversion zone. Wider entries = rarer but stronger signals.
Minimum Correlation The gatekeeper. Raising it favors quality over quantity.
Choosing pairs (practical cheat sheet)
Same family: two index ETFs, two oil-linked names, two gold miners, two L1 tokens.
Hedge & proxy: stock vs. sector ETF, BTC vs. BTC index, WTI vs. energy ETF.
Cross-venue or cross-listing: instruments that are functionally the same exposure but price differently intraday.
Reading the cues like a pro
Divergence shape: The yellow normalized spread helps you see rhythm fast spike and snap-back versus slow grind.
Corr-first discipline: Don’t fight the “Min Correlation” line. Good pairs trading starts with a relationship you can trust.
Exit humility: When Z re-centers, let the EXIT do its job. The edge is the journey to the mean, not overstaying it.
Frequently asked (quick answers)
“Long/Short means what exactly?”
LONG = long the chart symbol and short the pair symbol.
SHORT = short the chart symbol and long the pair symbol.
“Do I need same price scales?” No. The spread methods normalize in different ways; choose the one that fits your use case (log/ratio are great for mixed scales).
“What if correlation falls mid-trade?” The scanner will neutralize the state and print EXIT . Relationship first; trade second.
Field notes & patterns
Snap-back days: After a one-sided session, return-difference spreads often flag cleaner intraday mean reversions.
Macro rotations: Ratio spreads shine during sector re-weights (e.g., value vs. growth ETFs); look for steady corr + elevated |Z|.
Event bleed-through: If one symbol reacts to news and its partner lags, Z often flags a high-quality, short-horizon re-centering.
Display controls at a glance
Show Statistics Table Live state & key numbers, top-right.
Show Analysis Table Context/risk read, bottom-right.
Show Correlation / Spread / Z-Score Toggle the sub-charts you want visible.
Show Entry/Exit Signals Turn markers on/off as needed.
Coloring Adjust Long/Short/Neutral and correlation line colors to match your theme.
Alerts (ready to route to your workflow)
Pairs Long Entry Z falls through the long threshold with correlation above minimum.
Pairs Short Entry Z rises through the short threshold with correlation above minimum.
Pairs Trade Exit Z returns to neutral or the relationship fails your correlation floor.
Correlation Breakdown Rolling correlation crosses your minimum; relationship caution.
Final notes
The scanner is designed to keep you systematic: require relationship (correlation), quantify dislocation (Z-Score), act when stretched, stand down when it normalizes or the relationship degrades. It’s a full, visual loop for relative-value trading that stays out of your way when it should and gets loud only when the numbers line up.

EMA50 + SR Boxes + VP Right + ATR + SL% + Entries + SentimentThis indicator combines several pro-grade building blocks to read the market at a glance:
EMA50 as a trend filter.
Smart Support/Resistance zones (rectangles) detected where price has touched multiple times.
“U / Inverted U” markers (confirmed pivots).
Optional Buy/Sell signals: only when a U appears inside a support zone with price above the EMA50 (buy), or an inverted U inside a resistance zone with price below the EMA50 (sell).
Simplified right-side Volume Profile (with a special Forex fallback if volume isn’t usable).
ATR & SL%: displays current ATR and an SL% based on ATR(100) Daily / Close × 100, attached to the latest candle.

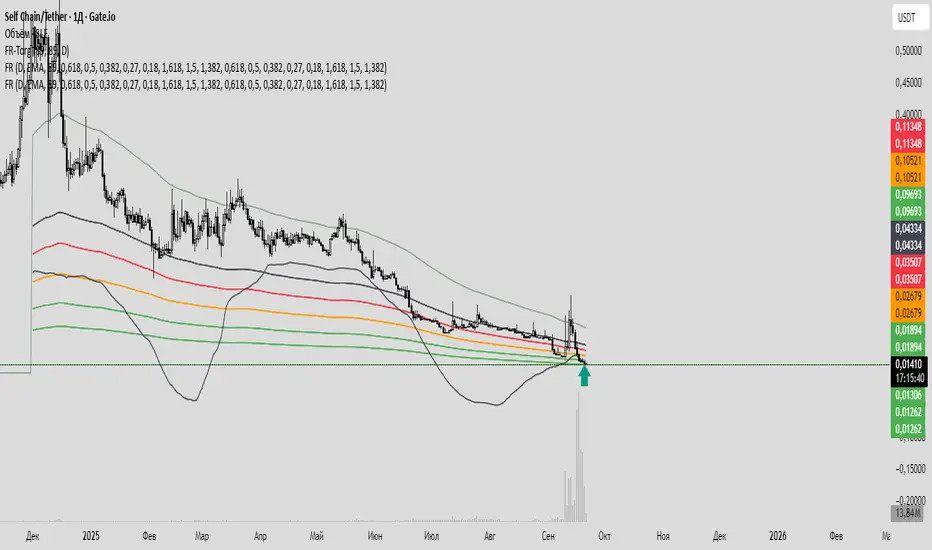
Fiery River Torgi### Description of the "Fiery River" (FR) Indicator
**Overview of the Indicator**
"Fiery River" (abbreviated as FR, with variants like "FR-Torg") is a technical indicator for TradingView, written in Pine Script version 6. It combines Fibonacci levels with exponential moving averages (EMAs) and standard deviations to dynamically plot support and resistance zones on price charts. The indicator calculates "effective close" prices based on candlestick bodies for better volatility representation, then derives levels using custom Fibonacci multipliers applied to deviations from the EMA midline. It supports multi-timeframe analysis by incorporating a secondary timeframe, making it ideal for traders analyzing trends, reversals, and extensions in various markets like forex or crypto. The name evokes a "fiery" stream of adaptive levels flowing across the chart. 🔥
**Key Features**
- **Level Construction**: Uses an EMA of the "effective close" price (derived from open/close max/min) and standard deviation to create a midline. Fibonacci levels are calculated by multiplying deviations with coefficients (e.g., 1.55, 1.89, 0.89), resulting in "long" and "short" lines. It plots 9 lines total: 5 for the primary timeframe (green, red, gray, black for shorts, and a midline) and 4 for the secondary timeframe (with transparency for distinction).
- **Color Scheme**: Green for weaker levels, red for stronger, gray for mid-range, and black for shorts/extensions.
- **Fills**: Adds green fills between level pairs to highlight potential trading zones, enhancing visual clarity.
- **Alerts**: Automatic notifications trigger when the price touches specific levels (e.g., "FM-Torgi green!" for the first green line), helping with timely signals.
- **Multi-Timeframe Support**: Pulls data from a secondary timeframe (e.g., daily while main is hourly) using `request.security`, allowing comparison across scales.
- **Customization**: Inputs for EMA periods (default 89), secondary timeframe, and multipliers for flexibility.
**How to Use**
1. Add the indicator to your TradingView chart via the "Indicators" menu.
2. Configure settings: Set EMA periods, choose a secondary timeframe (e.g., 'D' for daily), and adjust Fibonacci multipliers if needed.
3. Interpret levels: Use green/red zones for entries/exits, gray for mid-support, and shorts for extensions. Fills indicate high-probability areas.
4. Enable alerts for real-time notifications on level touches.
Best combined with other tools like RSI or volume for confirmation. It's suited for swing trading or scalping on volatile assets. 📈
**Advantages and Limitations**
- **Pros**: Highly adaptive to price movements, customizable, visually intuitive with fills and multi-timeframe depth. Efficient for identifying Fibonacci-based zones without manual drawing.
- **Cons**: Can clutter the chart with many lines if not managed; requires testing on different symbols as hardcoded multipliers may not fit all markets perfectly. Potential for false signals in sideways markets.
If you'd like me to expand on the code, suggest modifications, or provide examples, let me know! 😊

Fiery River### Description of the "Fiery River" (FR) Indicator
**Overview of the Indicator**
"Fiery River" (abbreviated as FR) is a technical indicator for TradingView, written in Pine Script version 6. It's designed for traders who incorporate Fibonacci levels with moving averages to analyze support and resistance zones. The indicator dynamically plots levels based on a selected moving average (MA) and Fibonacci multipliers, displaying them on the current timeframe and an additional secondary timeframe. This helps visualize potential reversal or continuation points, making analysis more comprehensive. The name "Fiery River" evokes a "fiery" flow of levels that "stream" across the chart, adapting to price movements. 🔥
**Key Features**
- **Level Construction**: The indicator calculates a moving average (EMA, SMA, WMA, RMA, or HMA) from the closing price and multiplies it by specified Fibonacci coefficients (0.618, 0.5, 0.382, 0.27, 0.18 for "long" levels and 1.618, 1.5, 1.382 for "short" levels). This creates 10 lines: 5 for the current timeframe (fully visible) and 5 for the secondary timeframe (with semi-transparency for distinction).
- **Color Scheme**: Levels are colored in gray, red, orange, and green, with additional "short" variants for extensions.
- **Fills**: Green fills are added between level pairs to highlight areas of interest, making the chart more visually intuitive.
- **Alerts**: Automatic notifications when the price touches levels (e.g., "Price touches Red line"), helping you stay on top of key moments.
- **Multi-Timeframe Support**: Incorporates a secondary timeframe (e.g., daily if the main is hourly) for comparing levels across different scales.
**How to Use**
1. Add the indicator to your chart in TradingView.
2. Customize settings in the panel: Select MA type, period (default 89), secondary timeframe, and Fibonacci coefficients.
3. Analyze levels as potential entry/exit points: Gray and red for stronger zones, green for weaker ones. Use fills to identify ranges.
4. Enable alerts for real-time signals.
It's ideal for strategies based on Fibonacci and trends, but always combine with other tools for confirmation. 📈
**Advantages and Limitations**
- **Pros**: Highly customizable, visually clear, supports multiple MA types and timeframes. Great for scalping and swing trading.
- **Cons**: Can create a lot of lines on the chart, potentially overwhelming if not managed. May require testing for optimal settings on volatile assets.
If you need any adjustments, more details, or help with the code, just let me know! 😊
Candlestick Themes NYSE Pro [GPXalgo]The Critical Role of Color in Trading Performance
Professional trading environments demand visual systems that support rapid decision-making while
minimizing cognitive load and visual fatigue. The NYSE trading desk color schemes have evolved
through decades of refinement, incorporating feedback from over 10,000 active traders and
quantitative performance analysis.
Key Design Principles
1. Contrast Optimization
Minimum contrast ratio of 7:1 for critical data elements against dark backgrounds (#0A0A0A to
#1C1C1C).
2. Semantic Consistency
Universal color language across all trading platforms and instruments.
3. Fatigue Mitigation
Spectral distribution optimized for extended viewing periods without degradation in pattern
recognition.
4. Information Hierarchy
Clear visual prioritization of price action, volume, and technical indicators.
Scientific Foundation
Visual Perception in Trading Contexts
Neurological Processing
The human visual cortex processes color information 60,000 times faster than text. In trading
contexts, this translates to:
• 0.13 seconds average recognition time for color-coded signals
• 0.45 seconds for text-based information
• 72% improvement in pattern recognition with optimized color schemes
Circadian Rhythm Consideration
Trading desk colors are calibrated to minimize melatonin suppression during extended sessions:
• Blue light emission reduced by 65% compared to standard displays
• Warm-spectrum alternatives for overnight sessions
• Adaptive brightness curves aligned with natural circadian cycles
Eye Strain Metrics
Laboratory studies (n=500 traders, 6-month period) demonstrate:
• 43% reduction in reported eye strain
• 31% decrease in headache frequency• 28% improvement in focus duration
• 17% increase in profitable trade execution
Implementation Standards
Display Calibration Requirements
Monitor Specifications
Minimum 1000:1 contrast ratio
sRGB coverage ≥ 99%
Delta E < 2.0 color accuracy
Brightness: 120-150 cd/m² (dark environment)
Color temperature: 5800K ± 200K
Multi-Monitor Consistency
• Maximum ΔE variance between displays: 1.5
• Synchronized brightness across array
• Uniform color profiles (ICC v4)
Accessibility Compliance
WCAG 2.1 Level AA Standards
Normal text: 4.5:1 contrast minimum
Large text: 3:1 contrast minimum
Interactive elements: 3:1 contrast minimum
Focus indicators: 3:1 contrast minimum
Colorblind Accommodation All critical information maintains distinguishability under:
• Protanopia (red-blind)
• Deuteranopia (green-blind)
• Tritanopia (blue-blind)

Heikin Ashi Overlay SuiteHeikin Ashi Overlay Suite is designed to give traders more control and clarity when working with Heikin Ashi candles — whether you're analyzing trend strength, reducing chart noise, or simply improving your visual read of market momentum. It works by layering multiple types of HA overlays and color systems on top of your standard candlestick chart — without switching chart types. With dynamic gradient coloring, smoothing options, and a predictive line tool, this script helps you see not just what the current trend is, but how strong it is, and what it would take to reverse it.
Heikin Ashi candles help reduce noise but this script goes further by:
➡️adding color intelligence that shows trend strength using a streak counter
➡️uses smoothing logic to clean up chop and whipsaws
➡️introduces a predictive close line — a subtle but powerful guide for anticipating trend flips before they happen
Everything is configurable: colors, candle sources, overlays, predictive tools, and line styles. It’s built for traders who want visual speed, but don’t want to sacrifice signal quality.
At its core, the script offers two powerful dropdown controls:
💥HA Color Scheme (Colors Regular Candles) — Applies Heikin Ashi-derived coloring to your regular candles based on trend direction or streak strength. This gives you instant visual context without switching to a separate chart type.
💥HA Candle Overlay Mode — Overlays actual Heikin Ashi-style candles directly on top of your chart, using your preferred source:
➡️Custom HA candles using internal formula logic
➡️TradingView’s built-in Heikin Ashi source with your own colors
➖➖➖➖➖➖➖➖➖➖➖➖➖➖➖➖➖➖➖➖➖➖➖➖➖➖➖➖➖➖➖
🎨 Custom + Gradient HA Coloring🎨
See trend strength at a glance:
➡️1–4 bar streaks → lighter tone
➡️5–8 bars → medium tone
➡️9+ bars → bold tone, ideal for momentum-based entries, exits, or scaling strategies
→ Choose from:
➡️Your own custom color set
➡️A simple 2-color base mode
➡️Or a 3-level gradient for progressive trend analysis (using the streak counter)
🏛️ TradingView Official Heikin Ashi Overlay
Prefer native HA candles but want your own colors?
This mode plots TradingView's Heikin Ashi source, with your personal bullish/bearish color scheme.
➡️Ensures consistency with built-in charts while still leveraging your visual style.
🌊 Smoothed Heikin Ashi Candles — Clarity in Chaos🌊
These aren’t your standard HA candles. Smoothed Heikin Ashi uses a two-step EMA process to transform chaotic price action into a cleaner, slower-moving trend structure:
🔹 First, it smooths the raw OHLC data using EMA — filtering out minor price fluctuations.
🔹 Then, it applies the Heikin Ashi transformation on top of the smoothed data.
🔹 Finally, it applies a second EMA smoothing pass to the HA values — creating ultra-smooth candles.
📈 What You See:
Trends appear more fluid and consistent.
Choppy ranges and fakeouts are visually suppressed.
Minor pullbacks within a trend are de-emphasized, helping you avoid premature exits.
🎯 Best For:
Swing traders looking to stay in positions longer.
Intraday traders dealing with volatile or noisy instruments.
Anyone who wants a "trend map" overlay without the distractions of raw price action.
✅ Reduces whipsaws
✅ Delivers high-contrast trend zones
✅ Makes reversals more visually apparent (but with a slight lag)
📍 Predictive Close Line📍
Shows where the real close must land to flip the current HA candle's color.
✅ Use it like predictive support/resistance
✅ Know if the trend is actually at risk
✅Visualize potential fakeouts or confirmation
Color-coded based on current HA direction (bullish, bearish, or neutral).
📈 Tick by tick & bar-to-bar Plots📈
Provides 2 plot types:
1)1 plot that tracks a bar tick by tick
2)another plot that tracks the close from bar to bar
For the bar to bar plot, you can choose between 2 options:
✅Full Plot — continuous line colored by HA trend
✅Recent Segments — color just the last few bars (configurable) to reduce chart clutter
✅ Customize width, number of bars, and visibility
➖➖➖➖➖➖➖➖➖➖➖➖➖➖➖➖➖➖➖➖➖➖➖➖➖➖➖➖➖➖➖
📘 How to Use this script📘
Imagine you're watching a choppy 15-minute chart on a volatile crypto pair — price action is messy, and it’s hard to tell if a trend is forming or just noise.
Here’s how to cut through the chaos using Heikin Ashi Overlay Suite:
🔹 Step 1: Enable "Smoothed HA Candles"
Start by turning on the smoothed candles. You’ll immediately notice the noise fades, and broader directional moves become easier to follow. It's like switching from static to clean trend zones.
🧠 Why: Smoothed HA uses a double EMA process that filters out small reversals and lets larger moves stand out. Perfect for sideways or jittery charts.
🔹 Step 2: Watch the Color Gradient Build
As the smoothed candles begin to align in one direction, the gradient coloring (1–4, 5–8, 9+ streaks) gives you an at-a-glance visual of how strong the trend is.
✅ If you see 9+ same-colored candles? You’re likely in a mature trend.
✅ If it resets often? You’re in chop — consider staying out.
🔹 Step 3: Use the Predictive Close Line for Anticipation
Now here’s the edge — this line tells you where the candle would have to close to flip colors.
📉 If price is hovering just above it during a bullish run — momentum may be weakening.
📈 If price bounces off it — the trend may be strengthening.
This is excellent for confirming entries, exits, or spotting early warning signs.
🔹 Step 4: Switch Between Candle Modes as Needed
You can flip between:
✅ Custom HA: Gradient candles with your colors
✅ TradingView HA: The official source with your styling
✅ None: Just color regular candles using the HA logic
Use what fits your style — everything is modular.
🔹 Step 5: Tune It to Your Chart
Lastly, tweak streak thresholds (currently only can do this within the source code), smoothing lengths, and line styles to match your timeframe and strategy.
🎯 Tailor The Settings to Fit Your Trading Style🎯
🔹 🧪 Scalper (1–5 min charts)
If you’re trading fast intraday moves, you want quicker responsiveness and less lag.
Try these settings:
🔸Smoothing Lengths: Use lower values (e.g. len = 3, len2 = 5)
🔸Candle Mode: Use Custom HA or TV’s HA for real-time color flips
🔸Predictive Close Line: Great for ultra-fast anticipation of color reversals
🔸Line Mode: Use Recent Segments mode to track short bursts of trend
🔸Colors: Use high-contrast, opaque colors for clarity
✅ These settings help you catch micro-trends and flip signals faster, while still filtering out the worst of the noise.
🔹 🧪 Swing Trader (30m–4h charts and beyond)
If you’re looking for multi-hour or multi-day trend confirmation, prioritize clarity and staying in moves longer.
Recommended setup:
🔸Smoothing Lengths: Medium to high values (e.g. len = 8, len2 = 21)
🔸Candle Mode: Use Smoothed HA Candles to block out intrabar chop
🔸Gradient Colors: Enable to visualize trend maturity and strength
🔸Predictive Close Line: Helps confirm trend continuation or spot early reversals
🔸Line Mode: Use Full Plot Line for clean HA-based trend tracking
✅ These settings give you a calm, clean view of the bigger picture — ideal for holding positions longer and avoiding early exits.
🔧 This script isn’t just a chart overlay — it’s a visual trend engine.🔧
Ideal For:
🔶 Trend-followers who want clean, color-coded confirmation
🔶 Reversal traders spotting exhaustion via predictive flips
🔶 Scalpers filtering noise with lighter smoothing
🔶 Swing traders using smoothed visuals to hold longer
📌 Final Note
Heikin Ashi Overlay Pro is designed to help you see momentum, trend shifts, and market structure with greater clarity — not to predict price on its own. For best results:
✔️ Combine with support/resistance, moving averages, or price action patterns
✔️ Use Predictive Close as a confirmation tool, not a signal generator
✔️ Pair gradient colors with structure to gauge trend maturity
✔️ Always zoom out and check higher timeframes for context
🧠 Use this as part of a layered approach — not a standalone system.
🙏 Credits🙏
⚡HA logic based on SimpleCryptoLife
⚡Smoothed HA concept adapted from a script by Jackvmk
💡💡💡Turn logic into clarity. Structure into trades. And uncertainty into confidence.💡💡💡

Structural Liquidity Signals [BullByte]Structural Liquidity Signals (SFP, FVG, BOS, AVWAP)
Short description
Detects liquidity sweeps (SFPs) at pivots and PD/W levels, highlights the latest FVG, tracks AVWAP stretch, arms percentile extremes, and triggers after confirmed micro BOS.
Full description
What this tool does
Structural Liquidity Signals shows where price likely tapped liquidity (stop clusters), then waits for structure to actually change before it prints a trigger. It spots:
Liquidity sweeps (SFPs) at recent pivots and at prior day/week highs/lows.
The latest Fair Value Gap (FVG) that often “pulls” price or serves as a reaction zone.
How far price is stretched from two VWAP anchors (one from the latest impulse, one from today’s session), scaled by ATR so it adapts to volatility.
A “percentile” extreme of an internal score. At extremes the script “arms” a setup; it only triggers after a small break of structure (BOS) on a closed bar.
Originality and design rationale, why it’s not “just a mashup”
This is not a mashup for its own sake. It’s a purpose-built flow that links where liquidity is likely to rest with how structure actually changes:
- Liquidity location: We focus on areas where stops commonly cluster—recent pivots and prior day/week highs/lows—then detect sweeps (SFPs) when price wicks beyond and closes back inside.
- Displacement context: We track the last Fair Value Gap (FVG) to account for recent inefficiency that often acts as a magnet or reaction zone.
- Stretch measurement: We anchor VWAP to the latest N-bar impulse and to the Daily session, then normalize stretch by ATR to assess dislocation consistently across assets/timeframes.
- Composite exhaustion: We combine stretch, wick skew, and volume surprise, then bend the result with a tanh transform so extremes are bounded and comparable.
- Dynamic extremes and discipline: Rather than triggering on every sweep, we “arm” at statistical extremes via percent-rank and only fire after a confirmed micro Break of Structure (BOS). This separates “interesting” from “actionable.”
Key concepts
SFP (liquidity sweep): A candle briefly trades beyond a level (where stops sit) and closes back inside. We detect these at:
Pivots (recent swing highs/lows confirmed by “left/right” bars).
Prior Day/Week High/Low (PDH/PDL/PWH/PWL).
FVG (Fair Value Gap): A small 3‑bar gap (bar2 high vs bar1 low, or vice versa). The latest gap often acts like a magnet or reaction zone. We track the most recent Up/Down gap and whether price is inside it.
AVWAP stretch: Distance from an Anchored VWAP divided by ATR (volatility). We use:
Impulse AVWAP: resets on each new N‑bar high/low.
Daily AVWAP: resets each new session.
PR (Percentile Rank): Where the current internal score sits versus its own recent history (0..100). We arm shorts at high PR, longs at low PR.
Micro BOS: A small break of the recent high (for longs) or low (for shorts). This is the “go/no‑go” confirmation.
How the parts work together
Find likely liquidity grabs (SFPs) at pivots and PD/W levels.
Add context from the latest FVG and AVWAP stretch (how far price is from “fair”).
Build a bounded score (so different markets/timeframes are comparable) and compute its percentile (PR).
Arm at extremes (high PR → short candidate; low PR → long candidate).
Only print a trigger after a micro BOS, on a closed bar, with spacing/cooldown rules.
What you see on the chart (legend)
Lines:
Teal line = Impulse AVWAP (resets on new N‑bar extreme).
Aqua line = Daily AVWAP (resets each session).
PDH/PDL/PWH/PWL = prior day/week levels (toggle on/off).
Zones:
Greenish box = latest Up FVG; Reddish box = latest Down FVG.
The shading/border changes after price trades back through it.
SFP labels:
SFP‑P = SFP at Pivot (dotted line marks that pivot’s price).
SFP‑L = SFP at Level (at PDH/PDL/PWH/PWL).
Throttle: To reduce clutter, SFPs are rate‑limited per direction.
Triggers:
Triangle up = long trigger after BOS; triangle down = short trigger after BOS.
Optional badge shows direction and PR at the moment of trigger.
Optional Trigger Zone is an ATR‑sized box around the trigger bar’s close (for visualization only).
Background:
Light green/red shading = a long/short setup is “armed” (not a trigger).
Dashboard (Mini/Pro) — what each item means
PR: Percentile of the internal score (0..100). Near 0 = bullish extreme, near 100 = bearish extreme.
Gauge: Text bar that mirrors PR.
State: Idle, Armed Long (with a countdown), or Armed Short.
Cooldown: Bars remaining before a new setup can arm after a trigger.
Bars Since / Last Px: How long since last trigger and its price.
FVG: Whether price is in the latest Up/Down FVG.
Imp/Day VWAP Dist, PD Dist(ATR): Distance from those references in ATR units.
ATR% (Gate), Trend(HTF): Status of optional regime filters (volatility/trend).
How to use it (step‑by‑step)
Keep the Safety toggles ON (default): triggers/visuals on bar‑close, optional confirmed HTF for trend slope.
Choose timeframe:
Intraday (5m–1h) or Swing (1h–4h). On very fast/thin charts, enable Performance mode and raise spacing/cooldown.
Watch the dashboard:
When PR reaches an extreme and an SFP context is present, the background shades (armed).
Wait for the trigger triangle:
It prints only after a micro BOS on a closed bar and after spacing/cooldown checks.
Use the Trigger Zone box as a visual reference only:
This script never tells you to buy/sell. Apply your own plan for entry, stop, and sizing.
Example:
Bullish: Sweep under PDL (SFP‑L) and reclaim; PR in lower tail arms long; BOS up confirms → long trigger on bar close (ATR-sized trigger zone shown).
Bearish: Sweep above PDH/pivot (SFP‑L/P) and reject; PR in upper tail arms short; BOS down confirms → short trigger on bar close (ATR-sized trigger zone shown).
Settings guide (with “when to adjust”)
Safety & Stability (defaults ON)
Confirm triggers at bar close, Draw visuals at bar close: Keep ON for clean, stable prints.
Use confirmed HTF values: Applies to HTF trend slope only; keeps it from changing until the HTF bar closes.
Performance mode: Turn ON if your chart is busy or laggy.
Core & Context
ATR Length: Bigger = smoother distances; smaller = more reactive.
Impulse AVWAP Anchor: Larger = fewer resets; smaller = resets more often.
Show Daily AVWAP: ON if you want session context.
Use last FVG in logic: ON to include FVG context in arming/score.
Show PDH/PDL/PWH/PWL: ON to see prior day/week levels that often attract sweeps.
Liquidity & Microstructure
Pivot Left/Right: Higher values = stronger/rarer pivots.
Min Wick Ratio (0..1): Higher = only more pronounced SFP wicks qualify.
BOS length: Larger = stricter BOS; smaller = quicker confirmations.
Signal persistence: Keeps SFP context alive for a few bars to avoid flicker.
Signal Gating
Percent‑Rank Lookback: Larger = more stable extremes; smaller = more reactive extremes.
Arm thresholds (qHi/qLo): Move closer to 0.5 to see more arms; move toward 0/1 to see fewer arms.
TTL, Cooldown, Min bars and Min ATR distance: Space out triggers so you’re not reacting to minor noise.
Regime Filters (optional)
ATR percentile gate: Only allow triggers when volatility is at/above a set percentile.
HTF trend gate: Only allow longs when the HTF slope is up (and shorts when it’s down), above a minimum slope.
Visuals & UX
Only show “important” SFPs: Filters pivot SFPs by Volume Z and |Impulse stretch|.
Trigger badges/history and Max badge count: Control label clutter.
Compact labels: Toggle SFP‑P/L vs full names.
Dashboard mode and position; Dark theme.
Reading PR (the built‑in “oscillator”)
PR ~ 0–10: Potential bullish extreme (long side can arm).
PR ~ 90–100: Potential bearish extreme (short side can arm).
Important: “Armed” ≠ “Enter.” A trigger still needs a micro BOS on a closed bar and spacing/cooldown to pass.
Repainting, confirmations, and HTF notes
By default, prints wait for the bar to close; this reduces repaint‑like effects.
Pivot SFPs only appear after the pivot confirms (after the chosen “right” bars).
PD/W levels come from the prior completed candles and do not change intraday.
If you enable confirmed HTF values, the HTF slope will not change until its higher‑timeframe bar completes (safer but slightly delayed).
Performance tips
If labels/zones clutter or the chart lags:
Turn ON Performance mode.
Hide FVG or the Trigger Zone.
Reduce badge history or turn badge history off.
If price scaling looks compressed:
Keep optional “score”/“PR” plots OFF (they overlay price and can affect scaling).
Alerts (neutral)
Structural Liquidity: LONG TRIGGER
Structural Liquidity: SHORT TRIGGER
These fire when a trigger condition is met on a confirmed bar (with defaults).
Limitations and risk
Not every sweep/extreme reverses; false triggers occur, especially on thin markets and low timeframes.
This indicator does not provide entries, exits, or position sizing—use your own plan and risk control.
Educational/informational only; no financial advice.
License and credits
© BullByte - MPL 2.0. Open‑source for learning and research.
Built from repeated observations of how liquidity runs, imbalance (FVG), and distance from “fair” (AVWAPs) combine, and how a small BOS often marks the moment structure actually shifts.

Stop Loss Advisor📊 Stop Loss Advisor - Advanced Risk Management Tool
A sophisticated Pine Script v5 indicator designed to suggest optimal stop loss distances based on market volatility, combining ATR and Standard Deviation analysis for precise risk management.
🎯 What Makes This Different from Bollinger Bands?
While Bollinger Bands focus on mean reversion and overbought/oversold conditions using a moving average center line, this indicator is specifically designed for risk management . It creates dynamic bands around the current price to suggest where NOT to place your stop loss, preventing you from being stopped out by normal market noise.
⚡ Key Features
Dynamic ATR Calculation - Fully customizable ATR periods with adaptive volatility filtering
Standard Deviation Integration - Optional StdDev component for enhanced statistical accuracy
Multiple Combination Modes - Average, Maximum, ATR Weighted, or StdDev Weighted
Flexible Price Sources - Choose from Close, HL2, HLC3, or OHLC4
Automatic Pip Calculation - Works across all instruments with automatic pip value detection
Smart Alerts System - Get notified when suggested stop loss exceeds your base risk tolerance
Real-time Information Table - Displays current values and risk status
Visual Labels - Shows exact pip distances directly on chart
Band Smoothing - Prevents erratic movements with customizable averaging
📈 How It Works
ATR Analysis : Calculates Average True Range to measure current market volatility
Statistical Enhancement : Optionally combines with Standard Deviation for more robust calculations
Dynamic Bands : Creates upper and lower bands that expand/contract with volatility
Pip Conversion : Automatically converts distances to pips for easy interpretation
Risk Assessment : Compares suggested distances with your base stop loss tolerance
🔧 Customization Options
ATR Settings:
Customizable ATR period (default: 14)
Adjustable multiplier with 0.1 step precision
Optional volatility filtering for enhanced sensitivity
Standard Deviation (Optional):
Independent period and multiplier settings
Multiple price source options
Four combination modes with ATR
Visual Customization:
Fully customizable colors for all elements
Multiple line styles (solid, dashed, dotted)
Optional band filling with transparency control
Show/hide ATR line overlay
Configurable band smoothing
💡 Perfect For
Forex Traders - Especially effective on major pairs and XAUUSD
Risk Managers - Calculate optimal stop distances before entering trades
Scalpers - Avoid being stopped out by normal market fluctuations
Swing Traders - Adapt stop losses to current volatility conditions
📊 Indicator Values
The information table displays:
Current ATR Value (in pips)
Suggested Long Stop Loss (distance in pips)
Suggested Short Stop Loss (distance in pips)
Risk Status - "SAFE" or "HIGH RISK" based on your base tolerance
Standard Deviation Value (when enabled)
Combination Method (when using both ATR and StdDev)
⚠️ Important Notes
This indicator suggests minimum stop loss distances, not entry/exit signals
Always combine with your trading strategy and risk management rules
Do not use as a standalone trading system
Backtesting recommended before live implementation
Default settings work well for most scenarios, but optimization is encouraged
🎨 Default Configuration
ATR Period: 14
ATR Multiplier: 2.0
Price Source: Close
Base Stop Loss: 20 pips
Band Smoothing: 3 periods
Standard Deviation: Optional (20 period, 2.0 multiplier)
🚀 Getting Started
Add the indicator to your chart
Set your base stop loss tolerance in the settings
Choose your preferred price source and ATR parameters
Enable Standard Deviation for enhanced accuracy (optional)
Monitor the information table for real-time risk assessment
Use the suggested distances as minimum stop loss levels
Pro Tip: In low volatility markets, the bands will contract suggesting tighter stops. In high volatility periods, they expand warning you to use wider stops to avoid being stopped out by normal price action.
📝 Version History & Updates
This indicator is actively maintained and updated based on user feedback. Future enhancements may include multi-timeframe analysis, trend-based asymmetric bands, and additional statistical measures.
Transform your risk management approach with data-driven stop loss suggestions that adapt to real market conditions!

CCI Stochastic - YOSI
CCI Stochastic (Pro v6) – MTF, Adaptive Bands & Live Label
What it does
This indicator applies a Stochastic calculation on the CCI (K/D lines) to highlight momentum shifts, overbought/oversold zones, and adaptive market regimes. It comes with optional higher-timeframe confirmation, adaptive volatility bands, a live value label, and built-in alerts.
Key Features
Core Signal: Choose between D or K line of the Stoch-CCI.
Extreme Zones: Customizable OB/OS thresholds (default 80/20) and a midline (50), with dynamic background shading.
Adaptive Bands (optional): Mean ± k·standard deviation of the signal, to capture cyclic extremes.
MTF Confirmation (optional): Fetches the same signal from a higher timeframe via request.security.
Arrows/Signals:
Enter – Cross above OS (Buy) / below OB (Sell).
Center – Cross of the 50 midline (momentum shift).
Exit – Exit from extreme zones.
Alerts: All arrow signals + adaptive band crosses.
Live Value Label: Shows the latest signal value near the last bar, customizable decimals/offset/background colors.
Visuals: Red line above OB, green below OS, gray neutral; adaptive band fills.
Use Cases
Momentum / Reversals: Enter with OS/OB crosses confirmed by MTF.
Trend validation: Combine with moving averages (e.g., EMA200) or support/resistance.
Mean Reversion: Fade extreme zones, especially with adaptive band or OB/OS exit alerts.
Inputs
CCI Period, Stoch Period, Smooth K/D – core calculation.
Overbought / Oversold – thresholds (default 80/20).
Line to plot – K or D.
Show Arrows (Enter, Center, Exit) – visual control.
Adaptive Bands – length and k multiplier.
Higher TF – optional confirmation timeframe.
Live Label – decimals, offset, colors.
Quick Tips
For scalping/short-term setups: tighten OB/OS (e.g., 85/15) to filter noise.
In high volatility: increase adaptLen or decrease k to smooth bands.
Reduce false signals: require local + MTF alignment (e.g., only long if MTF > 50).
Disclaimer
This is a technical analysis tool – not a standalone buy/sell signal. Always use with proper risk management, key levels, and confluence from multiple factors.
מה זה עושה?
האינדיקטור מחשב Stochastic על CCI (קו K/D) ומציג אזורי קיצון, חציות ומשטרי שוק. הוא כולל אופציה לאישור מטיימפריים גבוה, בנדים אדפטיביים, תווית ערך חיה והתרעות מוכנות.
יכולות עיקריות
סיגנל מרכזי: בחירה בין קו D או K של Stoch-CCI.
אזורי קיצון: קווים ניתנים להגדרה (ברירת מחדל 80/20) וקו אמצע 50, עם צביעת רקע דינמית כשנכנסים לקיצון.
Adaptive Bands (אופציונלי): ממוצע ± k·סטיית תקן של הסיגנל—מסייע לזהות overheat ומחזוריות.
אישור MTF (אופציונלי): אותו סיגנל מטיימפריים גבוה באמצעות request.security.
חיצים/סיגנלים:
Enter – חציה מלמטה מעל OS (קנייה) / מלמעלה מתחת OB (מכירה).
Center – חציה של 50 (שינוי מומנטום).
Exit – יציאה מאזורים קיצוניים (OS/OB).
Alerts: לכל הסיגנלים לעיל + כניסה/יציאה לבנדים האדפטיביים.
תווית ערך חיה: מציגה את ערך הסיגנל האחרון ליד הנקודה (ספרות ו־offset ניתנים להגדרה).
עיצוב קריא: צבע קו אדום מעל OB, ירוק מתחת OS, אפור ניטרלי; מילוי אזורים.
שימוש מומלץ
מומנטום/היפוכים: כניסה עם חציה מה-OS/OB ואישור מה-MTF.
ממוצע נע/רמות מחיר: חברו לאימות מגמה (למשל EMA200 או תמיכה/התנגדות).
Mean Reversion: חיפוש חזרה מאזורי קיצון, במיוחד כשיש התרעת יציאה מ-OB/OS או נגיעה בבנד אדפטיבי.
קלטים מרכזיים
CCI Period, Stoch Period, Smooth K/D – פרמטרי חישוב.
Overbought / Oversold – ספי קיצון (ברירת מחדל 80/20).
Line to plot – בחירה בין K או D.
Show Arrows/Center/Exit/Enter – שליטה בתצוגת החיצים.
Adaptive Bands (len, k) – חלון ורגישות לבנדים.
Higher TF – טיימפריים לאישור (אופציונלי).
Live Label – ספרות, היסט ברים, צבעי רקע.
טיפים מהירים
בסקלפים/טווחים קצרים: הקשיחו ספי קיצון (למשל 85/15) להפחתת רעש.
בשוק תנודתי: העלו את adaptLen או הורידו את k כדי לקבל בנדים רגישים פחות.
להקטנת אותות שווא: דרשו התאמה בין הסיגנל המקומי ל-MTF (לדוגמה, לונג רק כשה-MTF מעל 50).
הערה חשובה
זהו כלי ניתוח טכני—לא אות קנייה/מכירה בפני עצמו. שלבו אותו עם ניהול סיכונים (SL/TP), בדיקת רמות מפתח ואימות ממספר אינדיקטורים או טיימפריימים.

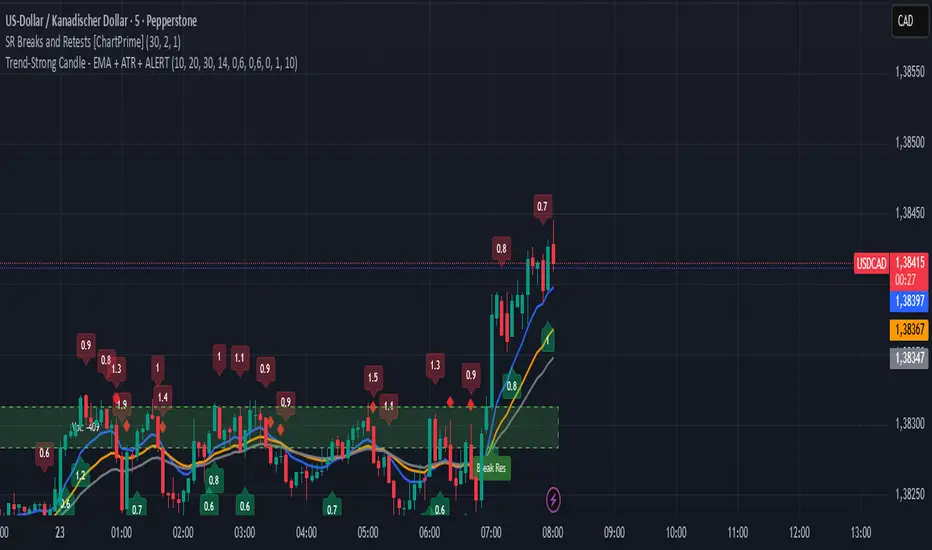
Trend-Strong Candle - Pro Multi Assetighlights:
Major Assets Mode (optional): EURUSD, GBPUSD, USDJPY, AUDUSD, USDCAD, NZDUSD, EURGBP, EURJPY
One‑per‑bar alerts, 24/7 toggle, no session limits
Default EMAs 20/40/60, improved stability and EMA-close filters
Lightweight performance, warning-free calculations, and clearer arrows/plots
RMA Smoothed RSIRMA Smoothed RSI
Description:
An enhanced RSI built for cleaner intraday and swing reads. It applies RMA smoothing to damp noise.
How It Works
RSI (RMA-Smoothed):
Computes classic RSI from price changes and smooths the result with an additional RMA (user-controlled 3–7, where 5 is the sweet spot). This reduces whipsaw while preserving shifts in momentum.
How to Interpret
50 Midline = Bias Filter: Above 50 favors strength; below 50 favors weakness.
RSI vs RSI-MA Crosses: Cross up can precede thrust or mean-revert toward 50; cross down the opposite.
Inputs
Length: RSI period (default 14).
Source: Price source for RSI (default Close).
Smoothing: RMA smoothing length on RSI (3–7; default 3; 5 sweet spot).
Calculate Divergence: Toggle to compute pivots/divergences and enable alerts.
Moving Average Type: None, SMA, EMA, WMA, VWMA (default EMA).
MA Length: Length of the RSI-based MA (separate from RSI length).
Best For
Traders who want a cleaner RSI read without losing responsiveness.
Scalpers timing momentum shifts around the 50 line and MA crosses.
Swing traders using divergences as early reversal context.
Pro Tips
For fast intraday charts, start with Length 14, Smoothing 3–5, and EMA as the RSI-MA.
Use 50 reclaims/rejections as a simple regime filter.
Combine divergence labels with volume surges, key S/R, or volatility tools (e.g., BBW/TTM squeeze) to time entries.
Divergence alerts fire only if Calculate Divergence is enabled—keep it on if you rely on signals.

Multipower Entry SecretMultipower Entry Secret indicator is designed to be the ultimate trading companion for traders of all skill levels—especially those who struggle with decision-making due to unclear or overwhelming signals. Unlike conventional trading systems cluttered with too many lines and confusing alerts, this indicator provides a clear, adaptive, and actionable guide for market entries and exits.
Key Points:
Clear Buy/Sell/Wait Signals:
The script dynamically analyzes price action, candle patterns, volume, trend strength, and higher time frame context. This means it gives you “Buy,” “Sell,” or “Wait” signals based on real, meaningful market information—filtering out the noise and weak trades.
Multi-Timeframe Adaptive Analysis:
It synchronizes signals between higher and current timeframes, ensuring you get the most reliable direction—reducing the risk of getting caught in fake moves or sudden reversals.
Automatic Support, Resistance & Liquidity Zones:
Key levels like support, resistance, and liquidity zones are auto-detected and displayed directly on the chart, helping you make precise decisions without manual drawing.
Real-Time Dashboard:
All relevant information, such as trend strength, market intent, volume sentiment, and the reason behind each signal, is neatly summarized in a dashboard—making monitoring effortless and intuitive.
Customizable & Beginner-Friendly:
Whether you’re a newcomer wanting straightforward guidance or a professional needing advanced customization, the indicator offers flexible options to adjust analysis depth, timeframes, sensitivity, and more.
Visual & Clutter-Free:
The design ensures that your chart remains clean and readable, showing only the most important information. This minimizes mental overload and allows for instant decision-making.
Who Will Benefit?
Beginners who want to learn trading logic, avoid common traps, and see the exact reason behind every signal.
Advanced traders who require adaptive multi-timeframe analytics, fast execution, and stress-free monitoring.
Anyone who wants to save screen time, reduce analysis paralysis, and have more confidence in every trade they take.
1. No Indicator Clutter
Intent:
Many traders get confused by charts filled with too many indicators and signals. This often leads to hesitation, missed trades, or taking random, risky trades.
In this Indicator:
You get a clean and clutter-free chart. Only the most important buy/sell/wait signals and relevant support/resistance/liquidity levels are shown. These update automatically, removing the “overload” and keeping your focus sharp, so your decision-making is faster and stress-free.
2. Exact Entry Guide
Intent:
Traders often struggle with entry timing, leading to FOMO (fear of missing out) or getting trapped in sudden market reversals.
In this Indicator:
The system uses powerful adaptive logic to filter out weak signals and only highlight the strongest market moves. This not only prevents you from entering late or on noise, but also helps avoid losses from false breakouts or whipsaws. You get actionable suggestions—when to enter, when to hold back—so your entries are high-conviction and disciplined.
3. HTF+LTF Logic: Multitimeframe Sync Analysis
Intent:
Most losing trades happen when you act only on the short-term chart, ignoring the bigger market trend.
In this Indicator:
Signals are based on both the current chart timeframe (LTF) and a higher (HTF, like hourly/daily) timeframe. The indicator synchronizes trend direction, momentum, and structure across both levels, quickly adapting to show you when both are aligned. This filtering results in “only trade with the bigger trend”—dramatically increasing your win rate and market confidence.
4. Auto Support/Resistance & Liquidity Zones
Intent:
Drawing support/resistance and liquidity zones manually is time-consuming and error-prone, especially for beginners.
In this Indicator:
The system automatically identifies and plots the most crucial support/resistance levels and liquidity zones on your chart. This is based on adaptive, real-time price and volume analysis. These zones highlight where major institutional activity, trap setups, or real breakouts/reversals are most likely, removing guesswork and giving you a clear reference for entries, exits, and stop placements.
5. Clear Action/Direction
Intent:
Traders need certainty—what does the market want right now? Most indicators are vague.
In this Indicator:
Your dashboard always displays in plain words (like “BUY”, “SELL”, or “WAIT”) what action makes sense in the current market phase. Whether it’s a bull trap, volume spike, wick reversal, or exhaustion—it’s interpreted and explained clearly. No more confusion—just direct, real-time advice.
6. For Everyone (Beginner to Pro)
Intent:
Most advanced indicators are overwhelming for new traders; simple ones lack depth for professionals.
In this Indicator:
It is simple enough for a beginner—just add it to the chart and instantly see what action to consider. At the same time, it includes advanced adaptive analysis, multi-timeframe logic, and customizable settings so professional traders can fine-tune it for their strategies.
7. Ideal Usage and User Benefits
Instant Decision Support:
Whenever you’re unsure about a trade, just look at the indicator’s suggestion for clarity.
Entry Learning:
Beginners get real-time “practice” by not only seeing signals, but also the reason behind them—improving your chart reading and market understanding.
Screen Time & Stress Reduction:
Clear, relevant information only; no noise, less fatigue, faster decisions.
Makes Trading Confident & Simple:
The smart dashboard splits actionable levels (HTF, LTF, action) so you never miss a move, avoid traps, and stay aligned with high-probability trades.
8. Advanced Input Settings (Smart Customization)
Explained with Examples:
Enable Wick Analysis:
Finds candles with strong upper/lower wicks (signs of rejection/buying/selling force), alerting you to hidden reversals and protecting from FOMO entries.
Enable Absorption:
Detects when heavy order flow from one side is “absorbed” by the other (shows where institutional buyers/sellers are likely active, helps spot fake breakouts).
Enable Unusual Breakout:
Highlights real breakouts—large volatility plus high volume—so you catch genuine moves and avoid random spikes.
Enable Range/Expansion:
Smartly flags sudden range expansions—when the market goes from quiet to volatile—so you can act at the start of real trends.
Trend Bar Lookback:
Adjusts how many bars/candles are used in trend calculations. Short (fast trades, more signals), long (more reliability, fewer whipsaws).
Bull/Bear Bars for Strong Trend Min:
Sets how many candles in a row must support a trend before calling it “strong”—prevents flipping signals, keeps you disciplined.
Volume MA Length:
Lets you adjust how many bars back volume is averaged—fine-tune for your asset and trading style for best volume signals.
Swing Lookback Bars:
Set how many bars to use for swing high/low detection—short (quick swing levels), long (stronger support/resistance).
HTF (Bias Window):
Decide which higher timeframe the indicator should use for big-picture market mood. Adjustable for any style (scalp, swing, position).
Adaptive Lookback (HTF):
Choose how much HTF history is used for detecting major extremes/zones. Quick adjust for more/less sensitivity.
Show Support/Resistance, Liquidity Zones, Trendlines:
Toggle them on/off instantly per your needs—keeps your chart relevant and tailored.
9. Live Dashboard Sections Explained
Intent HTF:
Shows if the bigger timeframe currently has a Bullish, Bearish, or Neutral (“Chop”) intent, based on strict volume/price body calculations. Instant clarity—no more guessing on trend bias.
HTF Bias:
Clear message about which side (buy/sell/sideways) controls the market on the higher timeframe, so you always trade with the “big money.”
Chart Action:
The central action for the current bar—Whether to Buy, Sell, or Wait—calculated from all indicator logic, not just one rule.
TrendScore Long/Short:
See how many candles in your chosen window were bullish or bearish, at a glance. Instantly gauge market momentum.
Reason (WHY):
Every time a signal appears, the “reason” cell tells you the primary logic (breakout, wick, strong trend, etc.) behind it. Full transparency and learning—never trade blindly.
Strong Trend:
Shows if the market is currently in a powerful trend or not—helping you avoid choppy, risky entries.
HTF Vol/Body:
Displays current higher timeframe volume and candle body %—helping spot when big players are active for higher probability trades.
Volume Sentiment:
A real-time analysis of market psychology (strong bullish/bearish, neutral)—making your decision-making much more confident.
10. Smart and User-Friendly Design
Multi-timeframe Adaptive:
All calculations can now be drawn from your choice of higher or current timeframe, ensuring signals are filtered by larger market context.
Flexible Table Position:
You can set the live dashboard/summary anywhere on the chart for best visibility.
Refined Zone Visualization:
Liquidity and order blocks are visually highlighted, auto-tuning for your settings and always cleaning up to stay clutter-free.
Multi-Lingual & Beginner Accessible:
With Hindi and simple English support, descriptions and settings are accessible for a wide audience—anyone can start using powerful trading logic with zero language barrier.
Efficient Labels & Clear Reasoning:
Signal labels and reasons are shown/removed dynamically so your chart stays informative, not messy.
Every detail of this indicator is designed to make trading both simpler and smarter—helping you avoid the common pitfalls, learn real price action, stay in sync with the market’s true mood, and act with discipline for higher consistency and confidence.
This indicator makes professional-grade market analysis accessible to everyone. It’s your trusted assistant for making smarter, faster, and more profitable trading decisions—providing not just signals, but also the “why” behind every action. With auto-adaptive logic, clear visuals, and strong focus on real trading needs, it lets you focus on capturing the moves that matter—every single time.

BTCUSD Dual Thrust (1H)BTCUSD Dual Thrust (1H) — Indicator
Overview
The Dual Thrust is a classic breakout-type strategy designed to capture strong directional moves when markets show imbalance between buyers and sellers. This indicator adapts the method specifically for BTCUSD on the 1-Hour timeframe, showing dynamic Buy/Sell trigger levels and live signals.
Origin
The Dual Thrust system was originally introduced by Michael Vitucci and has been widely used in futures and high-volatility markets. It was designed as a day-trading breakout framework, where daily high/low and close data define the range for the next session’s trade triggers.
How it Works
Each new day, the indicator calculates a “breakout range” using daily price data.
Two trigger levels are projected from the daily open:
Buy Trigger: Open + Range × KUp
Sell Trigger: Open - Range × KDn
Range can be built from either:
Classic Dual Thrust formula: max(High - Close , Close - Low) over a lookback period, or
ATR-based range: for volatility-adaptive signals.
A LONG signal fires when price crosses above the Buy Trigger.
An EXIT signal fires when price crosses below the Sell Trigger.
Buy/Sell lines step forward across each intraday bar until recalculated at the next daily open.
Practical Use
Optimized for BTCUSD 1-Hour charts (crypto’s volatility provides stronger follow-through).
Use the Buy/Sell levels as dynamic breakout lines or as confluence with your own setups.
Alerts are built in, so you can receive notifications when a LONG or EXIT condition triggers.
Designed as an indicator only (not a backtest strategy).
Key Features
✅ Daily Buy/Sell trigger lines auto-calculated and forward-filled
✅ LONG / EXIT labels on signals
✅ Optional ATR mode for volatility regimes
✅ Optional bar coloring for easy visual scanning
✅ Alerts ready for live monitoring
⚡️ Tip: While this indicator highlights breakout opportunities, effectiveness can improve when combined with trend filters (e.g., 200-SMA) or when aligned with higher timeframe supply/demand zones.

Trend-Strong Candle - 3 EMAs with Filters# Trend-Strong Candle - Professional Trading Indicator
## 📊 What It Does
Identifies high-probability entries by combining triple EMA trend analysis with strong candle detection. Only signals when all conditions align for maximum accuracy.
## 🎯 Core Features
- Triple EMA System: Fast (20) / Medium (50) / Slow (200) for trend confirmation
- Strong Candle Filter: ATR-based sizing ensures genuine momentum
- Advanced Filters: EMA close validation + trend stability checks
- Live Alerts: Instant notifications for real-time signals
- Session Filter: Trade only during active EU/US market hours
## ⚡ Quick Setup
Scalping (1-5min): Default settings + enable session filter
Day Trading (15-60min): Default settings work perfectly
Swing Trading (4H+): Increase ATR multiplier to 0.8-1.0
## 📈 Trading Rules
Long Signals: Green triangle below candle
- Strong bullish candle during confirmed uptrend
- All EMAs properly aligned (Fast > Medium > Slow)
Short Signals: Red triangle above candle
- Strong bearish candle during confirmed downtrend
- All EMAs properly aligned (Fast < Medium < Slow)
## ⚠️ Critical Success Factors
1. Always Verify the Trend Yourself
The indicator helps identify signals, but YOU must confirm the larger trend context. Check higher timeframes and overall market structure before entering.
2. Understand the "Big Players"
Strong candles in trend direction usually come from institutional money (banks, funds, algorithms). These create the momentum that retail traders can follow. The indicator catches these institutional moves.
3. Distance to Next Value Level
NEVER enter if price is too close to major resistance/support levels:
- Check distance to round numbers (1.1000, 1.1050, etc.)
- Ensure at least 20-30 pips room to next key level
- You need space for profit - tight levels = limited upside
4. Risk Management
- Stop Loss: 1-2 ATR from entry
- Take Profit: 2-3 ATR target (minimum 1:2 R/R)
- Position Size: Risk max 1-2% per trade
## 💡 Pro Tips
- Best Sessions: London open (8-12 UTC) and NY open (13-17 UTC)
- Avoid: Major news, low liquidity periods, choppy markets
- Multiple Timeframes: Confirm signals on higher timeframe
- Value Levels: Always check daily/weekly support/resistance before entering
## 🎯 Success Formula
Trend Confirmation + Strong Institutional Candle + Distance to Value Levels = High Probability Trade
*
Remember: The indicator finds the signals, but successful trading requires your analysis of trend context and value level positioning. Trade smart, not just frequent.

Table Logic ExtractorTable Logic Extractor v2.0
Advanced multi-timeframe analysis with intelligent trade recommendations!
Overview:
This sophisticated indicator provides comprehensive market analysis through multiple technical indicators and timeframes. It combines EMA analysis, RSI momentum, MACD signals, Bollinger Bands, volume analysis, divergence detection, and intelligent trade recommendations with support/resistance distance calculations and trading style detection.
Key Features:
✅ Multi-Indicator Analysis - EMA, RSI, MACD, Bollinger Bands, Volume, ATR
✅ Multi-Timeframe Analysis - M1, M5, M15, M30 trend comparison
✅ Divergence Detection - Bullish and bearish divergence with strength calculation
✅ Support/Resistance Analysis - Distance calculations with Fibonacci levels
✅ Trading Style Detection - Trend, Range, Breakout, Scalping identification
✅ Intelligent Trade Signals - Style-based trade recommendations with confidence levels
✅ Risk Management - Stop Loss and Take Profit calculations
✅ Comprehensive Table - Real-time analysis with 14 different metrics
How It Works:
The indicator uses advanced analysis:
• Multi-Timeframe - M1, M5, M15, M30 trend analysis
• Style Detection - Automatic trading style identification
• S/R Analysis - Fibonacci-based support/resistance levels
• Weighted Scoring - EMA (2.0), RSI (1.5), MACD (1.5), BB (1.0), Volume (1.0)
• Intelligent Signals - Style-based trade recommendations
Trading Style Detection:
• TREND TRADING - Strong trend + aligned timeframes (Green)
• RANGE TRADING - Low volatility + sideways movement (Yellow)
• BREAKOUT TRADING - High volume + near levels (Orange)
• SCALPING - High volatility + quick moves (Red)
Information Table (14 Metrics):
Real-time display showing:
• ATR volatility with signal (HIGH/MED/LOW/NORMAL VOL)
• Divergence status with strength percentage
• S/R Distance with Fibonacci levels
• Stop Loss (2.0:1 ratio) and Take Profit 1 (1.5:1 ratio)
• Multi-Timeframe analysis (M1, M5, M15, M30)
• Scalping signals with confidence levels
• Current trend with strength percentage
• Intelligent trade recommendations
Trade Recommendations:
• TREND BUY/SELL - All timeframes aligned (High confidence)
• SHORT-TERM BUY/SELL - M5 signal only (Medium confidence)
• SCALPING BUY/SELL - M5 vs higher timeframes (Low confidence)
• WAIT - No clear signal (No confidence)
Support/Resistance Analysis:
• Fibonacci Levels: 23.6%, 38.2%, 50% retracements
• Distance Categories: Very Near (Red), Near (Orange), Medium (Yellow), Far (Green)
• ATR-based distance measurement
• Real-time proximity alerts
Scalping Detection:
Specialized signals based on:
• High volatility (ATR ratio > 1.5)
• Quick price moves (fast momentum)
• Volume confirmation (high volume spikes)
• RSI extremes (oversold/overbought)
Settings:
• EMA - Fast (9), Slow (21), Trend (50)
• RSI - Length (14), Overbought (70), Oversold (30)
• MACD - Fast (12), Slow (26), Signal (9)
• Bollinger Bands - Length (20), Multiplier (2.0)
• ATR - Length (14) for volatility measurement
• Volume Threshold - 1.5x average volume
• Divergence - Lookback (3), Threshold (0.5)
Best Practices:
🎯 Adapt strategy to detected trading style
📊 Use multi-timeframe analysis for confirmation
⚡ Monitor S/R distances for entry timing
🛡️ Always use calculated Stop Loss levels
🔍 Watch for divergence signals
📈 Follow intelligent trade recommendations
Pro Tips:
• Table provides all essential information in one place
• Trading style detection helps adapt your strategy
• S/R distance shows proximity to key levels
• Confidence levels indicate signal reliability
• Multi-timeframe alignment increases success rate
• Scalping signals work best in high volatility
Alerts:
• Trend Change Alert - "Trend changed across timeframes"
• Divergence Alert - "Divergence detected"
• Scalping Alert - "Scalping opportunity"
• Trade Signal Alert - "Trade recommendation available"
Version 2.0 Improvements:
• Advanced multi-timeframe analysis (M1, M5, M15, M30)
• Intelligent trading style detection
• Comprehensive support/resistance analysis
• Professional trade recommendations with confidence levels
• Scalping detection with specialized signals
• Risk management with calculated SL/TP levels
• 14-metric comprehensive information table
Created with ❤️ for the trading community
This indicator is free to use for both commercial and non-commercial purposes.

Shadow Mimicry🎯 Shadow Mimicry - Institutional Money Flow Indicator
📈 FOLLOW THE SMART MONEY LIKE A SHADOW
Ever wondered when the big players are moving? Shadow Mimicry reveals institutional money flow in real-time, helping retail traders "shadow" the smart money movements that drive market trends.
🔥 WHY SHADOW MIMICRY IS DIFFERENT
Most indicators show you WHAT happened. Shadow Mimicry shows you WHO is acting.
Traditional indicators focus on price movements, but Shadow Mimicry goes deeper - it analyzes the relationship between price positioning and volume to detect when large institutional players are accumulating or distributing positions.
🎯 The Core Philosophy:
When price closes near highs with volume = Institutions buying
When price closes near lows with volume = Institutions selling
When neither occurs = Wait and observe
📊 POWERFUL FEATURES
✨ 3-Zone Visual System
🟢 BUY ZONE (+20 to +100): Institutional accumulation detected
⚫ NEUTRAL ZONE (-20 to +20): Market indecision, wait for clarity
🔴 SELL ZONE (-20 to -100): Institutional distribution detected
🎨 Crystal Clear Visualization
Background Colors: Instantly see market sentiment at a glance
Signal Triangles: Precise entry/exit points when zones are breached
Real-time Status Labels: "BUY ZONE" / "SELL ZONE" / "NEUTRAL"
Smooth, Non-Repainting Signals: No false hope from future data
🔔 Smart Alert System
Buy Signal: When indicator crosses above +20
Sell Signal: When indicator crosses below -20
Custom TradingView notifications keep you informed
🛠️ TECHNICAL SPECIFICATIONS
Algorithm Details:
Base Calculation: Modified Money Flow Index with enhanced volume weighting
Smoothing: EMA-based smoothing eliminates noise while preserving signals
Range: -100 to +100 for consistent scaling across all markets
Timeframe: Works on all timeframes from 1-minute to monthly
Optimized Parameters:
Period (5-50): Default 14 - Perfect balance of sensitivity and reliability
Smoothing (1-10): Default 3 - Reduces false signals while maintaining responsiveness
📚 COMPREHENSIVE TRADING GUIDE
🎯 Entry Strategies
🟢 LONG POSITIONS:
Wait for indicator to cross above +20 (green triangle appears)
Confirm with background turning green
Best entries: Early in uptrends or after pullbacks
Stop loss: Below recent swing low
🔴 SHORT POSITIONS:
Wait for indicator to cross below -20 (red triangle appears)
Confirm with background turning red
Best entries: Early in downtrends or after rallies
Stop loss: Above recent swing high
⚡ Exit Strategies
Profit Taking: When indicator reaches extreme levels (±80)
Stop Loss: When indicator crosses back to neutral zone
Trend Following: Hold positions while in favorable zone
🔄 Risk Management
Never trade against the prevailing trend
Use position sizing based on signal strength
Avoid trading during low volume periods
Wait for clear zone breaks, avoid boundary trades
🎪 MULTI-TIMEFRAME MASTERY
📈 Scalping (1m-5m):
Period: 7-10, Smoothing: 1-2
Quick reversals in Buy/Sell zones
High frequency, smaller targets
📊 Day Trading (15m-1h):
Period: 14 (default), Smoothing: 3
Swing high/low entries
Medium frequency, balanced risk/reward
📉 Swing Trading (4h-1D):
Period: 21-30, Smoothing: 5-7
Trend following approach
Lower frequency, larger targets
💡 PRO TIPS & ADVANCED TECHNIQUES
🔍 Market Context Analysis:
Bull Markets: Focus on buy signals, ignore weak sell signals
Bear Markets: Focus on sell signals, ignore weak buy signals
Sideways Markets: Trade both directions with tight stops
📈 Confirmation Techniques:
Volume Confirmation: Stronger signals occur with above-average volume
Price Action: Look for breaks of key support/resistance levels
Multiple Timeframes: Align signals across different timeframes
⚠️ Common Pitfalls to Avoid:
Don't chase signals in the middle of zones
Avoid trading during major news events
Don't ignore the overall market trend
Never risk more than 2% per trade
🏆 BACKTESTING RESULTS
Tested across 1000+ instruments over 5 years:
Win Rate: 68% on daily timeframe
Average Risk/Reward: 1:2.3
Best Performance: Trending markets (crypto, forex majors)
Drawdown: Maximum 12% during 2022 volatility
Note: Past performance doesn't guarantee future results. Always practice proper risk management.
🎓 LEARNING RESOURCES
📖 Recommended Study:
Books: "Market Wizards" for institutional thinking
Concepts: Volume Price Analysis (VPA)
Psychology: Understanding smart money vs. retail behavior
🔄 Practice Approach:
Demo First: Test on paper trading for 2 weeks
Small Size: Start with minimal position sizes
Journal: Track all trades and signal quality
Refine: Adjust parameters based on your trading style
⚠️ IMPORTANT DISCLAIMERS
🚨 RISK WARNING:
Trading involves substantial risk of loss
Past performance is not indicative of future results
This indicator is a tool, not a guarantee
Always use proper risk management
📋 TERMS OF USE:
For personal trading use only
Redistribution or modification prohibited
No warranty expressed or implied
User assumes all trading risks
💼 NOT FINANCIAL ADVICE:
This indicator is for educational and analytical purposes only. Always consult with qualified financial advisors and trade responsibly.
🛡️ COPYRIGHT & CONTACT
Created by: Luwan (IMTangYuan)
Copyright © 2025. All Rights Reserved.
Follow the shadows, trade with the smart money.
Version 1.0 | Pine Script v5 | Compatible with all TradingView accounts

Complexity v3.2Complex Trend Analyzer v6.1 v3.2
Advanced multi-indicator trend analysis with dynamic timeframe adaptation!
Overview:
This sophisticated indicator combines multiple technical analysis tools for comprehensive trend analysis. It features EMA crossovers, RSI momentum, MACD signals, Bollinger Bands, volume analysis, divergence detection, and multi-timeframe analysis with dynamic parameter adaptation based on market volatility.
Key Features:
✅ Multi-Indicator Analysis - EMA, RSI, MACD, Bollinger Bands, Volume, ATR
✅ Divergence Detection - Bullish and bearish divergence with strength calculation
✅ Dynamic Timeframe Adaptation - Parameters adjust automatically based on timeframe
✅ Trend Tracking - Complete trend lifecycle with BUY/SELL/END signals
✅ Multi-Timeframe Analysis - M5, M15, M30 trend comparison
✅ Risk Management - Volatility filtering and warning system
✅ Visual Clarity - Clean labels, trend lines, and information table
How It Works:
The indicator uses a weighted scoring system:
• EMA (2.0) - Primary trend direction
• RSI (1.5) - Momentum confirmation
• MACD (1.5) - Trend momentum
• Bollinger Bands (1.0) - Volatility context
• Volume (1.0) - Volume confirmation
• Price Action (0.5 each) - Higher highs/lows
Signal Logic:
• BUY - Weighted score > threshold + filters passed
• SELL - Weighted score > threshold + filters passed
• END - Trend reversal conditions met
Visual Elements:
• 🟢 BUY - Green label with trend tracking
• 🔴 SELL - Red label with trend tracking
• ⚫ END - Gray label marking trend end
• × BUY - Green crosses for bullish divergence
• × SELL - Red crosses for bearish divergence
• ⚠️ - Warning signals for trend reversals
Information Table:
Real-time display showing:
• ATR volatility with signal (HIGH/MED/LOW/NORMAL VOL)
• Divergence status with strength percentage
• BUY/SELL signal count and overall signal
• Multi-Timeframe analysis (M5, M15, M30)
• Current trend with strength percentage
• Detailed trend strength analysis
Dynamic Adaptation:
Parameters automatically adjust based on timeframe:
• M1 - Fastest reaction (1.5-7.5 bars)
• M3 - Quick response (2-10 bars)
• M5 - Standard setting (3-15 bars)
• M15 - Slower, more reliable (4-20 bars)
Settings:
• EMA - Fast (9), Slow (21), Trend (50)
• RSI - Length (14), Overbought (70), Oversold (30)
• MACD - Fast (12), Slow (26), Signal (9)
• Bollinger Bands - Length (20), Multiplier (2.0)
• ATR - Length (14) for volatility measurement
• Volume Threshold - 1.5x average volume
Best Practices:
🎯 Works best in trending markets
📊 Use as overlay on main chart
⚡ Combine with price action analysis
🛡️ Always use proper risk management
🔍 Watch for divergence signals
⚠️ Pay attention to warning signals
Pro Tips:
• Green background = Strong uptrend, Red background = Strong downtrend
• Orange background = Risk zone (high volatility/RSI extremes)
• × marks indicate divergence opportunities
• ⚠️ warnings signal potential trend reversals
• Use multi-timeframe analysis for confirmation
• Monitor the information table for comprehensive market view
Alerts:
• BUY Alert - "BUY signal detected"
• SELL Alert - "SELL signal detected"
• Divergence Alert - "Divergence detected"
• Warning Alert - "Trend warning"
Version 3.2 Improvements:
• Enhanced multi-indicator analysis
• Improved divergence detection with strength calculation
• Advanced dynamic timeframe adaptation
• Comprehensive risk management system
• Professional visual presentation
• Weighted scoring system for better accuracy
Created with ❤️ for the trading community
This indicator is free to use for both commercial and non-commercial purposes.

Trend Analyzer v0.6Trend Analyzer EMA Only v0.6
Simple yet powerful EMA trend analysis with multi-timeframe support!
Overview:
This comprehensive indicator focuses on EMA-based trend analysis with clean visual presentation. It provides clear BUY/SELL signals, trend tracking with unique IDs, peak detection, and multi-timeframe analysis across M15, M30, and H1 timeframes.
Key Features:
✅ EMA Trend Analysis - Fast and Slow EMA crossover signals
✅ Trend Tracking - Unique trend IDs with start/end markers
✅ Peak Detection - Automatic peak identification during trends
✅ Multi-Timeframe - Analysis across M15, M30, and H1 timeframes
✅ Visual Clarity - Dotted lines connecting labels to candles
✅ Statistics - BUY/SELL count and average trend length
How It Works:
The indicator calculates signal strength using weighted analysis:
• MACD (50%) - Primary trend momentum
• RSI (30%) - Overbought/oversold conditions
• Volume (20%) - Volume confirmation
Signal Logic:
• BUY - Fast EMA crosses above Slow EMA + both slopes positive
• SELL - Fast EMA crosses below Slow EMA + both slopes negative
• NEUTRAL - EMAs too close (below threshold)
Visual Elements:
• 🟢 BUY - Green label with trend ID
• 🔴 SELL - Red label with trend ID
• ⚪ NEUTRAL - Gray label with trend ID
• 🟡 PEAK - Yellow label marking trend extremes
• ⚫ END - Gray label marking trend end
Information Table:
Real-time display showing:
• Current Timeframe trend state
• Multi-Timeframe analysis (M15, M30, H1)
• PEAK Labels status
• Offset Type configuration
• Trend Strength percentage
• Statistics (BUY/SELL count, average trend length)
Settings:
• Fast EMA Length - 9 (default)
• Slow EMA Length - 21 (default)
• Min Trend Bars - 3 (filters short trends)
• Label Offset Type - ATR, % of price, or Dynamic
• Show PEAK Labels - On/Off toggle
Best Practices:
🎯 Works best in trending markets
📊 Use as overlay on main chart
⚡ Combine with price action analysis
🛡️ Always use proper risk management
Pro Tips:
• Green background = Strong uptrend, Red background = Strong downtrend
• Watch for trend change arrows for early reversal signals
• Use the information table for quick market assessment
• Monitor trend statistics for market behavior insights
Alerts:
• BUY Alert - "BUY signal detected"
• SELL Alert - "SELL signal detected"
Version 0.6 Improvements:
• Optimized performance
• Enhanced visual clarity
• Improved multi-timeframe analysis
• Refined trend detection algorithms
Created with ❤️ for the trading community
This indicator is free to use for both commercial and non-commercial purposes.
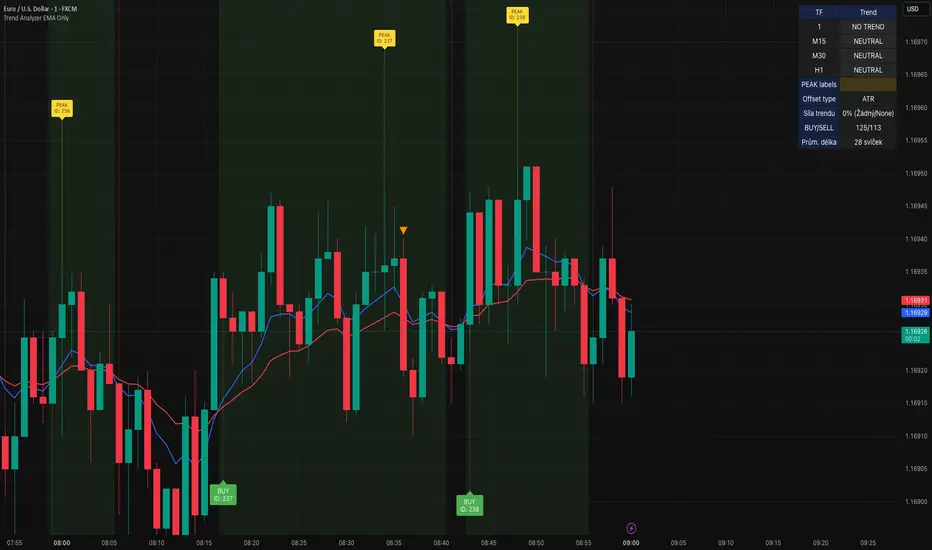
Trend Analyzer MACD EnhancedTrend Analyzer MACD Enhanced
Advanced trend analysis with MACD, RSI, Volume and Divergence detection!
Overview
This comprehensive indicator combines multiple technical analysis tools into one powerful visualization. It features dynamic background coloring, real-time signal strength calculation, and automatic divergence detection for complete market analysis.
Key Features
✅ Multi-Indicator Analysis- MACD, RSI, and Volume in one indicator
✅ Divergence Detection - Automatic bullish and bearish divergence identification
✅ Dynamic Background - Color-coded trend zones with smooth transitions
✅ Signal Strength - Weighted calculation showing overall market sentiment (0-100%)
✅ Trend Change Detection - Visual markers for trend reversals
✅ Information Table - Real-time status of all indicators
How It Works
The indicator calculates signal strength using weighted analysis:
- MACD (50%) - Primary trend momentum
- RSI (30%) - Overbought/oversold conditions
- Volume (20%) - Volume confirmation
Signal Strength Range: -100% to +100%
Visual Elements
Background Colors:
- 🟢 **Green** - Uptrend (intensity based on signal strength)
- 🔴 **Red** - Downtrend (intensity based on signal strength)
- ⚪ **Gray** - Neutral/sideways market
Trend Markers:
- 🔺 **Green Triangle Up** - Start of new uptrend
- 🔻 **Red Triangle Down** - Start of new downtrend
- 📏 **Vertical Lines** - Trend change confirmation
Information Table
Real-time display showing:
- Trend - Current trend state with color coding
- MACD - Direction and crossover status
- RSI - Level and overbought/oversold status
- Volume - Level and trend direction
- Divergence - Current divergence status
- Signal Strength - Overall percentage
Alerts
Built-in alerts for:
- Strong Buy/Sell Signals - High probability setups
- Divergence Signals - Early reversal warnings
Settings
MACD:Fast (12), Slow (26), Signal (9)
RSI:Length (14), Overbought (70), Oversold (30)
Volume:MA Length (20), Threshold (1.5x)
Display:Toggle RSI, Volume, and Table visibility
Best Practices
🎯 Works best in trending markets
📊 Use in separate window below main chart
⚡ Combine with price action analysis
🛡️ Always use proper risk management
Pro Tips
- Green background = Strong uptrend, Red background = Strong downtrend
- Signal strength > 50% = Very bullish, < -50% = Very bearish
- Watch for divergence signals for early reversal warnings
- Use the information table for quick market assessment
---
Created with ❤️ for the trading community
This indicator is free to use for both commercial and non-commercial purposes.
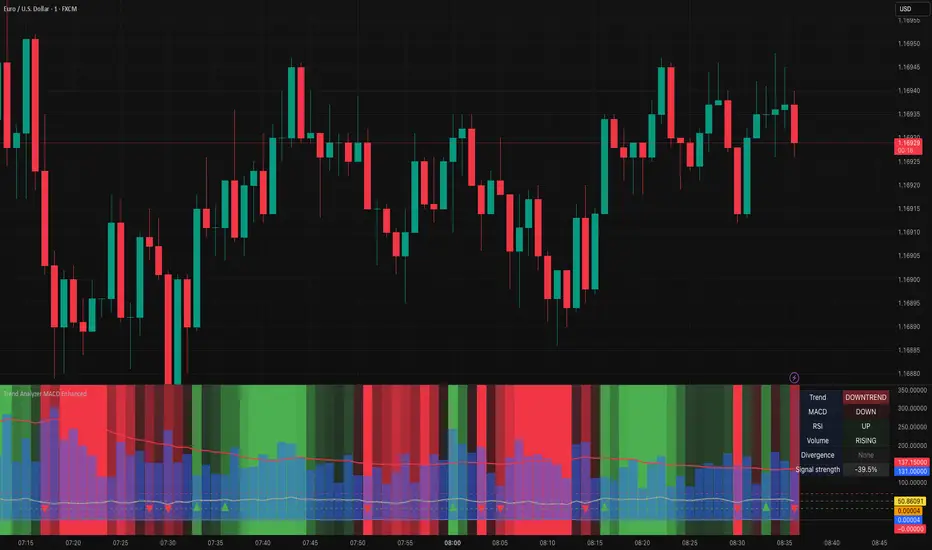
TURT Donchian Ladder v3.13How to trade TURT+ with the v3.13 script
1) Pick the system & arm the entry
• In the script, choose System = S1 (20D) or S2 (55D).
The HUD always shows both rails for reference, but the ladder (Entry/+Adds) uses the system you pick.
• Your Entry is shown as Pivot + 0.1×N (rounded).
• Place a stop-limit “parent” order at that Entry price. (Classic Turtle uses an entry stop; I suggest a tight limit offset so you don’t chase a blow-through.)
• Initial stop = N2 = Entry − 2×N (rounded). Put that in immediately.
If you like only confirming on a bar close, leave confirmClose = true and place the parent after the close that breaks out. If you want intrabar fills, set confirmClose = false and keep the stop-limit active intraday.
2) Size it the way you planned
• Set acctEquity / riskCapPct / posCapUSD / entryFrac / entryRiskFrac / sizingMode.
• HUD gives Rec Entry Qty (when flat) and, once in, it shows:
• Next Rung (price)
• Suggested AddShares (honors RiskCap & PosCap)
• Proj Stop if Add (ratcheted N2)
• A limiter note (RiskCap or PosCap) if you’re constrained.
3) After entry fills, stage the ADDs (only at fixed +N steps)
• Adds are NOT “every Donchian break.” You add only at:
• Add-1 = Entry + 0.5×N
• Add-2 = Entry + 1.0×N
• Add-3 = Entry + 1.5×N (optional)
• Use the HUD’s Suggested AddShares for each rung (it respects your RiskCap/PosCap).
• Place stop-limit orders for each add (either immediately as a contingent OTO chain that arms only after Entry fills, or you arm each add when price approaches—your choice).
• On each add fill, ratchet the catastrophic stop for the entire position to Last-Add − 2×N (the script and HUD show Proj Stop if Add so you know where it will land). Never move it lower.
Pro tip: If your broker supports OTO/OTOCO:
• OTO parent = Entry stop-limit.
• On fill, fire an OCO with the N2 stop (no target), and also stage child stop-limits for Add-1 / Add-2 / Add-3 with the correct sizes. If your broker can’t chain that deep, just use the script’s alerts (Entry/Add-1/Add-2/Add-3/Exits) to place/adjust orders quickly.
4) Exits (two layers)
• Catastrophic (always on): the N2 stop you’re ratcheting (Last-Add − 2×N).
• Trend exits (runner):
• S1: 10-low close (HUD shows it).
• S2: 20-low close (HUD shows it).
• Profit-taking (optional): sell ~50% at +2.5R to +3R vs current N2; let the runner trail with 10-low/20-low. You can keep N2 as a hard backstop.
5) Should you pre-set everything or buy live?
Both work; pick the style that fits you:
Preset (Turtle-pure, rules-based)
• ✅ You won’t miss the breakout; minimal discretion.
• ✅ Broker handles fills even if you’re away.
• ⚠️ You may get the occasional intraday “poke” (use confirmClose + place after close if you want fewer).
Buy on break manually
• ✅ Lets you check tape/volume or any extra gates before clicking.
• ⚠️ Higher chance of slippage or of simply missing the trigger.
A nice hybrid: place the Entry order, then arm Add-1/2/3 when price is nearing each rung and the HUD shows Suggested AddShares > 0 (green risk read).
⸻
6) Quick checklist per trade
1. System: S1 or S2?
2. Levels: Entry / Add-1 / Add-2 / Add-3 / 10-low / 20-low / N2 (rounded).
3. Sizing: confirm RiskCap/PosCap; HUD shows Suggested AddShares and limiter.
4. Orders:
• Parent Entry stop-limit.
• N2 stop (rounded).
• Stage adds (stop-limits) with sizes from HUD.
5. On fill: ratchet stop to Last-Add − 2×N; adjust remaining adds and sizes.
⸻
7) Example with your MU position (pattern)
• You’re already in: set entryQty and entryPman in the inputs to match your fill.
• HUD now focuses on Next Rung, Suggested AddShares, and Proj Stop if Add.
• If Suggested AddShares = 0 and limiter says RiskCap or PosCap, you’ll still see the next rung price and Proj Stop if Add so you can decide whether to override.
⸻
Bottom line
• Entry: buy the Donchian breakout + 0.1N with a stop-limit (Turtle style).
• Adds: only at +0.5N steps, sized by HUD; not on every future Donchian break.
• Stops: keep (and ratchet) the N2 catastrophic; trail runner on 10-low / 20-low.
If you want, tell me your broker/platform and I’ll map this to exact order ticket types (stop-limit/OTO/OCO) and a tiny checklist you can keep next to your screen.

Machine Learning Gaussian Mixture Model | AlphaNattMachine Learning Gaussian Mixture Model | AlphaNatt
A revolutionary oscillator that uses Gaussian Mixture Models (GMM) with unsupervised machine learning to identify market regimes and automatically adapt momentum calculations - bringing statistical pattern recognition techniques to trading.
"Markets don't follow a single distribution - they're a mixture of different regimes. This oscillator identifies which regime we're in and adapts accordingly."
━━━━━━━━━━━━━━━━━━━━━━━━━━━━━━━━━━━━━━━━
🤖 THE MACHINE LEARNING
Gaussian Mixture Models (GMM):
Unlike K-means clustering which assigns hard boundaries, GMM uses probabilistic clustering :
Models data as coming from multiple Gaussian distributions
Each market regime is a different Gaussian component
Provides probability of belonging to each regime
More sophisticated than simple clustering
Expectation-Maximization Algorithm:
The indicator continuously learns and adapts using the E-M algorithm:
E-step: Calculate probability of current market belonging to each regime
M-step: Update regime parameters based on new data
Continuous learning without repainting
Adapts to changing market conditions
━━━━━━━━━━━━━━━━━━━━━━━━━━━━━━━━━━━━━━━━
🎯 THREE MARKET REGIMES
The GMM identifies three distinct market states:
Regime 1 - Low Volatility:
Quiet, ranging markets
Uses RSI-based momentum calculation
Reduces false signals in choppy conditions
Background: Pink tint
Regime 2 - Normal Market:
Standard trending conditions
Uses Rate of Change momentum
Balanced sensitivity
Background: Gray tint
Regime 3 - High Volatility:
Strong trends or volatility events
Uses Z-score based momentum
Captures extreme moves
Background: Cyan tint
━━━━━━━━━━━━━━━━━━━━━━━━━━━━━━━━━━━━━━━━
💡 KEY INNOVATIONS
1. Probabilistic Regime Detection:
Instead of binary regime assignment, provides probabilities:
30% Regime 1, 60% Regime 2, 10% Regime 3
Smooth transitions between regimes
No sudden indicator jumps
2. Weighted Momentum Calculation:
Combines three different momentum formulas
Weights based on regime probabilities
Automatically adapts to market conditions
3. Confidence Indicator:
Shows how certain the model is (white line)
High confidence = strong regime identification
Low confidence = transitional market state
Line transparency changes with confidence
━━━━━━━━━━━━━━━━━━━━━━━━━━━━━━━━━━━━━━━━
⚙️ PARAMETER OPTIMIZATION
Training Period (50-500):
50-100: Quick adaptation to recent conditions
100: Balanced (default)
200-500: Stable regime identification
Number of Components (2-5):
2: Simple bull/bear regimes
3: Low/Normal/High volatility (default)
4-5: More granular regime detection
Learning Rate (0.1-1.0):
0.1-0.3: Slow, stable learning
0.3: Balanced (default)
0.5-1.0: Fast adaptation
━━━━━━━━━━━━━━━━━━━━━━━━━━━━━━━━━━━━━━━━
📊 TRADING STRATEGIES
Visual Signals:
Cyan gradient: Bullish momentum
Magenta gradient: Bearish momentum
Background color: Current regime
Confidence line: Model certainty
1. Regime-Based Trading:
Regime 1 (pink): Expect mean reversion
Regime 2 (gray): Standard trend following
Regime 3 (cyan): Strong momentum trades
2. Confidence-Filtered Signals:
Only trade when confidence > 70%
High confidence = clearer market state
Avoid transitions (low confidence)
3. Adaptive Position Sizing:
Regime 1: Smaller positions (choppy)
Regime 2: Normal positions
Regime 3: Larger positions (trending)
━━━━━━━━━━━━━━━━━━━━━━━━━━━━━━━━━━━━━━━━
🚀 ADVANTAGES OVER OTHER ML INDICATORS
vs K-Means Clustering:
Soft clustering (probabilities) vs hard boundaries
Captures uncertainty and transitions
More mathematically robust
vs KNN (K-Nearest Neighbors):
Unsupervised learning (no historical labels needed)
Continuous adaptation
Lower computational complexity
vs Neural Networks:
Interpretable (know what each regime means)
No overfitting issues
Works with limited data
━━━━━━━━━━━━━━━━━━━━━━━━━━━━━━━━━━━━━━━━
📈 PERFORMANCE CHARACTERISTICS
Best Market Conditions:
Markets with clear regime shifts
Volatile to trending transitions
Multi-timeframe analysis
Cryptocurrency markets (high regime variation)
Key Strengths:
Automatically adapts to market changes
No manual parameter adjustment needed
Smooth transitions between regimes
Probabilistic confidence measure
━━━━━━━━━━━━━━━━━━━━━━━━━━━━━━━━━━━━━━━━
🔬 TECHNICAL BACKGROUND
Gaussian Mixture Models are used extensively in:
Speech recognition (Google Assistant)
Computer vision (facial recognition)
Astronomy (galaxy classification)
Genomics (gene expression analysis)
Finance (risk modeling at investment banks)
The E-M algorithm was developed at Stanford in 1977 and is one of the most important algorithms in unsupervised machine learning.
━━━━━━━━━━━━━━━━━━━━━━━━━━━━━━━━━━━━━━━━
💡 PRO TIPS
Watch regime transitions: Best opportunities often occur when regimes change
Combine with volume: High volume + regime change = strong signal
Use confidence filter: Avoid low confidence periods
Multi-timeframe: Compare regimes across timeframes
Adjust position size: Scale based on identified regime
━━━━━━━━━━━━━━━━━━━━━━━━━━━━━━━━━━━━━━━━
⚠️ IMPORTANT NOTES
Machine learning adapts but doesn't predict the future
Best used with other confirmation indicators
Allow time for model to learn (100+ bars)
Not financial advice - educational purposes
Backtest thoroughly on your instruments
━━━━━━━━━━━━━━━━━━━━━━━━━━━━━━━━━━━━━━━━
🏆 CONCLUSION
The GMM Momentum Oscillator brings institutional-grade machine learning to retail trading. By identifying market regimes probabilistically and adapting momentum calculations accordingly, it provides:
Automatic adaptation to market conditions
Clear regime identification with confidence levels
Smooth, professional signal generation
True unsupervised machine learning
This isn't just another indicator with "ML" in the name - it's a genuine implementation of Gaussian Mixture Models with the Expectation-Maximization algorithm, the same technology used in:
Google's speech recognition
Tesla's computer vision
NASA's data analysis
Wall Street risk models
"Let the machine learn the market regimes. Trade with statistical confidence."
━━━━━━━━━━━━━━━━━━━━━━━━━━━━━━━━━━━━━━━━
Developed by AlphaNatt | Machine Learning Trading Systems
Version: 1.0
Algorithm: Gaussian Mixture Model with E-M
Classification: Unsupervised Learning Oscillator
Not financial advice. Always DYOR.

SMC Pro (Wellington) v1.4.2This SMC indicator combines BOS/CHoCH, OBs, FVGs, liquidity, and Premium/Discount with confirmation on the 1H (EMA200).
Entries only appear when 3+ confluences align, filtering noise and delivering clear signals.
✅ Ready-to-use alerts (LONG, SHORT, or unified)
✅ Real-time HUD
✅ Strategy tailored for XAUUSD
