SMC + CRT Gold Flow PRO — Fixed RGB ColorsSCRIPT FOR GOLD. I used SMC + CRT strategies. I analyze in H4 timeframe and enter in m15 time frame.
In den Scripts nach "pro" suchen
CHOCH + FVG Signals [30m Optimized]CHOCH + FVG Signals
🎯 What It Does:
This script automatically scans your chart for high-probability Smart Money Concepts (SMC) setups based on two key institutional trading principles:
Change of Character (CHOCH) – A shift in market structure signaling potential reversal
Fair Value Gap (FVG) – An imbalance zone where price moved too fast, often acting as support/resistance
When both conditions align, the script plots clear Buy (▲) and Sell (▼) signals directly on your chart — ideal for intraday trading on the 30-minute timeframe (but works on any timeframe).
✅ Key Features:
🔹 Visual Fair Value Gaps
Green shaded zones = Bullish FVGs (potential support)
Red shaded zones = Bearish FVGs (potential resistance)
Toggle on/off in settings
🔹 Smart CHOCH Detection
Detects breaks of recent swing highs/lows with proper context
Avoids false signals by confirming prior price structure
🔹 Clear Trade Signals
Green ▲ below bar = Buy signal (Bullish CHOCH + FVG confluence)
Red ▼ above bar = Sell signal (Bearish CHOCH + FVG confluence)
🔹 Customizable Filters
Option to require FVG for a signal (recommended for higher accuracy)
Adjust sensitivity via swing detection settings (default optimized for 30m)
🔹 Alert-Ready
Built-in alert conditions for instant notifications on TradingView mobile/desktop
⚙️ How to Use:
Apply to a 30-minute chart (e.g., EURUSD, Gold, NAS100, BTC)
Wait for at least 50–100 bars to load (so swing points appear)
Look for:
A green triangle (▲) → consider long entry near FVG support
A red triangle (▼) → consider short entry near FVG resistance
Confirm with price action: Wait for a strong candle close or rejection at the FVG zone
Use stop-loss below/above the FVG and target recent liquidity pools
💡 Pro Tip: Best used during high-volume sessions (e.g., London Open 7–10 AM UTC, NY Open 12:30–3:30 PM UTC).
🛠️ Settings (Inputs):
Show Fair Value Gaps
✅ Enabled
Visualize FVG zones
Max FVG History
100 bars
Prevent chart clutter
Require FVG for Signal?
✅ Enabled
Higher-quality setups (disable to test CHOCH-only)
⚠️ Important Notes:
This is a signal generator, not financial advice. Always manage risk.
Works best in trending or breaking markets — avoid during low-volatility ranges.
FVGs may get filled (tested) before price continues — patience improves results.
Backtest on historical data before live trading.
📣 Ideal For:
Retail traders learning Smart Money Concepts (SMC)
Price action traders seeking institutional-level confluence
Intraday scalpers & swing traders on 30m–1H timeframes

Fair Value Lead-Lag Model [BackQuant]Fair Value Lead-Lag Model
A cross-asset model that estimates where price "should" be relative to a chosen reference series, then tracks the deviation as a normalized oscillator. It helps you answer two questions: 1) is the asset rich or cheap vs its driver, and 2) is the driver leading or lagging price over the next N bars.
Concept in one paragraph
Many assets co-move with a macro or sector driver. Think BTC vs DXY, gold vs real yields, a stock vs its sector ETF. This tool builds a rolling fair value of the charted asset from a reference series and shows how far price is above or below that fair value in standard deviation units. You can shift the reference forward or backward to test who leads whom, then use the deviation and its bands to structure mean-reversion or trend-following ideas.
What the model does
Reference mapping : Pulls a reference symbol at a chosen timeframe, with an optional lead or lag in bars to test causality.
Fair value engine : Converts the reference into a synthetic fair value of the chart using one of four methods:
Ratio : price/ref with a rolling average ratio. Good when the relationship is proportional.
Spread : price minus ref with a rolling average spread. Good when the relationship is additive.
Z-Score : normalizes both series, aligns on standardized units, then re-projects to price space. Good when scale drifts.
Beta-Adjusted : rolling regression style. Uses covariance and variance to compute beta, then builds a fair value = mean(price) + beta * (ref − mean(ref)).
Deviation and bands : Computes a z-scored deviation of price vs fair value and plots sigma bands (±1, ±2, ±3) around the fair value line on the chart.
Correlation context : Shows rolling correlation so you can judge if deviations are meaningful or just noise when co-movement is weak.
Visuals :
Fair value line on price chart with sigma envelopes.
Deviation as a column oscillator and optional line.
Threshold shading beyond user-set upper and lower levels.
Summary table with reference, deviation, status, correlation, and method.
Why this is useful
Mean reversion framework : When correlation is healthy and deviation stretches beyond your sigma threshold, probability favors reversion toward fair value. This is classic pairs logic adapted to a driver and a target.
Trend confirmation : If price rides the fair value line and deviation stays modest while correlation is positive, it supports trend persistence. Pullbacks to negative deviation in an uptrend can be buyable.
Lead-lag discovery : Shift the reference forward by +N bars. If correlation improves, the reference tends to lead. Shift backward for the reverse. Use the best setting for planning early entries or hedges.
Regime detection : Large persistent deviations with falling correlation hint at regime change. The relationship you relied on may be breaking down, so reduce confidence or switch methods.
How to use it step by step
Pick a sensible reference : Choose a macro, index, currency, or sector driver that logically explains the asset’s moves. Example: gold with DXY, a semiconductor stock with SOXX.
Test lead-lag : Nudge Lead/Lag Periods to small positive values like +1 to +5 to see if the reference leads. If correlation improves, keep that offset. If correlation worsens, try a small negative value or zero.
Select a method :
Start with Beta-Adjusted when the relationship is approximately linear with drift.
Use Ratio if the assets usually move in proportional terms.
Use Spread when they trade around a level difference.
Use Z-Score when scales wander or volatility regimes shift.
Tune windows :
Rolling Window controls how quickly fair value adapts. Shorter equals faster but noisier.
Normalization Period controls how deviations are standardized. Longer equals stabler sigma sizing.
Correlation Length controls how co-movement is measured. Keep it near the fair value window.
Trade the edges :
Mean reversion idea : Wait for deviation beyond your Upper or Lower Threshold with positive correlation. Fade back toward fair value. Exit at the fair value line or the next inner sigma band.
Trend idea : In an uptrend, buy pullbacks when deviation dips negative but correlation remains healthy. In a downtrend, sell bounces when deviation spikes positive.
Read the table : Deviation shows how many sigmas you are from fair value. Status tells you overvalued or undervalued. Correlation color hints confidence. Method tells you the projection style used.
Reading the display
Fair value line on price chart: the model’s estimate of where price should trade given the reference, updated each bar.
Sigma bands around fair value: a quick sense of residual volatility. Reversions often target inner bands first.
Deviation oscillator : above zero means rich vs fair value, below zero means cheap. Color bins intensify with distance.
Correlation line (optional): scale is folded to match thresholds. Higher values increase trust in deviations.
Parameter tips
Start with Rolling Window 20 to 30, Normalization Period 100, Correlation Length 50.
Upper and Lower Threshold at ±2.0 are classic. Tighten to ±1.5 for more signals or widen to ±2.5 to focus on outliers.
When correlation drifts below about 0.3, treat deviations with caution. Consider switching method or reference.
If the fair value line whipsaws, increase Rolling Window or move to Beta-Adjusted which tends to be smoother.
Playbook examples
Pairs-style reversion : Asset is +2.3 sigma rich vs reference, correlation 0.65, trend flat. Short the deviation back toward fair value. Cover near the fair value line or +1 sigma.
Pro-trend pullback : Uptrend with correlation 0.7. Deviation dips to −1.2 sigma while price sits near the −1 sigma band. Buy the dip, target the fair value line, trail if the line is rising.
Lead-lag timing : Reference leads by +3 bars with improved correlation. Use reference swings as early cues to anticipate deviation turns on the target.
Caveats
The model assumes a stable relationship over the chosen windows. Structural breaks, policy shocks, and index rebalances can invalidate recent history.
Correlation is descriptive, not causal. A strong correlation does not guarantee future convergence.
Do not force trades when the reference has low liquidity or mismatched hours. Use a reference timeframe that captures real overlap.
Bottom line
This tool turns a loose cross-asset intuition into a quantified, visual fair value map. It gives you a consistent way to find rich or cheap conditions, time mean-reversion toward a statistically grounded target, and confirm or fade trends when the driver agrees.

Luxy Adaptive MA Cloud - Trend Strength & Signal Tracker V2Luxy Adaptive MA Cloud - Professional Trend Strength & Signal Tracker
Next-generation moving average cloud indicator combining ultra-smooth gradient visualization with intelligent momentum detection. Built for traders who demand clarity, precision, and actionable insights.
═══════════════════════════════════════════════
WHAT MAKES THIS INDICATOR SPECIAL?
═══════════════════════════════════════════════
Unlike traditional MA indicators that show static lines, Luxy Adaptive MA Cloud creates a living, breathing visualization of market momentum. Here's what sets it apart:
Exponential Gradient Technology
This isn't just a simple fill between two lines. It's a professionally engineered gradient system with 26 precision layers using exponential density distribution. The result? An organic, cloud-like appearance where the center is dramatically darker (15% transparency - where crossovers and price action occur), while edges fade gracefully (75% transparency). Think of it as a visual "heat map" of trend strength.
Dynamic Momentum Intelligence
Most MA clouds only show structure (which MA is on top). This indicator shows momentum strength in real-time through four intelligent states:
- 🟢 Bright Green = Explosive bullish momentum (both MAs rising strongly)
- 🔵 Blue = Weakening bullish (structure intact, but momentum fading)
- 🟠 Orange = Caution zone (bearish structure forming, weak momentum)
- 🔴 Deep Red = Strong bearish momentum (both MAs falling)
The cloud literally tells you when trends are accelerating or losing steam.
Conditional Performance Architecture
Every calculation is optimized for speed. Disable a feature? It stops calculating entirely—not just hidden, but not computed . The 26-layer gradient only renders when enabled. Toggle signals off? Those crossover checks don't run. This makes it one of the most efficient cloud indicators available, even with its advanced visual system.
Zero Repaint Guarantee
All signals and momentum states are based on confirmed bar data only . What you see in historical data is exactly what you would have seen trading live. No lookahead bias. No repainting tricks. No signals that "magically" appear perfect in hindsight. If a signal shows in history, it would have triggered in real-time at that exact moment.
Educational by Design
Every single input includes comprehensive tooltips with:
- Clear explanations of what each parameter does
- Practical examples of when to use different settings
- Recommended configurations for scalping, day trading, and swing trading
- Real-world trading impact ("This affects entry timing" vs "This is visual only")
You're not just getting an indicator—you're learning how to use it effectively .
═══════════════════════════════════════════════
THE GRADIENT CLOUD - TECHNICAL DETAILS
═══════════════════════════════════════════════
Architecture:
26 precision layers for silk-smooth transitions
Exponential density curve - layers packed tightly near center (where crossovers happen), spread wider at edges
75%-15% transparency range - center is highly opaque (15%), edges fade gracefully (75%)
V-Gradient design - emphasizes the action zone between Fast and Medium MAs
The Four Momentum States:
🟢 GREEN - Strong Bullish
Fast MA above Medium MA
Both MAs rising with momentum > 0.02%
Action: Enter/hold LONG positions, strong uptrend confirmed
🔵 BLUE - Weak Bullish
Fast MA above Medium MA
Weak or flat momentum
Action: Caution - bullish structure but losing strength, consider trailing stops
🟠 ORANGE - Weak Bearish
Medium MA above Fast MA
Weak or flat momentum
Action: Warning - bearish structure developing, consider exits
🔴 RED - Strong Bearish
Medium MA above Fast MA
Both MAs falling with momentum < -0.02%
Action: Enter/hold SHORT positions, strong downtrend confirmed
Smooth Transitions: The momentum score is smoothed using an 8-bar EMA to eliminate noise and prevent whipsaws. You see the true trend , not every minor fluctuation.
═══════════════════════════════════════════════
FLEXIBLE MOVING AVERAGE SYSTEM
═══════════════════════════════════════════════
Three Customizable MAs:
Fast MA (default: EMA 10) - Reacts quickly to price changes, defines short-term momentum
Medium MA (default: EMA 20) - Balances responsiveness with stability, core trend reference
Slow MA (default: SMA 200, optional) - Long-term trend filter, major support/resistance
Six MA Types Available:
EMA - Exponential; faster response, ideal for momentum and day trading
SMA - Simple; smooth and stable, best for swing trading and trend following
WMA - Weighted; middle ground between EMA and SMA
VWMA - Volume-weighted; reflects market participation, useful for liquid markets
RMA - Wilder's smoothing; used in RSI/ADX, excellent for trend filters
HMA - Hull; extremely responsive with minimal lag, aggressive option
Recommended Settings by Trading Style:
Scalping (1m-5m):
Fast: EMA(5-8)
Medium: EMA(10-15)
Slow: Not needed or EMA(50)
Day Trading (5m-1h):
Fast: EMA(10-12)
Medium: EMA(20-21)
Slow: SMA(200) for bias
Swing Trading (4h-1D):
Fast: EMA(10-20)
Medium: EMA(34-50)
Slow: SMA(200)
Pro Tip: Start with Fast < Medium < Slow lengths. The gradient works best when there's clear separation between Fast and Medium MAs.
═══════════════════════════════════════════════
CROSSOVER SIGNALS - CLEAN & RELIABLE
═══════════════════════════════════════════════
Golden Cross ⬆ LONG Signal
Fast MA crosses above Medium MA
Classic bullish reversal or trend continuation signal
Most reliable when accompanied by GREEN cloud (strong momentum)
Death Cross ⬇ SHORT Signal
Fast MA crosses below Medium MA
Classic bearish reversal or trend continuation signal
Most reliable when accompanied by RED cloud (strong momentum)
Signal Intelligence:
Anti-spam filter - Minimum 5 bars between signals prevents noise
Clean labels - Placed precisely at crossover points
Alert-ready - Built-in ALERTS for automated trading systems
No repainting - Signals based on confirmed bars only
Signal Quality Assessment:
High-Quality Entry:
Golden Cross + GREEN cloud + Price above both MAs
= Strong bullish setup ✓
Low-Quality Entry (skip or wait):
Golden Cross + ORANGE cloud + Choppy price action
= Weak bullish setup, likely whipsaw ✗
═══════════════════════════════════════════════
REAL-TIME INFO PANEL
═══════════════════════════════════════════════
An at-a-glance dashboard showing:
Trend Strength Indicator:
Visual display of current momentum state
Color-coded header matching cloud color
Instant recognition of market bias
MA Distance Table:
Shows percentage distance of price from each enabled MA:
Green rows : Price ABOVE MA (bullish)
Red rows : Price BELOW MA (bearish)
Gray rows : Price AT MA (rare, decision point)
Distance Interpretation:
+2% to +5%: Healthy uptrend
+5% to +10%: Getting extended, caution
+10%+: Overextended, expect pullback
-2% to -5%: Testing support
-5% to -10%: Oversold zone
-10%+: Deep correction or downtrend
Customization:
4 corner positions
5 font sizes (Tiny to Huge)
Toggle visibility on/off
═══════════════════════════════════════════════
HOW TO USE - PRACTICAL TRADING GUIDE
═══════════════════════════════════════════════
STRATEGY 1: Trend Following
Identify trend : Wait for GREEN (bullish) or RED (bearish) cloud
Enter on signal : Golden Cross in GREEN cloud = LONG, Death Cross in RED cloud = SHORT
Hold position : While cloud maintains color
Exit signals :
• Cloud turns ORANGE/BLUE = momentum weakening, tighten stops
• Opposite crossover = close position
• Cloud turns opposite color = full reversal
STRATEGY 2: Pullback Entries
Confirm trend : GREEN cloud established (bullish bias)
Wait for pullback : Price touches or crosses below Fast MA
Enter when : Price rebounds back above Fast MA with cloud still GREEN
Stop loss : Below Medium MA or recent swing low
Target : Previous high or when cloud weakens
STRATEGY 3: Momentum Confirmation
Your setup triggers : (e.g., chart pattern, support/resistance)
Check cloud color :
• GREEN = proceed with LONG
• RED = proceed with SHORT
• BLUE/ORANGE = skip or reduce size
Use gradient as confluence : Not as primary signal, but as momentum filter
Risk Management Tips:
Never enter against the cloud color (don't LONG in RED cloud)
Reduce position size during BLUE/ORANGE (transition periods)
Place stops beyond Medium MA for swing trades
Use Slow MA (200) as final trend filter - don't SHORT above it in uptrends
═══════════════════════════════════════════════
PERFORMANCE & OPTIMIZATION
═══════════════════════════════════════════════
Tested On:
Crypto: BTC, ETH, major altcoins
Stocks: SPY, AAPL, TSLA, QQQ
Forex: EUR/USD, GBP/USD, USD/JPY
Indices: S&P 500, NASDAQ, DJI
═══════════════════════════════════════════════
TRANSPARENCY & RELIABILITY
═══════════════════════════════════════════════
Educational Focus:
Detailed tooltips on every input
Clear documentation of methodology
Practical examples in descriptions
Teaches you why , not just what
Open Logic:
Momentum calculation: (Fast slope + Medium slope) / 2
Smoothing: 8-bar EMA to reduce noise
Thresholds: ±0.02% for strong momentum classification
Everything is transparent and explainable
═══════════════════════════════════════════════
COMPLETE FEATURE LIST
═══════════════════════════════════════════════
Visual Components:
26-layer exponential gradient cloud
3 customizable moving average lines
Golden Cross / Death Cross labels
Real-time info panel with trend strength
MA distance table
Calculation Features:
6 MA types (EMA, SMA, WMA, VWMA, RMA, HMA)
Momentum-based cloud coloring
Smoothed trend strength scoring
Conditional performance optimization
Customization Options:
All MA lengths adjustable
All colors customizable (when gradient disabled)
Panel position (4 corners)
Font sizes (5 options)
Toggle any feature on/off
Signal Features:
Anti-spam filter (configurable gap)
Clean, non-overlapping labels
Built-in alert conditions
No repainting guarantee
═══════════════════════════════════════════════
IMPORTANT DISCLAIMERS
═══════════════════════════════════════════════
This indicator is for educational and informational purposes only
Not financial advice - always do your own research
Past performance does not guarantee future results
Use proper risk management - never risk more than you can afford to lose
Test on paper/demo accounts before using with real money
Combine with other analysis methods - no single indicator is perfect
Works best in trending markets; less effective in choppy/sideways conditions
Signals may perform differently in different timeframes and market conditions
The indicator uses historical data for MA calculations - allow sufficient lookback period
═══════════════════════════════════════════════
CREDITS & TECHNICAL INFO
═══════════════════════════════════════════════
Version: 2.0
Release: October 2025
Special Thanks:
TradingView community for feedback and testing
Pine Script documentation for technical reference
═══════════════════════════════════════════════
SUPPORT & UPDATES
═══════════════════════════════════════════════
Found a bug? Comment below with:
Ticker symbol
Timeframe
Screenshot if possible
Steps to reproduce
Feature requests? I'm always looking to improve! Share your ideas in the comments.
Questions? Check the tooltips first (hover over any input) - most answers are there. If still stuck, ask in comments.
═══════════════════════════════════════════════
Happy Trading!
Remember: The best indicator is the one you understand and use consistently. Take time to learn how the cloud behaves in different market conditions. Practice on paper before going live. Trade smart, manage risk, and may the trends be with you! 🚀

Smart Money Concepts Pro – OB, FVG, Liquidity + Trade SetupsThis script is a complete Smart Money Concepts (SMC) toolkit designed for traders who want clean and actionable charts without clutter.
It combines the most important institutional concepts into one indicator:
Order Blocks (OB): auto-detection of bullish and bearish order blocks with mitigation tracking, merging and TTL (time-to-live).
Fair Value Gaps (FVG): automatic gap recognition with size filters, mitigation tracking and lifetime control.
Liquidity Pools (EQH/EQL): equal highs and equal lows marked with tolerance (ATR-based or fixed).
Break of Structure (BOS): up/down structure shifts plotted directly on the chart.
Multi-Timeframe (HTF): option to use higher timeframe data (e.g. H4, Daily) for stronger zones.
Trend Filter: show zones only in the direction of market structure.
Trade Setups: automatic signals for OB Retest + Trend setups, with entry, stop-loss and take-profit levels (custom R-R).
Flexible Zone Extension: choose between extending zones to the live bar or fixed box width for a cleaner look when scrolling.
Features
Fully customizable (pivot length, ATR filters, box width, TTL, zone colors)
Separate presets for Scalping, Intraday, Swing trading styles
Visual trade planning with entry/SL/TP lines and optional labels
Works across all markets (crypto, forex, indices, stocks)
How to use
Bias: identify overall direction (BOS + HTF zones).
Wait: for price to return to an unmitigated OB or FVG.
Entry: take the setup signal (OB retest + trend filter).
Risk: stop-loss at opposite OB boundary.
Target: TP based on chosen R-R multiple (default 2R).
⚡ Whether you scalp short-term moves or swing trade HTF zones, this indicator gives you a clear institutional edge in spotting supply/demand imbalances and high-probability setups.

ZS Game Changer Pump & Dump DetectorZS GAME CHANGER PUMP AND DUMP DETECTOR - TOP 2 MOMENTUM TRACKER
Created by Zakaria Safri
An intelligent indicator specifically designed to identify and highlight the two most significant pump and dump candles within your selected lookback period. Perfect for traders who want to focus on the game-changing moves that truly matter in volatile markets like cryptocurrency, stocks, and forex.
CORE FEATURES
AUTOMATIC GAME CHANGER DETECTION
The indicator continuously scans your specified lookback period and automatically identifies the top 2 strongest pump candles and top 2 strongest dump candles. These game-changing candles are highlighted with distinctive gold labels and horizontal reference lines, making them instantly visible on your chart. Unlike other indicators that show every small move, this focuses exclusively on the market-moving moments that define trends and create opportunities.
INTELLIGENT PUMP AND DUMP CLASSIFICATION
Uses advanced percentage-based calculations to classify candles as pumps when price surges significantly upward and dumps when price plunges sharply downward. The detection system accounts for candle body size, wick proportions, and volume confirmation to ensure only legitimate momentum moves trigger signals. Customizable thresholds allow adaptation to any market volatility profile from calm stocks to wild altcoins.
ADVANCED WICK EXCLUSION FILTER
Eliminates false signals caused by candles with large wicks and small bodies. This filter focuses analysis exclusively on candles with substantial body sizes that indicate genuine directional conviction rather than temporary spikes followed by rejection. The body to candle ratio is fully adjustable to match your preferred signal quality standards.
VOLUME CONFIRMATION SYSTEM
Optional volume filter ensures detected pumps and dumps are backed by real market participation. The indicator compares current volume against a moving average and only triggers signals when volume exceeds your specified multiplier threshold. This eliminates low-volume noise and focuses on moves supported by institutional or crowd participation.
RALLY SEQUENCE DETECTION
Identifies and highlights consecutive sequences of pump or dump candles with colored background overlays. Green background indicates sustained buying pressure across multiple candles while red background shows sustained selling pressure. The rally detection system includes an optional one-miss allowance that prevents the sequence from breaking due to a single neutral candle.
HORIZONTAL REFERENCE LINES
Draws dashed lines from each game changer candle extending to the current bar, providing constant visual reference to the most significant support and resistance levels created by extreme momentum. The top game changer gets a thick dashed line while the second gets a dotted line for easy differentiation. Labels on the right side display the exact percentage move.
COMPREHENSIVE STATISTICS DASHBOARD
Real-time information panel showing current market status as pumping, dumping, or neutral along with the current candle percentage change. Displays the exact percentage values for top pump number 1, top pump number 2, top dump number 1, and top dump number 2. Shows running totals of all pumps and dumps detected since chart load. Tracks consecutive candle counts during active rally sequences.
TESTING AND VERIFICATION MODE
Built-in debug mode displays percentage change directly on each qualifying pump and dump candle, allowing instant verification that calculations are accurate. Shows which filters are currently active with a simple code in the dashboard. Helps traders understand exactly why certain candles qualified as game changers.
HOW THE GAME CHANGER DETECTION WORKS
SCANNING ALGORITHM
Every bar close, the indicator scans backward through your specified lookback period examining every candle's percentage change from its previous close. For bullish moves, it identifies the two candles with the largest positive percentage change that meet your threshold requirements. For bearish moves, it identifies the two candles with the largest negative percentage change meeting threshold requirements.
RANKING SYSTEM
Candles are ranked purely by their percentage move magnitude. The number 1 game changer is always the single strongest move in the lookback period. The number 2 game changer is the second strongest move. Rankings update dynamically as new candles form and old candles exit the lookback window.
VISUAL IDENTIFICATION
Game changer number 1 for both pumps and dumps receives a large gold label reading GAME CHANGER NUMBER 1 with zero transparency for maximum visibility. Game changer number 2 receives a slightly smaller gold label with partial transparency. The candle bars themselves are colored in gold instead of the standard green or red. Horizontal lines extend from the game changer price level to current bar.
FILTER APPLICATION
Only candles that pass your configured filters qualify for game changer consideration. If wick exclusion is enabled, candles with large wicks and small bodies are ignored. If volume confirmation is enabled, only candles with above-average volume qualify. This ensures game changers represent legitimate market moves rather than aberrations.
PRACTICAL APPLICATIONS
FOR CRYPTOCURRENCY TRADERS
Crypto markets experience extreme volatility with occasional massive pump and dump candles that define entire trends. This indicator instantly identifies which candles represent true market structure shifts versus normal noise. Use the game changer levels as key support and resistance for entries, exits, and stop placement. The top pump often marks the local high to watch for breakouts while the top dump marks the local low for reversal trades.
FOR DAY TRADERS
Intraday charts contain hundreds of candles but only a few truly matter for the session outcome. Game changer detection filters out 98 percent of candles to show you the 2 percent that drove the actual price movement. Enter trades on the side of the strongest recent game changer. Use game changer levels as magnet prices where algorithmic trading often returns.
FOR SWING TRADERS
On daily and four-hour timeframes, game changers represent major institutional activity or news-driven moves. The top dump often marks capitulation selling that creates reversal opportunities. The top pump often marks FOMO buying that creates resistance levels. Swing traders can build positions knowing these levels will be defended or tested multiple times.
FOR VOLATILITY ANALYSIS
Understanding which candles created the most volatility helps assess market risk. Multiple game changers clustered together indicate unstable choppy conditions. Game changers separated by many neutral candles indicate trending stable conditions. Use this context to adjust position sizing and stop distances appropriately.
FOR SUPPORT AND RESISTANCE TRADING
Game changer candles create the strongest support and resistance levels because they represent prices where massive volume transacted in short time periods. These levels have higher probability of holding on retest compared to arbitrary moving averages or pivot points. Trade bounces off game changer levels or breakouts through them.
RECOMMENDED SETTINGS BY MARKET
CRYPTOCURRENCY 15-MINUTE TO 1-HOUR CHARTS
Candle Size Threshold: 2.0 percent
Body to Candle Ratio: 0.5
Volume Multiplier: 1.5 times average
Game Changer Lookback: 100 bars
Extreme Threshold: 3.5 percent
Enable Wick Filter: Yes
Enable Volume Confirmation: Yes
Minimum Rally Candles: 3
STOCKS DAILY CHARTS
Candle Size Threshold: 1.0 percent
Body to Candle Ratio: 0.6
Volume Multiplier: 2.0 times average
Game Changer Lookback: 50 bars
Extreme Threshold: 2.5 percent
Enable Wick Filter: Yes
Enable Volume Confirmation: Yes
Minimum Rally Candles: 2
FOREX 1-HOUR TO 4-HOUR CHARTS
Candle Size Threshold: 0.5 percent
Body to Candle Ratio: 0.5
Volume Multiplier: Not applicable
Game Changer Lookback: 80 bars
Extreme Threshold: 1.0 percent
Enable Wick Filter: Yes
Enable Volume Confirmation: No
Minimum Rally Candles: 3
SCALPING 1-MINUTE TO 5-MINUTE CHARTS
Candle Size Threshold: 0.8 percent
Body to Candle Ratio: 0.4
Volume Multiplier: 1.2 times average
Game Changer Lookback: 50 bars
Extreme Threshold: 1.5 percent
Enable Wick Filter: No
Enable Volume Confirmation: Yes
Minimum Rally Candles: 2
WHAT IS INCLUDED
Automatic identification of top 2 pump candles
Automatic identification of top 2 dump candles
Gold colored game changer labels with size differentiation
Gold colored candle bars for game changers
Horizontal reference lines from game changers to current price
Regular pump and dump detection with green and red candles
Rally sequence detection with background highlighting
Extreme move detection and labeling system
Real-time statistics dashboard with all key metrics
Percentage change debug mode for verification
Volume confirmation filter with adjustable multiplier
Wick exclusion filter with adjustable body ratio
Customizable lookback period from 20 to 500 bars
Consecutive candle counter for rally tracking
Alert system for game changers, pumps, dumps, and rallies
Works on all timeframes from 1 minute to monthly
Compatible with stocks, forex, cryptocurrency, and futures
UNDERSTANDING GAME CHANGERS
WHAT MAKES A CANDLE A GAME CHANGER
A game changer is not just a large move but the largest move within context. In a volatile crypto market, a 5 percent pump might not rank in the top 2. In a stable stock, a 2 percent pump could be the number 1 game changer. The indicator adapts to your specific instrument and timeframe to find what truly matters in that context.
WHY FOCUS ON TOP 2 ONLY
Markets are driven by a small number of significant moves rather than the average of all moves. By focusing exclusively on the top 2 in each direction, traders can ignore noise and concentrate on the price levels that actually matter for support, resistance, and momentum. This creates clarity in decision making.
GAME CHANGERS AS MARKET STRUCTURE
The top pump often marks the recent high that bulls must break to continue uptrend. The top dump often marks the recent low that bears must break to continue downtrend. These become the key levels around which all other price action rotates. Understanding this structure is essential for profitable trading.
GAME CHANGERS AS SENTIMENT INDICATORS
Consecutive pump game changers signal strong bullish sentiment and FOMO conditions. Consecutive dump game changers signal fear and capitulation. Alternating pump and dump game changers signal indecision and range conditions. Read the pattern of game changers to gauge market psychology.
VERIFICATION AND TESTING
HOW TO VERIFY ACCURACY
Enable Show Debug Info on Chart in the Testing and Debug settings group. This displays the percentage change calculation directly on every qualifying pump and dump candle. Manually verify by calculating open minus close divided by close multiplied by 100. The debug percentage should match your manual calculation exactly.
HOW TO TEST FILTERS
Toggle wick exclusion filter on and off while watching how many candles qualify. With filter on, candles with long wicks and small bodies should disappear. Toggle volume confirmation on and off to see how low-volume candles get excluded. Adjust the thresholds and watch the real-time impact on signal count.
HOW TO VERIFY GAME CHANGERS
Look at your chart and visually identify which candle had the biggest green body in the lookback period. The game changer number 1 pump label should be on that exact candle. Repeat for the biggest red candle to verify game changer number 1 dump. The rankings should match your visual assessment.
LOOKBACK PERIOD EFFECTS
Decrease the lookback period to 20 bars and watch game changers update to only recent moves. Increase to 500 bars and watch game changers potentially change to older historic moves. The optimal lookback balances recency with significance. Too short misses important levels, too long includes irrelevant history.
DASHBOARD INFORMATION GUIDE
STATUS ROW
Shows PUMPING when current candle qualifies as a pump, DUMPING when current candle qualifies as a dump, or NEUTRAL when current candle does not meet threshold requirements. This updates in real-time on every bar close.
CURRENT CHANGE ROW
Displays the percentage change of the current candle from its previous close. Positive percentages indicate bullish candle, negative indicate bearish candle. This number may or may not meet your threshold to qualify as pump or dump.
TOP PUMP NUMBER 1
The highest positive percentage change found in your lookback period. This candle is marked with the large gold GAME CHANGER NUMBER 1 label below it. Shows N/A if no pumps exist in the lookback period.
TOP PUMP NUMBER 2
The second highest positive percentage change found in your lookback period. Marked with smaller gold GAME CHANGER NUMBER 2 label. Shows N/A if only one or zero pumps exist.
TOP DUMP NUMBER 1
The highest negative percentage change magnitude found in your lookback period. This candle is marked with the large gold GAME CHANGER NUMBER 1 label above it. Shows N/A if no dumps exist.
TOP DUMP NUMBER 2
The second highest negative percentage change magnitude found in your lookback period. Marked with smaller gold GAME CHANGER NUMBER 2 label. Shows N/A if only one or zero dumps exist.
TOTAL PUMPS
Running count of all pump candles detected since you loaded the indicator on this chart. This number continuously increases as new qualifying pumps form. Resets when you reload the chart.
TOTAL DUMPS
Running count of all dump candles detected since chart load. Increases as new qualifying dumps form and resets on chart reload.
CONSECUTIVE
Shows the current count of consecutive pump or dump candles during an active rally. Displays 3 UP during a 3-candle pump rally or 5 DN during a 5-candle dump rally. Shows 0 when no rally is active.
ALERT SYSTEM
GAME CHANGER DETECTED ALERT
Triggers whenever the current candle becomes one of the top 2 pumps or top 2 dumps. This is the highest priority alert indicating a market-moving event just occurred. Use this alert for immediate notification of significant opportunities.
PUMP DETECTED ALERT
Triggers on every candle that qualifies as a pump according to your threshold and filter settings. This includes regular pumps and extreme pumps but excludes game changers which have their separate alert. Use for general upward momentum monitoring.
DUMP DETECTED ALERT
Triggers on every candle that qualifies as a dump according to your settings. Includes regular and extreme dumps but excludes game changers. Use for general downward momentum monitoring.
PUMP RALLY STARTED ALERT
Triggers when consecutive pump candles reach your minimum rally threshold. Indicates the beginning of a sustained upward movement sequence. Use to catch trends early.
DUMP RALLY STARTED ALERT
Triggers when consecutive dump candles reach your minimum rally threshold. Indicates the beginning of a sustained downward movement sequence. Use for trend following or reversal timing.
ALERT MESSAGE FORMAT
All alerts include the ticker symbol and current price using TradingView placeholders. Messages are descriptive and specify which type of signal triggered. Alerts work with TradingView notification system including email, SMS, webhook, and app notifications.
TECHNICAL SPECIFICATIONS
CALCULATION METHODOLOGY
Percentage change calculated as current close minus previous close divided by previous close multiplied by 100. Body ratio calculated as absolute value of close minus open divided by high minus low. Volume elevation calculated as current volume divided by 20-period simple moving average of volume. Game changer ranking uses absolute value comparison across entire lookback array.
PERFORMANCE CHARACTERISTICS
Lightweight calculations optimized for speed on all timeframes. No repainting of signals ensuring all triggers are final on bar close. Variables properly scoped with var keyword for memory efficiency. Maximum bars back set to 500 to prevent excessive historical loading. Updates in real-time on every bar close without lag.
COMPATIBILITY
Works on all TradingView plans including free, pro, and premium. Compatible with stocks, forex, cryptocurrency, futures, indices, and commodities. Functions correctly on all timeframes from 1 second to monthly. No external data requests ensuring fast loading. Overlay true setting places directly on price chart.
RISK DISCLAIMER
This indicator is a technical analysis tool for identifying momentum and should not be used as the sole basis for trading decisions. Game changer levels can be broken during strong trends and are not guaranteed support or resistance. Pump and dump detection does not predict future price direction. Always use proper risk management with stop losses on every trade. Combine this indicator with other forms of analysis including fundamentals, market context, and risk assessment. Practice on demo accounts before live trading. Past performance of game changer signals does not guarantee future results. Trading carries substantial risk of loss and is not suitable for all investors. The creator is not responsible for trading losses incurred while using this tool.
SUPPORT AND UPDATES
Regular updates based on user feedback and market evolution. Built following PineCoders industry standards and best practices for code quality. Clean well-documented code structure for transparency and auditability. Optimized performance across all timeframes and instruments. Active development with continuous improvements and feature additions.
WHY CHOOSE ZS GAME CHANGER PUMP AND DUMP DETECTOR
Focuses on what matters by highlighting only the top 2 moves in each direction instead of cluttering your chart with every small fluctuation. Saves time by automatically identifying the most significant candles rather than requiring manual scanning. Provides clarity through visual gold labels and reference lines that make game changers unmistakable. Adapts to any market with customizable thresholds for volatility and volume. Eliminates noise with advanced wick and volume filters ensuring signal quality. Offers verification through debug mode proving calculations are accurate and trustworthy. Includes comprehensive statistics showing exact percentages and counts. Works everywhere across all markets, timeframes, and instruments without modification.
Transform your chart analysis by focusing exclusively on the game-changing moments that define trends and create opportunities.
Version 1.1 | Created by Zakaria Safri | Pine Script Version 5 | PineCoders Compliant

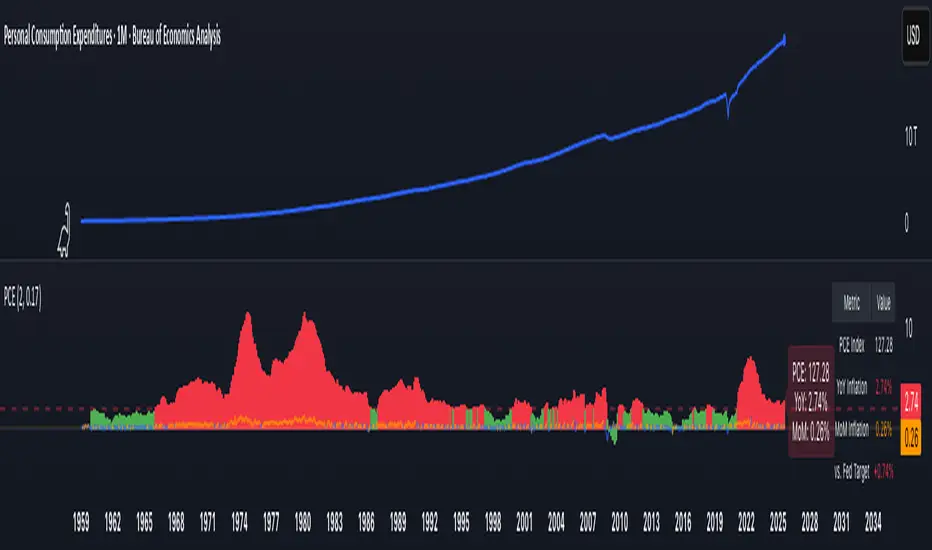
PCE Inflation Monitor (Change YoY & MoM)📊 PCE Inflation Monitor - The Fed's Most Important Metric
Personal Consumption Expenditures (PCE) is the Federal Reserve's preferred inflation measure and THE metric they target for their 2% inflation goal. If you want to predict Fed policy, you need to watch PCE.
🎯 KEY FEATURES:
- Dual Perspective Analysis:
- Year-over-Year (YoY): Histogram bars showing annual PCE inflation
- Month-over-Month (MoM): Line overlay showing monthly consumption price changes
- Visual Reference System:
- Dashed line at 2% (Fed's official PCE inflation target)
- Dotted line at 0.17% (equivalent monthly target)
- Color-coded bars: Red above Fed target, Green below target
- Real-Time Data Table:
- Current PCE Index value
- YoY inflation rate vs. Fed's 2% target
- MoM inflation rate with color coding
- Exact deviation from Fed target (critical for policy predictions)
- Automated Alerts:
- PCE crosses Fed's 2% target (major policy signal!)
- MoM crosses monthly target
- Stay informed of Fed-relevant inflation changes
📈 WHY PCE IS DIFFERENT (AND MORE IMPORTANT):
PCE vs. CPI differences:
- Flexible basket: PCE adjusts for substitution (beef → chicken if prices rise)
- Broader coverage: Includes healthcare paid by insurance/government
- Lower readings: Typically 0.2-0.4% below CPI
- Fed's choice: Explicitly stated as their target metric
Most importantly: When Powell speaks about "our 2% target," he means PCE, not CPI!
🔍 TRADING IMPLICATIONS:
PCE Above 2% (Red Zone):
→ Fed under pressure to maintain/raise rates
→ Hawkish policy stance likely
→ Negative for growth stocks, crypto
→ Positive for USD, bearish for gold
PCE Below 2% (Green Zone):
→ Fed has flexibility to cut rates
→ Dovish policy stance possible
→ Positive for risk assets, growth stocks
→ Negative for USD, bullish for commodities
PCE Approaching 2% from Above:
→ Fed "mission accomplished" narrative
→ Rate cut cycle becomes possible
→ Major bullish signal for equities/crypto
💡 ADVANCED STRATEGIES:
1. Fed Meeting Preparation: Check PCE before FOMC meetings for policy clues
2. Dot Plot Predictions: PCE trend determines Fed's rate forecast updates
3. Pivot Timing: When PCE MoM turns negative, Fed pivot becomes realistic
4. Press Conference Analysis: Compare Powell's comments to PCE deviation
🎯 KEY LEVELS TO WATCH:
- 2.0% YoY: Fed's official target - crossing this level is major news
- 2.5% YoY: "Uncomfortably high" - Fed forced to stay restrictive
- 3.0% YoY: "Crisis mode" - Fed turns very hawkish
- 1.5% YoY: "Below target" - Rate cuts become likely
🔄 COMBINE WITH:
- CPI: Public perception vs. Fed's metric (often diverge)
- Core PCE: Even more important (excludes food/energy volatility)
- Fed Funds Rate: Is Fed responding appropriately to PCE?
📊 DATA SOURCE:
Official PCE data from FRED (Federal Reserve Economic Data), updated monthly typically in the last week of each month (after CPI/PPI releases).
🎨 CUSTOMIZATION:
Fully customizable:
- Toggle YoY/MoM displays
- Adjust Fed target if needed
- Customize colors
- Show/hide absolute PCE values
Perfect for: Fed watchers, macro traders, policy analysts, and serious investors who want to predict monetary policy changes before they happen.
⚠️ CRITICAL INSIGHT: While media focuses on CPI, the Fed focuses on PCE. Trade what the Fed trades, not what the headlines say.
🎓 Pro Tip: Fed members often mention "Core PCE" (excluding food/energy). Consider adding that indicator alongside this one for complete Fed policy analysis.
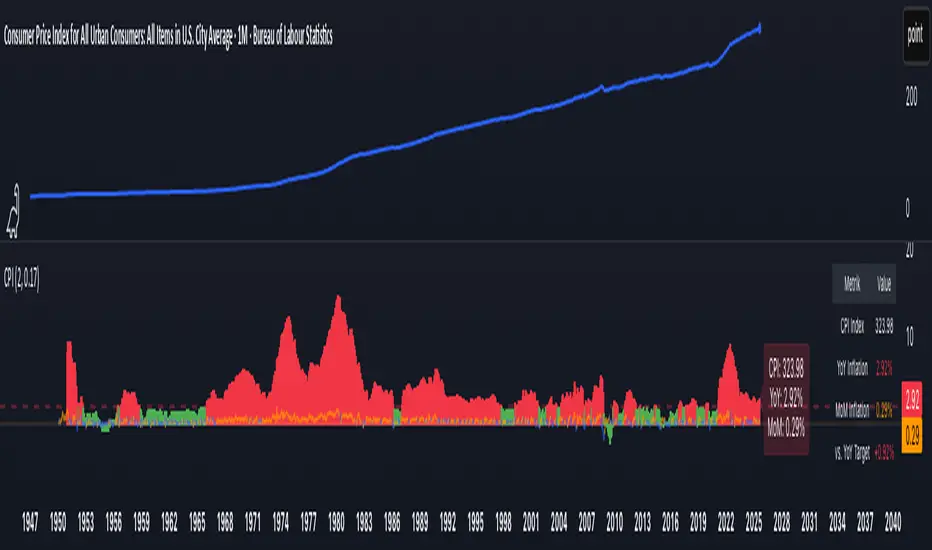
CPI Inflation Monitor (Change YoY & MoM)📊 CPI Inflation Monitor - Complete Macro Analysis Tool
This indicator provides a comprehensive view of Consumer Price Index (CPI) inflation trends, essential for understanding monetary policy, market conditions, and making informed trading decisions.
🎯 KEY FEATURES:
- Dual Perspective Analysis:
- Year-over-Year (YoY): Histogram bars showing annual inflation rate
- Month-over-Month (MoM): Line overlay showing monthly price changes
- Visual Reference System:
- Dashed line at 2% (Fed's official inflation target for YoY)
- Dotted line at 0.17% (equivalent monthly target for MoM)
- Color-coded bars: Red above target, Green below target
- Real-Time Data Table:
- Current CPI Index value
- YoY inflation rate with color coding
- MoM inflation rate with color coding
- Deviation from Fed target
- Automated Alerts:
- YoY crosses above/below 2% target
- MoM crosses above/below 0.17% target
- Perfect for staying informed without constant monitoring
📈 WHY THIS MATTERS FOR TRADERS:
CPI is the most widely reported inflation metric and directly influences:
- Federal Reserve interest rate decisions
- Bond yields and currency valuations
- Stock market sentiment (especially growth vs. value rotation)
- Cryptocurrency and risk asset performance
Rising inflation (red bars) typically leads to:
→ Higher interest rates → Negative for growth stocks, crypto
→ Stronger USD → Pressure on commodities
Falling inflation (green bars) typically leads to:
→ Rate cut expectations → Positive for growth stocks, crypto
→ Weaker USD → Support for commodities
🔍 HOW TO USE:
1. Strategic Positioning: Use YoY trend (thick bars) for long-term asset allocation
2. Tactical Timing: Use MoM trend (thin line) to identify turning points early
3. Divergence Trading: When MoM falls but YoY remains high, anticipate trend reversal
4. Fed Policy Prediction: Distance from 2% target indicates Fed's likely hawkishness
💡 PRO TIPS:
- Multiple months of MoM above 0.3% = Accelerating inflation → Fed turns hawkish
- MoM turning negative while YoY still elevated = Peak inflation → Position for pivot
- Compare with PPI and PCE indicators for complete inflation picture
- Use alerts to catch important threshold crossings automatically
📊 DATA SOURCE:
Official CPI data from FRED (Federal Reserve Economic Data), updated monthly mid-month when new data releases occur.
🎨 CUSTOMIZATION:
Fully customizable through settings:
- Toggle YoY/MoM displays
- Adjust target levels
- Customize colors for visual preference
- Show/hide absolute CPI values
Perfect for: Macro traders, swing traders, long-term investors, and anyone wanting to understand the inflation environment affecting their portfolio.
Note: This indicator works on any chart timeframe as it loads external monthly economic data.
Crypto Pro Strategy (Entry Model + Risk)Imma try to use this on a prop firm but if you want to use it itss free or im going to try to make it free

⚡ Elite Momentum Pro🎯 Key Features
1. Smart Signal Engine
3 Signal Modes: Aggressive, Balanced, Conservative
7-Point Scoring System - Ensures high-quality signals
Anti-Flip Protection - Prevents rapid signal changes
Multiple confirmations: Supertrend, MACD, RSI, EMA alignment, momentum
2. Advanced Risk Management
3 Take Profit Levels (TP1, TP2, TP3) for scaling out
ATR-Based Dynamic Stops - Adapts to volatility
Customizable Risk:Reward (default 2.5:1)
Visual stop and target levels
3. Clean Visual Design
Color-coded price bars based on trend strength
EMA Ribbon (9, 21, 50, 200) for trend clarity

QUANTUM MOMENTUMOverview
Quantum Momentum is a sophisticated technical analysis tool designed to help traders identify relative strength between assets through advanced momentum comparison. This cyberpunk-themed indicator visualizes momentum dynamics between your current trading symbol and any comparison asset of your choice, making it ideal for pairs trading, crypto correlation analysis, and multi-asset portfolio management.
Key Features
📊 Multi-Asset Momentum Comparison
Dual Symbol Analysis: Compare momentum between your chart symbol and any other tradable asset
Real-Time Tracking: Monitor relative momentum strength as market conditions evolve
Difference Visualization: Clear histogram display showing which asset has stronger momentum
🎯 Multiple Momentum Calculation Methods
Choose from four different momentum calculation types:
ROC (Rate of Change): Traditional percentage-based momentum measurement
RSI (Relative Strength Index): Oscillator-based momentum from 0-100 range
Percent Change: Simple percentage change over the lookback period
Raw Change: Absolute price change in native currency units
📈 Advanced Trend Filtering System
Enable optional trend filters to align momentum signals with prevailing market direction:
SMA (Simple Moving Average): Classic trend identification
EMA (Exponential Moving Average): Responsive trend detection
Price Action: Identifies trends through higher highs/lows or lower highs/lows patterns
ADX (Average Directional Index): Measures trend strength with customizable threshold
🎨 Futuristic Cyberpunk Design
Neon Color Scheme: Eye-catching cyan, magenta, and matrix green color palette
Glowing Visual Effects: Enhanced visibility with luminescent plot lines
Dynamic Background Shading: Subtle trend state visualization
Real-Time Data Table: Sleek information panel displaying current momentum values and trend status
How It Works
The indicator calculates momentum for both your current chart symbol and a comparison symbol (default: BTC/USDT) using your selected method and lookback period. The difference between these momentum values reveals which asset is exhibiting stronger momentum at any given time.
Positive Difference (Green): Your chart symbol has stronger momentum than the comparison asset
Negative Difference (Pink/Red): The comparison asset has stronger momentum than your chart symbol
When the trend filter is enabled, the indicator will only display signals that align with the detected market trend, helping filter out counter-trend noise.
Settings Guide
Symbol Settings
Compare Symbol: Choose any tradable asset to compare against (e.g., major indices, cryptocurrencies, forex pairs)
Momentum Settings
Momentum Length: Lookback period for momentum calculations (default: 14 bars)
Momentum Type: Select your preferred momentum calculation method
Display Options
Toggle visibility of current symbol momentum line
Toggle visibility of comparison symbol momentum line
Toggle visibility of momentum difference histogram
Optional zero line reference
Trend Filter Settings
Use Trend Filter: Enable/disable trend-based signal filtering
Trend Method: Choose from SMA, EMA, Price Action, or ADX
Trend Length: Period for trend calculations (default: 50)
ADX Threshold: Minimum ADX value to confirm trend strength (default: 25)
Best Use Cases
✅ Pairs Trading: Identify divergences in momentum between correlated assets
✅ Crypto Market Analysis: Compare altcoin momentum against Bitcoin or Ethereum
✅ Stock Market Rotation: Track sector or index relative strength
✅ Forex Strength Analysis: Monitor currency pair momentum relationships
✅ Multi-Timeframe Confirmation: Use alongside other indicators for confluence
✅ Mean Reversion Strategies: Spot extreme momentum divergences for potential reversals
Visual Indicators
⚡ Cyan Line: Your chart symbol's momentum
⚡ Magenta Line: Comparison symbol's momentum
📊 Green/Pink Histogram: Momentum difference (positive = green, negative = pink)
▲ Green Triangle: Bullish trend detected (when filter enabled)
▼ Red Triangle: Bearish trend detected (when filter enabled)
◈ Yellow Diamond: Neutral/sideways trend (when filter enabled)
Pro Tips
💡 Look for crossovers between the momentum lines as potential trade signals
💡 Combine with volume analysis for stronger confirmation
💡 Use momentum divergence (price making new highs/lows while momentum doesn't) for reversal signals
💡 Enable trend filter during ranging markets to reduce false signals
💡 Experiment with different momentum types to find what works best for your trading style
Technical Requirements
TradingView Pine Script Version: v6
Chart Type: Works on all chart types
Indicator Placement: Separate pane (overlay=false)
Data Requirements: Needs access to comparison symbol data

Illuminati Zone🟣 Illuminati Zone — Hidden Power of the 11 PM NZ Candle
The Illuminati Zone reveals the hidden footprints of liquidity and market imbalance formed by the 11 PM New Zealand 15-minute candle — a time when global liquidity transitions between major sessions.
This candle often defines key intraday supply and demand boundaries, serving as a magnet for price and a pivot point for high-probability reversals or breakouts.
🧠 How it works
Automatically detects and marks the 11 PM NZ 15-minute candle each day.
Draws a translucent zone box between its high and low.
Extends two reference lines at +1 × range and –1 × range above and below the zone — ideal for spotting overextensions or liquidity sweeps.
Supports custom lookback, colors, and visual options.
💡 How to use it
Watch how price interacts with the zone — rejection often signals smart-money activity.
Use +1 and –1 levels as overextended zones for potential reversals or breakout retests.
Combine with your own confluence tools or volume analysis for precision entries.
⚙️ Customization Options
Target hour (NZ time)
Days back to display
Zone and line colors
Transparency and visual preferences
🔮 Pro Tip: Pair it with a volume or imbalance indicator for surgical-level precision in identifying where smart money positions are built or released.

Supertrend + MACD + EMA200 (Pro) V2 — Strict & TrailingThis strategy uses Supertrend, MACD and EMA 200 as indicators. When all three indicators shows the sema direction, you enter the trade.

Bull Market Support Band Alert (20W SMA & 21W EMA) - Multi-Alert═══════════════════════════════════════════════════════════════════
🎯 WHAT THIS INDICATOR DOES:
═══════════════════════════════════════════════════════════════════
This indicator monitors the Bull Market Support Band (BMSB) - a popular trend-following system that uses the 20-week Simple Moving Average (SMA) and 21-week Exponential Moving Average (EMA) to identify major market trends. It alerts you when price crosses either moving average on any stock in your watchlist.
═══════════════════════════════════════════════════════════════════
📈 THE BULL MARKET SUPPORT BAND STRATEGY:
═══════════════════════════════════════════════════════════════════
- ABOVE both MAs = Bullish trend (consider holding/buying)
- BELOW both MAs = Bearish trend (consider caution/selling)
- CROSSING ABOVE = Potential trend change to bullish
- CROSSING BELOW = Potential trend change to bearish
Originally popularized by cryptocurrency analysts, the BMSB has proven effective across all markets for identifying major trend changes.
═══════════════════════════════════════════════════════════════════
⚡ KEY FEATURES:
═══════════════════════════════════════════════════════════════════
✅ Single alert monitors your ENTIRE watchlist
✅ Works on ANY timeframe (daily, 4H, 1H) while maintaining weekly MA accuracy
✅ Visual signals when crosses occur (green/red arrows)
✅ Real-time status table showing current values
✅ Background coloring for quick trend identification
✅ Customizable alert settings for crosses above/below
═══════════════════════════════════════════════════════════════════
🔔 HOW TO SET UP ALERTS:
═══════════════════════════════════════════════════════════════════
1. Add this indicator to your chart
2. Click Alert (alarm icon)
3. Select "BMSB Watchlist Alert" → "BMSB Cross Alert"
4. Choose your alert frequency:
• "Once Per Bar" = Immediate alerts (for active traders)
• "Once Per Bar Close" = Confirmed signals (fewer false alarms)
5. CHECK "Apply to all symbols in watchlist" ← IMPORTANT!
6. Select your watchlist and create
═══════════════════════════════════════════════════════════════════
⚙️ RECOMMENDED SETTINGS:
═══════════════════════════════════════════════════════════════════
📍 FOR SWING TRADERS:
- Chart: Daily timeframe
- Alert Trigger: Once Per Bar Close
- Both crosses enabled
📍 FOR ACTIVE TRADERS:
- Chart: 4H or Daily timeframe
- Alert Trigger: Once Per Bar
- Both crosses enabled
📍 FOR LONG-TERM INVESTORS:
- Chart: Weekly timeframe
- Alert Trigger: Once Per Bar Close
- Focus on crosses above
═══════════════════════════════════════════════════════════════════
📊 VISUAL ELEMENTS:
═══════════════════════════════════════════════════════════════════
- BLUE LINE = 20-week Simple Moving Average
- RED LINE = 21-week Exponential Moving Average
- GREEN ARROWS = Price crossed above BMSB
- RED ARROWS = Price crossed below BMSB
- GREEN BACKGROUND = Price above both MAs (bullish)
- RED BACKGROUND = Price below both MAs (bearish)
- STATUS TABLE = Current price position and MA values
═══════════════════════════════════════════════════════════════════
💡 PRO TIPS:
═══════════════════════════════════════════════════════════════════
1. The indicator calculates WEEKLY MAs regardless of your chart timeframe
2. Best used with liquid stocks/cryptos with good volume
3. Consider waiting for daily/weekly close for confirmation
4. Crosses are more significant after extended periods above/below
5. Works great with additional confirmation (volume, RSI, etc.)
═══════════════════════════════════════════════════════════════════
⚠️ IMPORTANT NOTES:
═══════════════════════════════════════════════════════════════════
- FREE accounts limited to 1 active alert
- Alerts check based on YOUR selected timeframe, not the weekly MA calculation
- False signals possible during ranging/choppy markets
- Not financial advice - use as one tool among many
═══════════════════════════════════════════════════════════════════
👨💻 AUTHOR'S NOTE:
═══════════════════════════════════════════════════════════════════
Built for traders who want to monitor multiple stocks efficiently without creating dozens of individual alerts. Perfect for identifying major trend changes across your entire portfolio with a single alert.
Tags: #BMSB #BullMarketSupportBand #20WeekSMA #21WeekEMA #TrendFollowing #MovingAverage #WatchlistAlert #MultiTimeframe #SwingTrading #TrendTrading

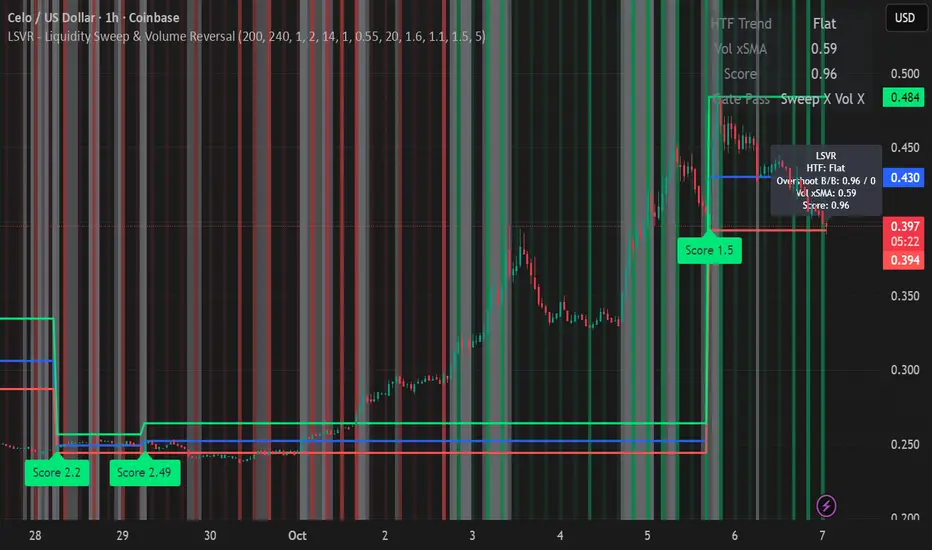
LSVR - Liquidity Sweep & Volume ReversalLSVR condenses a pro workflow into one visual overlay: Higher-Timeframe (HTF) Trend → Liquidity Sweep & Reclaim → Volume Confirmation. A signal only prints when all three gates align at bar close, and the chart shows everything you need—trend context, the sweep “trap” candle, and a projected Entry/SL/TP based on your chosen R multiple.
How it works
HTF Trend Filter: Projects a smoothed KAMA/EMA from a higher timeframe to the chart using a safe, lookahead-off request. Long signals are considered only above the HTF line; shorts only below.
Liquidity Sweep & Reclaim: Finds confirmed swing highs/lows, then detects an ATR-scaled overshoot through that swing followed by a reclaim (close back inside a configurable % of the bar range).
Volume Confirmation: Requires either a volume spike over Volume SMA × multiplier or optional OBV divergence. No participation = no signal.
Score: Each setup is scored: trend (0/1) + overshoot strength (0..1.5) + conviction (0/1). Signals fire only when the score ≥ Min Signal Score.
What you see
HTF Ribbon (subtle green/red backdrop) for bias.
Sweep Box on the signal candle (green = long, red = short).
Signal markers (“L” / “S”) with a small score label.
Projected lines that persist until the next signal: Entry (close), Stop (beyond swept swing), Target (R multiple).
Heatmap that intensifies when the score crosses your threshold.
Dashboard (top-right): HTF direction, Volume×SMA, current Score, gate pass status.
Tooltip on the last bar with quick stats.
Quick start
Apply to any liquid symbol and set HTF to ~3–6× your chart timeframe (e.g., 15m chart → 1H–4H).
Trade with the HTF trend: take L signals above the HTF line and S signals below it.
Entry = signal bar close, SL = beyond the swept swing, TP = your Projected Take-Profit (R).
Tighten or loosen selectivity with Min Signal Score, Reclaim %, Overshoot (ATR×), and Cooldown.
Recommended presets
Choppy/crypto 15m: minScore 1.25, reclaimPct 0.60–0.65, overshootATR 1.0–1.2, useOBVDiv=false, cooldown 8.
FX 5m / session trend: minScore 1.0–1.1, reclaimPct 0.50–0.55, overshootATR 0.8–1.0, useOBVDiv=true, cooldown 5.
Indices 1m (RTH): minScore 1.2, reclaimPct 0.55–0.60, useOBVDiv=false, cooldown 10.
Non-repainting by design
HTF values use lookahead_off with realtime offset.
Swings are confirmed pivots (no “forming” pivots).
Signals print at bar close only.
Notes
OBV divergence can add sensitivity on liquid markets; keep it off for stricter filtering.
Use Cooldown to avoid clustered sweeps.
This is an overlay/analysis tool, not financial advice. Test settings in Replay/Paper Trading before using live.
LA - EMA Bands with MTF DashboardDetailed Explanation of the LA - EMA Bands with MTF Dashboard Indicator
This custom Pine Script v6 indicator, designed for Trading View, overlays EMA-based price channels on the chart while incorporating a multi-timeframe (MTF) dashboard for broader market context. It focuses on visualizing trend direction and momentum through three sets of EMA bands, each representing different time horizons, and extends this with a tabular dashboard that summarizes signals across user-selected timeframes. The bands help identify support, resistance, and trend shifts, while the dashboard provides at-a-glance alignment across multiple periods, aiding in confirming trades or spotting divergences. Unlike volatility-based channels (e.g., Bollinger or Keltner), it relies solely on EMAs for simplicity and lag-reduced responsiveness.
Inputs Section
The script begins with user-configurable options grouped for ease. A timeframe input allows specifying a resolution for the EMA bands' data fetching, defaulting to the chart's timeframe if left empty—this enables higher-timeframe overlays on lower charts for context.
Next, a shared source input defines the price data for all midlines, defaulting to the midpoint of high and low (hl2) but customizable to close, open, or others.
The EMA bands have dedicated toggles and length inputs for each of the three sets: the first (long-term) defaults to 144 periods, the second (medium-term) to 72, and the third (short-term) to 12. These are inlined for compact settings panels, with minimum lengths of 1 to prevent errors.
A boolean toggle controls the visibility of the MTF dashboard. Following this are nine pairs of inputs for dashboard timeframes: each pair includes a show/hide toggle and an editable timeframe string (e.g., '1' for 1-minute, 'D' for daily). Defaults progress from short (1, 3, 5 minutes) to longer (15, 30, 60 minutes, daily, weekly, monthly), grouped in inlines for organization. Only enabled and non-empty timeframes appear in the dashboard.
Helpers Section
Two utility functions are defined here. The first computes an EMA on any source series over a specified length using Trading View's built-in function, reused throughout for midlines and bands.
The second function generates a signal string ("B" for buy/bullish, "S" for sell/bearish, or "-" for neutral) based on the direction of an EMA applied to high prices. It compares the current EMA value to the previous one, mirroring the band fill logic for consistency in the dashboard.
Core Components per Band Set:
Midline: An EMA calculated on a user-selectable source price (default: hl2, which is the midpoint between high and low prices). This acts as the central trend line.
Upper Band: An EMA applied directly to the high prices of each bar.
Lower Band: An EMA applied to the low prices of each bar.
These form a channel that captures the smoothed range of price action, highlighting potential support (lower band), resistance (upper band), and overall trend direction (midline).
Multiple Band Sets: The indicator includes three independent EMA band sets, each with its own length parameter for customization:
EMA1 (default length: 144) – Focuses on long-term trends.
EMA2 (default length: 72) – Targets medium-term trends.
EMA3 (default length: 12) – Emphasizes short-term momentum.
Each set can be toggled on or off via input checkboxes, allowing users to reduce chart clutter if needed.
Visual Elements:
Midline Plot: Displayed as a line colored based on its direction compared to the previous bar: green for rising (bullish), red for falling (bearish), and black for neutral (flat).
Band Fill: The area between the upper and lower bands is filled with a semi-transparent color indicating the trend of the upper band: light green for rising (suggesting expanding highs/upward momentum) and light pink for falling (contracting highs/downward pressure). The bands themselves are plotted in blue with a thin linewidth.
Multi-Timeframe Support: Users can input a custom timeframe (e.g., 'D' for daily), and the indicator fetches data from that resolution. This enables higher-timeframe context on lower-timeframe charts, such as viewing daily EMA bands on a 1-hour chart.
Calculation Mechanics:
All EMAs are computed using Trading View's built-in ta.ema() function.
Data is retrieved in a single request.security() call for efficiency, with lookahead enabled to avoid repainting.
No multipliers or volatility adjustments are included, making it a simple EMA-based envelope rather than a true volatility channel.
In practice, this indicator helps traders identify trend strength, potential breakouts (price crossing bands), or mean-reversion opportunities (price bouncing within bands). It's particularly useful for swing or position trading where multi-period alignment (e.g., all midlines green) signals conviction.
Pros
Multi-Period Insight: By combining short (12), medium (72), and long (144) periods, it offers a layered view of trends across time horizons, helping confirm alignments or divergences without needing multiple separate indicators.
Visual Clarity: Color-coded trends and fills make it easy to spot bullish/bearish shifts at a glance, reducing analysis time.
Flexibility: Custom timeframe input allows for multi-timeframe analysis, while shared source and toggles provide user control.
Simplicity and Efficiency: Purely EMA-based, it's computationally light and avoids overcomplication, making it accessible for beginners while still useful for spotting channel-based setups like squeezes or expansions.
No Repainting: With lookahead, plots are stable once bars close.
Cons
Lagging Nature: EMAs inherently lag price action, especially longer ones like 144-period, which may cause delayed signals in fast-moving or ranging markets.
Lack of Volatility Adjustment: Unlike Keltner Channels or Bollinger Bands, it doesn't incorporate ATR or standard deviation, so bands may not accurately reflect true volatility—potentially leading to false breakouts in high-volatility environments.
Chart Clutter: Displaying all three band sets simultaneously can overcrowd the chart, particularly on lower timeframes or volatile assets.
Subjective Interpretation: Color changes and band interactions require trader discretion; there's no built-in alerting or quantitative signals, which might lead to inconsistent results.
Market Dependency: Defaults may not suit all assets (e.g., stocks vs. crypto); shorter periods like 12 could whipsaw in noisy markets, while 144 might be too slow for intraday trading.
Justification for Default Values (12, 72, and 144)
The default lengths of 12, 72, and 144 are not arbitrary but draw from established trading principles, particularly W.D. Gann's geometric and numerical theories, as well as Fibonacci sequences, to create a harmonic progression for short-, medium-, and long-term analysis. Here's the rationale:
12 (Short-Term): This is a common period for capturing recent momentum in technical indicators, often seen in setups like the MACD (which uses 12- and 26-day EMAs). It aligns with natural cycles, such as the 12 months in a year, and in Gann theory, 12 serves as a base unit for squaring price and time (e.g., in the "Square of 12" where multiples like 12, 24, etc., measure cycles in days, weeks, or months). At 12 periods, the EMA reacts quickly to price changes without excessive noise, making it ideal for short-term trend detection.
72 (Medium-Term): This acts as an intermediate bridge, derived from Gann's divisions of the 360-degree circle (a key Gann concept representing a full cycle). Specifically, 72 is 360/5 (relating to pentagonal geometry and natural harmonics) and appears in Gann's time cycle measurements (e.g., as a multiple in the Square of 12: 12×6=72). It's roughly half of 144, providing a balanced midpoint for medium-term trends without overlapping too closely with the others. In practice, 72 periods smooth out short-term fluctuations while still responding to developing trends.
144 (Long-Term): This is a powerhouse number in trading lore, being both 12 squared (12×12=144, central to Gann's "Square of 144" for monthly charts and major cycle turns, as there are 12 months in a year) and a Fibonacci sequence value (1, 1, 2, 3, 5, 8, 13, 21, 34, 55, 89, 144...). Fibonacci periods are popular in moving averages for their alignment with natural growth patterns in markets, and 144 is often used for long-term regime definition (e.g., confirming trends over 144 bars). It helps identify major support/resistance in extended cycles.
Overall, these values form a geometric/harmonic series (12, 72=12×6, 144=12×12), promoting alignment with market cycles as per Gann and Fibonacci principles, rather than generic lengths like 50 or 200. They can be adjusted based on the asset or timeframe, but the defaults provide a starting point rooted in time-tested trading numerology for balanced multi-period analysis.
Please use this along with other indicators (eg. Pivot, MACD, etc) for better results.

MTF RSI Heatmap)# MTF RSI Heatmap — v2.7.2
**Hybrid Higher-TF Trend + Intraday Impulse Detection + Smart Counters & Alerts**
Turn your lower pane into a **multi-timeframe market bias dashboard**. This heatmap blends classic RSI momentum with a **hybrid Daily/Weekly MA-stack trend** and an **intraday impulse override** that flags fast moves *as they happen*. Clean, configurable, and built for real trading flow.
---
## What it shows
* **6 stacked rows = 6 timeframes** (bottom → top).
* **Colors**: Green = Bull, Red = Bear, Yellow = Neutral.
* **Header counter**: `Bull X/6 | Bear Y/6` = live agreement across visible rows.
* **Impulse markers** ▲/▼ on intraday rows (5m/15m/60m/240m) when a shock move triggers.
* **Signal bar**: A thin column above the top row when at least **N of 6** rows align (configurable).
---
## Why it’s different
* **Impulse Override (intraday)**
Detects sharp moves using % change over the last *N* bars, optionally gated by **volume > SMA × multiplier**. This catches dumps/pops earlier than RSI alone.
* **Hybrid D/W (structure over noise)**
Daily/Weekly rows can use an **MA stack (8/21/55)** instead of RSI for a more stable higher-timeframe trend read. Optional **price > fast MA** filter for stricter confirmation.
* **Intrabar option**
Flip rows **during the bar** for early reads (accepting repaint on TF close), or keep it close-only for no surprises.
---
## Key features
* 🌈 **Theme**: Classic or High-Contrast colors.
* 🧠 **RSI thresholds**: Bull above 55, Bear below 45 (editable).
* 🧲 **RSI smoothing** (EMA) for intraday rows to reduce flicker.
* 🧰 **Compact left legend** with adjustable text size & opacity.
* 🚨 **Alerts**:
* **Impulse-only** (per TF and “any intraday”)
* **N-of-6 confirmation** (bull/bear)
---
## Recommended settings (fast opens & news)
* **Impulse**: `Bars = 1–2`, `Threshold = 0.25–0.35%`, `Vol confirm = ON`, `Multiplier = 1.3–1.5`.
* **Hybrid D/W**: `ON`, `EMA 8/21/55`, `Price filter = ON`.
* **Intrabar**: `ON` if you want intra-bar updates (repaints at TF close).
---
## How to read it
1. **Row scan**: Are the bottom (fast) rows aligning first? That’s early momentum.
2. **Header counter**: Look for 4+/6 agreement as momentum broadens.
3. **Signal bar**: Acts as a “go/no-go” confirmation when your threshold is met.
4. **Impulse ▲/▼**: Use as a **heads-up** for acceleration; then watch if rows cascade in that direction.
---
## Alerts (exact names)
Create alerts with these built-ins:
* **Impulse UP — any intraday**
* **Impulse DOWN — any intraday**
* **Impulse UP — TF1 / TF2 / TF3 / TF4**
* **Impulse DOWN — TF1 / TF2 / TF3 / TF4**
* **Bull confirmation** (N-of-6)
* **Bear confirmation** (N-of-6)
Tip: Use **Once per bar** or **Once per bar close** depending on whether you enabled *Intrabar*.
---
## Inputs overview
* **Timeframes & visibility** per row.
* **RSI**: length, bull/bear thresholds, optional EMA smoothing (intraday only).
* **Impulse**: bars, %, volume confirm, SMA length, multiplier, markers.
* **Hybrid D/W**: MA type (EMA/SMA/HMA), 8/21/55 lengths, price filter.
* **Theme & Legend**: color theme, label size (Tiny/Small/Normal), legend opacity.
* **Signal**: N required for confirmation (default 4).
---
## Pro tips
* Combine with **session opens**, **VWAP**, and **liquidity levels**.
* If you trade breakouts, let **impulse triggers** cue attention, then wait for **N-of-6** confirmation.
* For swing bias, lean on **Hybrid D/W**—it changes slower, but with intent.
---
## Notes & limitations
* **Intrabar = repaint expected** on higher-TF closes—by design for earlier context.
* Colors/thresholds are general guidance, not signals by themselves.
* Past performance ≠ future results; **this is not financial advice**.
---
If you enjoy this, drop a ⭐ and tell me what you want next: background shading on confirmation, tooltips with RSI/ROC per row, or a MACD/RSI hybrid mode. Trade sharp! ✨

SMA Pro (Tick)Simple moving average based on 100 ticks, by default. Use for high volume markets like ES, NQ, and RTY.


Portfolio Simulator & BacktesterMulti-asset portfolio simulator with different metrics and ratios, DCA modeling, and rebalancing strategies.
Core Features
Portfolio Construction
Up to 5 assets with customizable weights (must total 100%)
Support for any tradable symbol: stocks, ETFs, crypto, indices, commodities
Real-time validation of allocations
Dollar Cost Averaging
Monthly or Quarterly contributions
Applies to both portfolio and benchmark for fair comparison
Model real-world investing behavior
Rebalancing
Four strategies: None, Monthly, Quarterly, Yearly
Automatic rebalancing to target weights
Transaction cost modeling (customizable fee %)
Key Metrics Table
CAGR: Annualized compound return (S&P 500 avg: ~10%)
Alpha: Excess return vs. benchmark (positive = outperformance)
Sharpe Ratio: Return per unit of risk (>1.0 is good, >2.0 excellent)
Sortino Ratio: Like Sharpe but only penalizes downside (better metric)
Calmar Ratio: CAGR / Max Drawdown (>1.0 good, >2.0 excellent)
Max Drawdown: Largest peak-to-trough decline
Win Rate: % of positive days (doesn't indicate profitability)
Visualization
Dual-chart comparison - Portfolio vs. Benchmark
Dollar or percentage view toggle
Customizable colors and line width
Two tables: Statistics + Asset Allocation
Adjustable table position and text size
🚀 Quick Start Guide
Enter 1-5 ticker symbols (e.g., SPY, QQQ, TLT, GLD, BTCUSD)
Make sure percentage weights total 100%
Choose date range (ensure chart shows full period - zoom out!)
Configure DCA and rebalancing (optional)
Select benchmark (default: SPX)
Analyze results in statistics table
💡 Pro Tips
Chart data matters: Load SPY or your longest-history asset as main chart
If you select an asset that was not available for the selected period, the chart will not show up! E.g. BTCUSD data: Only available from ~2017 onwards.
Transaction fees: 0.1% default (adjust to match your broker)
⚠️ Important Notes
Requires visible chart data (zoom out to show full date range)
Limited by each asset's historical data availability
Transaction fees and costs are modeled, but taxes/slippage are not
Past performance ≠ future results
Use for research and education only, not financial advice
Let me know if you have any suggestions to improve this simulator.

Market Mode Risk IndicatorMarket Mode Risk Indicator v1.1
This custom indicator helps traders gauge market risk sentiment by monitoring Exponential Moving Average (EMA) or Simple Moving Average (SMA) crossovers on key indices like BIST 100 (for Turkish markets), NASDAQ Composite (tech-focused US), or Dow Jones Industrial Average (industrial US). It dynamically categorizes the market into three actionable modes based on the index's position relative to layered MAs, providing a quick visual snapshot without cluttering your chart.
Risk Modes Explained:
RISK OFF (Red): Index closes below the Long MA (default 50 periods) – signals bearish caution; time to tighten stops or reduce exposure.
RISK TEST (Orange): Index above Medium MA1 (21 periods) and Extra Long MA (55 periods), but below Short MA (10 periods) and above Long MA – a transitional "test" phase; watch for confirmation before entering.
RISK ON (Green): Index above all MAs (Short, Medium, Long, Extra Long) – bullish green light; favorable for longs or momentum plays.
How It Works:
The core logic uses boolean checks on the index's close price against user-defined MA lengths. For example:
It pulls live data from your selected index via request.security.
Computes MAs with ternary operators for EMA (ta.ema) or SMA (ta.sma) based on your choice.
Mode detection relies on AND/OR conditions (e.g., aboveShort and aboveMed1 and aboveLong and aboveExtraLong for RISK ON) to filter noise and focus on meaningful shifts.
No lookahead bias – all calculations are historical and real-time compatible. Defaults (10/21/50/55) are inspired by common Fibonacci-inspired periods for balanced sensitivity.
Alerts fire only on mode transitions (e.g., from RISK OFF to ON) to prevent spam, using alertcondition with dynamic messages including price and ticker.
Customization Options:
Index & MA Settings: Switch EMA/SMA; tweak lengths (min 1 period) for your timeframe (e.g., shorter for intraday).
Display: Position the table (top/bottom, left/right); toggle MA values on/off.
Looks: Background/border/text colors, transparency (0-100%) for theme matching.
Built in Pine Script v5 for efficiency – lightweight, no repaints.
Usage Tips:
Add to any stock chart (e.g., GARAN for BIST analysis).
Select your index in settings; refresh chart if switching MA type.
Use on daily/4H timeframes for swing trading; alerts via email/SMS for hands-free monitoring.
Pro Tip: Combine with volume or RSI for confirmation – RISK ON + rising volume = stronger buy signal.
