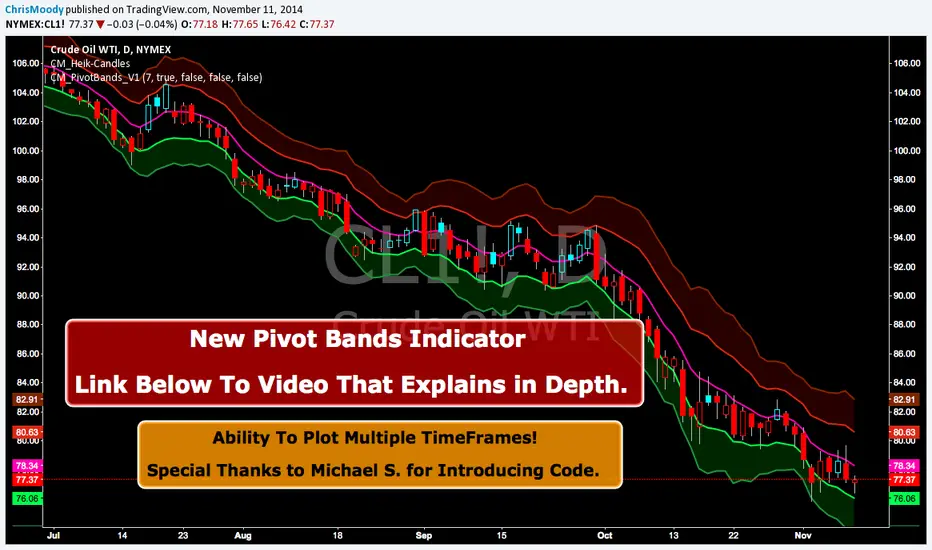
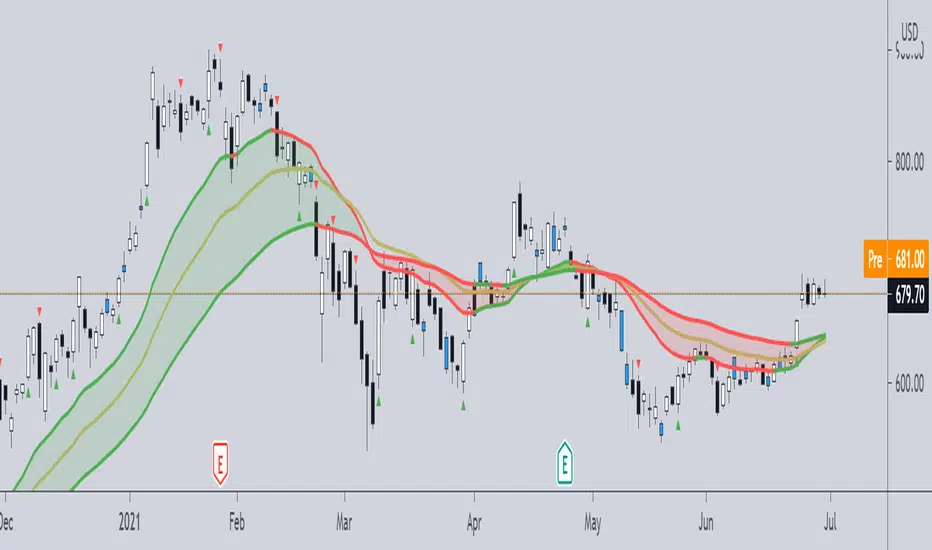
CM Pivot Bands V1CM_Pivot Bands V1
Special Thanks to Michael S for Introducing Code.
Instead of a Long Write Up I Recorded A Video Going Into Detail On V1 Of This Indicator. Please View To See My Initial Findings, My Thoughts For V2, And Items I Need YOUR Help With!!!
In Inputs Tab Indicator Has Ability to Turn On/Off Multiple TimeFrames…Thought Process Explained In Video.
Link To Video:
vimeopro.com
Link To PDF Mentioned In Video:
d.pr
In den Scripts nach "pivot" suchen
Pivot Points + Day First Candle Breakout + VWAP + Supertrend This indicator amalgamates several key indicators to provide a comprehensive analysis for trading decisions, including SuperTrend, Pivot Points, VWAP, along with the Day First Candle Breakout strategy.
Key Features:
Day First Candle Breakout: Identifies potential breakout opportunities based on the first candle of the trading day. It utilizes the high and low of the initial trading range to determine entry points.
Timeframe Selection: Allows users to select the timeframe for analyzing the first candle (e.g., 5, 15, or 60 minutes).
Previous Day and Week High/Low: Displays the high and low of the previous day and week to provide additional context for trading decisions and assess the strength of the trend.
Trend Strength Analysis: Indicates whether the current price is above or below the previous day's high or low, signaling a stronger bullish or bearish trend respectively.
SuperTrend Indicator: Visualizes the trend direction and potential reversal points based on the SuperTrend indicator. It helps traders to stay aligned with the prevailing trend and avoid premature exits.
Pivot Points: Presents key support and resistance levels derived from Pivot Points, assisting traders in identifying potential reversal or breakout zones.
VWAP (Volume Weighted Average Price): Plots VWAP to provide insight into the average price traded over a given period, aiding in determining the fair value of the asset and potential buying/selling zones.
Trading Signals:
Buy Signal: Triggered when the price exceeds the high of the initial trading range after an upward price gap.
Sell Signal: Generated when the price falls below the low of the initial trading range after a downward price gap.
Caveats for Effective Trading:
Extended Trading Ranges: Adjusts support and resistance levels if the initial trading range extends beyond the defined timeframe.
Morning Noise Consideration: Exercises caution during volatile morning sessions to avoid false breakouts and whipsaws.
Pullbacks and Narrow Range Bars: Looks for opportunities during pullbacks or when the price forms narrow range bars to enter trades, reducing the risk of sudden reversals.

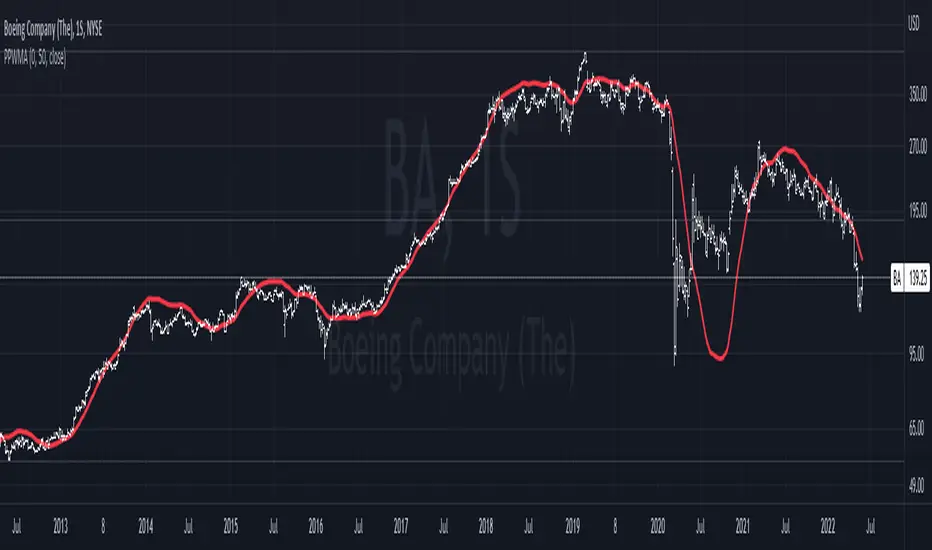
Pivot-Point Weighted Moving AverageThe Pivot-Point Weighted MA is very different from other weighted MAs, in the sense that the price weights can achieve negative values. For an example, if a length of 21 is used, the pivot point will be calculated as 13, meaning that the 13th prior candle will have 0 weight, and all prices before it will have a negative weight on the sum, so their impact is reversed rather than just unweighted.
The intent of this is to reduce lag by front-loading the prices. It works better in cyclic markets, and with a longer length, where the inflection point (the one with 0 weight) is aligned with the cyclic turn.
You can configure where the weight starts. If you leave it as 0, it will start with floor(length * 0.66) - 1.
PIVOT AND ICHIMOKU BACKGROUND BY PRANOJIT DEYIt shows pivot bias in relation to day open line and it also shows ichimoku bullish trend background. good for option buyers to understand market bias.

Pivot Fib 4H — EAStrategy uses the pivot standard to open position, it has well define entry and exit point with SL, it also has a proper money management plan, maximum 4 trades a day, each trade risk 0.5% of the account, I have it EA version of it also.

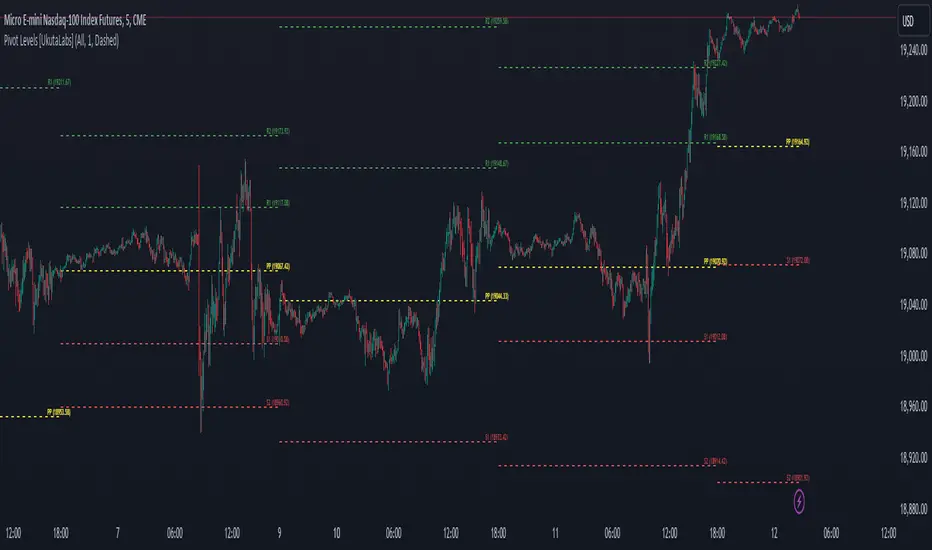
Pivot Levels [UkutaLabs]█ OVERVIEW
The Pivot Levels Indicator provides real-time insight into key price levels within the market that can serve as powerful support and resistance levels. These levels are based on currently-relevant price-action information to ensure that the lines being drawn provide the most value to traders regardless of their trading style.
The aim of this script is to simplify the trading experience of users by automatically identifying and displaying price levels that they should be aware of.
█ USAGE
At the beginning of each trading day, the script will identify the previous day’s hlc3 level. We refer to this level as the day’s Source Level, and it is from this price that the other Resistance and Support levels are calculated.
The script then identifies the total price range of the previous day (Previous Day High - Previous Day Low), then draws Resistance and Support lines based on the Source Level and the previous day’s range.
The script identifies these levels on both sides of the Source. Levels above the Source are considered to be points of Resistance and below the Source are considered to be Support, but the levels are free to be interpreted and used in whatever way fits the user’s trading strategy.
A label is drawn at the end of each line that identifies the line and whether it represents support or resistance. These labels can be disabled in the settings.
█ SETTINGS
Configuration
• Show Labels: Determines whether or not labels are displayed at the end of each line.
• Display Mode: Determines the number of days for the script to load.
Line Settings
• Resistance Color: Determines the color of the resistance lines and labels above the Source Level.
• Source Color: Determines the color of the source line and label.
• Support Color: Determines the color of the support lines and labels below the Source Level.
• Line width: Determines the width of lines.
• Line Style: Determines the style of lines.
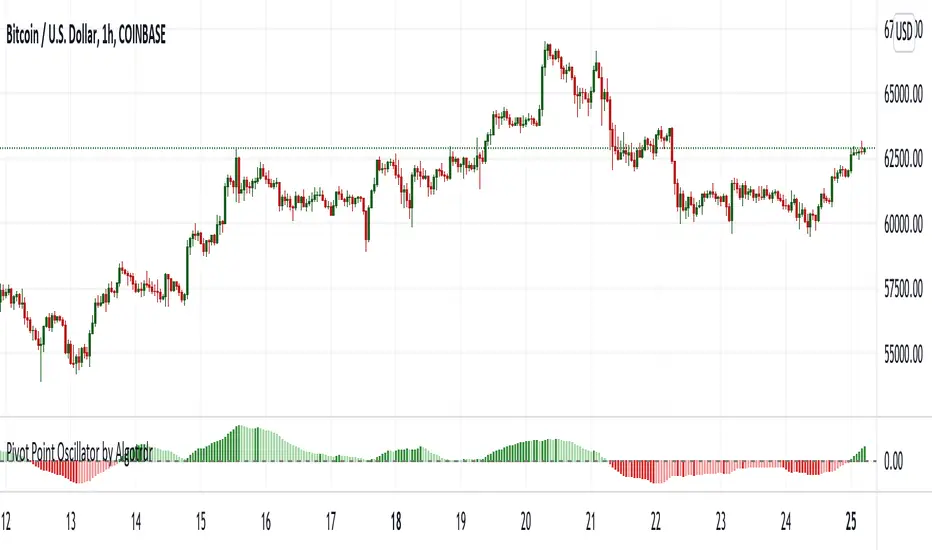
Pivot Point Oscillator by AlgotrdrThis script tracks moments where price closes over s/r levels on 3 sets of pivot points and turns it into an oscillator to help users analyze price movements at a glance. Enjoy!
Pivot TrackerThis script finds swing lows and swing highs based on input criteria for lookback and lookforward periods, and plots letters accordingly.
Helps identify trend or lacktherof
HH = higher high
LH = lower high
HL = higher low
LL = lower low

Pivot Boss -- Squat bars and Non Squat Bars 2.0Squat Bar Signal -- current Volume is greater than previous volume but Current bar MFI(Market Facilitation index) is lesser than previous bar MFI
Other Conditions -- Current Bars Range is lesser than (Average Range * Range Multiplier)
Non Squat Bar Buy Signal(Green Up Triangle) -- Volume and MFI is greater than previous bar, Close greater than open, Close is greater than midpoint
Non Squat Bar Sell Signal(Red Down Triangle) -- Volume and MFI is greater than previous bar, Close lesser than open, Close is lesser than midpoint
Usually Squat signal is confirmed by Non Squat Bar Signal..
Other indicator used -- PEMA -- Pivot based EMA
For Better results use it along with Advanced Volume indicator and PEMA
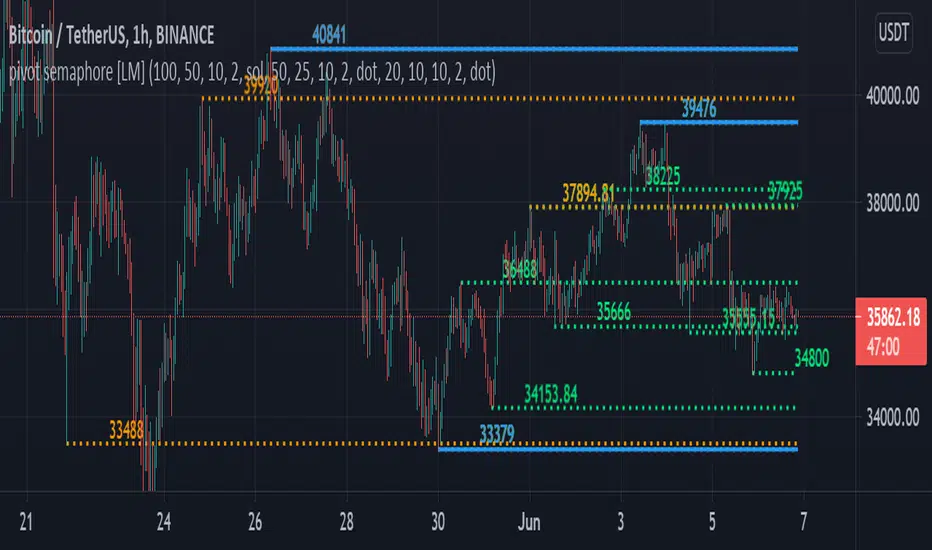
pivot semaphore support&resistance levels [LM]Hello Traders,
I would like to introduce you pivot semaphore support&resistance levels. The idea is the same as the zigzag script of mine to spot the importance of support&resistence
The Semafor is used to spot future multi-level Supports and Resistance zones.
It is also useful to spot HL or LL or HH or LH zones at different Depth settings.
The red zones are the extreme places where the market has a higher chance of reversing while the green zones have the lowest setting with lower chances of the market reversal
The lines can be extended like so
The lines also can just stop extending when price will reach it
Enjoy!
Pivot Points [KrisWaters] vX by DGT (Russian version)A useful multitool script from the talented dgtrd with my translation into Russian. Full description from the author.
Полезный скрипт-мультитул от талантливого dgtrd с моим переводом на русский.
Полное описание у автора:

Pivot Points 17 - StandardDisclaimer!
-This indicator doesn't tell you the market condition (BUY or SELL)
Cons!
- Totally dependent on your knowledge
Pros!
- Projects the Key Levels of a single time frame on the chart
Usage!
- Watch out for rejections at these levels
- Identify breakouts at these levels with strong confirmation like RETEST (as Level Role Reversal)


Pivot Reversal Strategy - TimeFramedThis is Pivot Reversal Strategy including the time frames for backtesting.

PPMA - Pivot Point Moving Average by soruPivot Point Moving Average
check it out:) works nicely
In options you can set custom timeframe for indicator values
Cheers

Liquidity Retest Strategy (Apicode) - TP/SL Lines FixedTechnical Documentation:
1. Purpose and underlying concept
This strategy targets a common behavior in liquid markets: liquidity sweeps around meaningful support/resistance levels, followed by a retest and rejection (reversal) with confirmation.
The core thesis is that many initial “breaks” are not continuation moves, but rather stop-runs and order harvesting. After the sweep, price reclaims the level and closes back on the opposite side, offering a structured entry with defined risk.
The strategy includes:
Support/Resistance detection via pivots
Dynamic selection of the “working” level using an ATR-based proximity window
Rejection validation via candle structure (wick + close)
Optional filters: volume, VWAP-like bias, and EMA trend
Risk management with static TP/SL (ATR-based or %), plus trailing stop (ATR-based or %), with per-trade lines plotted
2. Main components
2.1. Volatility metric: ATR
atr = ta.atr(atrLength) is used in two essential places:
Level selection (proximity to S/R): prevents trading levels that are too far from current price.
Sweep validation (minimum wick size): requires the wick to extend beyond the level by a volatility-relative amount.
Optionally, ATR can also be used for:
Static TP/SL (when usePercent = false)
Trailing stop (when useTrailPercent = false)
2.2. Building S/R levels with pivots
Pivots are detected using:
pivotHigh = ta.pivothigh(pivotLookback, rightBars)
pivotLow = ta.pivotlow(pivotLookback, rightBars)
Each confirmed pivot is stored in arrays:
resistanceLevels for resistance
supportLevels for support
The array size is capped by maxLevels, which reduces noise and manages chart resource usage (lines).
2.3. Selecting the “best” level each bar
On each bar, a single support S and/or resistance R candidate is chosen:
Support: nearest level below price (L < price)
Resistance: nearest level above price (L > price)
Only levels within atr * maxDistATR are considered
This produces dynamic “working levels” that adapt to price location and volatility.
2.4. Rejection pattern (retest + sweep)
After selecting the working level:
Support rejection (long setup)
Conditions:
Low touches/crosses support: low <= S
Close reclaims above: close > S
Bullish candle: close > open
Sufficient wick below the level (liquidity sweep): (S - low) >= atr * minWickATR
This aims to capture a stop sweep below support followed by immediate recovery.
Resistance rejection (short setup)
Symmetric conditions:
High touches/crosses resistance: high >= R
Close rejects back below: close < R
Bearish candle: close < open
Sufficient wick above the level: (high - R) >= atr * minWickATR
2.5. Optional filters
Final signals are the rejection pattern AND enabled filters:
1.- Volume filter
High volume is defined as: volume > SMA(volume, 20) * volMult
When useVolFilter = true, setups require relatively elevated participation
2.- VWAP-like bias filter
A VWAP-like series is computed over vwapLength (typical price weighted by volume)
When useVWAPFilter = true:
- Longs only if close > vwap
- Shorts only if close < vwap
3.- EMA trend filter
Uptrend if EMA(fast) > EMA(slow)
When useTrendFilter = true:
- Longs only in uptrend
- Shorts only in downtrend
2.6. Backtest time window (time filter)
To keep testing focused and reduce long-history noise:
useMaxLookbackDays enables the filter
maxLookbackDays defines how many days back from timenow entries are allowed
Entries are permitted only when time >= startTime.
3. Entry rules and position control
3.1. Entries
strategy.entry('Long', strategy.long) when longSetup and no long position is open
strategy.entry('Short', strategy.short) when shortSetup and no short position is open
No pyramiding is allowed (pyramiding = 0). Position gating is handled by:
Long allowed if strategy.position_size <= 0
Short allowed if strategy.position_size >= 0
4. Risk management: TP/SL and trailing (with plotted lines)
4.1. Detecting entry/exit events
Events are identified via changes in strategy.position_size:
LongEntry: transition into a long
shortEntry: transition into a short
flatExit: transition back to flat
This drives per-trade line creation, updates, and cleanup of state variables.
4.2. Static TP/SL
On entry, entryPrice := strategy.position_avg_price is stored.
Percent mode (usePercent = true)
Long:
staticSL = entryPrice*(1 - slPerc/100)
staticTP = entryPrice*(1 + tpPerc/100)
Short:
staticSL = entryPrice*(1 + slPerc/100)
staticTP = entryPrice*(1 - tpPerc/100)
ATR mode (usePercent = false)
Long:
staticSL = entryPrice - atrAtEntry*slATR
staticTP = entryPrice + atrAtEntry*tpATR
Short:
staticSL = entryPrice + atrAtEntry*slATR
staticTP = entryPrice - atrAtEntry*tpATR
4.3. Trailing stop (custom)
While a position is open, the script tracks the most favorable excursion:
Long: hhSinceEntry = highest high since entry
Short: llSinceEntry = lowest low since entry
A trailing candidate is computed:
Percent trailing (useTrailPercent = true)
Long: trailCandidate = hhSinceEntry*(1 - trailPerc/100)
Short: trailCandidate = llSinceEntry*(1 + trailPerc/100)
ATR trailing (useTrailPercent = false)
Long: trailCandidate = hhSinceEntry - atr*trailATR
Short: trailCandidate = llSinceEntry + atr*trailATR
Then the effective stop is selected:
Long: slUsed = max(staticSL, trailCandidate) when useTrail is enabled
Short: slUsed = min(staticSL, trailCandidate) when useTrail is enabled
If useTrail is disabled, slUsed remains the static stop.
Take profit remains static:
tpUsed = staticTP
Exit orders are issued via:
strategy.exit(..., stop=slUsed, limit=tpUsed)
4.4. Per-trade TP/SL lines
On each entry, two lines are created (SL and TP) via f_createLines().
During the trade, the SL line updates when trailing moves the stop; TP remains fixed.
On exit (flatExit), both lines are finalized on the exit bar and left on the chart as historical references.
This makes it straightforward to visually audit each trade: entry context, intended TP, and trailing evolution until exit.
5. Visualization and debugging
BUY/SELL labels with configurable size (xsize)
Debug mode (showDebug) plots the chosen working support/resistance level each bar
Stored pivot levels are drawn using reusable line slots, projected a fixed 20 bars to the right to keep the chart readable and efficient
6. Parameter guidance and practical notes
pivotLookback / rightBars: controls pivot significance vs responsiveness. Lower rightBars confirms pivots earlier but can increase noise.
maxDistATR: too low may reject valid levels; too high may select distant, less relevant levels.
minWickATR: key quality gate for “real” sweeps. Higher values reduce frequency but often improve signal quality.
Filters:
Volume filter tends to help in ranges and active sessions.
VWAP bias is useful intraday to align trades with session positioning.
EMA trend filter is helpful in directional markets but may remove good mean-reversion setups.
Percent TP/SL: provides consistent behavior across assets with variable volatility, but is less adaptive to sudden regime shifts.
Percent trailing: can capture extensions well; calibrate trailPerc per asset/timeframe (too tight = premature exits).
7. Known limitations
Pivot-derived levels are a heuristic; in strong trends, valid retests may be limited.
The time filter uses timenow; behavior may vary depending on historical context and how the platform evaluates “current time.”
TP/SL and trailing are computed from bar OHLC; in live trading, intrabar sequencing and fills may differ from bar-close simulation.

GIGANEVA V6.61 PublicThis enhanced Fibonacci script for TradingView is a powerful, all-in-one tool that calculates Fibonacci Levels, Fans, Time Pivots, and Golden Pivots on both logarithmic and linear scales. Its ability to compute time pivots via fan intersections and Range interactions, combined with user-friendly features like Bool Fib Right, sets it apart. The script maximizes TradingView’s plotting capabilities, making it a unique and versatile tool for technical analysis across various markets.
1. Overview of the Script
The script appears to be a custom technical analysis tool built for TradingView, improving upon an existing script from TradingView’s Community Scripts. It calculates and plots:
Fibonacci Levels: Standard retracement levels (e.g., 0.236, 0.382, 0.5, 0.618, etc.) based on a user-defined price range.
Fibonacci Fans: Trendlines drawn from a high or low point, radiating at Fibonacci ratios to project potential support/resistance zones.
Time Pivots: Points in time where significant price action is expected, determined by the intersection of Fibonacci Fans or their interaction with key price levels.
Golden Pivots: Specific time pivots calculated when the 0.5 Fibonacci Fan (on a logarithmic or linear scale) intersects with its counterpart.
The script supports both logarithmic and linear price scales, ensuring versatility across different charting preferences. It also includes a feature to extend Fibonacci Fans to the right, regardless of whether the user selects the top or bottom of the range first.
2. Key Components Explained
a) Fibonacci Levels and Fans from Top and Bottom of the "Range"
Fibonacci Levels: These are horizontal lines plotted at standard Fibonacci retracement ratios (e.g., 0.236, 0.382, 0.5, 0.618, etc.) based on a user-defined price range (the "Range"). The Range is typically the distance between a significant high (top) and low (bottom) on the chart.
Example: If the high is $100 and the low is $50, the 0.618 retracement level would be at $80.90 ($50 + 0.618 × $50).
Fibonacci Fans: These are diagonal lines drawn from either the top or bottom of the Range, radiating at Fibonacci ratios (e.g., 0.382, 0.5, 0.618). They project potential dynamic support or resistance zones as price evolves over time.
From Top: Fans drawn downward from the high of the Range.
From Bottom: Fans drawn upward from the low of the Range.
Log and Linear Scale:
Logarithmic Scale: Adjusts price intervals to account for percentage changes, which is useful for assets with large price ranges (e.g., cryptocurrencies or stocks with exponential growth). Fibonacci calculations on a log scale ensure ratios are proportional to percentage moves.
Linear Scale: Uses absolute price differences, suitable for assets with smaller, more stable price ranges.
The script’s ability to plot on both scales makes it adaptable to different markets and user preferences.
b) Time Pivots
Time pivots are points in time where significant price action (e.g., reversals, breakouts) is anticipated. The script calculates these in two ways:
Fans Crossing Each Other:
When two Fibonacci Fans (e.g., one from the top and one from the bottom) intersect, their crossing point represents a potential time pivot. This is because the intersection indicates a convergence of dynamic support/resistance zones, increasing the likelihood of a price reaction.
Example: A 0.618 fan from the top crosses a 0.382 fan from the bottom at a specific bar on the chart, marking that bar as a time pivot.
Fans Crossing Top and Bottom of the Range:
A fan line (e.g., 0.5 fan from the bottom) may intersect the top or bottom price level of the Range at a specific time. This intersection highlights a moment where the fan’s projected support/resistance aligns with a key price level, signaling a potential pivot.
Example: The 0.618 fan from the bottom reaches the top of the Range ($100) at bar 50, marking bar 50 as a time pivot.
c) Golden Pivots
Definition: Golden pivots are a special type of time pivot calculated when the 0.5 Fibonacci Fan on one scale (logarithmic or linear) intersects with the 0.5 fan on the opposite scale (or vice versa).
Significance: The 0.5 level is the midpoint of the Fibonacci sequence and often acts as a critical balance point in price action. When fans at this level cross, it suggests a high-probability moment for a price reversal or significant move.
Example: If the 0.5 fan on a logarithmic scale (drawn from the bottom) crosses the 0.5 fan on a linear scale (drawn from the top) at bar 100, this intersection is labeled a "Golden Pivot" due to its confluence of key Fibonacci levels.
d) Bool Fib Right
This is a user-configurable setting (a boolean input in the script) that extends Fibonacci Fans to the right side of the chart.
Functionality: When enabled, the fans project forward in time, regardless of whether the user selected the top or bottom of the Range first. This ensures consistency in visualization, as the direction of the Range selection (top-to-bottom or bottom-to-top) does not affect the fan’s extension.
Use Case: Traders can use this to project future support/resistance zones without worrying about how they defined the Range, improving usability.
3. Why Is This Code Unique?
Original calculation of Log levels were taken from zekicanozkanli code. Thank you for giving me great Foundation, later modified and applied to Fib fans. The script’s uniqueness stems from its comprehensive integration of Fibonacci-based tools and its optimization for TradingView’s plotting capabilities. Here’s a detailed breakdown:
All-in-One Fibonacci Tool:
Most Fibonacci scripts on TradingView focus on either retracement levels, extensions, or fans.
This script combines:
Fibonacci Levels: Static horizontal lines for retracement and extension.
Fibonacci Fans: Dynamic trendlines for projecting support/resistance.
Time Pivots: Temporal analysis based on fan intersections and Range interactions.
Golden Pivots: Specialized pivots based on 0.5 fan confluences.
By integrating these functions, the script provides a holistic Fibonacci analysis tool, reducing the need for multiple scripts.
Log and Linear Scale Support:
Many Fibonacci tools are designed for linear scales only, which can distort projections for assets with exponential price movements. By supporting both logarithmic and linear scales, the script caters to a wider range of markets (e.g., stocks, forex, crypto) and user preferences.
Time Pivot Calculations:
Calculating time pivots based on fan intersections and Range interactions is a novel feature. Most TradingView scripts focus on price-based Fibonacci levels, not temporal analysis. This adds a predictive element, helping traders anticipate when significant price action might occur.
Golden Pivot Innovation:
The concept of "Golden Pivots" (0.5 fan intersections across scales) is a unique addition. It leverages the symmetry of the 0.5 level and the differences between log and linear scales to identify high-probability pivot points.
Maximized Plot Capabilities:
TradingView imposes limits on the number of plots (lines, labels, etc.) a script can render. This script is coded to fully utilize these limits, ensuring that all Fibonacci levels, fans, pivots, and labels are plotted without exceeding TradingView’s constraints.
This optimization likely involves efficient use of arrays, loops, and conditional plotting to manage resources while delivering a rich visual output.
User-Friendly Features:
The Bool Fib Right option simplifies fan projection, making the tool intuitive even for users who may not consistently select the Range in the same order.
The script’s flexibility in handling top/bottom Range selection enhances usability.
4. Potential Use Cases
Trend Analysis: Traders can use Fibonacci Fans to identify dynamic support/resistance zones in trending markets.
Reversal Trading: Time pivots and Golden Pivots help pinpoint moments for potential price reversals.
Range Trading: Fibonacci Levels provide key price zones for trading within a defined range.
Cross-Market Application: Log/linear scale support makes the script suitable for stocks, forex, commodities, and cryptocurrencies.
The original code was from zekicanozkanli . Thank you for giving me great Foundation.
