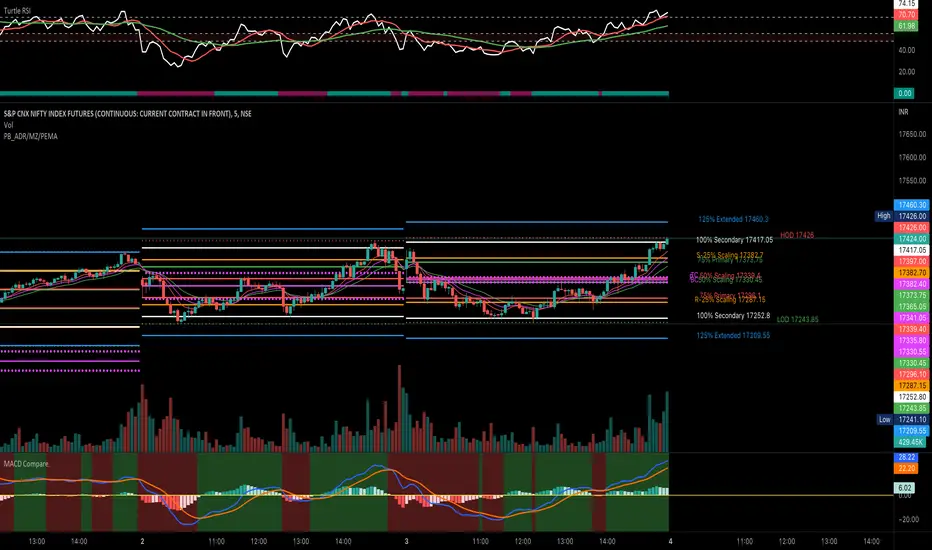
PivotBoss ADR LevelsBased on Pivot Boss ADR Methodology
Can be used only in Intraday - Hope someone will make it for all TF
All available script in TV do not have scaling at 25%
Due to which price needs to reach at 50% to derive any conclusion
This script solves this issue and can be used in sideways market as it provides scaling at 25 %
Script is original in its way to solve problem in sideways market
In den Scripts nach "pivot" suchen
PivotsSimply plots pivots found on any timeframe based on length specified.
Supports other timeframes, you choose to display gaps or not, with gaps on the labels may disappear so keep that in mind.


Pivot MoChiThis uses Current Day opening in place of previous day close
More Dynamic than Traditional Pivots
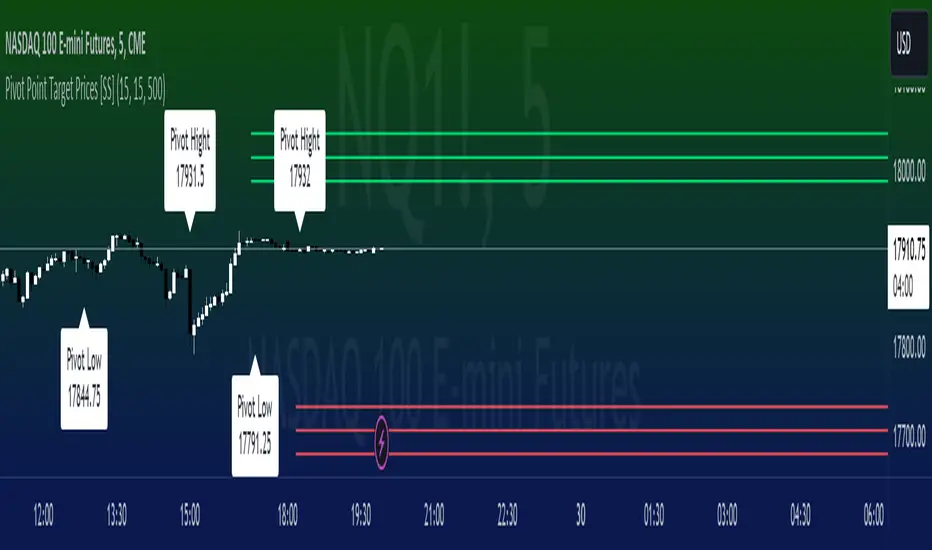
Pivot Point Target Prices [SS]Hey everyone,
Back with another indicator!
I have been trying to do this indicator for like months (over 6 months). I gave up on it a few times and then finally reapproached it in a different way and was able to get it working successfully!
This is the pivot point target price indicator, let's get into how it works!
How it works:
The indicator keeps track of previous pivot highs and lows within your designated lookback timeframe. Using this data, it calculates the average difference between the pivot highs and pivot lows to give you an ATR range.
In addition to this, it tracks the standard deviation of this range. This allows the indicator to give us 3 price targets, 2 standard deviations below the anticipated target, the anticipated target (middle value) and 2 standard deviations above the anticipated target.
Here is a diagram:
I usually only look for the first target, which is the -2 standard deviation below the actual target, but having the added 2 gives some buffer room if a stock is particularly bullish or bearish.
How to use it:
You use this the same way you would pivot points, the only difference is this will show you target ranges to look for on a pivot low or pivot high.
There is some customizability, which I will explain below:
Customize bars: You have the ability to customize left and right bars for your pivot points. I personally like 15 and 15 but I know the most commonly used are 10 and 10.
ATR Length: The ATR Length is defaulted at 500. If you want to tighten up the length and give more conservative targets, you can shorten to between 75 and 150. If you want to be very aggressive with the targets, you can extend to 750 to 1,000.
Toggle on/off labels: You can choose to turn off the pivot labels if you wish.
Important note:
Many pivot indicators will show you pivot levels and use these as support and resistance. This indicator isn't doing that. Its combining ATR and Pivot Points. The ATR gives us the price targets by calculating the average range between pivot highs and pivot lows, and the pivot points are operating as usual.
And that's the indicator!
I hope you enjoy it, like I said it took me forever to get a functioning version of this, so hope you find it helpful!
Safe trades everyone!
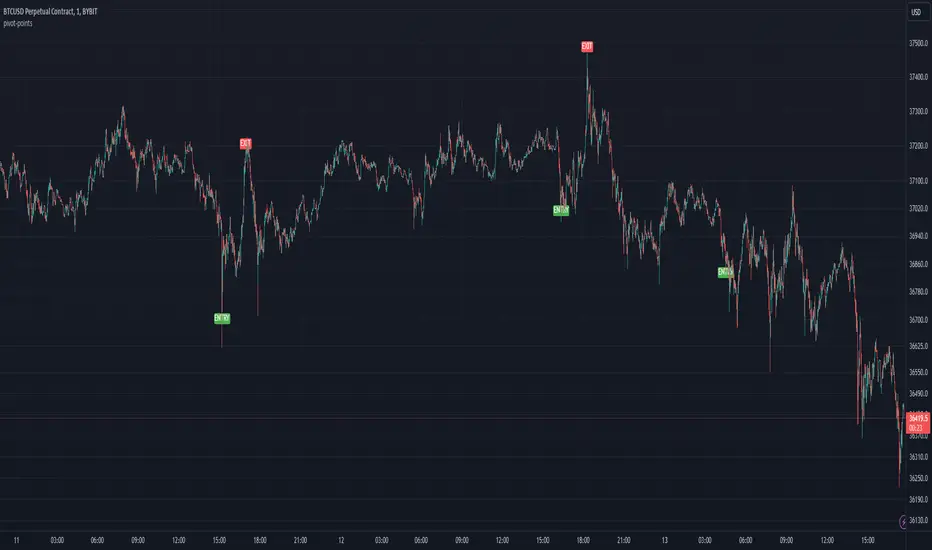
Pivot PointsDescription:
The Pivot Point indicator is designed to identify potential entry and exit points based on pivot points and manually tracks the average entry price and position size without executing actual trades, allowing for a visual simulation of pyramiding strategies.
Inputs for Customization:
i_leverage: User-defined leverage for trades.
i_takeProfit: Percentage for taking profit, adjusted by leverage.
i_dca: Percentage for dollar-cost averaging (DCA) when the price is a certain percentage below the entry, adjusted by leverage.
i_pivotFactor: Factor used to calculate the entry price from the pivot points.
i_pivotLength: The length of the lookback period to calculate the highest and lowest pivot points.
Usage Tips:
This indicator can be use by itself to provide entry and exit signals based on pivot points that will be generated from the provided `Pivot Factor`. An input of 1 will be the same as no factor.
This indicator can also be used as an input source for other indicators to facilitate other ideas.
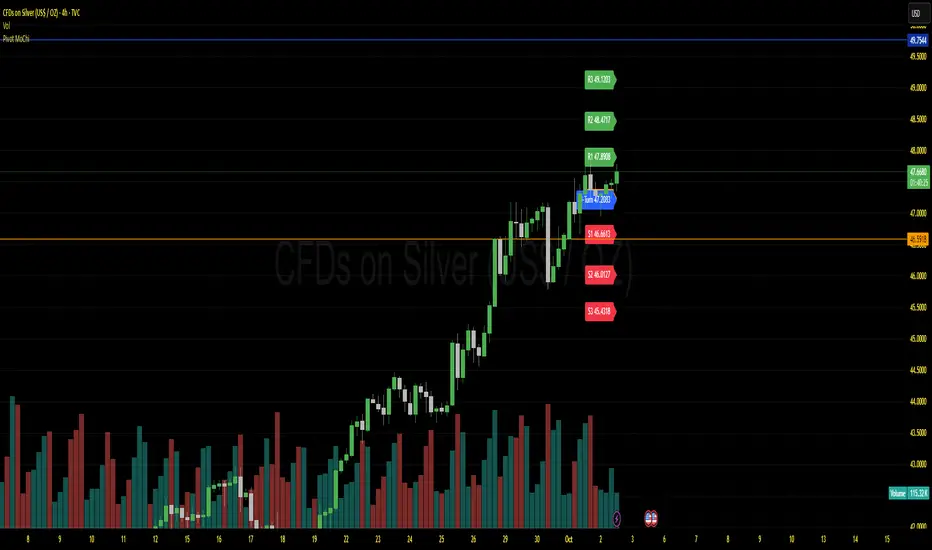
Pivot Levels Real-Time Latest Bar (Skip Current, With Zones)ddPivot Levels Real-Time Indicator with Shaded Zones
Author: Ammar Hasan
Overview
The Pivot Levels Real-Time Indicator is a TradingView Pine Script (v5) indicator that plots classic pivot levels using the most recently confirmed bar while skipping the currently forming bar.
It enhances the chart with shaded zones between pivot levels to help visualize potential support, resistance, and price reaction areas.
Key Features
Uses the latest confirmed bar only (no repainting)
Plots Pivot, S1, S2, S3 and R1, R2, R3
Displays shaded zones between levels
Automatically removes old drawings to keep the chart clean
Lightweight and suitable for lower timeframes
No labels for a clean visual layout
Pivot Level Calculations
Pivot (P) = (High + Low + Close) / 3
Support Levels
S1 = 2 x Pivot - High
S2 = Pivot - (High - Low)
S3 = Low - 2 x (High - Pivot)
Resistance Levels
R1 = 2 x Pivot - Low
R2 = Pivot + (High - Low)
R3 = High + 2 x (Pivot - Low)
All values are calculated using the last confirmed candle to ensure stable, non-repainting levels.
Visual Components
Lines
The pivot line is drawn in yellow and slightly thicker for emphasis.
Support lines are drawn in red.
Resistance lines are drawn in green.
Shaded Zones
Resistance Zones
R3 to R2
R2 to R1
R1 to Pivot
Support Zones
Pivot to S1
S1 to S2
S2 to S3
These zones help visualize supply and demand areas and potential price reaction zones.
Use Cases
Intraday trading
Scalping
Support and resistance analysis
Price action confirmation
Notes and Limitations
Levels update once per confirmed candle
Zones are drawn only for a short forward range by default
This indicator is not intended to be used as a standalone trading system
Conclusion
The Pivot Levels Real-Time Indicator with Shaded Zones provides a clean and reliable visualization of key market levels while avoiding repainting. The shaded zones add depth and context, helping traders better understand price behavior around important levels.
Developed by Ammar Hasan

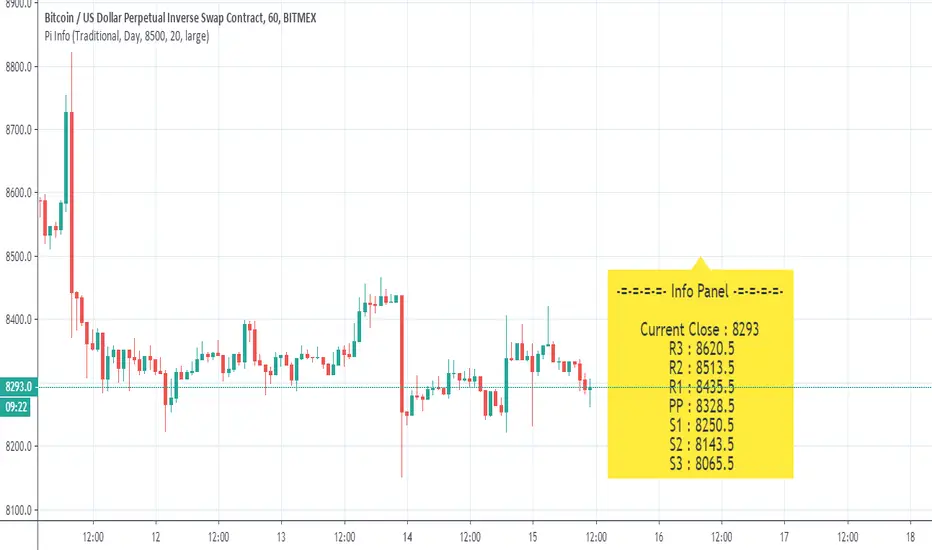
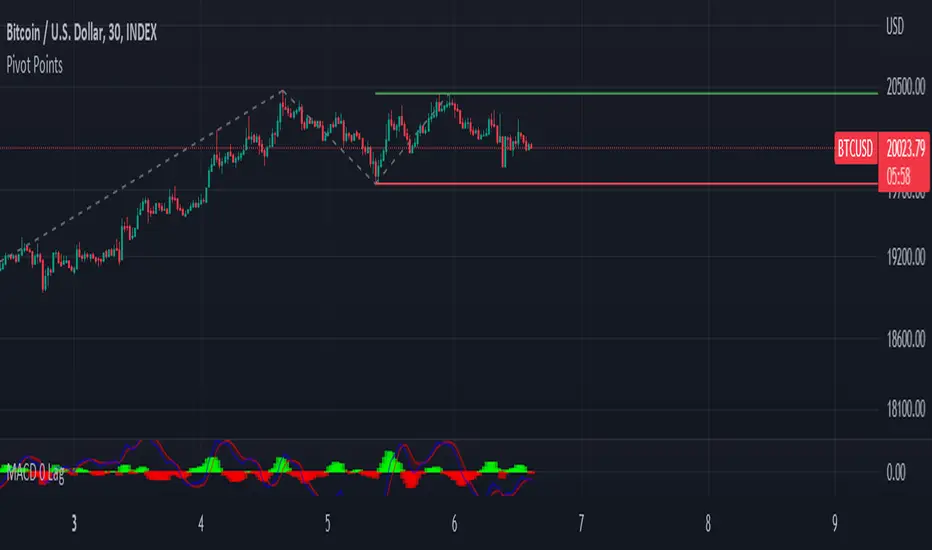
Pivot Points - [RealFact]Description:
The Pivot Points indicator is a powerful tool for identifying potential support and resistance levels based on previous price action. It calculates key pivot levels (P), along with support (S1, S2) and resistance (R1, R2) levels, which are used to forecast potential turning points in the market.
Key Features:
Pivot Calculation: Based on the previous period's high, low, and close prices.
Support and Resistance Levels: Three support (S1, S2) and three resistance (R1, R2) levels.
Customizable Timeframes: Applicable to various timeframes including daily, weekly, and monthly charts.
Visual Representation: Levels are clearly plotted on the chart, making it easy to identify key areas.
Trading Strategies: Useful for breakout, reversal, and trend-following strategies.
How to Use:
Identify Key Levels: Use the pivot point (P) to determine the general market trend.
Support and Resistance: Look for price reactions at S1, S2, R1 and R2 to find potential entry and exit points.
Combine with Other Indicators: Enhance analysis by combining with other technical indicators such as Moving Averages, RSI, or MACD.
Formula:
Pivot Point (P) = (High + Low + Close) / 3
Support 1 (S1) = 2P - High
Resistance 1 (R1) = 2P - Low
Support 2 (S2) = P - (High - Low)
Resistance 2 (R2) = P + (High - Low)
Best Practices:
Confirm with Volume: Look for volume confirmation when price approaches pivot levels.
Avoid False Breakouts: Be cautious of false breakouts and use other indicators to confirm price moves.

Pivot HL ~ Om BordaThe Pivot High Low indicator is a technical analysis tool used in financial markets. It identifies significant price levels where an asset's trend may reverse. A Pivot High occurs when an asset's price reaches a peak and then declines. Conversely, a Pivot Low is when the price hits a trough before rising. Traders use these points to make decisions about buying or selling assets. ~ Om Borda

Pivot AverageThis is an interesting application of Tradingview's basic Pivot HL indicator.
Pivot Average Indicator takes N number of the most recent Pivot Points (for both High and Low) and computes the average of the pivot points. The average price is then plotted on the chart.
The number of pivot points to average is a user defined variable that can be adjusted in the settings.
One can develop his/her own strategy by using this. One way to use this indicator is to buy when the price breaks above the average of High Pivot points and to sell when the price breaks below the average of Low Pivot points.

Pivot Points High Low (With confirm bar)This script simply adds a visual circle confirmation to visualise the bar when the pivot has been confirmed. It's based on Pivot Points High Low scripts

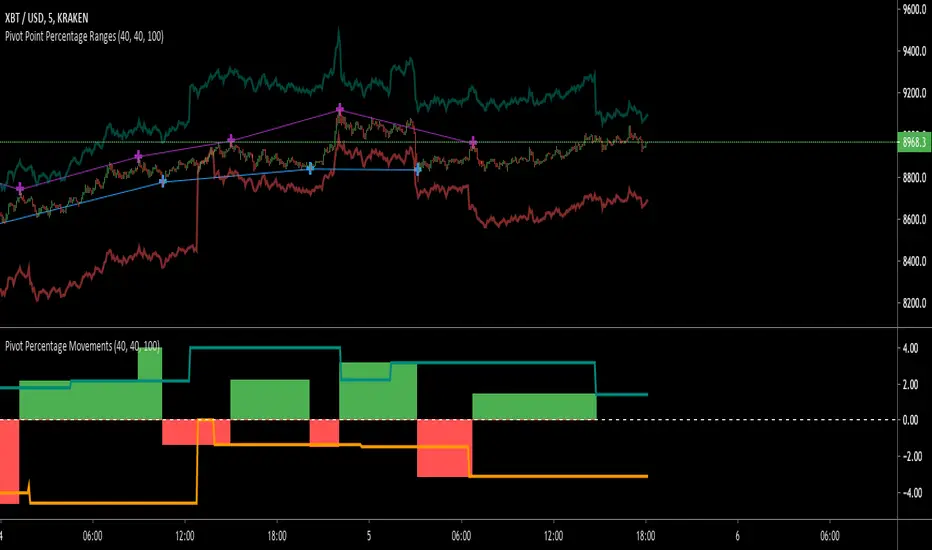
Pivot Point RangesThis script is meant to be a partner script to my Pivot Points Percentage Differences () indicator. It can be used to verify the percentages are what they should be, and give you a visual range in which to trade in.
If you have any questions please feel free to ask!
Pivot Points Standard with Middle PointsA pivot point is a technical analysis indicator, or calculations, used to determine the overall trend of the market over different time frames. The pivot point itself is simply the average of the high, low and closing prices from the previous trading day. I added middle points which are halfways between 2 pivot points as they are regularly revelant for trading.

Pivot Daily Price ColorJust daily pivot with area color:
- price above daily pivot : green area
- price below daily pivot : red area

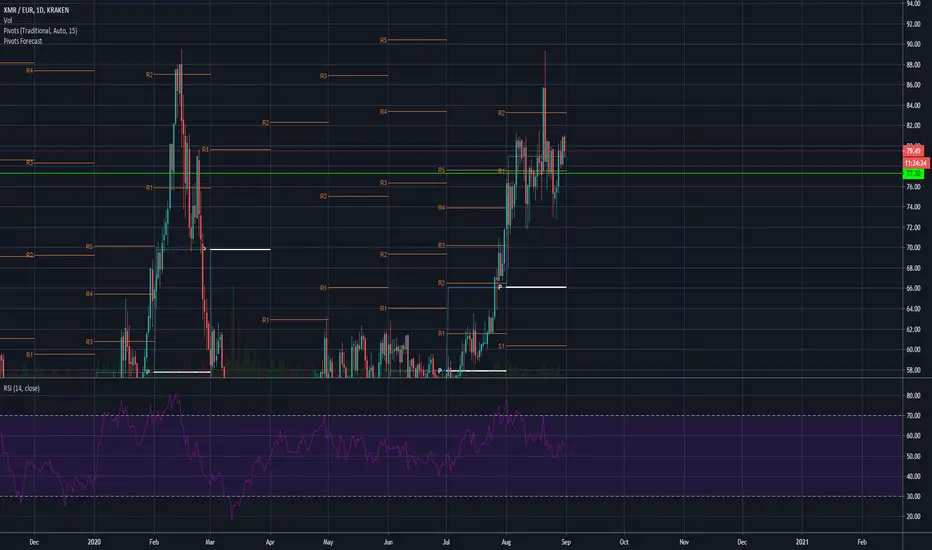
Pivot Data [QuantVue]The Pivot Data Indicator is designed to provide traders with valuable insights by identifying and analyzing pivot points on the price chart. It calculates both pivot highs and lows, then presents detailed statistics on the distance and time between these pivots.
a pivot point is defined as a specific point on the chart where the price either reaches a high or a low, with no bars higher or lower than it for a set number of bars on both sides (left and right). Essentially, it's a local high or low point, with the market moving in the opposite direction after the pivot forms.
For example:
A pivot high occurs when there are no bars with higher prices for a specified number of bars before and after that point.
A pivot low occurs when there are no bars with lower prices for the same number of bars on either side.
The number of bars to the left and right is adjustable via the Pivot Lookback Bars setting, allowing you to define how many bars are used to determine these pivot points.
Key features include:
Pivot Highs and Lows Identification: Automatically marks significant pivot highs and lows based on a user-defined lookback period, helping traders identify potential trend reversals or continuation points.
Prediction Labels: Provides forecasted pivot levels based on historical pivot price and time patterns, with options to show predictions for pivot highs, lows, or any pivot point.
Customizable Table Display: Displays a table summarizing important statistics, such as the average price percentage and the number of bars between pivots, along with the distance and time from the most recent pivot.
Traders can use this tool to map out potential levels of support and resistance based on historical data on pivot points.

Pivot Point Profile [LuxAlgo]The Pivot Point Profile indicator groups and displays data accumulated from previous pivot points, providing a comprehensive method for prioritizing and displaying areas of interest directly given by swing highs and lows.
Users have access to common settings present in other profile-type indicators.
🔶 USAGE
The Pivot Point Profile is particularly helpful in identifying highly active reversal zones that have been visited multiple times by price. Because of this, we could generally expect these areas to serve as future points of interest, often acting as support or resistance when re-visited.
The profile displays data associated with both Pivot Highs and Pivot Lows. Each row consists of pivot high and pivot low counts side-by-side, forming the total width of the row.
By analyzing the row as a whole, we can gain a better understanding of WHERE to look for interactions.
By analyzing the pivot counts independently, we can gain a better understanding of WHAT to expect when returning to these areas.
For example:
If a row in the profile contains entirely Pivot Lows, this could be seen as an indication to look for buyers to hold that level for a continuation upwards. A break of this level could be interpreted as a lack of interest from previous buyers at this level, indicating a further move down.
🔹 Concentrated Areas
Each row in the profile displays the current count of high pivots and low pivots within the selected lookback. The largest count for each pivot direction is identified as a "Concentrated Area (CA)", these CAs are highlighted over the chart with a line displaying the average of all pivots within that CA. The CA Average is the average of all pivot points (in the majority direction) within the given row.
These can hold more importance as potential support/resistance areas.
Note: The CA Threshold can be manually adjusted to highlight all rows based on a user-selected value.
🔶 DETAILS
🔹 Calculation
The idea behind the Pivot Point Profile is a new analysis method for pivot points, taking the idea of a volume profile and adapting it to display pivot points instead of volume. By using this data, in theory, we should be able to better prioritize zones to anticipate reversals, as well as identify key levels to watch for buyer & seller interactions to use as confirmations in direction.
The (vertical) width of each row is the product of the script's "Row Size", this is the number of rows that the profile will consist of. With a max of 250, the profile can be decently granular. That being said, A more granular profile will have fewer overlapping pivot points. By decreasing the row size (Using fewer rows in the profile) you will increase the tolerance for grouping pivot points. Potentially leading to a more comprehensive Profile. Inversely, By reducing the tolerance for grouping, you will better visualize only similar highs and lows but may have noisier data to sift through.
The Profile is calculated based on a "Lookback" parameter, using only the lookback amount of previous high and low pivots to calculate the profile. Configuring this parameter alongside "Pivot Length", will allow for great control over the frame of reference of the profile.
Note: This indicator is capable of utilizing the full chart history of pivot points, this can be done by enabling the "Use Full Chart History" setting, this will cause the script will calculate from everything it has access to on your current chart.
🔹 Display
The Pivot Point Profile display can be customized to fit a various range of chart styles and visual needs. The specific settings to adjust these can be located in the "Profile Display" Section of the User Inputs.
Profile Width: Sets the Left to Right Width of the Profile. This is the maximum width that the profile will occupy and will scale to fit within this width.
Profile Offset: Sets the distance of the Profile's Axis from the current chart candle. This moves the entire profile left and right to enable to user to set the distance between the profile and the current candle.
Direction: Changes the display direction of the profile, allowing for "Left", "Right", or "Center" display styles.
🔶 SETTINGS
🔹 Pivot Point Parameters
Pivot Type: Choose between "Fractal Pivots" or "SMC Structure" to use as the basis for pivots.
Length: Sets the length for the pivot calculations.
🔹 Profile Calculations Parameters
Lookback: Sets the number of pivots to calculate within, in increments of high and low pairs. (Setting this to 1 = 1 Pivot High & 1 Pivot Low)
Use Full Chart History: Disregards the set lookback and instead uses all available chart data to calculate from.
Row Size: Sets the total number of rows to calculate the profile with.
🔹 Profile Display
Profile Width: Sets the max left & right width (in bars) that the profile will occupy.
Profile Offset: Sets the distance of the profile axis from the last chart bar.
Direction: Sets the display direction
🔹 Concentrated Areas
Highlight CAs: Extends the rows left from concentrated areas.
CA Threshold: Manually set the threshold for determining concentrated areas, when disabled, only the largest rows will be displayed.
CA Averages: Toggles the concentrated area averages for each pivot direction.
Note: CA Averages can be displayed independently without CA Highlights being displayed, and vice versa.

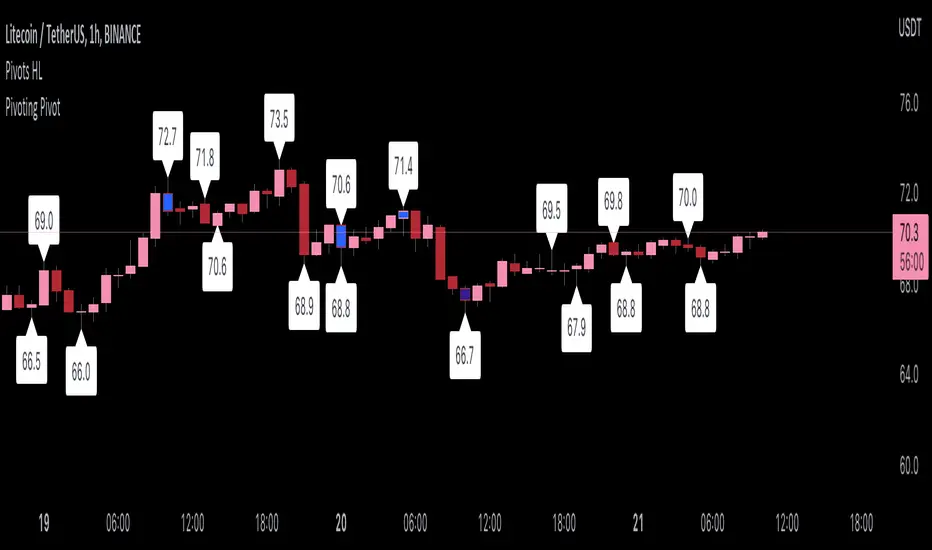
Pivoting PivotMany people use Pivots when conducting analysis, but I don't see many people using pivoting pivots. Pivoting pivots are pivots that don't have any other pivots around them. They can be useful when trying to separate pivot clusters from important pivot points.
The code is calculated by finding the distance between two candlesticks (left check), then calculating the distance between the last pivot and the current candlestick.
On the chart: labels are TradingView's official pivot high and pivot low script, and the blue candle color is my pivoting pivots (both with a look left and look right of 2).
Special thanks to @fikira for helping me with ideas for the calculations!
Pivot Levels [BigBeluga]🔵 OVERVIEW
The Pivot Levels indicator automatically detects and draws key market pivot levels across multiple sensitivity settings. Each pivot level represents a significant local high or low in price structure, acting as potential zones of support and resistance. Traders can visualize short-, medium-, and long-term pivot layers simultaneously, helping to identify where price may react, reverse, or break out.
🔵 CONCEPTS
Different pivot lengths provide multi-length sensitivity on the same timeframe — shorter lengths detect local micro-swings, while longer lengths capture broader swing structure within the current chart.
ATR-based color logic marks active, bullish, or bearish pivot zones dynamically.
Lines can extend to the right or both sides to track reactions over time.
🔵 FEATURES
Detects up to four custom pivot levels simultaneously.
Each pivot level has independent settings for length , style , and extension mode .
Auto-colors each pivot as support (green), resistance (orange), or active zone (blue).
Displays dual-width line layers: a solid base and a transparent overlay for visual depth.
Dynamic price labels show exact pivot levels for clarity.
Fully customizable line styles: dashed (--), solid (-), or dotted (..).
Extends lines to the right for future reaction tracking or both directions for structure alignment.
🔵 HOW TO USE
Enable or disable pivot levels (1–4) to control how many layers of structure you want visible.
Use shorter pivot lengths for intraday turning points and longer ones for macro structure.
Watch for multiple pivot lines clustering in the same region — these often mark strong reversal zones.
Observe color changes: green = support, orange = resistance, blue = active neutral zone.
Combine with price action or volume analysis to confirm reactions near major pivots.
🔵 CONCLUSION
The Pivot Levels indicator provides a clean, multi-layered visualization of market structure.
By tracking pivots of varying lengths, traders can easily identify overlapping support and resistance regions, gauge breakout strength, and align trades with the dominant structural zones visible across multiple time horizons.

Pivot Average [Misu]█ This Indicator is based on Pivot Points.
It aggregates closed Pivot Points to determine a " Pivot Average " line.
Pivot Points here refer to highs and lows.
█ Usages:
Pivot Average can be used as resistance or breakout area.
It is also very usefull to find battle zones.
It can also be used as a trend indicator: when the price is below, trend is down, when price is above, trend is up.
Mixed with momentum/volatility indicator it is very powerfull.
█ Parameters:
Deviation: Parameter used to calculate pivots.
Depth: Parameter used to calculate pivots.
Length: History Lenght used to determine Pivot Average.
Smoothing MA Lenght: MA lenght used to smooth Pivot Average.
Close Range %: Define price percentage change required to determine close pivots.
Color: Color of the Pivot Average.

Pivot Points, by @juanmirocks# Advantages over TV's indicator "Pivot Points Standard"
1. Show pivot lines for all history, which lets you gauge trading strategies throughout time
2. More sensible Default/Auto time frame; e.g. on intradays only and always the market values of yesterday's Day are used
3. The halves between the key levels are also shown, which it's useful for some trading strategies
4. Arguably out-of-the-box nicer interface
Pivot Points as an indicator is a traditional strategy to draw resistance and support levels. It's best suited for intraday trading: the pivot points and resulting key levels are calculated from yesterday's market values (H, L, C). More details in the script's source.
Pivot Points trading is suitable for any market, and best for intraday (e.g. 3 min).
