Daily Pivot Points LEVELS S-RThis indicator plots daily pivot points based on the previous day’s high, low, and close. It displays the main pivot line, as well as the first levels of support (S1) and resistance (R1), with optional second levels (R2, S2) for additional reference. Ideal for
In den Scripts nach "pivot points" suchen
Volume Price Trend with Divergence and Pivot Points The volume price trend indicator is used to determine the balance between a security’s demand and supply. The percentage change in the share price trend shows the relative supply or demand of a particular security, while volume indicates the force behind the trend. The VPT indicator is similar to the on-balance volume (OBV) indicator in that it measures cumulative volume and provides traders with information about a security’s money flow.
This is Volume Price Trend or VPT recalculated to be an Oscillator, a Divergence hunter was added, also Pivot Points and Alerts.
VPT is considered a "leading indicator" - in contrast to a "lagging indicator" just as Moving Averages it does not show a confirmation what already happened, but it shows what can happen in the future. For example: The chart is climbing while the VPT oscillator is slowly declining, gets weaker and weaker, maybe even prints bearish divergences? That means that a reversal might be occurring soon. Leading indicators are best paired with Stop and Resistance Lines, general Trendlines , Fib Retracements etc...Your chart is approaching a very important Resistance Trendline but the VPT shows a very positive signal? That means there is a high probability that the Resistance is going to be pushed though and becomes Support in the future.
What are those circles?
-These are Divergences. Red for Regular-Bearish. Orange for Hidden-Bearish. Green for Regular-Bullish. Aqua for Hidden-Bullish.
What are those triangles?
- These are Pivots . They show when the VPT oscillator might reverse, this is important to know because many times the price action follows this move.
Please keep in mind that this indicator is a tool and not a strategy, do not blindly trade signals, do your own research first! Use this indicator in conjunction with other indicators to get multiple confirmations.

[JRL] ATR Pivot PointsThis indicator plots pivot points with support and resistance lines based on average true range (ATR). ATR is one of the best volatility and trading range predictors, so it can be very useful for finding confluence in any strategy.

Daily Pivot Points + R1 S1 R2 S2 with PricesThis indicator automatically plots daily pivot points (PP) along with the first and second resistance (R1, R2) and support (S1, S2) levels on your chart. Each level is clearly labeled with its price, making it easy to identify key areas for potential reversals or breakouts. Perfect for day traders and swing traders looking for reliable intraday support and resistance zones.

Monthly Weekly Daily Pivot Points StandardShow the monthly weekly and daily pivot points all at once , suitable for daytrading
My VWAP Reversal + Pivot Points StandardThis indicator, with the addition of a standard VWAP indicator to the 5m chart, helps the operator when using a closing candle Price to initiate a VWAP Reversal strategy.
The strategy involves Price gapping up, look for a Close below the 1st 5m candle Low; else look for a Close above the 1st 5m candle High. On a break of VWAP, take the trade in the opposite direction of the gap, hence the VWAP Reversal. Not my own strat, credit to T3 Newsbeat, publicly posted on YouTube.
The Pivot Points Standard in the Pine 4 user manual, was the base source code, and leaving it here will allow me to remove the PP indicator I was using.

Moving Averages & Pivot Points Traderspro (8,21,55 EMA & 200SMA)For trend continuation strategy adding daily, weekly, montly and yearly pivot points

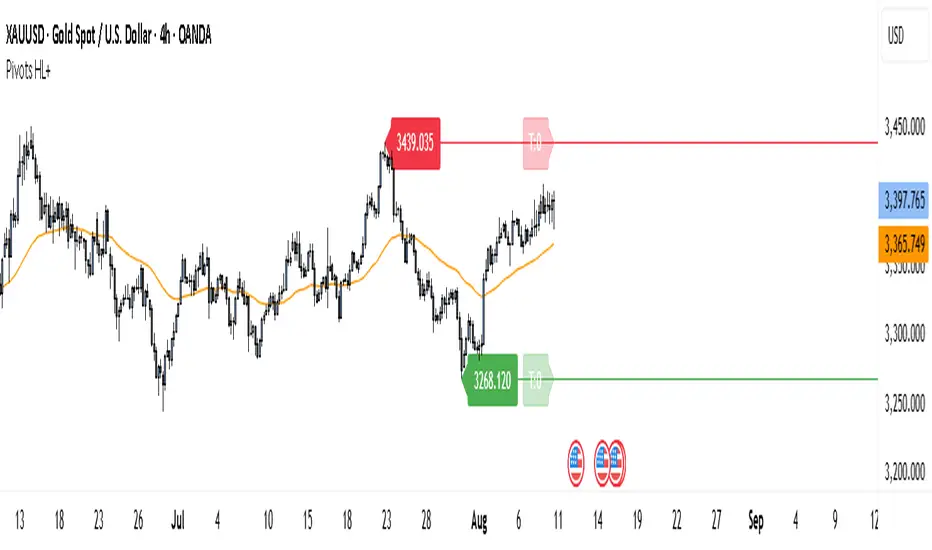
Pivot Points HL DetailedThis indicator marks important turning points in the market, showing you the most recent swing high and swing low as horizontal lines across the chart. Each pivot line has a price label where it formed and a small counter that updates whenever the market touches that level again. The line’s color reflects the prevailing trend, determined by an EMA filter, so you can quickly see if the level is likely acting as support or resistance in the current market environment.
It works by scanning recent bars for points where price made a local high higher than several bars to its left and right, or a local low lower than several bars to its left and right. These pivots are calculated directly from price action using the ta.pivothigh and ta.pivotlow functions. Once identified, the level is tracked in real time, counting every time price crosses it. The EMA provides context: if price is above the EMA, the market is considered in an uptrend and the pivots are colored to match; if price is below, they’re marked as part of a downtrend.
For traders, this offers a clean way to see where the market has turned before and whether those levels are still relevant. Strong levels often show multiple touches, which can be used for entries, exits, or risk management. The built-in alert system can notify you when price approaches either the most recent swing high or swing low, so you can react quickly.
This tool can be applied in almost any market — forex, stocks, indices, commodities, or crypto — because price tends to respect recent swing points regardless of the asset class. It tends to be most effective in liquid markets, where many traders see and react to the same key levels, and it’s valuable in both trending and ranging conditions, though the EMA trend filter adds extra clarity when the market is moving directionally.
Pivot Point V2 Backtest Pivot points simply took the high, low, and closing price from the previous period and
divided by 3 to find the pivot. From this pivot, traders would then base their
calculations for three support, and three resistance levels. The calculation for the most
basic flavor of pivot points, known as ‘floor-trader pivots’, along with their support and
resistance levels.
WARNING:
- For purpose educate only
- This script to change bars colors.

Pivot Point V2 Strategy Pivot points simply took the high, low, and closing price from the previous period and
divided by 3 to find the pivot. From this pivot, traders would then base their
calculations for three support, and three resistance levels. The calculation for the most
basic flavor of pivot points, known as ‘floor-trader pivots’, along with their support and
resistance levels.
WARNING:
- For purpose educate only
- This script to change bars colors.
Pivot Point V2 Pivot points simply took the high, low, and closing price from the previous period and
divided by 3 to find the pivot. From this pivot, traders would then base their
calculations for three support, and three resistance levels. The calculation for the most
basic flavor of pivot points, known as ‘floor-trader pivots’, along with their support and
resistance levels.

Pivot Point Pivot points simply took the high, low, and closing price from the previous period and
divided by 3 to find the pivot. From this pivot, traders would then base their
calculations for three support, and three resistance levels. The calculation for the most
basic flavor of pivot points, known as ‘floor-trader pivots’, along with their support and
resistance levels.
Pivot Points mura visionWhat it is
A clean, single-set pivot overlay that lets you choose the pivot type (Traditional/Fibonacci), the anchor timeframe (Daily/Weekly/Monthly/Quarterly, or Auto), and fully customize colors, line width/style , and labels . The script never draws duplicate sets—exactly one pivot pack is displayed for the chosen (or auto-detected) anchor.
How it works
Pivots are computed with ta.pivot_point_levels() for the selected anchor timeframe .
The script supports the standard 7 levels: P, R1/S1, R2/S2, R3/S3 .
Lines span exactly one anchor period forward from the current bar time.
Label suffix shows the anchor source: D (Daily), W (Weekly), M (Monthly), Q (Quarterly).
Auto-anchor logic
Intraday ≤ 15 min → Daily pivots (D)
Intraday 20–120 min → Weekly pivots (W)
Intraday > 120 min (3–4 h) → Monthly pivots (M)
Daily and above → Quarterly pivots (Q)
This keeps the chart readable while matching the most common trader expectations across timeframes.
Inputs
Pivot Type — Traditional or Fibonacci.
Pivots Timeframe — Auto, Daily (1D), Weekly (1W), Monthly (1M), Quarterly (3M).
Line Width / Line Style — width 1–10; style Solid, Dashed, or Dotted.
Show Labels / Show Prices — toggle level tags and price values.
Colors — user-selectable colors for P, R*, S* .
How to use
Pick a symbol/timeframe.
Leave Pivots Timeframe = Auto to let the script choose; or set a fixed anchor if you prefer.
Toggle labels and prices to taste; adjust line style/width and colors for your theme.
Read the market like a map:
P often acts as a mean/rotation point.
R1/S1 are common first reaction zones; R2/S2 and R3/S3 mark stronger extensions.
Confluence with S/R, trendlines, session highs/lows, or volume nodes improves context.
Good practices
Use Daily pivots for intraday scalps (≤15m).
Use Weekly/Monthly for swing bias on 1–4 h.
Use Quarterly when analyzing on Daily and higher to frame larger cycles.
Combine with trend filters (e.g., EMA/KAMA 233) or volatility tools for entries and risk.
Notes & limitations
The script shows one pivot pack at a time by design (prevents clutter and duplicates).
Historical values follow TradingView’s standard pivot definitions; results can vary across assets/exchanges.
No alerts are included (levels are static within the anchor period).

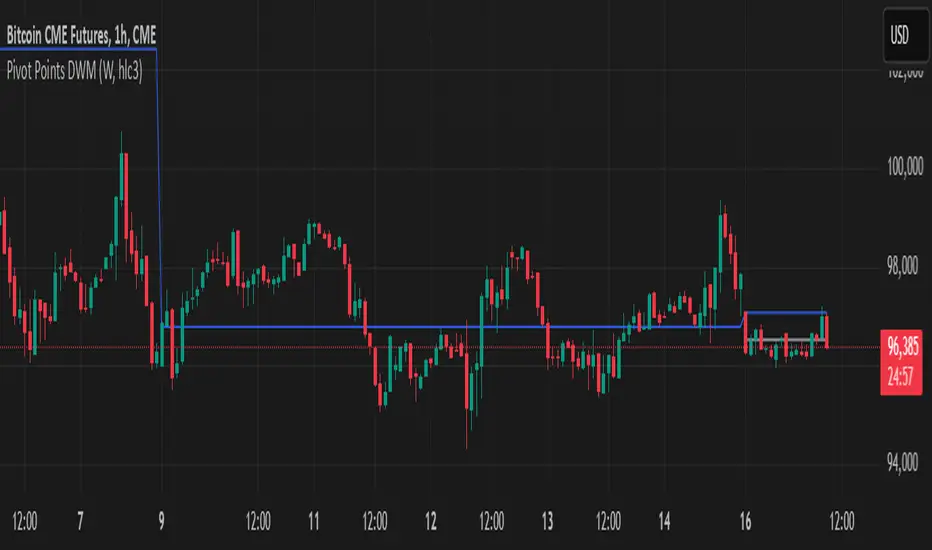
Pivot Points DWMWhat Is a Pivot Point?
A pivot point is a price level calculated from previous prices. It's used to indicate potential areas of support or resistance that offer attractive reward-to-risk setups for trades. The pivot point itself is simply the average of the intraday high and low and the closing price from the previous trading day. Trading above the pivot point on the subsequent day is thought to indicate ongoing bullish sentiment. Trading below the pivot point indicates bearish sentiment.
Non-Repainting
Pivot Points)Pivot Point Display:
Calculate and draw the Pivot Point line (center point).
Calculate and display Support and Resistance levels.
Types of Pivot Calculation Methods:
Classic (default)
Ability to select other methods such as Fibonacci, Camarilla, Woodie's (but not yet implemented in the code).
Support and Resistance Lines:
Four resistance levels (R1, R2, R3, R4) in red.
Four support levels (S1, S2, S3, S4) in bright green.
Ability to adjust line thickness:
The user can change the thickness of the lines.
Value Labeling:
Display a numerical value for Pivot, resistance and support next to each level.
Automatic Update:
Delete previous lines and labels and draw new lines on the last candle.
Works on all timeframes:
This indicator works on different timeframes such as 1 minute, 5 minutes, 1 hour, 4 hours, daily, weekly and monthly.

Pivot Points Strategy🟢 It enters long trades near support zones (S1–S3)
🔴 It enters short trades near resistance zones (R1–R3)
🎯 All positions aim to exit at the central pivot (P).
🚫 It avoids trading when price crosses the pivot during the bar.
🔄 Strategy resets when a new pivot is calculated.
📊 Supports pyramiding up to 5 positions for scaling in.

Pivot Points Std iazzuPivot point std iazzu
In financial markets, a pivot point is a price level that is used by traders as a possible indicator of market movement. A pivot point is calculated as an average of significant prices from the performance of a market in the prior trading perio


Pivot Points (Daily, Weekly, Monthly)Pivot point: P = (High + Low)/2
First support: S1 = Low
Second support, S2 = Low - 2 * (High - Low)
First resistance: R1 = High
Second resistance, R2 = High + 2 * (High - Low)
White Line: Pivot Point
Gleen Line(Thin Line): Support 1
Green Line(Thick Line): Support 2
Red Line(Thin Line): Resistance 1
Red Line (Thick Line): Resistance 2
You can adjust it to daily, weekly or monthly indicators, daily for intraday trading (1minute, 1hour etc.), weekly and monthly for day/swing trading, monthly for weekly trades. I plot the graph with steplines since I think they can show the differences of pivots from time to time more clearly, you are free to change to other plot styles like circles or regular lines if you want to. Please like this script, and let me know any questions, thanks.

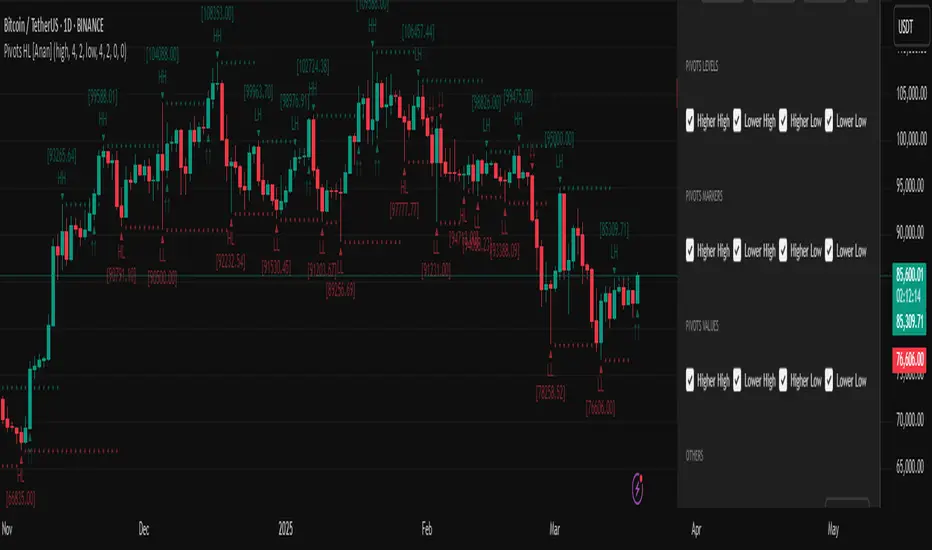
Pivot Points High Low (HH/HL/LH/LL) [Anan]Hello Friends,
This is my own version of ( Pivot Hilo Support n Resistance Levels R3-3 by JustUncleL )
- V4 Pinescript
- Removed MA dependency filters
- Add some arrows
Combined Support & Resistance IndicatorsPivot Points Calculation:
The script calculates the Pivot Point as the average of the high price (high), low price (low), and closing price (close) of the current bar.
The Pivot Point is plotted on the chart as a red line.
Support and Resistance Levels:
The Support Level is calculated as the lowest price over the last lookback bars.
The Resistance Level is calculated as the highest price over the last lookback bars.
These levels are displayed on the chart using horizontal lines: green for support and red for resistance.
Momentum Indicators:
RSI (Relative Strength Index): A momentum oscillator calculated based on the closing price over the last 14 bars. It is plotted as a yellow line.
MACD (Moving Average Convergence Divergence): An indicator consisting of the MACD line (blue) and the signal line (orange). It is calculated based on the closing price.
Moving Averages:
SMA 20: A simple moving average over the last 20 bars. It is plotted as a green line.
SMA 50: A simple moving average over the last 50 bars. It is plotted as a red line.
Dynamic Levels Drawing:
Instead of using hline (which does not support dynamic values), the script uses line.new to draw dynamic support and resistance levels. These lines are updated on each bar.

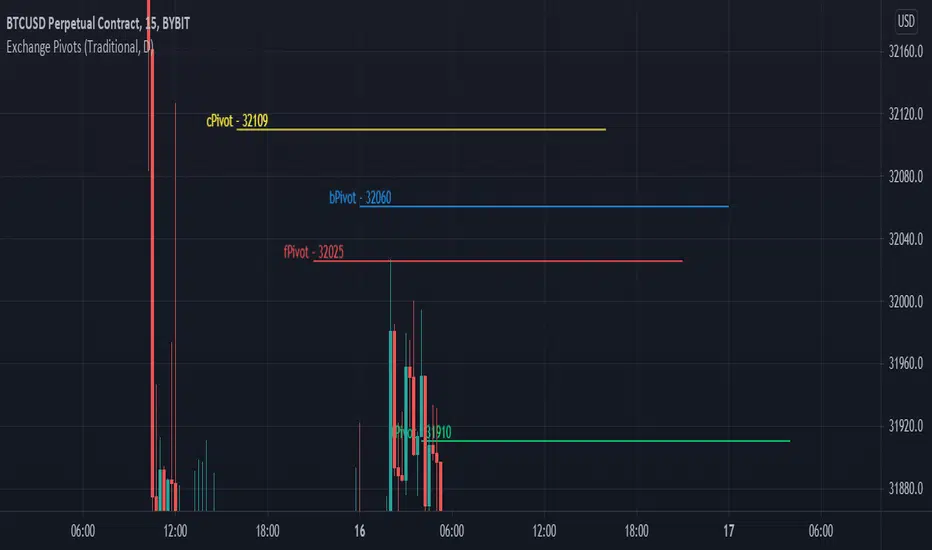
Exchange PivotsPivot points from 4 different Markets:
DailyPivot: BYBIT:BTCUSD
AsiaPivot: OKCOIN:BTCUSD
ForexPivot: FOREXCOM:BTCUSD
TradestationPivot: TRADESTATION:BTCUSD