QG-Particle OscillatorThis is an advanced oscillator based on auxiliary particle filter. It separates signal from noise and uses smoothing algorithm similar to JMA.
The main oscillator line is a smoothed and detrended version of the price series similar to detrended oscillator line. The purple/aqua lines are a prediction based on an additional adaptive smoothing technique and current volatility.
The prediction is smoothed twice and is supposed to represent the true signal without any noise, thus the prediction should always be less than the raw detrend line. However, certain volatile conditions will cause the prediction to cross above/below the detrend line. When this happens the likelihood of a reversal or pullback is extremely high.
There are 3 dots on the zero line- Red, Green and Yellow. The yellow dots warn of an eminent pullback 2 bars before it actually occurs. This is a non-repainting indicator.
One can also use this indicator to trade CCI signals, similar to zero line rejection in existing trend.
The indicator has 2 settings- Period and Phase. The phase represents cycle phase and Period represents oscillator period.
Credits: This indicator has been originally published for Ninjatrader and this is conversion into pinescript.
In den Scripts nach "oscillator" suchen

HARSI PRO v2 - Advanced Adaptive Heikin-Ashi RSI OscillatorThis script is a fully re-engineered and enhanced version of the original Heikin-Ashi RSI Oscillator created by JayRogers. While it preserves the foundational concept and visual structure of the original indicatorusing Heikin-Ashi-style candles to represent RSI movementit introduces a range of institutional-grade engines and real-time analytics modules.
The core idea behind HARSI is to visualize the internal structure of RSI behavior using candle representations. This gives traders a clearer sense of trend continuity, exhaustion, and momentum inflection. In this upgraded version, the system is extended far beyond basic visualization into a comprehensive diagnostic and context-tracking tool.
Core Enhancements and Features
1. Heikin-Ashi RSI Candles
The base HARSI logic transforms RSI values into open, high, low, and close components, which are plotted as Heikin-Ashi-style candles. The open values are smoothed with a user-controlled bias setting, and the high/low are calculated from zero-centered RSI values.
2. Smoothed RSI Histogram and Plot
A secondary RSI plot and histogram are available for traditional RSI interpretation, optionally smoothed using a custom midpoint EMA process.
3. Dynamic Stochastic RSI Ribbon
The indicator optionally includes a smoothed Stochastic RSI ribbon with directional fill to highlight acceleration and reversal zones.
4. Real-Time Meta-State Engine
This engine determines the current market environmentneutral, breakout, or reversalbased on multiple adaptive conditions including volatility compression, momentum thrust, volume behavior, and composite reversal scoring.
5. Adaptive Overbought/Oversold Zone Engine
Instead of using fixed RSI thresholds, this engine dynamically adjusts OB/OS boundaries based on recent RSI range and normalized price volatility. This makes the OB/OS levels context-sensitive and more accurate across different instruments and regimes.
6. Composite Reversal Score Engine
A real-time score between 0 and 5 is generated using four components:
* OB/OS proximity (zone score)
* RSI slope behavior
* Volume state (burst or exhaustion)
* Trend continuation penalty based on position versus trend bias
This score allows for objective filtering of reversal zones and breakout traps.
7. Kalman Velocity Filter
A Kalman-style adaptive smoothing filter is applied to RSI for calculating velocity and acceleration. This allows for real-time detection of stalls and thrusts in RSI behavior.
8. Predictive Breakout Estimator
Uses ATR compression and RSI thrusting conditions to detect likely breakout environments. This logic contributes to the Meta-State Engine and the Breakout Risk dashboard metric.
9. Volume Acceleration Model
Real-time detection of volume bursts and fades based on VWMA baselines. Volume exhaustion warnings are used to qualify or disqualify reversals and breakouts.
10. Trend Bias and Regime Detection
Uses RSI slope, HARSI body impulse, and normalized ATR to classify the current trend state and directional bias. This forms the basis for filtering false reversals during strong trends.
11. Dashboard with Tooltips
A clean, table displays six key metrics in real time:
* Meta State
* Reversal Score
* Trend Bias
* Volume State
* Volatility Regime
* Breakout Risk
Each cell includes a descriptive tooltip explaining why the value is being shown based on internal state calculations.
How It Works Internally
* The system calculates a zero-centered RSI and builds candle structures using high, low, and smoothed open/close values.
* Volatility normalization is used throughout the script, including ATR-based thresholds and dynamic scaling of OB/OS zones.
* Momentum is filtered through smoothed slope calculations and HARSI body size measurements.
* Volume activity is compared against VWMA using configurable multipliers to detect institutional-level activity or exhaustion.
* Each regime detection module contributes to a centralized metaState classifier that determines whether the environment is conducive to reversal, breakout, or neutral action.
* All major signal and context values are continuously updated in a dashboard table with logic-driven color coding and tooltips.
Based On and Credits
This script is based on the original Heikin-Ashi RSI Oscillator by JayRogers . All visual elements from the original version, including candle plotting and color configurations, have been retained and extended. Significant backend enhancements were added by AresIQ for the 2025 release. The script remains open-source under the original attribution license. Credit to JayRogers is preserved and required for any derivative versions.

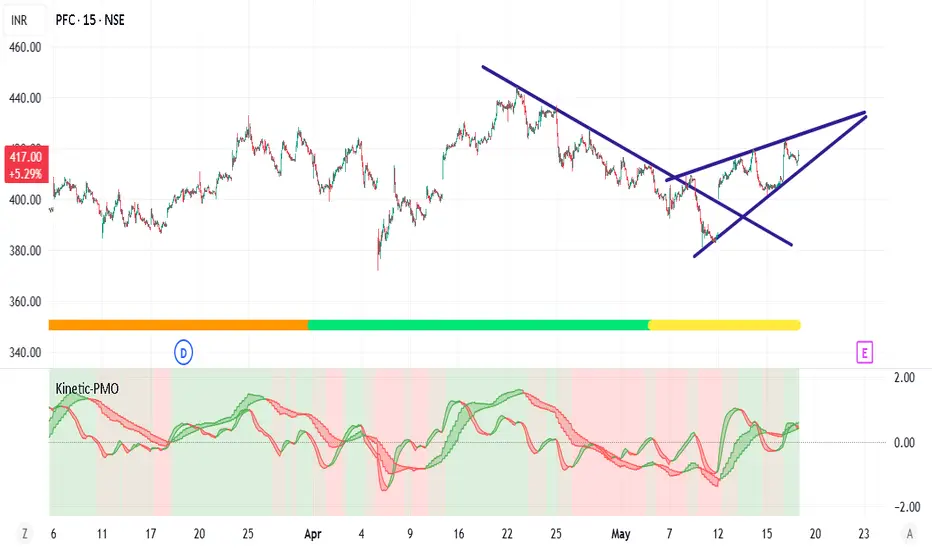
Kinetic Price Momentum Oscillator📈 Kinetic Price Momentum Oscillator (Sri-PMO)
Author's Note:
This script is an educational and custom-adapted visualization based on the concept of the Price Momentum Oscillator (PMO). It is not a direct clone of any proprietary implementation, and it introduces enhancements such as timeframe sensitivity, customizable smoothings, multi-timeframe analysis, and visual trend meters.
🔍 Overview:
The Kinetic Price Momentum Oscillator (Kinetic-PMO) is a dynamic momentum indicator that analyzes price rate of change smoothed with dual exponential moving averages. It offers a clear view of momentum trends across multiple timeframes—the chart's current timeframe, the 1-hour timeframe, and the 1-day timeframe. It includes optional visual cues for zero-line crossovers, trend ribbon fills, and a daily trend meter.
🧮 Calculation Logic:
At its core, Kinetic-PMO calculates momentum by:
Measuring Rate of Change (ROC) over 1 bar.
Applying double EMA smoothing:
The first smoothing (len1) smooths the ROC.
The second smoothing (len2) smooths the result further.
This produces the main KPMO Line.
A third EMA (sigLen) is applied to the KPMO line to produce the Signal Line.
The formula includes a multiplier of 10 to scale values.
pinescript
Copy
Edit
roc = ta.roc(source, 1)
kmo = ta.ema(10 * ta.ema(roc, len1), len2)
signal = ta.ema(kmo, sigLen)
To allow responsiveness across timeframes, the script provides sensitivity inputs (sensA, sensB, sensC) which dynamically scale the smoothing lengths for different contexts:
Intraday (current chart timeframe)
Hourly (1H)
Daily (1D)
🧭 Features:
✅ Multi-Timeframe Calculation:
Intraday: Based on current chart resolution
1H: PMO for the hourly trend
1D: Daily trend meter using KPMO structure
✅ Trend Identification:
Green if PMO is above Signal Line (bullish)
Red if PMO is below Signal Line (bearish)
Daily Trend Meter includes nuanced color mapping:
Lime = Bullish above zero
Orange = Bullish below zero
Red = Bearish below zero
Yellow = Bearish above zero
✅ Custom Visual Enhancements:
Optional filled ribbons between KPMO and Signal
Optional zero-line crossover background highlight
Compact daily trend meter displayed as a color-coded shape
🛠 Customization Parameters:
Input Description
Primary Smoothing Controls ROC smoothing depth (1st EMA)
Secondary Smoothing Controls final smoothing (2nd EMA)
Signal Smoothing Controls EMA of the PMO line
Input Source Default is close, but any price type can be selected
Sensitivity Factors Separate multipliers for intraday, 1H, and 1D
Visual Settings Toggle zero-line highlight and ribbon fill
🧠 Intended Use:
The Kinetic-PMO is suitable for trend confirmation, momentum divergence detection, and entry/exit refinement. The multi-timeframe aspect helps align short-term and long-term momentum trends, supporting better trade decision-making.
⚖️ Legal & Attribution Statement:
This script was independently created and modified for educational and analytical purposes. While the concept of the PMO is inspired by technical analysis literature, this implementation does not copy or reverse-engineer any proprietary code. It introduces custom parameters, visualization enhancements, and multi-timeframe logic. Posting this script complies with TradingView’s policy on derivative work and educational indicators.
Money Flow Indicator (Chaikin Oscillator) with VWAPStrategy Overview
Entry Conditions:
Buy Entry:
The Chaikin Oscillator crosses above the signal line.
The current price is above the VWAP.
Sell Entry:
The Chaikin Oscillator crosses below the signal line.
The current price is below the VWAP.
Exit Conditions:
Profit Taking:
Take profit when a target profit is reached (e.g., a 2% increase from the entry price).
Stop Loss:
Set a stop loss, for example, at a 1% decline from the entry price.
Risk Management:
Manage risk by limiting each trade to no more than 1-2% of the account balance.
Calculate position size based on risk and trade accordingly.
Trend Confirmation:
Use other indicators (like moving averages) to confirm the overall trend and focus trades in the direction of the trend.
In an uptrend, prioritize buy entries; in a downtrend, prioritize sell entries.
Specific Trade Scenarios
Example 1: Buy Entry:
Enter a buy position when the Chaikin Oscillator crosses above the signal line and the price is above the VWAP.
Set a stop loss 1% below the entry price and a profit target 2% above the entry price.
Example 2: Sell Entry:
Enter a sell position when the Chaikin Oscillator crosses below the signal line and the price is below the VWAP.
Set a stop loss 1% above the entry price and a profit target 2% below the entry price.
Additional Considerations
Backtesting: Test this strategy with historical data to evaluate performance and make adjustments as needed.
Market Conditions: Pay attention to market volatility and economic indicators, adjusting the trading strategy flexibly.
Psychological Factors: Avoid emotional decisions and follow clear rules when trading.

Bitcoin Log Growth Curve OscillatorThis script presents the oscillator version of the Bitcoin Logarithmic Growth Curve 2024 indicator, offering a new perspective on Bitcoin’s long-term price trajectory.
By transforming the original logarithmic growth curve into an oscillator, this version provides a normalized view of price movements within a fixed range, making it easier to identify overbought and oversold conditions.
For a comprehensive explanation of the mathematical derivation, underlying concepts, and overall development of the Bitcoin Logarithmic Growth Curve, we encourage you to explore our primary script, Bitcoin Logarithmic Growth Curve 2024, available here . This foundational script details the regression-based approach used to model Bitcoin’s long-term price evolution.
Normalization Process
The core principle behind this oscillator lies in the normalization of Bitcoin’s price relative to the upper and lower regression boundaries. By applying Min-Max Normalization, we effectively scale the price into a bounded range, facilitating clearer trend analysis. The normalization follows the formula:
normalized price = (upper regresionline − lower regressionline) / (price − lower regressionline)
This transformation ensures that price movements are always mapped within a fixed range, preventing distortions caused by Bitcoin’s exponential long-term growth. Furthermore, this normalization technique has been applied to each of the confidence interval lines, allowing for a structured and systematic approach to analyzing Bitcoin’s historical and projected price behavior.
By representing the logarithmic growth curve in oscillator form, this indicator helps traders and analysts more effectively gauge Bitcoin’s position within its long-term growth trajectory while identifying potential opportunities based on historical price tendencies.

DR Oscillator 8 * Measures price deviation: Calculates the percentage difference between the closing price and a simple moving average.
* Defines upper and lower limits: User-defined upper and lower limits determine overbought and oversold conditions.
* Signal line: A simple moving average of the deviation is plotted as a signal line.
* Deviation smoothing (optional): The deviation can be smoothed using a moving average to create a smoother line.
* Additional signal line (optional): An additional signal line can be added for further analysis.
* Visual representation: The oscillator is plotted with different colors to indicate overbought, oversold, or neutral conditions.
* Background coloring: The background color changes based on the oscillator's value to provide visual cues for buy or sell signals.
In summary:
The DR Oscillator helps traders identify potential buying and selling opportunities by measuring the extent to which a security's price has deviated from its moving average. When the oscillator moves above the upper limit, it suggests that the asset may be overbought and due for a price correction. Conversely, when it moves below the lower limit, it may indicate an oversold condition and a potential buying opportunity.
However, it's important to note that the DR Oscillator is just one tool and should be used in conjunction with other technical indicators and fundamental analysis for more accurate trading decisions.

HV-RV Oscillator by DINVESTORQ(PRABIR DAS)Description:
The HV-RV Oscillator is a powerful tool designed to help traders track and compare two types of volatility measures: Historical Volatility (HV) and Realized Volatility (RV). This indicator is useful for identifying periods of market volatility and can be employed in various trading strategies. It plots both volatility measures on a normalized scale (0 to 100) to allow easy comparison and analysis.
How It Works:
Historical Volatility (HV):
HV is calculated by taking the log returns of the closing prices and finding the standard deviation over a specified period (default is 14 periods).
The value is then annualized assuming 252 trading days in a year.
Realized Volatility (RV):
RV is based on the True Range, which is the maximum of the current high-low range, the difference between the high and the previous close, and the difference between the low and the previous close.
Like HV, the standard deviation of the True Range over a specified period is calculated and annualized.
Normalization:
Both HV and RV values are normalized to a 0-100 scale, making it easy to see their relative magnitude over time.
The highest and lowest values within the period are used to normalize the data, which smooths out short-term volatility spikes.
Smoothing:
The normalized values of both HV and RV are then smoothed using a Simple Moving Average (SMA) to reduce noise and provide a clearer trend.
Crossover Signals:
Buy Signal : When the Normalized HV crosses above the Normalized RV, it indicates that the historical volatility is increasing relative to the realized volatility, which could be interpreted as a buy signal.
Sell Signal : When the Normalized HV crosses below the Normalized RV, it suggests that the historical volatility is decreasing relative to the realized volatility, which could be seen as a sell signal.
Features:
Two Volatility Lines: The blue line represents Normalized HV, and the orange line represents Normalized RV.
Neutral Line: A gray dashed line at the 50 level indicates a neutral state between the two volatility measures.
Buy/Sell Markers: Green upward arrows are shown when the Normalized HV crosses above the Normalized RV, and red downward arrows appear when the Normalized HV crosses below the Normalized RV.
Inputs:
HV Period: The number of periods used to calculate Historical Volatility (default = 14).
RV Period: The number of periods used to calculate Realized Volatility (default = 14).
Smoothing Period: The number of periods used for smoothing the normalized values (default = 3).
How to Use:
This oscillator is designed for traders who want to track the relationship between Historical Volatility and Realized Volatility.
Buy signals occur when HV increases relative to RV, which can indicate increased market movement or potential breakout conditions.
Sell signals occur when RV is greater than HV, signaling reduced volatility or potential trend exhaustion.
Example Use Cases:
Breakout/Trend Strategy: Use the oscillator to identify potential periods of increased volatility (when HV crosses above RV) for breakout trades.
Mean Reversion: Use the oscillator to detect periods of low volatility (when RV crosses above HV) that might signal a return to the mean or consolidation.
This tool can be used on any asset class such as stocks, forex, commodities, or indices to help you make informed decisions based on the comparison of volatility measures.
NOTE: FOR INTRDAY PURPOSE USE 30/7/9 AS SETTING AND FOR DAY TRADE USE 14/7/9

Detrended Price Oscillator [NexusSignals]Detrended Price Oscillator (DPO) is a detrended price oscillator, used in technical analysis, strips out price trends in an effort to estimate the length of price cycles from peak to peak or trough to trough.
DPO is not a momentum indicator, instead highlights peaks and troughs in price, which are used to estimate buy and sell points in line with the historical cycle. (cf. to investopedia)
DPO indicator made by NexusSignals components :
a filled area that allow users to see easy the trend of an asset;
a sma moving average on chart (default length is 20)
a 20 sma on oscillator, both ma's are color coded to show uptrend / downtrend
a donchian channel applied to the dpo to show breakouts, breakdowns and resistances/support, reversals
few alerts for price crossing above ma, cross above the 0 dpo line, and for cross above and below the donchian channels top and bottom
How you can use DPO indicator ?
The detrended price oscillator (DPO) can be used for measuring the distance between peaks and troughs in the indicator that may help traders to make future decisions as they can locate the most recent trough and determine when the next one may occur in the meassured distance on oscillator between peaks and troughs.
You can use the indicator to find the potential price reversals, for example when the price of an asset is in a bearish trend and the dpo is bouncing from the donchian channel bottom, that may be a potential swing low for that asset, same thing in a bullish trend when the dpo rejecting at top of donchian channel may be a trend reversal, a pullback or swing high.
When DPO is above the 0 trend is in an uptrend and when dpo is below the zero the asset is possible to move into a downtrend.
Also crosses of DPO above and below the DPO moving average may signalising a trend change.

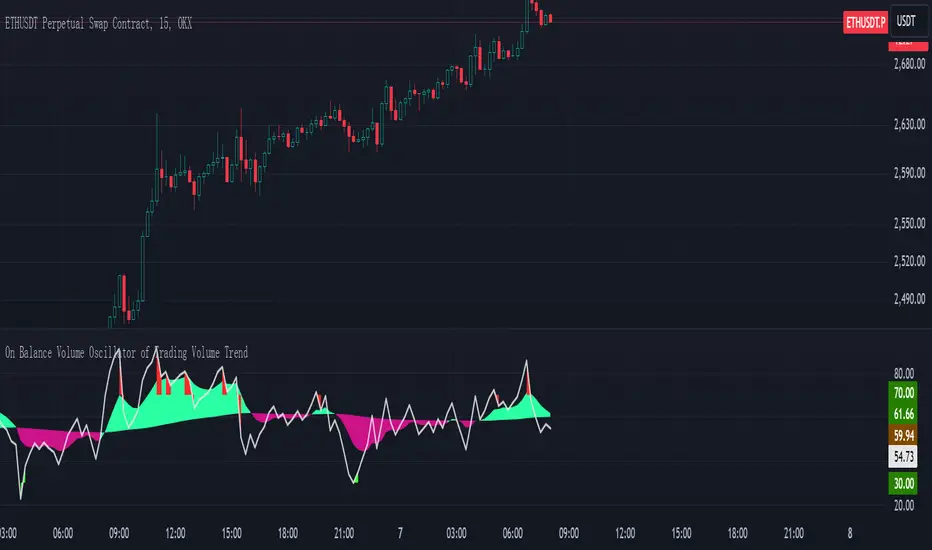
On Balance Volume Oscillator of Trading Volume TrendOn Balance Volume Oscillator of Trading Volume Trend
Introduction
This indicator, the "On Balance Volume Oscillator of Trading Volume Trend," is a technical analysis tool designed to provide insights into market momentum and potential trend reversals by combining the On Balance Volume (OBV) and Relative Strength Index (RSI) indicators.
Calculation and Methodology
* OBV Calculation: The indicator first calculates the On Balance Volume, which is a cumulative total of the volume of up days minus the volume of down days. This provides a running tally of buying and selling pressure.
* RSI of OBV: The RSI is then applied to the OBV values to smooth the data and identify overbought or oversold conditions.
* Exponential Moving Averages (EMAs): Two EMAs are calculated on the RSI of OBV. A shorter-term EMA (9-period in this case) and a longer-term EMA (100-period) are used to generate signals.
Interpretation and Usage
* EMA Crossovers: When the shorter-term EMA crosses above the longer-term EMA, it suggests increasing bullish momentum. Conversely, a downward crossover indicates weakening bullish momentum or increasing bearish pressure.
* RSI Divergences: Divergences between the price and the indicator can signal potential trend reversals. For example, if the price is making new highs but the indicator is failing to do so, it could be a bearish divergence.
* Overbought/Oversold Conditions: When the RSI of OBV is above 70, it suggests the market may be overbought and a potential correction could be imminent. Conversely, when it is below 30, it suggests the market may be oversold.
Visual Representation
The indicator is plotted on a chart with multiple lines and filled areas:
* Two EMAs: The shorter-term EMA and longer-term EMA are plotted to show the trend of the OBV.
* Filled Areas: The area between the two EMAs is filled with a color to indicate the strength of the trend. The color changes based on whether the shorter-term EMA is above or below the longer-term EMA.
* RSI Bands: Horizontal lines at 30 and 70 mark the overbought and oversold levels for the RSI of OBV.
Summary
The On Balance Volume Oscillator of Trading Volume Trend provides a comprehensive view of market momentum and can be a valuable tool for traders. By combining the OBV and RSI, this indicator helps identify potential trend reversals, overbought and oversold conditions, and the strength of the current trend.
Note: This indicator should be used in conjunction with other technical analysis tools and fundamental analysis to make informed trading decisions.
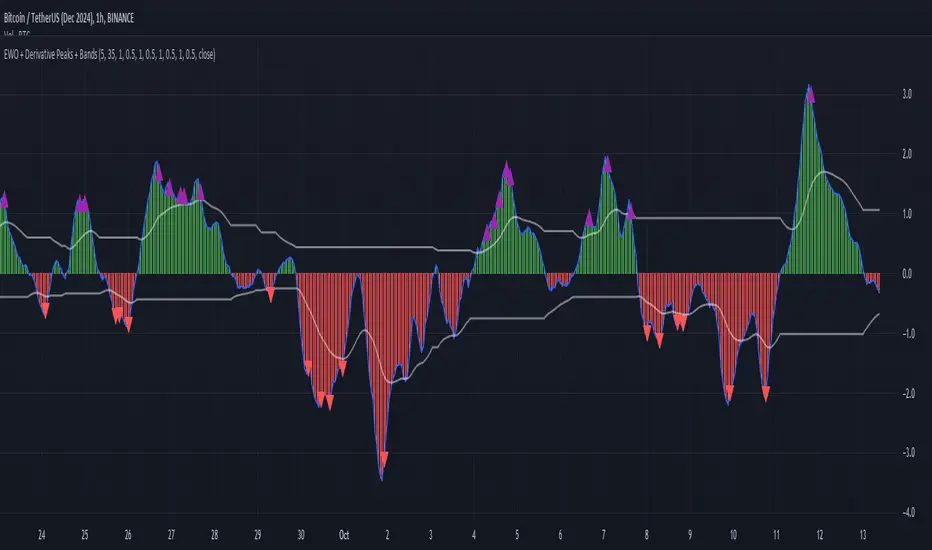
Elliott Wave Oscillator with Peak DetectionThe Elliott Wave Oscillator with Derivative Peak Detection and Breakout Bands is a technical indicator that blends traditional Elliott Wave theory with modern derivative-based peak detection and breakout bands for a clearer view of market trends.
Key Components:
Elliott Wave Oscillator (EWO):
The core of the indicator is based on the difference between two simple moving averages (SMA): a short-term SMA (default length: 5) and a long-term SMA (default length: 35).
This difference is expressed either as an absolute value or a percentage of the current price, depending on the user’s input.
Smoothing:
The EWO is smoothed using an Exponential Moving Average (EMA) to filter out noise and provide a clearer trend direction.
The smoothing length is adaptive based on the current chart's timeframe (e.g., longer smoothing for daily charts).
Derivative Peak Detection:
The smoothed EWO is analyzed for peaks (positive) and troughs (negative) by calculating the derivative (rate of change) between consecutive values.
Peaks are detected when the derivative transitions from positive to negative, while troughs are identified when the derivative switches from negative to positive.
Tolerance levels are adjustable and vary by timeframe to avoid false signals.
Breakout Bands:
Upper and lower breakout bands are dynamically generated based on the smoothed EWO.
The bands help to filter significant peaks and troughs, only highlighting those that occur beyond the breakout levels.
Users can choose to display these bands and use them to filter out less significant peaks and troughs.
Visualization:
The original, unsmoothed EWO is plotted as a histogram, with positive values in green and negative values in red.
The smoothed EWO is plotted as a blue line, providing a clearer view of the underlying trend.
The breakout bands, if enabled, are plotted as white lines to visualize the upper and lower bounds of the oscillator's movement.
Positive peaks and negative troughs that meet the filtering criteria are marked with purple triangles (for peaks) and red triangles (for troughs) on the chart.
Customization Options:
Timeframe-based Smoothing and Tolerance: Different smoothing lengths and tolerance levels can be set for daily, hourly, and 5-minute charts.
Breakout Bands: Users can toggle the display of breakout bands and adjust their visual properties.
Peak Filtering: Peaks and troughs can be filtered based on whether they break out beyond the bands, or all peaks can be shown.
This indicator provides a unique blend of trend detection through the Elliott Wave Oscillator and derivative analysis to highlight significant market reversals while offering breakout bands as a filtering mechanism for false signals.
Fair Value Gaps Mitigation Oscillator [LuxAlgo]The Fair Value Gaps Mitigation Oscillator is an oscillator based on the traditional Fair Value Gaps (FVGs) imbalances. The oscillator displays the current total un-mitigated values for the number of FVGs chosen by the user.
The indicator also displays each New FVG as a bar representing the current ratio of the New FVG in relation to the current un-mitigated total for its direction.
🔶 USAGE
When an FVG forms, it is often interpreted as strong market sentiment in the direction of the gap. For example, an upward FVG during an uptrend is typically seen as a confirmation of the strength and continuation of the trend, as it indicates that buyers are willing to purchase at higher prices without much resistance, suggesting strong demand and positive sentiment.
By analyzing the mitigation (or lack thereof), we can visualize the increase of directional strength in a trend. This is where the proposed oscillator is useful.
🔶 DETAILS
The oscillator's values are expressed as Percentages (%). Each FVG is allocated 100% of the total of its width with a max potential value of 100 and minimum potential value of 0.
Based on the "FVG Lookback" Input, the FVGs are scaled to fit within the range of +1 to -1. Using a higher "FVG Lookback" value will allow you to get indications of longer-term trends.
A higher value of the normalized bullish FVG areas suggest a stronger and cleaner uptrend, while lower values of the bearish the normalized bullish FVG areas suggest a stronger and cleaner downtrend.
+1 or -1 indicates that there is a Full Lookback of FVGs, and each one is fully un-mitigated, and the opposite direction of FVGs is entirely Mitigated.
When the price closes over/under or within an FVG it begins to get mitigated, when this happens the % of mitigation is subtracted from the total.
When a New FVG is formed, a Histogram bar is created representing the ratio of the current FVG's width to the total width off all un-mitigated FVGs.
The entire bar represents 100% of total un-mitigated FVG Width.
The filled area represents the current FVG's width relative to the whole.
A 50% hash mark is also displayed for reference.
🔶 SETTINGS
FVG Lookback - Determines the number of FVGs (Bullish and Bearish Pairs) to keep in memory for analysis.

WaveTrendnel Oscillator [UAlgo]🔶Description:
The WaveTrendnel Oscillator, is a technical analysis tool designed for traders to identify potential trend reversals and overbought/oversold conditions in the market. It combines the concepts of wave analysis and trend analysis to generate signals based on the current market conditions. This indicator aims to provide traders with insights into the strength and direction of the prevailing trend, facilitating better decision-making in trading strategies.
🔶Key Features:
Customizable Parameters: Users can customize various parameters including the source data, channel length, average length, and signal length according to their trading preferences and market conditions.
Signal Display: The indicator offers the option to display buy and sell signals on the chart, helping traders to visually identify potential entry and exit points.
Wave and Kernel Analysis: The WaveTrendnel Oscillator utilizes a rational quadratic kernel function, which applies a mathematical approach known as the kernel method. This method analyzes historical price data by assigning weights to each data point based on its proximity to the current period, providing a smoother and more accurate representation of market trends.
Overbought/Oversold Levels: Traders can define overbought and oversold levels using customizable threshold parameters, enabling them to identify potential reversal points in the market.
🔶Credit:
The WaveTrendnel Oscillator indicator is a modification of the original WaveTrend Oscillator developed by @LazyBear on TradingView.
🔶Disclaimer:
Use with Caution: This indicator is provided for educational and informational purposes only and should not be considered as financial advice. Users should exercise caution and perform their own analysis before making trading decisions based on the indicator's signals.
Not Financial Advice: The information provided by this indicator does not constitute financial advice, and the creator (UAlgo) shall not be held responsible for any trading losses incurred as a result of using this indicator.
Backtesting Recommended: Traders are encouraged to backtest the indicator thoroughly on historical data before using it in live trading to assess its performance and suitability for their trading strategies.
Risk Management: Trading involves inherent risks, and users should implement proper risk management strategies, including but not limited to stop-loss orders and position sizing, to mitigate potential losses.
No Guarantees: The accuracy and reliability of the indicator's signals cannot be guaranteed, as they are based on historical price data and past performance may not be indicative of future results.

Advanced Volatility Oscillator with SignalsTitle: Advanced Volatility Oscillator with Signals (AVO-S)
In-Depth Description:
Introduction:
The Advanced Volatility Oscillator with Signals (AVO-S) is designed to offer traders a nuanced understanding of market volatility, combining traditional concepts with innovative visual aids and signal interpretation. This indicator is tailored for diverse financial markets, helping to identify potential trend reversals and momentum shifts.
Calculation and Methodology:
Spike Calculation: The core of AVO-S is the 'spike', calculated as the difference between the closing and opening prices (spike = close - open). This measure provides a straightforward gauge of intra-period volatility.
Standard Deviation: The indicator employs standard deviation to assess the variability of the 'spike', offering a dynamic threshold for understanding market extremities (stdDev = stdev(spike, length)).
Colored Columns: These columns visually represent the 'spike'. Their color changes based on the spike’s value relative to the zero line and the standard deviation threshold, providing an immediate visual cue of market state.
Blue Columns: Indicate moderate positive movement when the spike is above zero but below the standard deviation.
Green and Red Columns: Suggest stronger bullish (above standard deviation) and bearish (below negative standard deviation) movements, respectively.
Bullish and Bearish Signals:
The indicator generates signals based on the relationship between the 'spike' and its standard deviation.
Bullish Signals: Shown as upward triangles, these are formed when the 'spike' crosses above the standard deviation, indicating potential upward momentum.
Bearish Signals: Represented by downward triangles, these signals are generated when the 'spike' falls below the negative standard deviation, hinting at potential downward trends.
Usage and Application:
Traders can use the colored columns to quickly assess market sentiment and volatility.
The bullish and bearish signals serve as potential indicators for market entry or exit points, or for further analysis in conjunction with other technical tools.
Inspiration and Credits:
Inspired by Veryfid's original Volatility Oscillator, the AVO-S refines and builds upon these ideas to provide a comprehensive and user-friendly tool for market analysis. This indicator is a testament to the continuous evolution of technical analysis tools in the trading community.

True Trend Oscillator [wbburgin]The True Trend oscillator identifies trending or ranging markets with a stochastic ATR and RSI. Here are some examples for how it can be used.
Uptrends
If the candlesticks are lime green, this signals an uptrend. On the oscillator, you can identify an uptrend if the bull strength (the green line) is above the bear strength (the red line). The strength of the uptrend and the downtrend can be found by looking at the slope of these lines.
Downtrends
If the candlesticks are red, this signals a downtrend. On the oscillator, notice how the bear strength line is above the bull strength line.
Ranging Markets and Pullbacks
The True Trend oscillator can also be used to identify ranging markets or pullbacks. Let's look at the previous example again:
If you notice that the bull and bear lines are bouncing above the red weak-trend zone (as in the example above), this signals an extended trend. On the contrary, when the bull and bear lines fall into the weak-trend zone, this may indicate a larger pullback or a range to look to enter a trade again, as in this example, where the ranging candles in gray demonstrate temporary pullbacks in a larger bullish trend:
Ranges can also occur before trend reversals, so a range may also indicate a smart time to secure profits.
You can customize the ranging threshold in the settings. It can be set from 0-100 because the indicator is a stochastic.
Hope you all find this indicator useful!

Volume Flow OscillatorIntroducing the "Volume Flow Oscillator" indicator, a powerful and adaptable tool that incorporates the PeacefulIndicators library to analyze price movement strength and volume in the market. This indicator is designed to assist you in detecting potential opportunities and improving your trading analysis.
The Volume Flow Oscillator indicator offers the following features:
Adjustable input parameters, allowing you to modify the source (HLCC4 by default) and the short length to match your trading style and preferences.
A visually appealing display, with the Volume Flow Oscillator line in orange, a zero line in gray, and filled areas between the 70 and -70 levels in blue, making it easy to interpret the indicator's signals.
The core functionality of the Volume Flow Oscillator indicator is powered by the volume_flow_oscillator function from the PeacefulIndicators library, ensuring accurate and reliable results.
To start using the Volume Flow Oscillator indicator in your trading analysis, simply add the script to your chart and customize the input parameters as needed. We hope this script, built upon the PeacefulIndicators library, proves to be a valuable addition to your trading strategy.

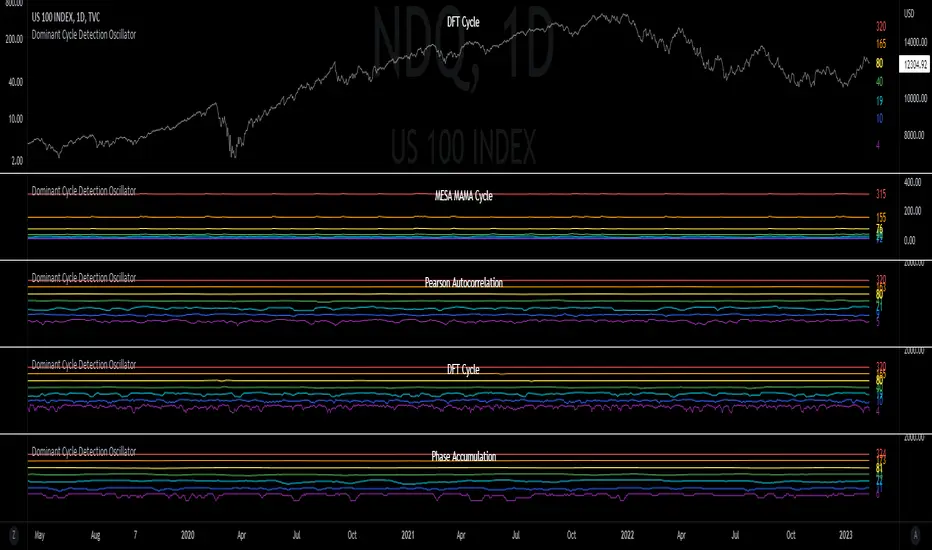
Dominant Cycle Detection OscillatorThis is a Dominant Cycle Detection Oscillator that searches multiple ranges of wavelengths within a spectrum. Choose one of 4 different dominant cycle detection methods (MESA MAMA cycle, Pearson Autocorrelation, Discreet Fourier Transform, and Phase Accumulation) to determine the most dominant cycles and see the historical results. Straight lines can indicate a steady dominant cycle; while Wavy lines might indicate a varying dominant cycle length. The steadier the cycle, the easier it may be to predict future events in that cycle (keep the log scale in mind when considering steadiness). The presence of evenly divisible (or harmonic) cycle lengths may also indicate stronger cycles; for example, 19, 38, and 76 dominant lengths for the 2x, 4x, and 8x cycles. Practically, a trader can use these cycle outputs as the default settings for other Hurst/cycle indicators. For example, if you see dominant cycle oscillator outputs of 38 & 76 for the 4x and 8x cycle respectively, you might want to test/use defaults of 38 & 76 for the 4x & 8x lengths in the bandpass, diamond/semi-circle notation, moving average & envelope, and FLD instead of the defaults 40 & 80 for a more fine-tuned analysis.
Muting the oscillator's historical lines and overlaying the indicator on the chart can visually cue a trader to the cycle lengths without taking up extra panes. The DFT Cycle lengths with muted historical lines have been overlayed on the chart in the photo.
The y-axis scale for this indicator's pane (just the oscillator pane, not the chart) most likely needs to be changed to logarithmic to look normal, but it depends on the search ranges in your settings. There are instructions in the settings. In the photo, the MESA MAMA scale is set to regular (not logarithmic) which demonstrates how difficult it can be to read if not changed.
In the Spectral Analysis chapter of Hurst's book Profit Magic, he recommended doing a Fourier analysis across a spectrum of frequencies. Hurst acknowledged there were many ways to do this analysis but recommended the method described by Lanczos. Currently in this indicator, the closest thing to the method described by Lanczos is the DFT Discreet Fourier Transform method.
Shoutout to @lastguru for the dominant cycle library referenced in this code. He mentioned that he may add more methods in the future.
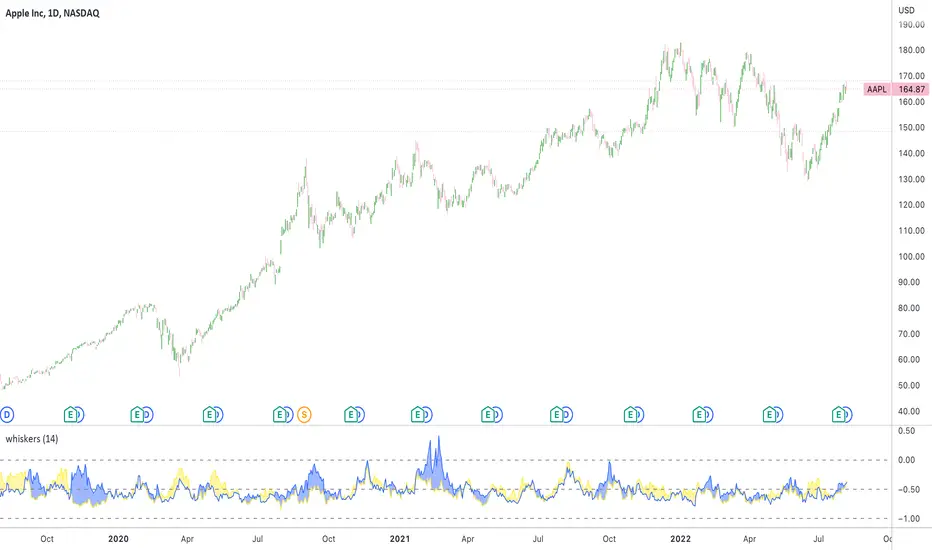
Whisker Reversal Oscillator [SpiritualHealer117]The Whisker Reversal Oscillator can be used to spot strength or weakness in trends. It is designed for stocks, commodities and forex trading, and is intended to be calculated from the high, close, low, and open over a given length.
Features:
The Whisker Reversal Oscillator shows the average length of the top and bottom whiskers on candlesticks over a defined length. It plots the percentage difference between the whiskers and the length of the body, with the yellow line representing the average length of the top whisker, and the bottom line indicating the average length of the bottom whisker.
Interpreting the signals:
The Whisker Reversal Oscillator is interpreted in the same way as a candlestick reversal pattern, where it being bullish or bearish depends on the trend. In a bull trend, if the yellow line passes above the blue line, it means the top whiskers are longer on average than the bottom whiskers, which may show that bulls were too weak to hold a rally, and signal a reversal. On the other hand, in a bear trend, if the yellow line is above the blue line, it indicates that the bulls were able to push the price up, which would be bullish. If the blue line crosses over the yellow line in an uptrend, it's often a bearish sign, but if it happens in a downtrend, its a bullish sign.
Generally speaking, a cross in the lines is indicative of a potential reversal, and when the lines cross over 1, it means that the whiskers were bigger than the candlestick bodies over your selected length, indicating that a big swing will come.
Smoothed RSI Heikin Ashi Oscillator w/ Expanded Types [Loxx]Smoothed RSI Heikin-Ashi Oscillator w/ Expanded Types is a spin on Heikin Ashi RSI Oscillator by @JayRogers. The purpose of this modification is to reduce noise in the original version thereby increasing suitability of the signal output. This indicator is tuned for Forex markets.
Differences:
35+ Smoothing Options for RSI
35+ Smoothing Options for HA Candles
Heiken-Ashi Better Expanded Source input. This source input is use for the RSI calculation only.
Signals
Alerts
What are Heiken-Ashi "better" candles?
The "better formula" was proposed in an article/memo by BNP-Paribas (In Warrants & Zertifikate, No. 8, August 2004 (a monthly German magazine published by BNP Paribas, Frankfurt), there is an article by Sebastian Schmidt about further development (smoothing) of Heikin-Ashi chart.)
They proposed to use the following :
(Open+Close)/2+(((Close-Open)/( High-Low ))*ABS((Close-Open)/2))
instead of using :
haClose = (O+H+L+C)/4
According to that document the HA representation using their proposed formula is better than the traditional formula.
What are traditional Heiken-Ashi candles?
The Heikin-Ashi technique averages price data to create a Japanese candlestick chart that filters out market noise.
Heikin-Ashi charts, developed by Munehisa Homma in the 1700s, share some characteristics with standard candlestick charts but differ based on the values used to create each candle. Instead of using the open, high, low, and close like standard candlestick charts, the Heikin-Ashi technique uses a modified formula based on two-period averages. This gives the chart a smoother appearance, making it easier to spots trends and reversals, but also obscures gaps and some price data.
Future updates
Expand signal options to include RSI-, Zero-, and color-crosses

Boom Hunter + Hull Suite + Volatility Oscillator StrategyTRADE CONDITIONS
Long entry:
Boom Hunter (leading indicator): Trigger line crosses over Quotient 2 line (white cross over red)
Hull Suite (trend confirmation): Price closed above hull suite line and hull suite is green (represented by horizontal line at -10 in strategy pane)
Volatility Oscillator (volatility confirmation): Volatility spike trigger line is above upper band (represented by horizontal line at -30 in strategy pane)
Short entry:
Boom Hunter (leading indicator): Trigger line crosses under Quotient 2 line (white cross under red)
Hull Suite (trend confirmation): Price closed below hull suite line and hull suite is red (represented by horizontal line at -10 in strategy pane)
Volatility Oscillator (volatility confirmation): Volatility spike trigger line is below lower band (represented by horizontal line at -30 in strategy pane)
Risk management:
Each trade risks 3% of account (configurable in settings)
SL size determined by swing low/high of previous X candles (configurable in settings) or 1 ATR if swing is less than 1 ATR
TP is calculated by Risk:Reward ratio (configurable in settings)
TIPS
Timeframe: I have found good results running on BTC/USDT 5M chart
Note: To help visual identification of trade entries and exits you may wish to add the Hull Suite and Volatility Oscillator to the chart separately. It was not possible to display them in a clear way within a single panel for the strategy. Make sure you set the settings of the auxiliary indicators to match what is in the settings of this indicator if you do decide to add them.
CREDITS
Boom Hunter Pro by veryfid
Hull Suite by InSilico
Volatility Oscillator by veryfid

+ REX OscillatorSo, what is the REX oscillator, you might be asking yourself.
"The Rex oscillator is an indicator that measures market behavior based on the relationship of the close to the open, high and low values of the same bar. A big difference between the high and close on a bar indicates weakness, and wide disparity between the low and close indicates strength. The difference between open and close also indicates market performance."
The True Value of a Bar (TVB) gives an indication of how healthy the market is. A negative close and a positive TVB (or vice versa) is an indication of the market building strength on the opposing side of the trend. The Rex oscillator is a moving average of the TVB value with the specified period.
I first came across this watching one of many No Nonsense Forex videos. Mostly, from comments I've read, it is used as an exit indicator for people who trade with a system similar or identical to the one VP espouses in his NNFX blog. I think it's perfectly apt to use as an entry indicator as well, or even as both, perhaps, depending on the moving average you chose to apply to the TVB.
There are a few other versions of this on tradingview, but I thought I'd make an updated version. Added Donchian Channels because I like the idea of a dynamic sort of overbought/sold area. I left out the basis because the indicator pivots around a center line, and has a signal line as well. A basis line just seemed like too much, and would likely not be very useful.
The additional usual things that I incorporate into my indicators are included here: optional candle coloring, alerts, and probably a too large selection of moving averages.
Credit to Nemozny for the FRAMA calculation. I may add that to other indicators I have.

[blackcat] L2 Ehlers Fisherized Deviation Scaled OscillatorLevel: 2
Background
John F. Ehlers introuced Fisherized Deviation Scaled Oscillator in Oct, 2018.
Function
In “Probability—Probably A Good Thing To Know,” John Ehlers introduces a procedure for measuring an indicator’s probability distribution to determine if it can be used as part of a reversion-to-the-mean trading strategy. Dr. Ehlers demonstrates this method with several of his existing indicators and presents a new indicator that he calls a deviation-scaled oscillator with Fisher transform. It charts the probability density of an oscillator to evaluate its applicability to swing trading.
Key Signal
FisherFilt --> Ehlers Fisherized Deviation Scaled Oscillator fast line
Trigger --> Ehlers Fisherized Deviation Scaled Oscillator slow line
Pros and Cons
100% John F. Ehlers definition translation, even variable names are the same. This help readers who would like to use pine to read his book.
Remarks
The 91th script for Blackcat1402 John F. Ehlers Week publication.
Readme
In real life, I am a prolific inventor. I have successfully applied for more than 60 international and regional patents in the past 12 years. But in the past two years or so, I have tried to transfer my creativity to the development of trading strategies. Tradingview is the ideal platform for me. I am selecting and contributing some of the hundreds of scripts to publish in Tradingview community. Welcome everyone to interact with me to discuss these interesting pine scripts.
The scripts posted are categorized into 5 levels according to my efforts or manhours put into these works.
Level 1 : interesting script snippets or distinctive improvement from classic indicators or strategy. Level 1 scripts can usually appear in more complex indicators as a function module or element.
Level 2 : composite indicator/strategy. By selecting or combining several independent or dependent functions or sub indicators in proper way, the composite script exhibits a resonance phenomenon which can filter out noise or fake trading signal to enhance trading confidence level.
Level 3 : comprehensive indicator/strategy. They are simple trading systems based on my strategies. They are commonly containing several or all of entry signal, close signal, stop loss, take profit, re-entry, risk management, and position sizing techniques. Even some interesting fundamental and mass psychological aspects are incorporated.
Level 4 : script snippets or functions that do not disclose source code. Interesting element that can reveal market laws and work as raw material for indicators and strategies. If you find Level 1~2 scripts are helpful, Level 4 is a private version that took me far more efforts to develop.
Level 5 : indicator/strategy that do not disclose source code. private version of Level 3 script with my accumulated script processing skills or a large number of custom functions. I had a private function library built in past two years. Level 5 scripts use many of them to achieve private trading strategy.

Combo Strategy 123 Reversal & Fractal Chaos OscillatorThis is combo strategies for get a cumulative signal.
First strategy
This System was created from the Book "How I Tripled My Money In The
Futures Market" by Ulf Jensen, Page 183. This is reverse type of strategies.
The strategy buys at market, if close price is higher than the previous close
during 2 days and the meaning of 9-days Stochastic Slow Oscillator is lower than 50.
The strategy sells at market, if close price is lower than the previous close price
during 2 days and the meaning of 9-days Stochastic Fast Oscillator is higher than 50.
Second strategy
The value of Fractal Chaos Oscillator is calculated as the difference between
the most subtle movements of the market. In general, its value moves between
-1.000 and 1.000. The higher the value of the Fractal Chaos Oscillator, the
more one can say that it follows a certain trend – an increase in prices trend,
or a decrease in prices trend.
Being an indicator expressed in a numeric value, traders say that this is an
indicator that puts a value on the trendiness of the markets. When the FCO reaches
a high value, they initiate the “buy” operation, contrarily when the FCO reaches a
low value, they signal the “sell” action. This is an excellent indicator to use in
intra-day trading.
WARNING:
- For purpose educate only
- This script to change bars colors.

[blackcat] L1 Composite RSI Trend OscillatorLevel: 1
Background
The Relative Strength Index (RSI) is a technical indicator for analyzing financial markets. It is intended to represent the current and historical strength or weakness of a trading pair or a market based on the closing prices of a last trading period.
Function
L1 Composite RSI Trend Oscillator utilizes candles to indicate trend. E.g. yellow candles for bull and fuchsia candles for bear. NOTE: it is inverted to RSI from bull bear perspective. Colorful RSI with yellow indicating bull and fuchsia indicating bear.
Key Signal
lwr1 --> trend oscillator fast line (lwr1 >= lwr2 for bear)
lwr2 --> trend oscillator slow line (lwr1 < lwr2 for bull)
botzone --> bottom zone indicates oversold with green
topzone --> top zone indicates overbought with red
longentry --> long entry signal
shortentry --> short entry signal
Pros and Cons
Pros:
1. combines both the benefit of RSI response and trend oscillator candles
2. divergence can be observed easily
Cons:
1. It may satruate for extreme conditions of long and short.
2. Not accurate for long and short entries and need filtering out noise and fake signal.
Remarks
NA
Readme
In real life, I am a prolific inventor. I have successfully applied for more than 60 international and regional patents in the past 12 years. But in the past two years or so, I have tried to transfer my creativity to the development of trading strategies. Tradingview is the ideal platform for me. I am selecting and contributing some of the hundreds of scripts to publish in Tradingview community. Welcome everyone to interact with me to discuss these interesting pine scripts.
The scripts posted are categorized into 5 levels according to my efforts or manhours put into these works.
Level 1 : interesting script snippets or distinctive improvement from classic indicators or strategy. Level 1 scripts can usually appear in more complex indicators as a function module or element.
Level 2 : composite indicator/strategy. By selecting or combining several independent or dependent functions or sub indicators in proper way, the composite script exhibits a resonance phenomenon which can filter out noise or fake trading signal to enhance trading confidence level.
Level 3 : comprehensive indicator/strategy. They are simple trading systems based on my strategies. They are commonly containing several or all of entry signal, close signal, stop loss, take profit, re-entry, risk management, and position sizing techniques. Even some interesting fundamental and mass psychological aspects are incorporated.
Level 4 : script snippets or functions that do not disclose source code. Interesting element that can reveal market laws and work as raw material for indicators and strategies. If you find Level 1~2 scripts are helpful, Level 4 is a private version that took me far more efforts to develop.
Level 5 : indicator/strategy that do not disclose source code. private version of Level 3 script with my accumulated script processing skills or a large number of custom functions. I had a private function library built in past two years. Level 5 scripts use many of them to achieve private trading strategy.
