In den Scripts nach "oscillator" suchen

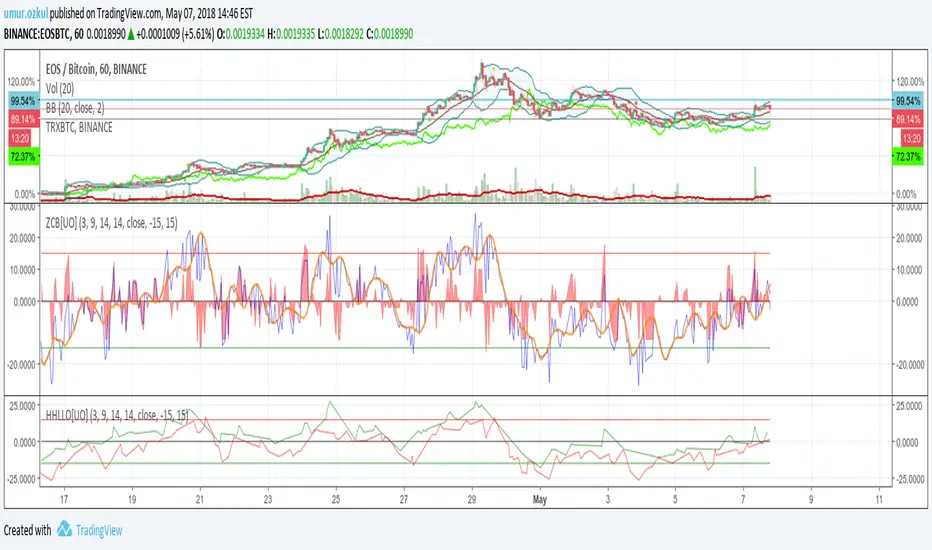
Higher High Lower Low OscillatorWith this oscillator you can see how higher and lows are developing against each other
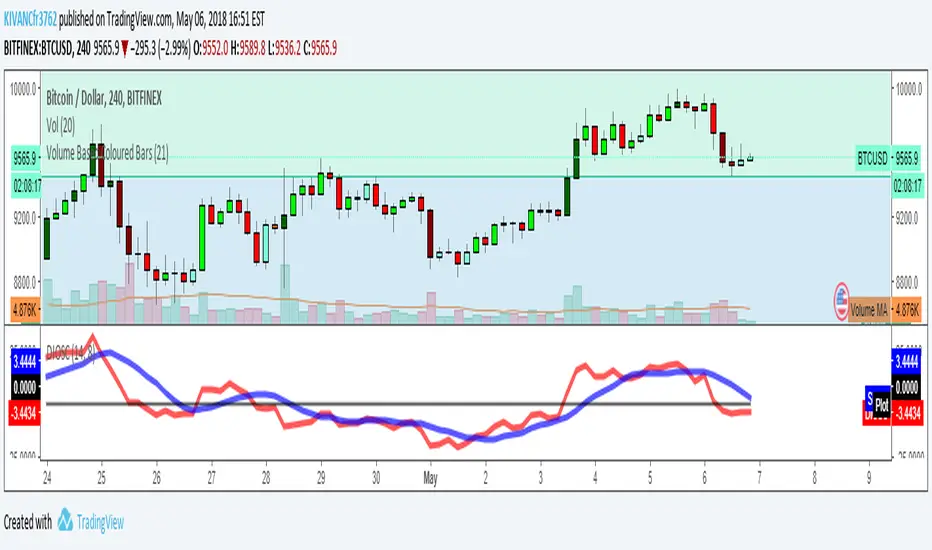
Directional Movement Oscillator by KIVANÇ fr3762Directional Movement Oscillator is simply the difference of Di+ and Di- which helps traders to see the crosses of BUY/SELL signals more effectively.
Di+ crosses above Di- when indicator crosses above 0 which can be considered as a BUY signal.
and conversely Di+ crosses below Di- when indicator crosses below 0 which can be considered as a SELL signal.
Additionally I put a second (OPTIONAL) line (Signal line) which is a 8 bar SMA ( Simple Moving Average ) of DMOSC to confirm signals for further assistance.
Users can add the second optional line (Signal Line) by checking the box : Show SMA line? on the INPUTS section of the indicator SETTINGS menu.

Recursive Median OscillatorRecursive Median Oscillator indicator script.
This indicator was originally developed by John F. Ehlers (Stocks & Commodities V. 36:03 (8–11): Recursive Median Filters).

CG Oscillator (Center of Gravity)CG Oscillator indicator script. This indicator was originally developed by John Ehlers.

Pretty Good OscillatorPretty Good Oscillator indicator script. This indicator was originally developed by Mark Johnson.

Chaikin Oscillator w/ crossovers [seiglerj]Added background shading to system Chaikin Oscillator to show crossovers more easily.

Chaikin Oscillator w/ crossover arrows [seiglerj]I added crossover arrows to the system Chaikin Oscillator to make crossovers easier to see

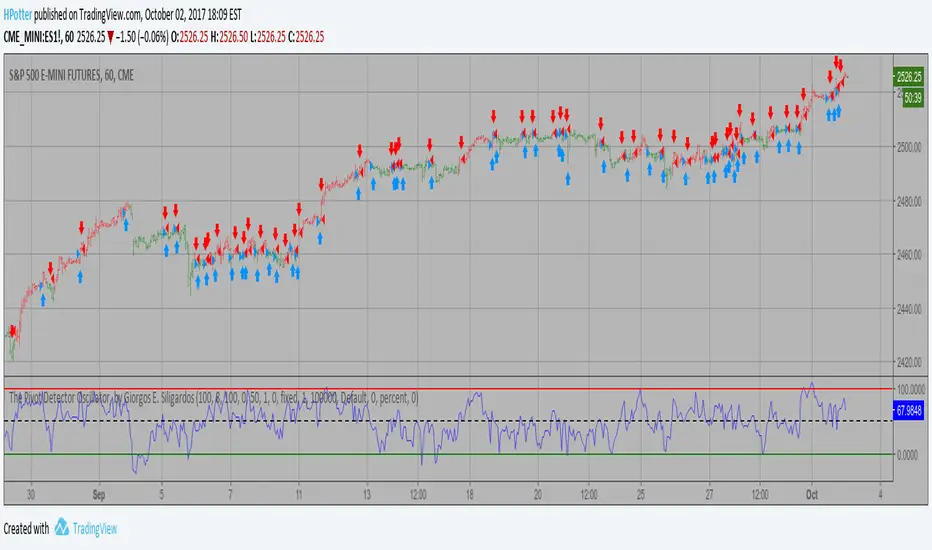
The Pivot Detector Oscillator Backtest The Pivot Detector Oscillator, by Giorgos E. Siligardos
The related article is copyrighted material from Stocks & Commodities 2009 Sep
You can change long to short in the Input Settings
WARNING:
- For purpose educate only
- This script to change bars colors.
The Pivot Detector Oscillator Strategy The Pivot Detector Oscillator, by Giorgos E. Siligardos
The related article is copyrighted material from Stocks & Commodities 2009 Sep
WARNING:
- This script to change bars colors.

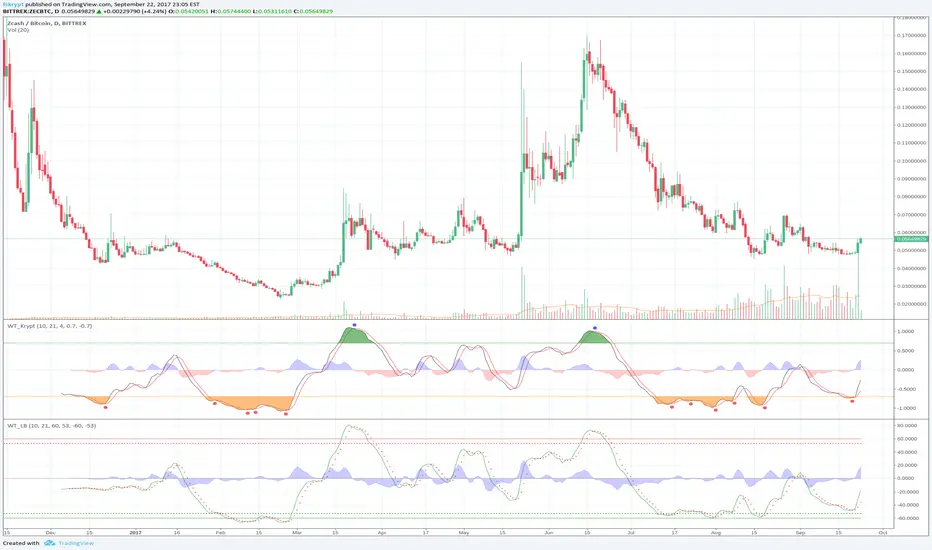
WaveTrend Oscillator [Krypt]This is similar to regular WaveTrend Oscillator except:
- replaces hlc3 input with a weighted log formula for better stability/performance on high volatility charts
- zero-centered scaling
- SMA crossovers above and below OB/OS thresholds are marked as buy/sell signals
Money Flow Indicator (Chaikin Oscillator) Strategy Indicator plots Money Flow Indicator (Chaikin). This indicator looks
to improve on Larry William's Accumulation Distribution formula that
compared the closing price with the opening price. In the early 1970's,
opening prices for stocks stopped being transmitted by the exchanges.
This made it difficult to calculate Williams' formula. The Chaikin
Oscillator uses the average price of the bar calculated as follows
(High + Low) /2 instead of the Open.
The indicator subtracts a 10 period exponential moving average of the
AccumDist function from a 3 period exponential moving average of the
AccumDist function.
WARNING:
This script to change bars colors.


Elliot Wave OscillatorEWO Indicator, helps to indentify waves
Similar like LazyBear's Indicator: ElliotWave Oscillator
I extended and changed the following:
Allow custom SMA interval default 5 and 35. Dont use EMAs
Choose input source: default close, f.e. use HL2
Show difference of SMAs in percent based on current candle default "true", this is very useful for historical charts

High & Low Oscillator 13x8 CrossOscillator for various uses, divergence versus price action and "0" crossing of trend/move change among others. Use with caution

LBR OscillatorOscillator used by Linda Bradford Raschke.
Basicly it's a MACD with 3/10/16 settings but without the histogram (difference between fast and slow line), instead the shown histogram is based on the fastline (green bars = fastline above zero). The color of the lines will tell you if the line is falling (red) or rising (green).
In terms of setups dont just buy or sell if a line is changing its color. Look for divergences or setups like first cross or anti.


Custom Reversal Oscillator [wjdtks255]📊 Indicator Overview: Custom Reversal Oscillator
This indicator is a momentum-based oscillator designed to identify potential trend reversals by analyzing price velocity and relative strength. It visualizes market exhaustion and recovery through a dynamic histogram and signal dots, similar to premium institutional tools.
Key Components
Dynamic Histogram (Bottom Bars): Changes color based on momentum strength. Bright Green/Red indicates accelerating momentum, while Darker shades suggest fading strength.
Signal Line: A white line tracing the core momentum, helping to visualize the "wave" of the market.
Buy/Sell Dots: Small circles at the bottom (Mint) or top (Red) that signal high-probability reversal points when the market is overextended.
📈 Trading Strategy (How to Trade)
1. Long Entry (Buy Signal)
Condition 1: The price should ideally be near or above the 200 EMA (for trend following) or showing a Bullish Divergence.
Condition 2: The Histogram bars transition from Dark Red to Bright Green.
Condition 3: A Mint Buy Dot appears at the bottom of the oscillator (near the -25 level).
Entry: Enter on the close of the candle where the Buy Dot is confirmed.
2. Short Entry (Sell Signal)
Condition 1: The price is struggling at resistance or showing a Bearish Divergence.
Condition 2: The Histogram bars transition from Dark Green to Bright Red.
Condition 3: A Red Sell Dot appears at the top of the oscillator (near the +25 level).
Entry: Enter on the close of the candle where the Sell Dot is confirmed.
3. Exit & Take Profit
Take Profit: Close the position when the Signal Line reaches the opposite extreme or when the histogram color starts to fade (loses its brightness).
Stop Loss: Place your stop loss slightly below the recent swing low (for Longs) or above the recent swing high (for Shorts).
💡 Pro Tips for Accuracy
Watch for Divergences: The most powerful signals occur when the price makes a lower low, but the Custom Reversal Oscillator makes a higher low. This indicates "Hidden Strength" and a massive reversal is often imminent.

Market Structure Oscillator [LuxAlgo]The Market Structure Oscillator indicator analyzes and synthesizes short-term, intermediate-term, and long-term market structure shifts and breaks, visualizing the output as oscillators and graphical representations of real-time market structures on the main price chart.
The oscillator presentation of the detected market structures helps traders visualize trend momentum and strength, identifying potential trend reversals, and providing different perspectives to enhance the analysis of classic market structures.
🔶 USAGE
A market structure shift signals a potential change in market sentiment or direction, while a break of structure indicates a continuation of the current trend. Detecting these events in real-time helps traders recognize both trend changes and continuations. The market structure oscillator translates these concepts visually, offering deeper insights into market momentum and strength. It aids traders in identifying overbought or oversold conditions, potential trend reversals, and confirming trend direction.
Oscillators often generate signals based on crossing certain thresholds or diverging from price movements, providing cues for traders to enter or exit positions.
The weights determine the influence of each period (short-term, intermediate-term, long-term) on the final oscillator value. By changing the weights, traders can emphasize or de-emphasize the importance of each period. Higher weights increase their respective market structure's influence on the oscillator value. For example, if the weight for the short-term period is set to 0, the final value of the oscillator will be calculated using only the intermediate-term and long-term market structures.
The indicator features a Cycle Oscillator component, which uses the market structure oscillator values to generate a histogram and provide further insights into market cycles and potential signals. The Cycle Oscillator aids in timing by allowing traders to more easily see the median length of an oscillation around the average point, helping them identify both favorable prices and favorable moments for trading.
Users can also display detected market structures on the price chart by enabling the corresponding market structure toggle from the "Market Structures on Chart" settings group.
🔶 DETAILS
The script initiates its analysis by detecting swing levels, which form the fundamental basis for its operations. It begins by identifying short-term swing points, automatically detected solely based on market movements without any reliance on user-defined input. Short-Term Swing Highs (STH) are peaks in price surrounded by lower highs on both sides, while Short-Term Swing Lows (STL) are troughs surrounded by higher lows.
To identify intermediate-term and long-term swing points, the script uses previously detected short-term swing points as reference points. It examines these points to determine intermediate-term swings and further analyzes intermediate-term swings to identify long-term swing points. This method ensures a thorough and unbiased evaluation of market dynamics, providing traders with reliable insights into market structures.
Once swing levels are detected, the process continues with the analysis of Market Structure Shifts (MSS) and Breaks of Structure (BoS). A Market Structure Shift, also known as a Change of Character (CHoCH), is a critical event in price action analysis that suggests a potential shift in market sentiment or direction. It occurs when the price reverses from an established trend, indicating that the current trend may be losing momentum and a reversal could be imminent.
On the other hand, a Break of Structure signifies the continuation of the existing market trend. This event occurs when the price decisively moves beyond a previous swing high or low, confirming the strength and persistence of the prevailing trend.
The indicator analyzes price patterns using a pure price action approach and identifies market structures for short-term, intermediate-term, and long-term periods. The collected data is then normalized and combined using specified weights to calculate the final Market Structure Oscillator value.
🔶 SETTINGS
The indicator incorporates user-defined settings, allowing users to tailor it according to their preferences and trading strategies.
🔹 Market Structure Oscillator
Market Structure Oscillator: Toggles the visibility of the market structures oscillator.
Short Term Weight: Defines the weight for the short-term market structure.
Intermediate Term Weight: Defines the weight for the intermediate-term market structure.
Long Term Weight: Defines the weight for the long-term market structure.
Oscillator Smoothing: Determines the smoothing factor for the oscillator.
Gradient Colors: Allows customization of bullish and bearish gradient colors.
Market Structure Oscillator Crosses: Provides signals based on market structure oscillator equilibrium level crosses.
🔹 Cycle Oscillator
Cycle Oscillator - Histogram: Toggles the visibility of the cycle oscillator.
Cycle Signal Length: Defines the length of the cycle signal.
Cycle Oscillator Crosses: Provides signals based on cycle oscillator crosses.
🔹 Market Structures on Chart
Market Structures: Allows plotting of market structures (short, intermediate, and long term) on the chart.
Line, Label, and Color: Options to display lines and labels for different market structures with customizable colors.
🔹 Oscillator Components
Oscillators: Separately plots short-term, intermediate-term, and long-term oscillators. Provides options to display these oscillators with customizable colors.
🔶 RELATED SCRIPTS
Market-Structures-(Intrabar)

TASC 2025.06 Cybernetic Oscillator█ OVERVIEW
This script implements the Cybernetic Oscillator introduced by John F. Ehlers in his article "The Cybernetic Oscillator For More Flexibility, Making A Better Oscillator" from the June 2025 edition of the TASC Traders' Tips . It cascades two-pole highpass and lowpass filters, then scales the result by its root mean square (RMS) to create a flexible normalized oscillator that responds to a customizable frequency range for different trading styles.
█ CONCEPTS
Oscillators are indicators widely used by technical traders. These indicators swing above and below a center value, emphasizing cyclic movements within a frequency range. In his article, Ehlers explains that all oscillators share a common characteristic: their calculations involve computing differences . The reliance on differences is what causes these indicators to oscillate about a central point.
The difference between two data points in a series acts as a highpass filter — it allows high frequencies (short wavelengths) to pass through while significantly attenuating low frequencies (long wavelengths). Ehlers demonstrates that a simple difference calculation attenuates lower-frequency cycles at a rate of 6 dB per octave. However, the difference also significantly amplifies cycles near the shortest observable wavelength, making the result appear noisier than the original series. To mitigate the effects of noise in a differenced series, oscillators typically smooth the series with a lowpass filter, such as a moving average.
Ehlers highlights an underlying issue with smoothing differenced data to create oscillators. He postulates that market data statistically follows a pink spectrum , where the amplitudes of cyclic components in the data are approximately directly proportional to the underlying periods. Specifically, he suggests that cyclic amplitude increases by 6 dB per octave of wavelength.
Because some conventional oscillators, such as RSI, use differencing calculations that attenuate cycles by only 6 dB per octave, and market cycles increase in amplitude by 6 dB per octave, such calculations do not have a tangible net effect on larger wavelengths in the analyzed data. The influence of larger wavelengths can be especially problematic when using these oscillators for mean reversion or swing signals. For instance, an expected reversion to the mean might be erroneous because oscillator's mean might significantly deviate from its center over time.
To address the issues with conventional oscillator responses, Ehlers created a new indicator dubbed the Cybernetic Oscillator. It uses a simple combination of highpass and lowpass filters to emphasize a specific range of frequencies in the market data, then normalizes the result based on RMS. The process is as follows:
Apply a two-pole highpass filter to the data. This filter's critical period defines the longest wavelength in the oscillator's passband.
Apply a two-pole SuperSmoother (lowpass filter) to the highpass-filtered data. This filter's critical period defines the shortest wavelength in the passband.
Scale the resulting waveform by its RMS. If the filtered waveform follows a normal distribution, the scaled result represents amplitude in standard deviations.
The oscillator's two-pole filters attenuate cycles outside the desired frequency range by 12 dB per octave. This rate outweighs the apparent rate of amplitude increase for successively longer market cycles (6 dB per octave). Therefore, the Cybernetic Oscillator provides a more robust isolation of cyclic content than conventional oscillators. Best of all, traders can set the periods of the highpass and lowpass filters separately, enabling fine-tuning of the frequency range for different trading styles.
█ USAGE
The "Highpass period" input in the "Settings/Inputs" tab specifies the longest wavelength in the oscillator's passband, and the "Lowpass period" input defines the shortest wavelength. The oscillator becomes more responsive to rapid movements with a smaller lowpass period. Conversely, it becomes more sensitive to trends with a larger highpass period. Ehlers recommends setting the smallest period to a value above 8 to avoid aliasing. The highpass period must not be smaller than the lowpass period. Otherwise, it causes a runtime error.
The "RMS length" input determines the number of bars in the RMS calculation that the indicator uses to normalize the filtered result.
This indicator also features two distinct display styles, which users can toggle with the "Display style" input. With the "Trend" style enabled, the indicator plots the oscillator with one of two colors based on whether its value is above or below zero. With the "Threshold" style enabled, it plots the oscillator as a gray line and highlights overbought and oversold areas based on the user-specified threshold.
Below, we show two instances of the script with different settings on an equities chart. The first uses the "Threshold" style with default settings to pass cycles between 20 and 30 bars for mean reversion signals. The second uses a larger highpass period of 250 bars and the "Trend" style to visualize trends based on cycles spanning less than one year:
