Bitcoin DAA OscillatorAn oscillator of Bitcoin's Daily Active Addresses (DAA) and fundamental metric of the utilization of the Bitcoin network.
Helps to identify:
Potential buy zones (green) - when the network utilization is low & increasing
Potential sell zones (red) - when the network utilization is high & decreasing
In den Scripts nach "oscillator" suchen

LBR 3-10 OscillatorThis is a variation of MACD popularised by Linda Bradford Raschke. Instead of the regular MACD settings, the this indicator uses simple moving averages, not exponential moving averages, and a setting of 3 for the fast MA, 10 for the slow MA and 16 for the signal line.
The signal line (red) acts as a trend indicator, with crossings of the zero line indicating trend changes, while the MACD line (blue) acts as a short term momentum indicator.
Setups:
- First cross: This is basically selling or buying at the first pullback after a trend change. Buy or sell after the signal line has crossed the zero line and the MACD crosses the signal line for the first time after the trend change. Use price action to time the entry after the pullback — you don't need to wait for the MACD to cross the signal line again.
- Pullback in a trend: The MACD crosses the signal line in the opposite direction of the trend irregardless of when the trend change occurred. Use price action to time the entry.
- Divergence: The MACD line shows a pattern diverging form price (e.g. makes higher lows whereas price makes lower lows). This can be an indication of trend reversal or waning.
In the indicator's input panel there is an option for showing standard deviation bands (turned off by default). MACD line crossing the standard deviation bands can indicate oversold and overbought conditions.
The indicator comes with the following alerts:
- First cross downtrend
- First cross uptrend
- Pullback in downtrend
- Pullback in uptrend
- Trend change down
- Trend change up
Sources:
lindaraschke.net
www.netpicks.com

Ehlers Center Of Gravity Oscillator [CC]The Center of Gravity Oscillator was created by John Ehlers (Cybernetic Analysis For Stocks And Futures pg 49) and this provides a pretty accurate way to see how the stock is trending. If the indicator stays above 0 then the stock is in a pretty strong uptrend and if it stays below 0 then the stock is in a pretty strong downtrend. Buy when the indicator changes from red to green and sell when it changes from green to red.
Let me know if you would like me to publish any other indicators or if you want something custom done!

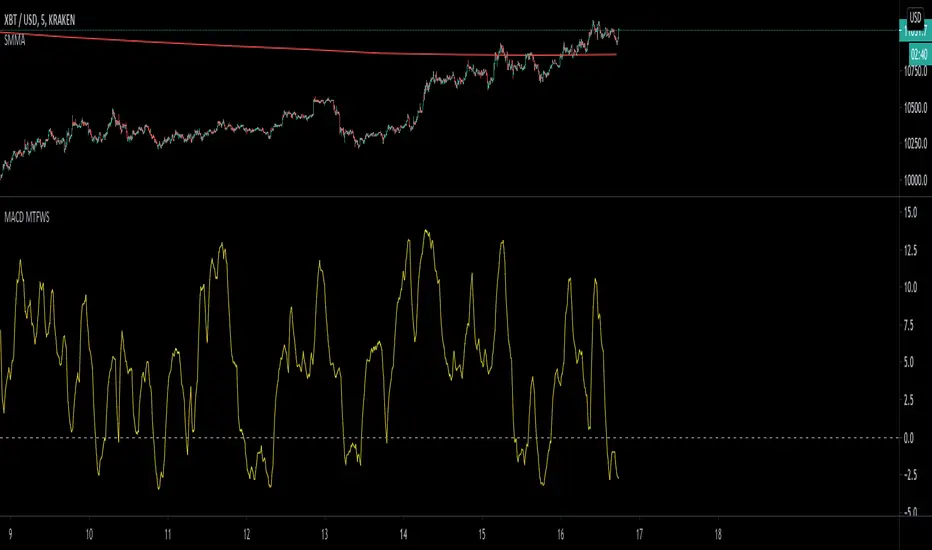
MACD Multiple Time Frames Weighted Momentum Score OscillatorThis script looks at the current momentum direction (up or down) for the 5 minute, 30 minute, 1 hour, 4 hour and daily and allows you to set scores of importance to these.
These scores are then added up to create an oscillator matching your preferences. Tune the indicator to match what you believe is the most important time frames that people use and score it accordingly. The values I put by default are just for demonstration.
For example, (and if you want to test to verify it's working), set the scores to 0 for everything except for the daily). Look at the daily macD by adding it as an indicator and set a score. Whenever the macD is trending up it will add the appropriate value to the score and likewise remove it when it's not.
Enjoy!
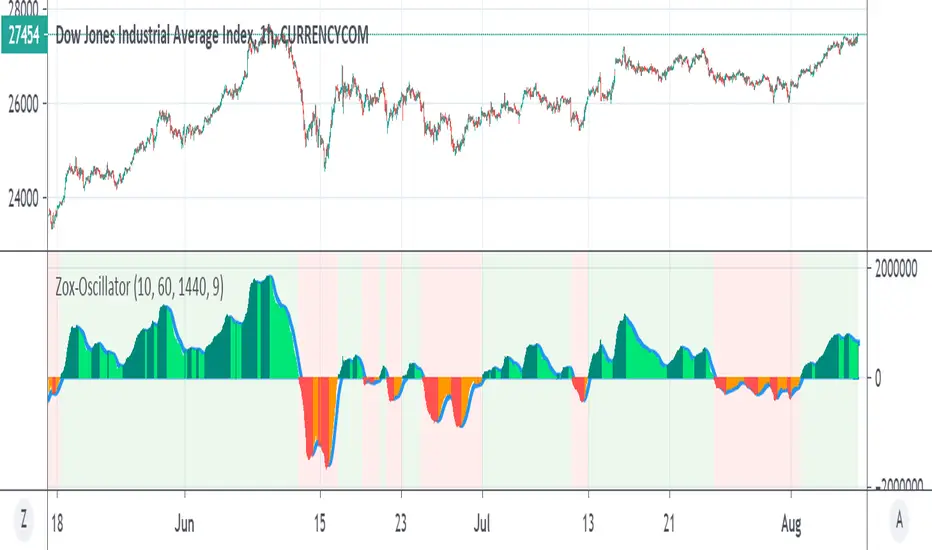
Zox-OscillatorThis oscillator tool is good for many stuff, forex ,stocks ,etc
the color are prouduce by the difference from the signal line (in blue) and 0
strong buy are green , lime weak buy
red=strong sell,orange =weak sell
above zero is buy zone ,bellow zero is bear zone
The candle time determine the MTF function (also HTF but to little extent) and the length you can use if you want to see longer or shorter cycles
few examples
etc etc
Bitcoin Logarithmic Curves OscillatorThis a companion indicator for the Bitcoin Logarithmic Growth Curves indicator.
This is an oscillator version of the above. When the indicator is at / near 1 then Bitcoin price is at / near the upper range of its long-term logarithmic growth trend. When at / near 0 then price is at / near the lower range of that trend.
This indicator only works with the BLX Brave New Coin Index (ticker:BLX) and only on 1 day, 3 day, or 1 week timeframes.

Bayesian BBSMA OscillatorSometime ago (very long ago), one of my tinkering project was to do a spam or ham classification type app to filter news I'd wanna read. So I built myself a Naive Bayes Classifier to feed me my relevant articles. It worked great, I can cut through the noise.
The hassle was I needed to manually train it to understand what I wanna read. I trained it using 50 articles and to my surprise, it's enough.
Complexity Theory
I've been reading a book called The Road to Ruin by Jim Rickards. He described how he got to his conclusion of how the stock market works by using Complexity Theory. Bill Williams would agree. Jim tells us that by using just enough data, we calculate the probability of an event to occur. We can't say for sure when but we know it's coming. This was my light bulb moment.
While Jim talks much about Bayesian Inference in which a probability of an event can always be updated as more evidence comes to light, I had my eyes set on binary probabilities of when prices are going up and down.
Assumptions
These are my assumptions:
Prices breaking up a Bollinger basis line will have fuel to go up even higher
Prices will go down when prices have broken up a Bollinger upper band
Scalping is the main method so we should use a lower period Moving Average (MA)
When prices are above MA, it's likelier a correction to the downside is imminent
When prices are below MA, it's likelier a correction to the upside is imminent
Optimize parameters for 1 hour timeframe which will give us time to react while still having more opportunities to trade
Building Blocks
Jim Rickards started with limited data (events) while in technical trading, data are plentiful. I decided to classify 2 events which are:
Next candles would be breaking up
Next candles would be breaking down
Key facts:
We won't know for sure when prices are going to break
We won't know for sure how much the prices movements are going to be
Formulas
Breaking up:
Pr(Up|Indicator) = Pr(Indicator|Up) * Pr(Up) / Pr(Indicator|Up) * Pr(Up) + Pr(Indicator|Down) * Pr(Down)
Breaking down:
Pr(Down|Indicator) = Pr(Indicator|Down) * Pr(Down) / Pr(Indicator|Down) * Pr(Down) + Pr(Indicator|Up) * Pr(Up)
Reading The Oscillator
Green is the probability of prices breaking up
Red is the probability of prices breaking down
When either green or red is flatlining ceiling, immediately on the next candle when the probability decreases go short or long based on which direction you're observing - Strong Signal
When either green or red is flatlining ceiling, take no action while it's ceiled
Usually when either green or red is flatlining bottom, the next candle when the probability increases, immediately take a short long position based on the direction you're observing - Weak Signal
When either green or red is flatlining bottom, take no action while it's bottomed
Alerts
Use Once per Bar option when generating alerts.

Ehlers Hilbert Oscillator [CC]The Hilbert Oscillator was created by John Ehlers (Rocket Science For Traders pgs 90-91) and just like the sinewave indicator that I published yesterday, this is also a leading indicator. The big difference between this indicator and the sinewave is that this indicator works very well for determining major turning points in the stock before they happen. You will notice that when the blue line crosses over the red line that a few bars from that point, the stock will start an uptrend and the reverse is true. I have also included immediate buy and sell signals over the 0 line so buy when the line is green and sell when it is red
Let me know if you would like to see any other scripts from me or if you want something custom done!

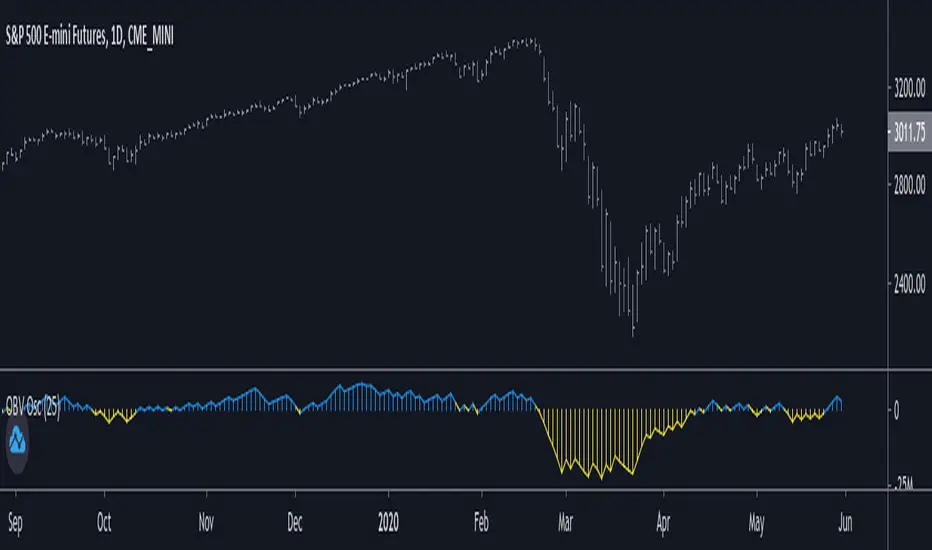
On Balance Volume OscillatorHi traders, today I felt a creative...so surpise! Check out my colorful OBV oscillator! An OBV that actually works!
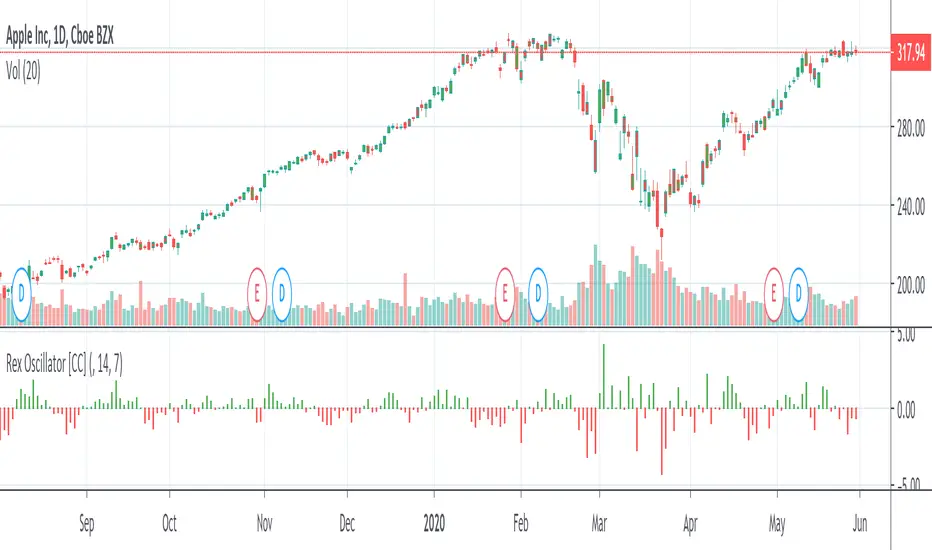
Rex Oscillator [CC]The Rex Oscillator measures market behavior based on the relationship of the close to the open, high and low values of the same bar. A big difference between the high and close on a bar indicates weakness, and wide disparity between the low and close indicates strength. The difference between open and close also indicates market performance. Buy when the indicator is green and sell when it turns red.
Let me know if you would like me to publish other scripts or if you want something custom done!
Midpoint OscillatorThe Midpoint Oscillator was created by Tushar Chande Ph.D. (Stocks & Commodities V. 9:11 (431-434)) and it does a great job of tracking extreme changes in the price. Buy when the line is green and sell when it turns red.
Let me know if you would like me to write more scripts!

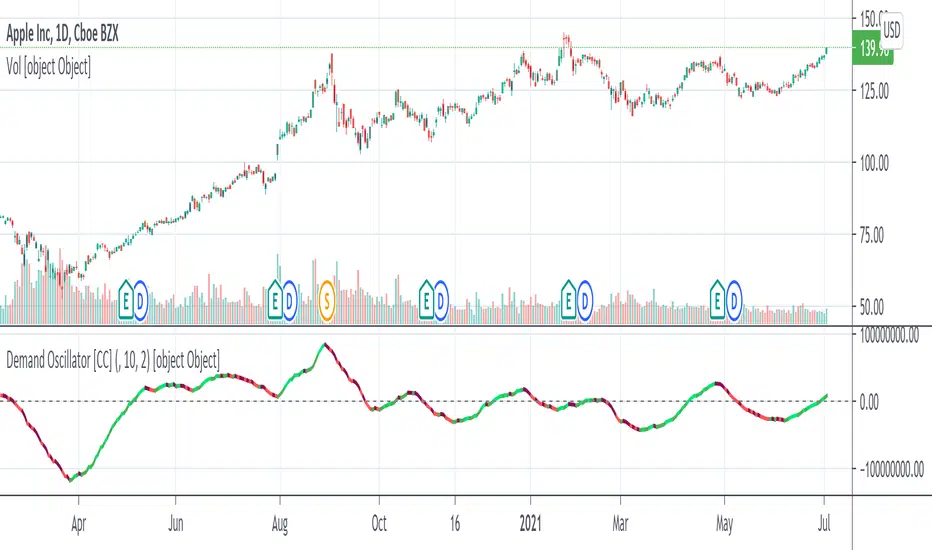
Demand OscillatorThe Demand Oscillator was created by James Sibbet (Stocks & Commodities June, 1986) and I changed his formula quite a bit to what you see on here. If it rises above the signal then buy or if not then sell. This is my custom version of his formula so let me know what you think.
Let me know if you would like to see me write any other scripts!
WaveTrend Oscillator w/ Short/Long/Close Alerts - WIPHigh TFs work best, but it works on any TF. I plan to continue releasing updates to it to improve overall form and function. Green Circles are Long Alerts, Red Circles are Short Alerts. Blue and Yellow Circles are Close Position Alerts. First Blue Circle After Red Circle would be Short Exit. First Yellow Circle After Green Circle would be Long Exit.
Original script was based on Lazybear Indicator-WaveTrend-Oscillator-WT Script. I have added and modified some code to my personal liking.

Crypto McClellan OscillatorMcClellan Oscillator for cryptocurrency, taking into account only the top 40 cryptos.
Original code was by LazyBear.

Accelerator Oscillator DivergencesDiscover divergences found by the Accelerator Oscillator indicator.

Directional Movement OscillatorThe Directional Movement Oscillator (DMO) is an adaption to the Directional Movement Index (DMI).
The difference is that DMO is one line, whereas DMI has 3 lines: +DI,-DI, and ADX.
The DMO line calculation: DMO = (+DI) - (-DI)
I excluded the ADX in DMO because its completely useless.
Try this indicator out, good luck ;)
-racer8

Indicator: Price Weight Oscillator [xQT5]This is my revision of AO (Awesome Oscillator) that can give more correct and early signals as on my opinion.
I'm used a original formula of AO and modified it with high and low prices adding.
Enjoy it!

Gann Trend OscillatorDeveloped by Robert Krausz, the Gann Trend Oscillator is a trend-following indicator used to determine the financial instruments long-term price direction.

E3 Super OscillatorCustom oscillator with settings for the custom histogram. Signals are displayed for Very Strong Buy, Pretty Strong Buy, Risky Buy, same for sell signals. Works on all time frames.

Bitcoin Energy Value OscillatorBitcoin Energy Value as an oscillator against price.
Calculated as: (Bitcoin Price / Bitcoin Energy Value - 1) * 100

Multi-Oscillator Divergence StudyCreated study to allow access to alert conditions.
See strategy to understand how this indicator is used.

TMMS OscillatorThe TMMS oscillator (aka “Trading Made More Simpler”) is an indicator made of conditions based on both 2 separated Stochastic and 1 RSI.
Bullish zone is green and bearish one is red. When the histogram is grey, no signals is available at that time.
The indicator has an option to show the current trend of an Hull moving average (ascending or descending curve). When the trend is up, green dots are plotted on the zero line. When the trend is down, the dots are coloured in red.
Greetings, success with your trade!!!

Bitcoin Production Cost OscillatorFor Trav,
Oscillator version of "Bitcoin Production Cost".
Based on raw data from CBECI.
Follow me to read more about the calculation logic.
