Livelli OI-PNCOI-PNC Levels is a script that displays the open interest (OI) and net short positions (PNC) of a selection of 20 of the most significant stocks in terms of traded value on the Italian market.
PNC are indicated by red dotted lines starting from the close of the last reported change date;
The most significant open interest by number of contracts (Top 10 Calls and Top 10 Puts) are displayed using labels, all on a single line (Strike, CALL, PUT);
A summary table can be activated.
the data is hardcoded using static arrays and must be updated periodically. Data updated of 03/11/2025
########### Italiano ############
Livelli OI-PNC è uno script che permette di visualizzare gli open interest (OI) e le Posizioni Nette Corte (PNC) di una selezione di 20 titoli tra i più significativi per controvalore movimentato del mercato italiano.
Le PNC vengono indicate tramite Linee tratteggiate rosse che partono dal close della data di ultima variazione comunicata;
Sono riportati tramite labels, gli Open Interest più significativi per num.Contratti (Top 10 Call e top 10 Put) tutto su una unica riga per ogni strike (Strike, CALL, PUT);
E' attivabile una Tabella di riepilogo.
Poiché Pine Script non può leggere direttamente file da URL esterni, i dati sono hardcorati tramite array statici e vanno aggiornati periodicamente. Dati aggiornati al 03/11/2025
In den Scripts nach "open interest" suchen

OI Value (aproximado)This indicator estimates the Open Interest Value (USD) by multiplying the Open Interest (contracts) of the BTCUSDT Perpetual Futures by the current price.
It provides an approximate view of how much capital is engaged in open positions, helping traders visualize whether new money is entering or leaving the market.
Use Case:
Rising OI Value → New capital entering the market (trend strengthening)
Falling OI Value → Positions being closed or liquidated (trend weakening)
Designed for traders combining Open Interest analysis with price action and volume-based indicators such as OBV or Delta Volume.

Aggregated OI (Binance + Bybit + OKX)RU
Агрегатор Open Interest для крипты по трём биржам: Binance, Bybit, OKX/OKEX.
Показывает OI-свечи или дельту OI, есть мини-легенда (Open Interest, Rekt Longs/Shorts, Aggressive Longs/Shorts). Можно переключать биржи и единицы отображения (USD / COIN).
Данные зависят от доступности OI-тикеров в TradingView (…USDT.P_OI). Если по паре нет фида на бирже — она игнорируется. Основано на скрипте LeviathanCapital (MPL-2.0), модификация — SaneQ. Не является финсоветом.
EN
Aggregated Open Interest for crypto across Binance, Bybit, OKX/OKEX.
Plots OI candles or OI delta, plus a compact legend (Open Interest, Rekt Longs/Shorts, Aggressive Longs/Shorts). You can toggle exchanges and display units (USD / COIN).
Data depends on TV OI feeds (…USDT.P_OI). If a pair lacks a feed on an exchange, that source is skipped. Based on LeviathanCapital’s script (MPL-2.0), modified by SaneQ. Not financial advice.

Support and Resistance levels from Options DataINTRODUCTION
This script is designed to visualize key support and resistance levels derived from options data on TradingView charts. It overlays lines, labels, and boxes to highlight levels such as Put Walls (gamma support), Call Walls (gamma resistance), Gamma Flip points, Vanna levels, and more.
These levels are intended to help traders identify potential areas of price magnetism, reversal, or breakout based on options market dynamics. All calculations and visualizations are based on user-provided data pasted into the input field, as Pine Script cannot directly fetch external options data due to platform limitations (explained below).
For convenience, my website allows users to interact with a bot that will generate the string for up to 30 tickers at once getting nearly real-time data on demand (data is cached for 15min). With the output string pasted into this indicator, it's a bliss to shuffle through your portfolio and see those levels for each ticker.
The script is open-source under TradingView's terms, allowing users to study, modify, and improve it. It draws inspiration from common options-derived metrics like gamma exposure and vanna, which are widely discussed in financial literature. No external code is copied without rights; all logic is original or based on standard mathematical formulas.
How the Options Levels Are Calculated
The levels displayed by this script are not computed within Pine Script itself—instead, they rely on pre-calculated values provided by the user (via a pasted data string). These values are derived from options chain data fetched from financial APIs (e.g., using libraries like yfinance in Python). Here's a step-by-step overview of how these levels are generally calculated externally before being input into the script:
Fetching Options Data:
Historical and current options chain data for a ticker (e.g., strikes, open interest, volume, implied volatility, expirations) is retrieved for near-term expirations (e.g., up to 90 days).
Current stock price is obtained from recent history.
Gamma Support (Put Wall) and Resistance (Call Wall):
Gamma Calculation: For each option, gamma (the rate of change of delta) is computed using the Black-Scholes formula:
gamma = N'(d1) / (S * sigma * sqrt(T))
where S is the stock price, K is the strike, T is time to expiration (in years), sigma is implied volatility, r is the risk-free rate (e.g., 0.0445), and N'(d1) is the normal probability density function.
Weighted gamma is multiplied by open interest and aggregated by strike.
The Put Wall is the strike below the current price with the highest weighted gamma from puts (acting as support).
The Call Wall is the strike above the current price with the highest weighted gamma from calls (acting as resistance).
Short-term versions focus on strikes closer to the money (e.g., within 10-15% of the price).
Gamma Flip Level:
Net dealer gamma exposure (GEX) is calculated across all strikes:
GEX = sum (gamma * OI * 100 * S^2 * sign * decay)
where sign is +1 for calls/-1 for puts, and decay is 1 / sqrt(T).
The flip point is the price where net GEX changes sign (from positive to negative or vice versa), interpolated between strikes.
Vanna Levels:
Vanna (sensitivity of delta to volatility) is calculated:
vanna = -N'(d1) * d2 / sigma
where d2 = d1 - sigma * sqrt(T).
Weighted by open interest, the highest positive and negative vanna strikes are identified.
Other Levels:
S1/R1: Significant strikes with high combined open interest and volume (80% OI + 20% volume), below/above price for support/resistance.
Implied Move: ATM implied volatility scaled by S * sigma * sqrt(d/365) (e.g., for 7 days).
Call/Put Ratio: Total call contracts divided by put contracts (OI + volume).
IV Percentage: Average ATM implied volatility.
Options Activity Level: Average contracts per unique strike, binned into levels (0-4).
Stop Loss: Dynamically set below the lowest support (e.g., Put Wall, Gamma Flip), adjusted by IV (tighter in low IV).
Fib Target: 1.618 extension from Put Wall to Call Wall range.
Previous day levels are stored for comparison (e.g., to detect Call Wall movement >2.5% for alerts).
Effect as Support and Resistance in Technical Trading
Options levels like gamma walls influence price action due to market maker hedging:
Put Wall (Gamma Support): High put gamma below price creates a "magnet" effect—market makers buy stock as price falls, providing support. Traders might look for bounces here as entry points for longs.
Call Wall (Gamma Resistance): High call gamma above price leads to selling pressure from hedging, acting as resistance. Rejections here could signal trims, sells or even shorts.
Gamma Flip: Where gamma exposure flips sign, often a volatility pivot—crossing it can accelerate moves (bullish above, bearish below).
Vanna Levels: Positive/negative vanna indicate volatility sensitivity; crosses may signal regime shifts.
Implied Move: Shows expected range; prices outside suggest overextension.
S1/R1 and Fib Target: Volume/OI clusters act as classic S/R; Fib extensions project upside targets post-breakout.
In trading, these are not guarantees—combine with TA (e.g., volume, trends). High activity levels imply stronger effects; low CP ratio suggests bearish sentiment. Alerts trigger on proximities/crosses for awareness, not advice.
Limitations of the TradingView Platform for Data Pulling
TradingView's Pine Script is sandboxed for security and performance:
No direct internet access or API calls (e.g., can't fetch yfinance data in-script).
Limited to chart data/symbol info; no real-time options chains.
Inputs are static per load; updates require manual pasting.
Caching isn't persistent across sessions.
This prevents dynamic data pulling, ensuring scripts remain lightweight but requiring external tools for fresh data.
Creative Solution for On-Demand Data Pulling
To overcome these limitations, users can use external tools or scripts (e.g., Python-based) to fetch and compute levels on demand. The tool processes tickers, generates a formatted string (e.g., "TICKER:level1,level2,...;TIMESTAMP:unix;"), and users paste it into the script's input. This keeps data fresh without violating platform rules, as computation happens off-platform. For example, run a local script to query APIs and output the string—adaptable for any ticker.
Script Functionality Breakdown
Inputs: Custom data string (parsed for levels/timestamp); toggles for short-term/previous/Vanna/stop loss; style options (colors, transparency).
Parsing: Extracts levels for the chart symbol; gets timestamp for "updated ago" display.
Drawing: Lines/labels for levels; boxes for gamma zones/implied move; clears old elements on updates.
Info Panel: Top-right summary with metrics (CP ratio, IV, distances, activity); emojis for quick status.
Alerts: Conditions for proximities, crosses, bounces (e.g., 0.5% bounce from Put Wall).
Performance: Uses vars for persistence; efficient for real-time.
This script is educational—test thoroughly. Not financial advice; past performance isn't indicative of future results. Feedback welcome via TradingView comments.

CVD Divergenz System – modular with Exchange + LabelsA smart volume-based strategy tool using CVD divergence, ATR-based risk management, and Open Interest filters — now with visual chart labels and exchange switching.
Designed for crypto traders who want precise entry signals, volume insight, and a clean UI.
🔍 Key Features:
✅ CVD Divergence Detection
Automatically detects bullish or bearish divergences between price and cumulative delta (CVD)
✅ Open Interest Logic (Simulated)
Signals are only valid when OI is rising – otherwise a warning is issued
✅ ATR-Based Entry, Stop & Target Zones
Auto-calculated based on your chosen R multiple (e.g., 1.5R), plotted in the chart
✅ Visual Dashboard Panel (table)
Compact panel with CVD, OI change, ATR, signal status, and selected exchange — always visible in top-right
✅ Exchange Selector + Fallback to Binance
Choose between Binance, Bybit, Bitget, or Coinbase — if data is unavailable, Binance is used automatically
✅ Modular Chart Labels
Optionally display 📈 LONG, 📉 SHORT or ⚠️ WARNING labels directly on the chart with a toggle
✅ Alerts Built-In
Get notified instantly when a setup triggers (long, short, or warning) — works with app, popup, or webhook
✅ Fully Modular Controls
Enable or disable the dashboard, trade zones, and labels via simple checkboxes
⚠️ Technical Notes:
CVD is calculated from delta volume (volume * sign(close - open)) — not true order flow
Open Interest is simulated using volume as a placeholder (due to Pine Script limitations)
Best suited for 5–30min timeframes on crypto futures pairs like BTCUSDT, ETHUSDT, etc.
💡 Pro Tips:
Use near key support/resistance zones or liquidity levels
Combine with price action and higher timeframe confluence
Alerts work best with "Once Per Bar Close" trigger setting
📈 Built to support faster decisions, cleaner setups, and institutional-level insights — all in one tool.

Dskyz Options Flow Flux (OFF) - FuturesDskyz Options Flow Flux (OFF) - Futures
*This is a repost due to moderator intervention on use of ™ in my scripts. I'm in the process of getting this rectified. This was originally posted around mid-night CDT.
🧠 The Dskyz Options Flow Flux (OFF) - Futures indicator is a game changer for futures traders looking to tap into institutional activity with limited resources. Designed for TradingView this tool simulates options flow data (call/put volume and open interest) for futures contracts like MNQ MES NQ and ES giving u actionable insights through volume spike detection volatility adjustments and stunning visuals like aurora flux bands and round number levels. Whether u’re a beginner learning the ropes or a pro hunting for an edge this indicator delivers real time market sentiment and key price levels to boost ur trading game
Key Features
⚡ Simulated Options Flow: Breaks down call/put volume and open interest using market momentum and volatility
📈 Spike Detection: Spots big moves in volume and open interest with customizable thresholds
🧠 Volatility Filter: Adapts to market conditions using ATR for smarter spike detection
✨ Aurora Flux Bands: Glows with market sentiment showing u bullish or bearish vibes at a glance
🎯 Round Number Levels: Marks key psychological levels where big players might step in
📊 Interactive Dashboard: Real time metrics like sentiment score and volatility factor right on ur chart
🚨 Alerts: Get notified of bullish or bearish spikes so u never miss a move
How It Works
🧠 This indicator is built to make complex options flow analysis simple even with the constraints of Pine Script. Here’s the step by step:
Simulated Volume Data (Dynamic Split):
Pulls daily volume for ur chosen futures contract (MNQ1! MES1! NQ1! ES1!)
Splits it into call and put volume based on momentum (ta.mom) and volatility (ATR vs its 20 period average)
Estimates open interest (OI) for calls and puts (1.15x for calls 1.1x for puts)
Formula: callRatio = 0.5 + (momentum / close) * 10 + (volatility - 1) * 0.1 capped between 0.3 and 0.7
Why It Matters: Mimics how big players might split their trades giving u a peek into institutional sentiment
Spike Detection:
Compares current volume/OI to short term (lookbackShort) and long term (lookbackLong) averages
Flags spikes when volume/OI exceeds the average by ur set threshold (spikeThreshold for regular highConfidenceThreshold for strong)
Adjusts for volatility so u’re not fooled by choppy markets
Output: optionsSignal (2 for strong bullish -2 for strong bearish 1 for bullish -1 for bearish 0 for neutral)
Why It Matters: Pinpoints where big money might be stepping in
Volatility Filter:
Uses ATR (10 periods) and its 20 period average to calculate a volatility factor (volFactor = ATR / avgAtr)
Scales spike thresholds based on market conditions (volAdjustedThreshold = spikeThreshold * max(1 volFactor * volFilter))
Why It Matters: Keeps ur signals reliable whether the market is calm or wild
Sentiment Score:
Calculates a call/put ratio (callVolume / putVolume) and adjusts for volatility
Converts it to a 0 to 100 score (higher = bullish lower = bearish)
Formula: sentimentScore = min(max((volAdjustedSentiment - 1) * 50 0) 100)
Why It Matters: Gives u a quick read on market bias
Round Number Detection:
Finds the nearest round number (e.g. 100 for MNQ1! 50 for MES1!)
Checks for volume spikes (volume > 3 period SMA * spikeThreshold) and if price is close (within ATR * atrMultiplier)
Updates the top activity level every 15 minutes when significant activity is detected
Why It Matters: Highlights psychological levels where price often reacts
Visuals and Dashboard:
Combines aurora flux bands glow effects round number lines and a dashboard to make insights pop (see Visual Elements below)
Plots triangles for call/put spikes (green/red for strong lime/orange for regular)
Sets up alerts for key market moves
Why It Matters: Makes complex data easy to read at a glance
Inputs and Customization
⚙️ Beginners can tweak these settings to match their trading style while pros can dig deeper for precision:
Futures Symbol (symbol): Pick ur contract (MNQ1! MES1! NQ1! ES1!). Default: MNQ1!
Short Lookback (lookbackShort): Days for short term averages. Smaller = more sensitive. Range: 1+. Default: 5
Long Lookback (lookbackLong): Days for long term averages. Range: 5+. Default: 10
Spike Threshold (spikeThreshold): How big a spike needs to be (e.g. 1.1 = 10% above average). Range: 1.0+. Default: 1.1
High Confidence Threshold (highConfidenceThreshold): For strong spikes (e.g. 3.0 = 3x average). Range: 2.0+. Default: 3.0
Volatility Filter (volFilter): Adjusts for market volatility (e.g. 1.2 = 20% stricter in volatile markets). Range: 1.0+. Default: 1.2
Aurora Flux Transparency (glowOpacity): Controls band transparency (0 = solid 100 = invisible). Range: 0 to 100. Default: 65
Show Show OFF Dashboard (showDashboard): Toggles the dashboard with key metrics. Default: true
Show Nearest Round Number (showRoundNumbers): Displays round number levels. Default: true
ATR Multiplier for Proximity (atrMultiplier): How close price needs to be to a round number (e.g. 1.5 = within 1.5x ATR). Range: 0.5+. Default: 1.5
Functions and Logic
🧠 Here’s the techy stuff pros will love:
Simulated Volume Data : Splits daily volume into call/put volume and OI using momentum and volatility
Volatility Filter: Scales thresholds with volFactor = atr / avgAtr for adaptive detection
Spike Detection: Flags spikes and assigns optionsSignal (2, -2, 1, -1, 0) for sentiment
Sentiment Score: Converts call/put ratio into a 0-100 score for quick bias reads
Round Number Detection: Identifies key levels and significant activity for trading zones
Dashboard Display: Updates real time metrics like sentiment score and volatility factor
Visual Elements
✨ These visuals make data come alive:
Gradient Background: Green (bullish) red (bearish) or yellow (neutral/choppy) at 95% transparency to show trend
Aurora Flux Bands: Stepped bands (linewidth 3) around a 14 period EMA ± ATR * 1.8. Colors shift with sentiment (green red lime orange gray) with glow effects at 85% transparency
Round Number Visualization: Stepped lines (linewidth 2) at key levels (solid if active dashed if not) with labels (black background white text size.normal)
Visual Signals: Triangles above/below bars for spikes (size.small for strong size.tiny for regular)
Dashboard: Bottom left table (2 columns 10 rows) with a black background (29% transparency) gray border and metrics:
⚡ Round Number Activity: “Detected” or “None”
📈 Trend: “Bullish” “Bearish” or “Neutral” (colored green/red/gray)
🧠 ATR: Current 10 period ATR
📊 ATR Avg: 20 period SMA of ATR
📉 Volume Spike: “YES” (green) or “NO” (red)
📋 Call/Put Ratio: Current ratio
✨ Flux Signal: “Strong Bullish” “Strong Bearish” “Bullish” “Bearish” or “Neutral” (colored green/red/gray)
⚙️ Volatility Factor: Current volFactor
📈 Sentiment Score: 0-100 score
Usage and Strategy Recommendations
🎯 For Beginners: Use high confidence spikes (green/red triangles) for easy entries. Check the dashboard for a quick market read (sentiment score above 60 = bullish below 40 = bearish). Watch round number levels for support/resistance
💡 For Pros: Combine flux signals with round number activity for high probability setups. Adjust lookbackShort/lookbackLong for trending vs choppy markets. Use volFactor for position sizing (higher = smaller positions)

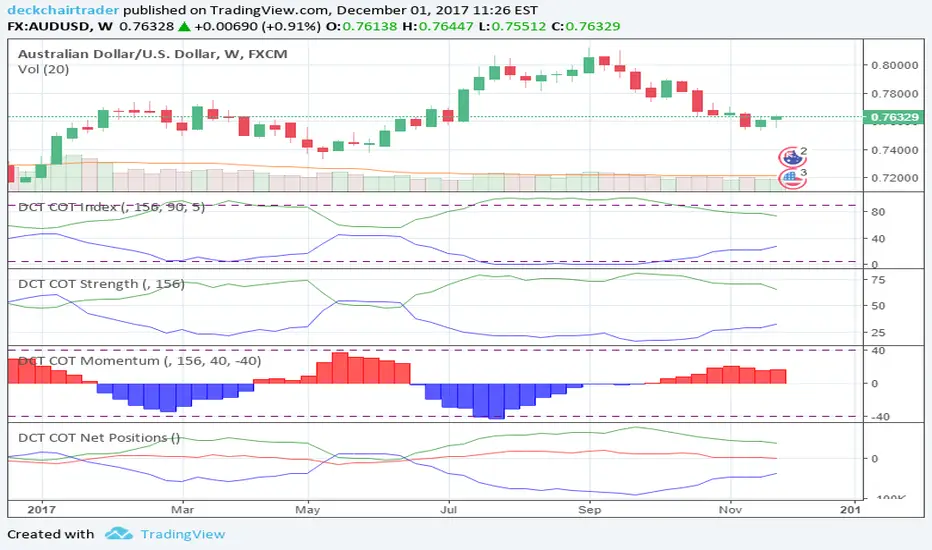
Weekly COTAdjusted COT Index
Improves upon: "COT Index Commercials vs large and small Speculators" by SystematicFutures
How: CoT Indexes are adjusted by Open Interest to normalise data over time, and threshold background colours are in-line with Larry Williams recommendations from his book.
Note: This indicator is **only** accurate on the Daily time-frame due to the mid-week release date for CoT data.
This script calculates and plots the Adjusted Commitment of Traders (COT) Index for Commercial, Large Speculator, and Retail (Small Speculator) categories.
The CoT Index is adjusted by Open Interest to normalise data through time, following the methodology of Larry Williams, providing insights into how these groups are positioned in the market with an arguably more historically accurate context.
COT Categories
-------------------
- Commercials (Producers/Hedgers): Large entities hedging against price changes in the underlying asset.
- Large Speculators (Non-commercials): Professional traders and funds speculating on price movements.
- Retail Traders (Nonreportable/Small Speculators): Small individual traders, typically less informed.
Features
----------
- Open Interest Adjustment
- The net positions for each category are normalized by Open Interest to account
for varying contract sizes.
- Customisable Look-back Period
- You can adjust the number of weeks for the index calculation to control the
historical range used for comparison.
- Thresholds for Extremes
- Upper and lower thresholds (configurable) are provided to mark overbought and
oversold conditions.
- Defaults
- Overbought: <=20
- Oversold: >= 80
- Hide Current Week Option
- Optionally hide the current week's data until market close for more accurate comparison.
- Visual Aids
- Plot the Commercials, Large Speculators, and Retail indexes, and optionally highlight extreme positioning.
Inputs
--------
- weeks
- Number of weeks for historical range comparison.
- upperExtreme and lowerExtreme
- Thresholds to identify overbought/oversold conditions (default 80/20).
- hideCurrentWeek
- Option to hide current week's data until market close.
- markExtremes
- Highlight extremes where any index crosses the upper or lower thresholds.
- Options to display or hide indexes for Commercials, Large Speculators, and Small Speculators.
Outputs
----------
- The script plots the COT Index for each of the three categories and highlights periods of extreme positioning with customisable thresholds.
Usage
-------
- This tool is useful for traders who want to track the positioning of different market participants over time.
- By identifying the extreme positions of Commercials, Large Speculators, and Retail traders, it can give insights into market sentiment and potential reversals.
- Reversals of trend can be confirmed with RSI Divergence (daily), for example
- Continuation can be confirmed with RSI overbought/oversold conditions (daily), and/or hidden RSI Hidden Divergence, for example

Adjusted CoT IndexAdjusted COT Index
Improves upon: "COT Index Commercials vs large and small Speculators" by SystematicFutures
How: CoT Indexes are adjusted by Open Interest to normalise data over time, and threshold background colours are in-line with Larry Williams recommendations from his book.
Note: This indicator is **only** accurate on the Daily time-frame due to the mid-week release date for CoT data.
This script calculates and plots the Adjusted Commitment of Traders (COT) Index for Commercial, Large Speculator, and Retail (Small Speculator) categories.
The CoT Index is adjusted by Open Interest to normalise data through time, following the methodology of Larry Williams, providing insights into how these groups are positioned in the market with an arguably more historically accurate context.
COT Categories
-------------------
- Commercials (Producers/Hedgers): Large entities hedging against price changes in the underlying asset.
- Large Speculators (Non-commercials): Professional traders and funds speculating on price movements.
- Retail Traders (Nonreportable/Small Speculators): Small individual traders, typically less informed.
Features
----------
- Open Interest Adjustment
- The net positions for each category are normalized by Open Interest to account
for varying contract sizes.
- Customisable Look-back Period
- You can adjust the number of weeks for the index calculation to control the
historical range used for comparison.
- Thresholds for Extremes
- Upper and lower thresholds (configurable) are provided to mark overbought and
oversold conditions.
- Defaults
- Overbought: <=20
- Oversold: >= 80
- Hide Current Week Option
- Optionally hide the current week's data until market close for more accurate comparison.
- Visual Aids
- Plot the Commercials, Large Speculators, and Retail indexes, and optionally highlight extreme positioning.
Inputs
--------
- weeks
- Number of weeks for historical range comparison.
- upperExtreme and lowerExtreme
- Thresholds to identify overbought/oversold conditions (default 80/20).
- hideCurrentWeek
- Option to hide current week's data until market close.
- markExtremes
- Highlight extremes where any index crosses the upper or lower thresholds.
- Options to display or hide indexes for Commercials, Large Speculators, and Small Speculators.
Outputs
----------
- The script plots the COT Index for each of the three categories and highlights periods of extreme positioning with customisable thresholds.
Usage
-------
- This tool is useful for traders who want to track the positioning of different market participants over time.
- By identifying the extreme positions of Commercials, Large Speculators, and Retail traders, it can give insights into market sentiment and potential reversals.
- Reversals of trend can be confirmed with RSI Divergence (daily), for example
- Continuation can be confirmed with RSI overbought/oversold conditions (daily), and/or hidden RSI Hidden Divergence, for example

Price and OI ChangePrice and OI Change
Description:
The "Price and OI Change" indicator provides insights into market dynamics by analyzing the price and open interest (OI) changes over a 7-day period. This indicator is designed for use with both spot and futures markets, including cryptocurrencies.
Key Features:
Price and OI Change Calculation: Computes the 7-day change in price and open interest to help identify market trends and shifts.
Market Conditions Visualization: Differentiates market conditions by changing the background color based on:
Leverage-Driven Market: Blue background indicates increasing prices and OI, suggesting a bullish trend driven by leverage.
Spot-Driven Market: Green background shows increasing prices but decreasing OI, indicating a bullish trend driven by spot market activity.
Leverage Sell-Off: Orange background reveals decreasing prices with increasing OI, signaling a potential liquidation phase.
Deleveraging Sell-Off: Red background reflects decreasing prices and OI, indicating a bearish market with reduced leverage.
Top 3 BTC Futures Average OI: Displays the average open interest for the top 3 BTC futures contracts from major exchanges (Binance, OKX, Bybit). This helps gauge overall market sentiment and liquidity.
Visualization Tools: Includes optional plotting of open interest data and average OI for better visualization of market conditions.
Usage:
Traders and Analysts: Use the background color changes and average OI to make informed decisions about market entry and exit points.
Futures Traders: Track OI changes in major BTC futures to assess market strength and potential liquidity issues.

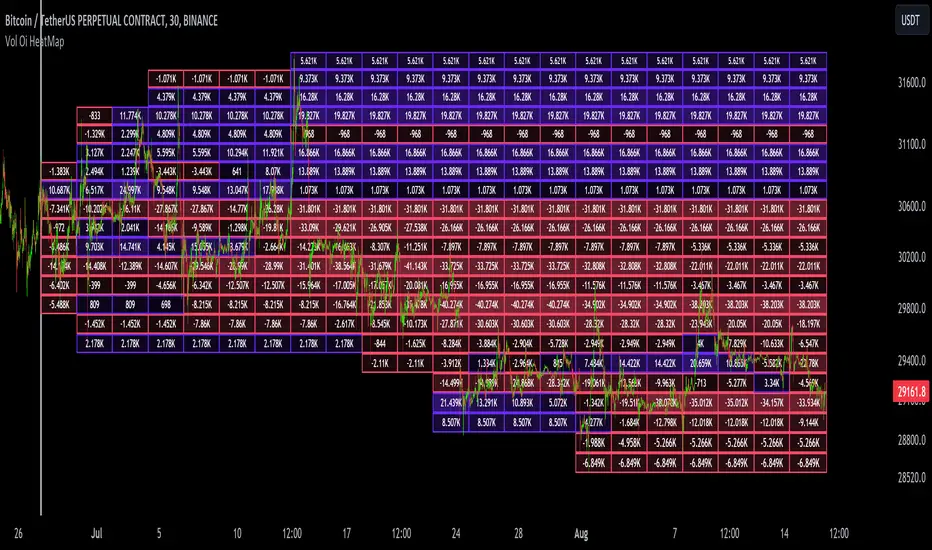
Dynamic Liquidity Map [Kioseff Trading]Hello!
Just a quick/fun project here: "Dynamic Heatmap".
This script draws a volume delta or open interest delta heatmap for the asset on your chart.
The adjective "Dynamic" is used for two reasons (:
1: Self-Adjusting Lower Timeframe Data
The script requests ~10 lower timeframe volume and open interest data sets.
When using the fixed range feature the script will, beginning at the start time, check the ~10 requested lower timeframes to see which of the lower timeframes has available data.
The script will always use the lowest timeframe available during the calculation period. As time continues, the script will continue to check if new lower timeframe data (lower than the currently used lowest timeframe) is available. This process repeats until bar time is close enough to the current time that 1-minute data can be retrieved.
The image above exemplifies the process.
Incrementally lower timeframe data will be used as it becomes available.
1: Fixed range capabilities
The script features a "fixed range" tool, where you can manually set a start time (or drag & drop a bar on the chart) to determine the interval the heatmap covers.
From the start date, the script will calculate the calculate the sub-intervals necessary to draw a rows x columns heatmap. Consequently, setting the start time further back will draw a heat map with larger rows x columns, whereas, a start time closer to the current bar time will draw a more "precise" heatmap with smaller rows x columns.
Additionally, the heatmap can be calculated using open interest data.
The image above shows the heatmap displaying open interest delta.
The image above shows alternative settings for the heatmap.
Delta values have been hidden alongside grid border colors. These settings can be replicated to achieve a more "traditional" feel for the heatmap.
Thanks for checking this out!
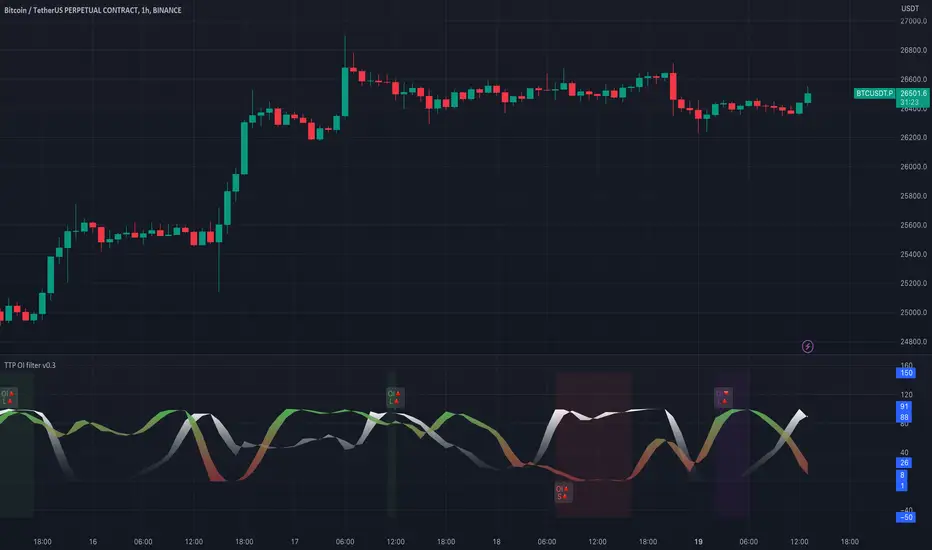
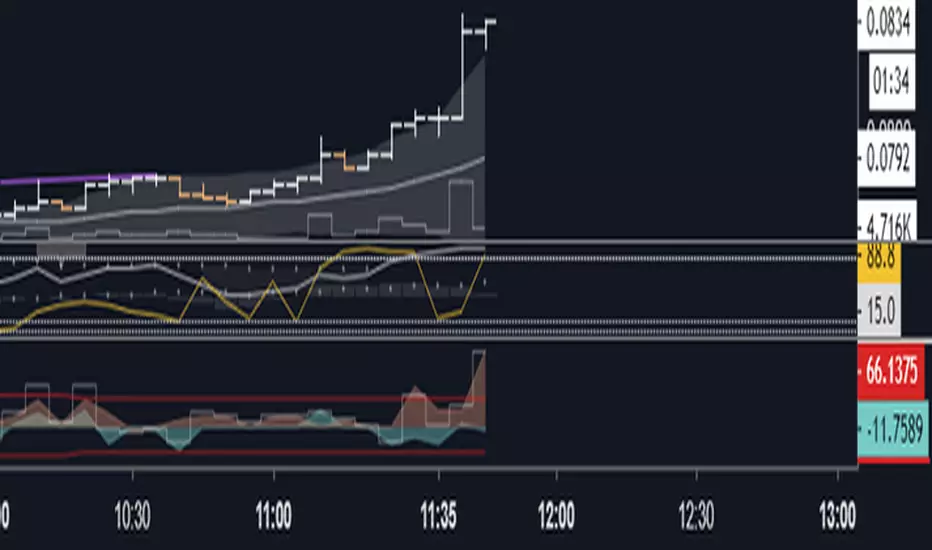
TTP OI + LS signal filterThis oscillator helps filtering specific conditions in the market based on open interest (OI) and the ratio of longs and shorts (LS) for crypto assets.
Currently it works with BINANCE:BTCUSDT.P but soon I'll be adding support for more assets.
It flags areas of interest like:
- Too many longs, too many shorts in the market
- Open interest too high or too low
It accepts an external signal as a source in which case filters can be applied to the original signal. For example the external signal might trigger and plot a 1 when RSI break below 70. By connecting such signal with this oscillator you'll be able to only pass-through the ones that occur when any of the areas of interest mentioned above are also valid.
If both filter are applied it acts as an OR. For example, if too many longs and too many shorts are active, it will pass through the signal in either condition.
The results of the original signal filtered is printed to be able to later use it in any external backtester strategy that accepts external sources too.
If external source signal is disabled it will trigger any time the combined filters are returning true.
Open interest and the ratio of longs/shorts is considered too high whenever the stochastic RSI calculation of the OI or ratio LS reaches a level above 80 and too low when below 20
The ratio of long/shorts is calculated by dividing the ratio of longs vs shorts from BITFINEX:BTCUSDLONGS and BITFINEX:BTCUSDSHORTS
Volume Profile Volume Delta OI Delta [Kioseff Trading]Hello!
This script serves to distinguish volume delta for any asset and open interest delta for Binance perpetual futures.
The image above provides further explanation of functionality and color correspondence.
The image above shows the indicator calculating volume at each tick level and displaying the metric.
The label color outline (neon effect) is configurable; the image above is absent the feature.
The image above shows Open Interest (OI) Delta calculated - similar to how the script calculates volume delta - for a Binance Perpetual Future pair.
This feature only works for Binance Futures pairs; the script will not load when trying to calculate OI Delta on other assets.
Additionally, a heatmap is displayable should you configure the indicator to calculate it.
The image above shows a heatmap using volume delta calculations.
The image above shows a heatmap using OI delta calculations.
Of course, these calculations - when absent requisite data - require some assumptions to better replicate calculations with access to requisite data.
The indicator assumes a 60/40 split when a tick level is traded at and only one metric - "buy volume" or "sell volume" is recorded. This means there shouldn't be any levels recorded where "buy volume" is greater than 0 and "sell volume" equals 0 and vice versa. While this assumption was performed arbitrarily, it may help better replicate volume delta and OI delta calculations seen on other charting platforms.
This option is configurable; you can select to have the script not assume a 60/40 split and instead record volume "as is" at the corresponding tick level.
The script also divides volume and open interest if a one-minute bar violates multiple tick levels. The volume or open interest generated on the one-minute bar will be divided by the number of tick levels it exceeds. The results are, subsequently, appended to the violated tick levels.
Further, the script can be set to recalculate after a user-defined time threshold is exceeded. You can also define the percentage or tick distance between levels.
Also, it'd be great if this indicator can nicely replicate volume delta indicators on other charting platforms. If you've any ideas on how price action can be used to better assume volume at the corresponding price area please let me know!
Thank you (:

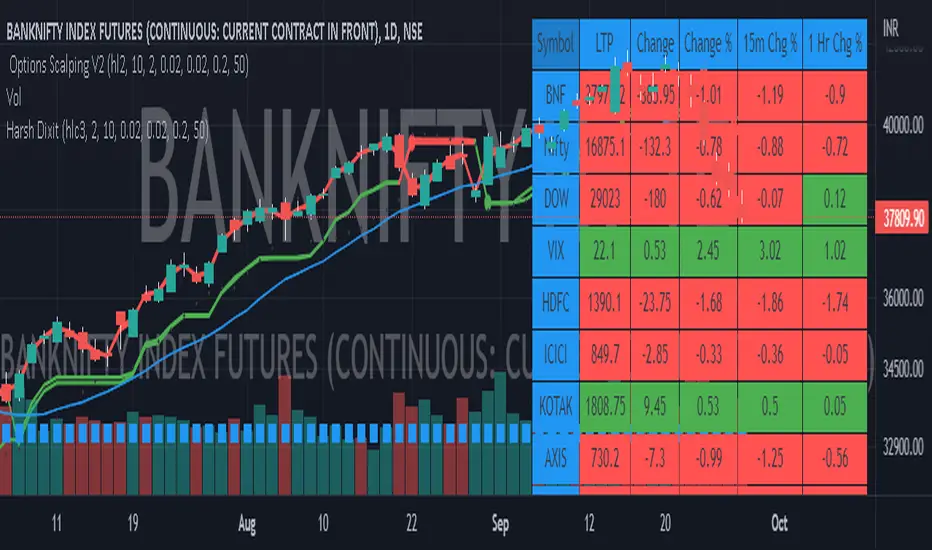
Options Scalping by harsh gbychi this is my script.
Bank Nifty Live OI Change Chart can give very useful clues for intraday support and resistance levels for Bank Nifty. If there is more addition in Open Interest at 12200 Calls, that would mean most market players are comfortable writing call options at this level because they believe it to be a strong resistance. That would be bearish indication for BankNifty.
Similarly is there is highest writing in 12000 Puts that would indicate strong intraday support at that level.
Third Scenario: There is good amount of Open Interest increase in 12000 PE and 12200 CE –> this means we should expect a range bound session for the day, as both bears and bulls are comfortable holding the 12200 and 12000 levels respectively.
Following factors could improve reliability of BankNifty OI Change analysis:
1) Put Call Ratio: Higher PCR means bullishness. If there is more writing at 12000PE and PCR is high and increasing during the day that would add to bullish scenario
If the PCR is declining for the day and more writing happening at 12200CE then this adds to bearishness.
2) Close to expiry: The closer to expiry we are, the more reliable the ‘Open Interest’ analysis. Early in the series, the OI analysis is less reliable.
3) More Players: As the number of players increase, the OI analysis become more reliable.
4) Bid-ask Spread: The lower the bid-ask spread the more reliable the OI analysis.
5) Technical Indicators: The best trades are found by combining OI analysis with other technical indicators. MACD, RSI, Channel lines and EW count give best results with Open Interest Analysis.
The Amplifier - Two Day Historical Bitcoin Volatility PlotThe 3rd piece to the other two pieces to our CoT study. This is the Amplifier, which turns select signals into 'Super' Buys/Sells
The other two being the 'Bitcoin Insider CoT Delta', and the on chart Price indicator most will have, if no others the 'Hunt Bitcoin CoT Buy/Sell Signals' that will indicate the key signals, ave 4 a year on the chart as they occur.
Why Bother another CoT signal?
Its different & focused on the Insider's.
Performance -
This Indicator provided a
1. Signal 1 = 26th March 2019 = SUPER LONG at $4,500 that saw a near $14,000 run up
2. Signal 2 = 18th & 24th June 2019 = SHORT at the second & final level $11,700 after repeated attempts & failure in the $13K range, the mini Echo Bitcoin Bull of 2019
3. Signal 3 = 17th December 2019 = LONG $6,900, Bitcoin rallied to Mid $10,500's
4. Signal 4 = 18th Feb 2020 = SUPER SHORT from $9,700's to a final extreme Low of $3,000, calling the CV-19 collapse
5. Signal 5 = 17th March 2020 = LONG from $5,400 no closure point yet
6. Signal 6 = 29th June 2020 = SUPER LONG reiterate from $10,700 no closure sell signal yet
7. Signal 7 = 17th May 2020 = LONG another accumulate LONG with no sell signal yet generated at Post H&S's low of $33,000
Note - This indicator only commences March 2019, as Bitcoin futures were a recent introduction and needed to settle for 6 months in both use and data, no signals were meaningful prior & data was light.
What is Provided. - Please note the need to also add the Hunt Bitcoin Historical Volatility Indicator for full understanding.
We provide 3 things with the 3 indicators.
'Insider' indications from Largest players in the futures market.
1. Bitcoin Macro Buy Signals.
a) The Bitcoin Commitment of Traders results see us focus solely on Largest 4 Short Open Interest & Largest 4 Long Open Interest aspects of the CoT Release data.
When the difference - is tight, a kind of pinch, these have been great Buy signals in Bitcoin.
We call this difference the Delta & When Delta is 5% or less Bitcoin is a Buy.
2. Bitcoin Macro Sells.
a) A sell signal is Triggered in Bitcoin at any point the Largest 4 short OI > or = to 70
3. AMPLIFIER Trade signals 'Super' Longs or Shorts -
Extreme low volatility events leads to highly impulsive & volatile subsequent moves, if either of 1 or 2 above occur, combined with extreme low volatility
a 'Super Long' or 'SUPER SELL' is generated. In the case of the short side, given Bitcoins general expansive and MACRO Bull trend since inception, we seek an additional component
that is an extreme differential/Delta reading between 4 biggest Longs & Shorts OI.
Namely CoT Delta also must be > 47.5%
We also have a Cautionary level, where it is not necessarily a good idea to accumulate Bitcon, as a better opportunity lower may avail itself, see conditions below.
So the required logic explicitly stated below for all Signals.
1. Long - Hunt Bitcoin CoT Delta < or = 5
2. SUPER Long - Hunt Bitcoin CoT Delta < or = 5; and 2 Day Historical Bitcoin Volatility = or < 20
3. Short - Largest 4 Sellers OI = or > 70
4. SUPER Short - Largest 4 Sellers OI = or > 70; AND..
Hunt Bitcoin CoT Delta = or > 47.5 AND 2 Day Historical BTC Volatility = or < 20
5. Caution - Largest 4 Sellers OI = or > 67.5 AND Hunt Bitcoin CoT Delta = or > 45
WARNING SEE Notes Below
Note 1 - = Largest 4 Open Interest Shorts
Note 2 - = Largest 4 Open Interest Longs
Note 3 - = Hunt Cot Delta = (Largest 4 sellers OI) -( Largest 4 Buyers OI)
Caution = Avoid new Bitcoin Accumulation Right Now, A sell signal might follow Enter on next Long
Note 4 - The Hunt Bitcoin COT Delta signal is a Largest 'Insider' Tracking tool based on a segment of Commitment of Traders data on Bitcoin Futures, released once a week on a Friday.
It is a Macro Timeframe signal , and should not be used for Day trading and Short Timeframe analysis , Entries may be optimised after a Hunt Bitcoin CoT Signal is generated by separate shorter Timeframe analysis.
Note 5 - The Historical Bitcoin Volatility is an additional 'Amplifier' component to the 'Hunt Bitcoin Cot Delta' Insider Signal
Note 6 - The Historical Bitcoin Volatility criteria varies by timeframe, the above levels are those applying on a Two Day TF Chart, select this custom timeframe in Trading View.
if additional criteria are met for LONG & SHORT insider signals, they may become 'Super Longs/Shorts', see conditions box above.

Hunt Bitcoin CoT Buy/Sell signalWhy Bother another CoT signal?
Its different & focused on the Insider's.
Performance -
This Indicator provided a
1. Signal 1 = 26th March 2019 = SUPER LONG at $4,500 that saw a near $14,000 run up
2. Signal 2 = 18th & 24th June 2019 = SHORT at the second & final level $11,700 after repeated attempts & failure in the $13K range, the mini Echo Bitcoin Bull of 2019
3. Signal 3 = 17th December 2019 = LONG $6,900, Bitcoin rallied to Mid $10,500's
4. Signal 4 = 18th Feb 2020 = SUPER SHORT from $9,700's to a final extreme Low of $3,000, calling the CV-19 collapse
5. Signal 5 = 17th March 2020 = LONG from $5,400 no closure point yet
6. Signal 6 = 29th June 2020 = SUPER LONG reiterate from $10,700 no closure sell signal yet
7. Signal 7 = 17th May 2020 = LONG another accumulate LONG with no sell signal yet generated at Post H&S's low of $33,000
Note - This indicator only commences March 2019, as Bitcoin futures were a recent introduction and needed to settle for 6 months in both use and data, no signals were meaningful prior & data was light.
What is Provided. - Please note the need to also add the Hunt Bitcoin Historical Volatility Indicator for full understanding.
We provide 3 things with the 3 indicators.
'Insider' indications from Largest players in the futures market.
1. Bitcoin Macro Buy Signals.
a) The Bitcoin Commitment of Traders results see us focus solely on Largest 4 Short Open Interest & Largest 4 Long Open Interest aspects of the CoT Release data.
When the difference - is tight, a kind of pinch, these have been great Buy signals in Bitcoin.
We call this difference the Delta & When Delta is 5% or less Bitcoin is a Buy.
2. Bitcoin Macro Sells.
a) A sell signal is Triggered in Bitcoin at any point the Largest 4 short OI > or = to 70
3. AMPLIFIER Trade signals 'Super' Longs or Shorts -
Extreme low volatility events leads to highly impulsive & volatile subsequent moves, if either of 1 or 2 above occur, combined with extreme low volatility
a 'Super Long' or 'SUPER SELL' is generated. In the case of the short side, given Bitcoins general expansive and MACRO Bull trend since inception, we seek an additional component
that is an extreme differential/Delta reading between 4 biggest Longs & Shorts OI.
Namely CoT Delta also must be > 47.5%
We also have a Cautionary level, where it is not necessarily a good idea to accumulate Bitcon, as a better opportunity lower may avail itself, see conditions below.
So the required logic explicitly stated below for all Signals.
1. Long - Hunt Bitcoin CoT Delta < or = 5
2. SUPER Long - Hunt Bitcoin CoT Delta < or = 5; and 2 Day Historical Bitcoin Volatility = or < 20
3. Short - Largest 4 Sellers OI = or > 70
4. SUPER Short - Largest 4 Sellers OI = or > 70; AND..
Hunt Bitcoin CoT Delta = or > 47.5 AND 2 Day Historical BTC Volatility = or < 20
5. Caution - Largest 4 Sellers OI = or > 67.5 AND Hunt Bitcoin CoT Delta = or > 45
WARNING SEE Notes Below
Note 1 - = Largest 4 Open Interest Shorts
Note 2 - = Largest 4 Open Interest Longs
Note 3 - = Hunt Cot Delta = (Largest 4 sellers OI) -( Largest 4 Buyers OI)
Caution = Avoid new Bitcoin Accumulation Right Now, A sell signal might follow Enter on next Long
Note 4 - The Hunt Bitcoin COT Delta signal is a Largest 'Insider' Tracking tool based on a segment of Commitment of Traders data on Bitcoin Futures, released once a week on a Friday.
It is a Macro Timeframe signal , and should not be used for Day trading and Short Timeframe analysis , Entries may be optimised after a Hunt Bitcoin CoT Signal is generated by separate shorter Timeframe analysis.
Note 5 - The Historical Bitcoin Volatility is an additional 'Amplifier' component to the 'Hunt Bitcoin Cot Delta' Insider Signal
Note 6 - The Historical Bitcoin Volatility criteria varies by timeframe, the above levels are those applying on a Two Day TF Chart, select this custom timeframe in Trading View.
if additional criteria are met for LONG & SHORT insider signals, they may become 'Super Longs/Shorts', see conditions box above.

CryptoManic: Long/Short Interest ChangeA simple script to determine the change in Long and short open interest (Bitfinex symbols). i.e. the change in open interest from the previous candle.
Usage: in settings. Go to inputs and in symbol enter your symbol. e.g.
BTCUSD
ETHUSD
ADABTC
BCHBTC
EOSBTC
XRPBTC
TRXBTC
LTCBTC
It plots overlapping area chart of change in open long contracts (in green) and open short contracts (in red)
COT Net Positions
Plots the COT net positions from the legacy report data from Quandl. Plots the commercial, non commercial and non reportables. Each plot can be hidden as needed.
I've tried to capture the basic dollar based currencies and the futures such as corn, wheat, rice, oil, hogs etc. The symbols required a little translation to match what Quandl is expecting but I think I got most of them. Please let me know of any issues with these.
Part of a suite of COT related indicators based on the excellent book "the commitment of traders bible" by Stephen Briese.
I have the COT Index, Momentum, Strength and Open Interest waiting in the wings.
Currently working on a trading strategy based around these indicators,
Would love to hear if you are interested in this or have some COT trading ideas to share.
Order Flow RSI - Price / CVD / OIOrder Flow RSI blends three powerful market perspectives — Price , Cumulative Volume Delta (CVD) , and Open Interest (OI) — into one unified RSI-style oscillator.
It reveals momentum and imbalance across these data streams and highlights situations where participation, liquidity, and positioning disagree — moments that often precede reversals.
What it does
The indicator converts:
Price → RSI (classic momentum),
CVD → RSI (buy/sell pressure balance),
OI → RSI (position expansion/contraction)
…then plots all three RSIs together on the same 0–100 scale.
A fourth Consensus RSI (average of any two or all three) can optionally be shown to simplify the view.
Core logic
CVD engine – based on TradingView’s native volume-delta request.
Modes: Continuous (default, smooth line), Anchored (resets each session), Rolling window.
Open Interest – pulled automatically from the symbol’s “_OI” feed; aligns to chart timeframe for real-time flow.
RSI calculation – standard RSI applied to each data stream, optionally smoothed (SMA / EMA / RMA / WMA / VWMA).
Signals – optional background highlights when:
All three RSIs are overbought (red) or oversold (green), or
Any pair show opposite extremes (e.g., price overbought + OI oversold).
Consensus RSI – arithmetic mean of the selected RSIs, summarizing overall market tone.
Inputs overview
CVD settings: anchor period, lower-TF delta, mode, rolling length
RSI lengths: separate for price, CVD, OI
Smoothing: type + period applied to all RSIs at once
Consensus: choose which RSIs to average
Signals: enable/disable each combination; optional alerts
Levels: adjustable OB/MID/OS (default 70 / 50 / 30)
Visuals: fill between active RSIs, background highlights, level lines, colors in Style tab
How to read it
All 3 overbought (red): broad exhaustion → possible correction
All 3 oversold (green): broad depletion → possible bounce
Opposite pairs: divergence between price and participation
Price↑ but OI↓ (red) → weak rally, fading participation
Price↓ but CVD↑ (green) → hidden accumulation
Combine with structure and volume profile for confirmation.
Notes
Works best on assets with full CVD + OI data (futures, BTC, etc.).
Use Continuous CVD for smooth RSI, Anchored for session analysis.
Smoothing 2–5 EMA is a good starting point to reduce noise.
All styling (colors, line types, thickness) is adjustable in the Style tab.
Limitations & caveats
CVD requires accurate tick/volume/delta data from your data feed. Performance may differ across instruments.
OI availability varies by exchange / symbol. Where OI is absent, pairwise OI signals are not evaluated.
This indicator is a tool — it generates signals of interest, not guaranteed profitable trades. Backtest and combine with your risk rules.
Smoothing introduces lag; longer smoothing reduces noise but delays signals.
Order Flow RSI bridges traditional momentum analysis and order-flow context — giving a multi-dimensional view of when markets are truly stretched or quietly reloading.
Sometimes it works, sometimes it doesn't.

Net Positions (Net Longs & Net Shorts) - Volume AdjustedNet Positions (Net Longs & Net Shorts) - Volume Adjusted
Based on the legendary LeviathanCapital - Net Positions Indicator
Adjusted to use volume calculation for more percise data
Few important caveats:
- EVERY BUYER NEED A SELLER AND EVERY SELLER NEED A BUYER
- This indicator is meant to give you a sense of direction for the market orders ("who is the aggresive side") and should be used as confluence not as true values
In reality, in market movement each candle will contain both buying and selling, contracts closing and opening but due to some limitations that is hard to make properly.
Even with these limitations this indicator can provide a better picture than some other even external tools out there.
The main benefit of using volume delta and open interest instead of just open interest and candle closes G/R that it solves the problem with extreme cases where there might be an absorption of market orders.
Example of the Volume Edge in Action:
Bullish Absorption (The "Trap" for Sellers)
Candle Close + OI: A large Red Candle forms with Rising OI. The interpretation is simply: "New shorts are opening"
Volume Delta + OI: The same Red Candle with Rising OI has a Positive Volume Delta.
The True Story: Aggressive buyers tried to push the price up, but they were completely absorbed by large passive sell orders.
The "Volume Delta" logic:
If OI ↑ → new positions opened
• Delta ↑ → net longs added
• Delta ↓ → net shorts added
If OI ↓ → positions closed
• Delta ↑ → shorts closing
• Delta ↓ → longs closing
The "Price" logic:
If OI ↑ → new positions opened
• Price ↑ → net longs added
• Price ↓ → net shorts added
If OI ↓ → positions closed
• Price ↑ → shorts closing
• Price ↓ → longs closing

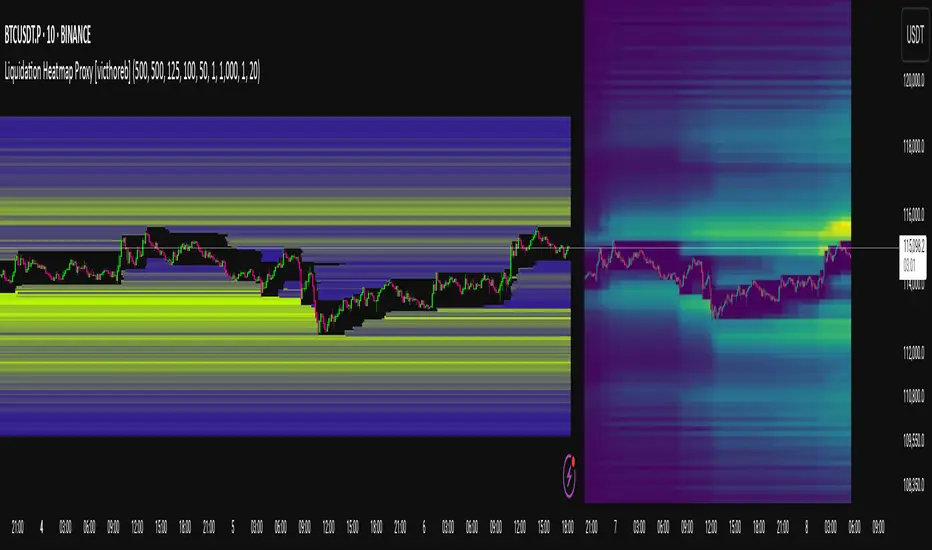
Liquidation Heatmap Proxy [victhoreb]Author: victhoreb
This script was inspired by the Coinglass indicator: www.coinglass.com
It divides each bar into subbars determined by the intrabar period. For each bar, it considers subbars with a positive OID (open interest delta) (if the user sets "Filter by Signal" to true, it only considers subbars with OID > 0 from a main bar that had a peak in open interest). In these subbars, it considers opened long/short positions based on the intrabar price movement and the dispersion factor (which becomes completely unnecessary if the user is using Intrabar Resolution in ticks; in this case, set the dispersion factor = 0).
After determining the opened long and short positions, it determines, based on the user-selected leverages, the liquidation level for each position. The width of each level is given by syminfo.mintick * scale. The script uses the intrabar OID from the previous step to store an estimate of the number of contracts to be liquidated at each level. This estimate is used to color the levels by order of magnitude.
If there is a subsequent increase in liquidations at a pre-existing level, the script accumulates the estimated number of contracts to be liquidated and repaints the level. A note about a visual limitation of the script is important: in Coinglass' version, when there is a subsequent increase in liquidations at a pre-existing level, Coinglass paints the level a brighter color ONLY from the moment of the increase—however, this script does not do this; it repaints the entire level with the brighter color. Note: While accurate, this script is only a proxy. Use at your own risk.
This script has alerts for when there is liquidation in the long or short direction.
Open Intrest / Volume / Liquidations (Suite) [BigBeluga]This indicator is a suite of tools that aims to provide traders with efficient metrics to analyze the market in a different way, such as various types of Open Interest, Intraday Volume, and Liquidations.
This indicator can both save time and also provide a different approach to the usual price action trading style.
🔶 FEATURES
The indicator contains the following features:
Open Interest Suite
- Delta OI
- Net longs and shorts
- OI Relative Strength Index
Intraday Volume Suite
- Bullish and Bearish LTF Volume
- CVD
- Delta Volume
Liquidations Suite
- Long and Short Liquidations
- Cumulative Liquidations
🔶 EXAMPLE OF SUITE
In the example above, we can see how we can plot long and short positions, both opening and closing out.
This can give a unique way to view which side is the strongest but also which side has the most resting liquidity.
For example, if more longs are entering the market, it also means more liquidity for longs and vice versa.
Or, for example, plotting the delta OI will allow the user to see big percentages in change and spot big areas of position closing out.
This presents a fascinating method for observing numerous positions closing out in conjunction with a surge of liquidations, which could indicate a potential reversal in price.
Here, we can see a basic example of using intraday volume on a 1m LTF.
With this, we are able to see both bullish and bearish volume of the same candle, very useful to see both volumes traded in the same candle.
Using the CVD to see the overall direction based purely on the volume and spot divergence, for example, the price in an uptrend but CVD going down, indicating weak shorts in the market or trapped shorts.
Or simply view liquidations happening in the market in a very different way, both long and short liquidation at the same time + the option to use multi-timeframe liquidations.
🔶 CONCLUSION
The idea of this script is to provide a set of tools in a unique script to optimize time and analyze the market in both a quick way and in a different way than usual.

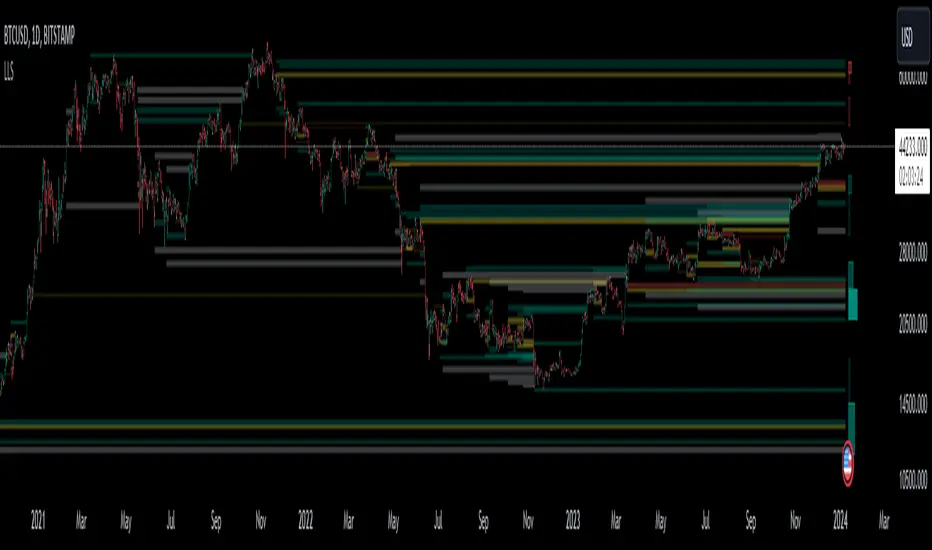
Liquidation Level ScreenerThe Liquidation Level Screener is an analytical tool designed for traders who seek a comprehensive view of potential liquidation zones in the market. This script, adaptable to almost any timeframe from 1 minute to 3 days, offers a unique perspective by mapping out key liquidation levels where significant market actions could occur.
Key Features:
Multi-Exchange Data Aggregation: Unlike many other indicators, the Liquidation Levels Indicator compiles data from multiple leading exchanges including Binance, Bitmex, Kraken, and Bitfinex. This approach ensures a more holistic and accurate representation of market sentiment, providing insights into potential liquidation points across various platforms.
Customizable Timeframes and Modes: The script is versatile, working effectively across various timeframes. It operates in two distinct modes:
Actual Levels Display: Visually represents potential liquidation levels.
Settings Mode: Showcases an open interest (OI) oscillator. When OI is exceptionally high, indicating a surge in opened positions at a specific candle, it signals traders to be vigilant about upcoming liquidation levels.
Three-Tier Liquidation System: The indicator categorizes liquidation levels into three distinct tiers based on open interest levels—1, 2, and 3—with Level 3 representing the highest concentration of open positions. This tiered approach allows traders to gauge the significance of each level and adjust their strategies accordingly.
Histogram Visualization: A novel feature of this script is the histogram on the chart's right side, representing the concentration of liquidation levels in specific market zones. This visual aid helps traders identify crucial areas that warrant close attention, enhancing decision-making.
Customizable Options:
Moving Averages: Choose from a wide range of moving average types, including VWMA, SMA, EMA, and more, to tailor the indicator to your analysis style.
Histogram Settings: Adjust the number of histograms, lookback bars, and their proximity to the latest candle, allowing for a personalized density and range of visualization.
Liquidation Level Sensitivity: Set thresholds for different liquidation levels, fine-tuning the indicator to detect varying degrees of market leverage.
Color Coding: Customize the color scheme for different leverage levels, enhancing visual clarity and ease of interpretation.
The Liquidation Level Screener offers a unique edge by highlighting potential zones where significant market movements can occur due to liquidations. By consolidating data from multiple exchanges, it provides a more rounded view of market behavior, which is essential in today’s interconnected trading environment. The tiered liquidation system and histogram feature equip traders with the ability to identify and focus on key market segments where high activity is expected. This tool is particularly valuable for traders who base their strategies on market liquidity and leverage dynamics.
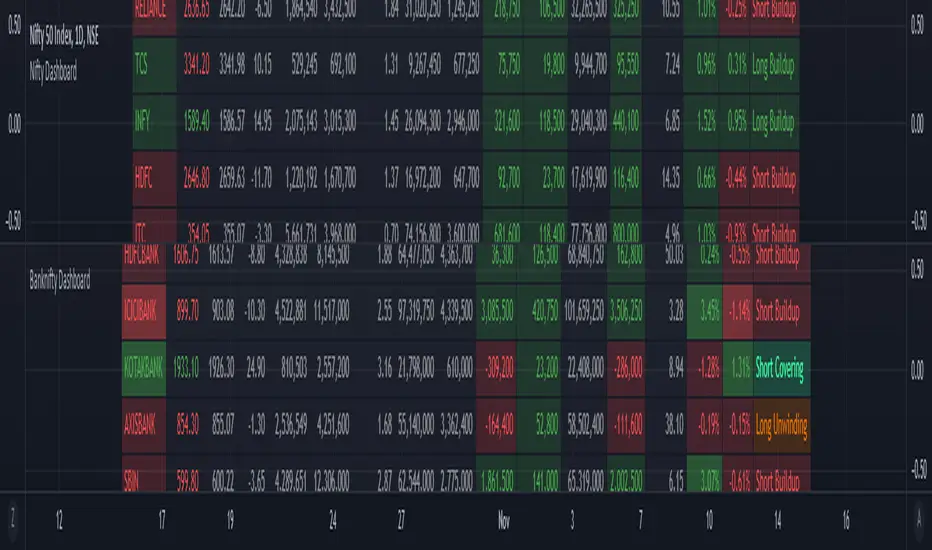
ILM NSE Banknifty DashboardUse this indicator on Daily Timeframe
This indicator shows the important metrics of BANKNIFTY and its top 7 constituent stocks.
This indicator is similar to Open Interest indicator but consolidates the data for NIFTY stocks
For more information, look at the Open Interest Indicator