MTF Heikinashi BarOVERVIEW
This indicator shows whether Heikin Ashi is up or down, represented by a bar. This indicator is compatible with MTF.
CONCEPTS
What do you want to know about market analysis?
Do you want a hard analysis? You can look for it.
All I want to know is whether the commonly known technical analysis is 'UP' or 'DOWN'.
All I want to know is whether the current market price is going up or down. Not only for the current, but also for the monthly, weekly, and daily status.
I want to make a decision in a moment. Without even thinking about it.
That is why I created a color-coded bar indicator to show the status.
No need to frown anymore.
DETAILS
Heikin means average. Ashi means legs. In this case, it means a candle.
Close = (Close + Open + High + Low) / 4
For more information, click here.
tradingview.com
Heikin Ashi Up ⇒ green
Heikin Ashi Down ⇒ red
In den Scripts nach "mtf" suchen

MTF EMA Ribbon & Bands + BBMulti Timeframe Exponential Moving Average Ribbon & Bands + Boillinger Bands
I used the script "EMA Ribbon - low clutter, configurable " by adam24x, I made some color change and I added a few indicators (Boillinger Bands, EMA on multi timeframe and EMA bands from "34 EMA Bands " by VishvaP).
The script can display various EMA from the chart's timeframe but also EMA from other timeframes.
Bollinger Bands and EMA bands can also be added to the chart.

MTF VWAP & StDev BandsMulti Timeframe Volume Weighted Average Price with Standard Deviation Bands
I used the script "Koalafied VWAP D/W/M/Q/Y" by Koalafied_3 and made some changes, such as adding more standard deviation bands.
The script can display the daily, weekly, monthly, quarterly and yearly VWAP.
Standard deviation bands values can be changed (default values are 0.618, 1, 1.618, 2, 2.618, 3).
Also the previous standard deviation bands can be displayed.

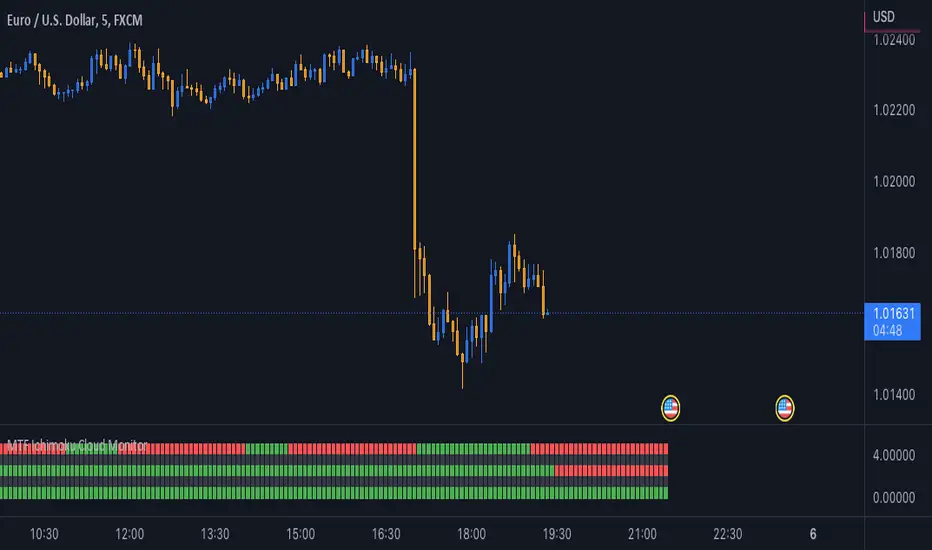
MTF Ichimoku Cloud MonitorIchimoku Kinko Hyo is a technical analysis method that builds on candlestick charting to improve the accuracy of forecast price moves.
his Indicator build for Monitor SenkouSpanA & SenkouSpanB Lines (Kumo Cloud) status and you can watch 3 Time Frames Status on one bar and in one timeframe.
You can select timeframe and set Inputs for lines from Indicator setting.
Good trading to all ...
MTF EMA with Gann square of nineThis indicator can display Exponential Moving Average 200 (last point) at different timeframe simultaneously.
The default timeframe of EMA200 is 5min, 15min, 30min, 1H, 2H, 4H, 1D and 1W.
In addition, this script come with Gann square of nine nearest level.

MTF CCI BarOVERVIEW
This indicator shows whether Commodity Channel Index (CCI) is above or below 0, represented by a bar. This indicator is compatible with MTF.
CONCEPTS
What do you want to know about market analysis?
Do you want a hard analysis? You can look for it.
All I want to know is whether the commonly known technical analysis is 'UP' or 'DOWN'.
All I want to know is whether the current market price is going up or down. Not only for the current, but also for the monthly, weekly, and daily status.
I want to make a decision in a moment. Without even thinking about it.
That is why I created a color-coded bar indicator to show the status.
No need to frown anymore.
DETAILS
CCI is a momentum oscillator used in technical analysis primarily to identify overbought and oversold levels by measuring an instrument's variations away from its statistical mean. For this indicator, I have removed the concept of overbought and oversold.
0 <= CCI green
0 > CCI red
However, with future upgrades, I would like to color-code it for overbought and oversold conditions as well.

MTF EMASMulti time frame EMA
This script will plot the configured EMAS on the current time frame (CTF) and also the same EMAS on a higher time frame (HTF).
Hard coded according:
* 5m EMAS will be plotted on TF bellow 5m
* Daily EMA will be plotted on TF above 5m and bellow 1D
* Weekly EMA will be plotted on daily TF
* Monthly EMA will be plotted on weekly TF
This configuration give us the opportunity to watch EMA support/resistance from HTF on the CTF

MTF High LowThis is a Multi-Time Frame High Low Indicator that plots the highest and lowest price levels of the chart timeframe and a user selected higher timeframe.
The length can be optimized by the user from settings (default value is 6 candles) and table position can also be adjusted.
The calculation does not takes into account the last candle price data to form a view using the current close price as described below:
If Close > mid value of High + Low, view is Bullish
If Close < mid value of High + Low, view is Bearish
The above is also calculated for the higher timeframe and view for both timeframe is updated in the chart.
The color coding is dynamic based upon the current close price levels and comparisons with High, Low and Mid values.
The mid values level plot is hidden by default and can be enabled and saved as default if the user likes so.

MTF RSI Guppy [Moto]Hi traders,
Special thanks to abdomi for posting the original script referenced
I'm not a fan of using moving averages. but I am a big fan of the RSI. The plotted lines of this guppy show where price of the observed asset has to be to close above or below the 50 midline of a standard 14 period RSI across multiple timeframes.
For example, if BTCUSDT closes above the 'D' plot of the guppy, it will be closing above the 50 midline of the RSI on a daily time frame.
Each plot is timeframe dependant and can be changed in the settings. I've included a optional fill color across the plots for directional bias. These plots, like most moving averages give a hint towards moving support and resistance structures. Plotshapes and barcolors have been included to indicate when price crosses over multiple specific plots simultaneously.
Also 'On' by default is a view of 'Overbought' and 'Oversold' areas with independant resolution setting, daily by default.
Current time frames include:
4 hour
12 Hour
Daily
3 Day
Weekly
Monthly
Quarterly
Users can change the asset being referenced, and the resolutions, but labels are currently hard coded. One can also change the label distance from plot and size.
Thanks

MTF 24-hour Volume [Anan]█ OVERVIEW
Tradingview added a new 24-hour Volume indicator to Pine. It’s designed to calculate the volume of daily trading turnover in a particular currency.
It works in the same way as the well-known Volume indicator does. The difference is that 24-hour Volume is a metric used to track the total value of all transactions within a 24-hour period. It can be used to measure market interest in a specific currency over the past day and night. You can read more about how the 24-hour Volume indicator works in Help Center .
█ FEATURES
- Multi Time Frames up to four customizable slots.
- Volume Change by "quote" currency.
- Volume Change %.
- Volume MA Change %.
- Control table colors/position as you like.
**Designed to work with Crypto pairs**

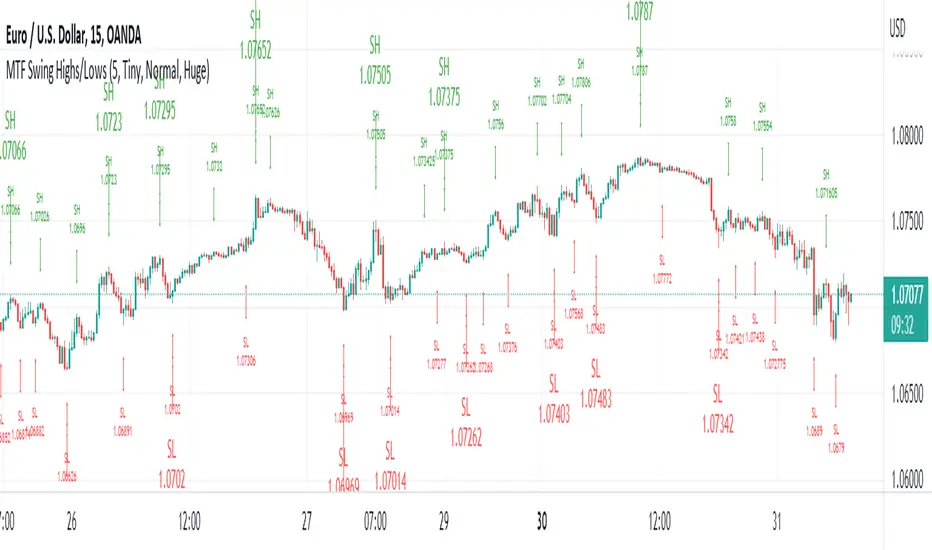
MTF Swing Highs/LowsI designed this indicator out of necessity for the Market structure/Price action trading strategy I use.
I thought I'd share. :)
This indicator displays Swing Highs and Lows an 3 timeframes based on the Chart timeframe, as follows:
Chart TF Higher TF Highest TF
1m 5m 15m
5m 15m 60m
15m 60m 240m
60m 240m Daily
You can change the font size of the labels as you'd prefer.
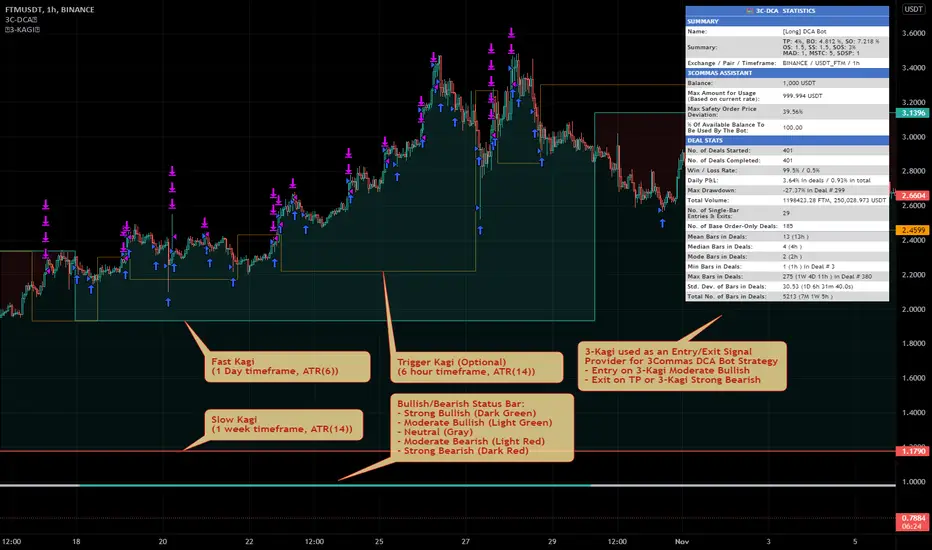
MTF Triple Kagi Indicator v1.0Introduction
The indicator attempts to implement three (3) time-based, multi-timeframe, non-repainting Kagi lines as an overlay to your chart and applying a trend bullish/bearish trend strength evaluation based on the position of the Kagi close prices between the Fast Kagi and Slow Kagi.
How is it original and useful?
This indicator is unique in that it combines a Fast and Slow Kagi timeframes and applies the following trend analysis to determine bullish/bearish strength:
Strong Bullish = when both Fast and Slow Kagi are below the current price and Slow is less than or equal to Fast Kagi.
Moderate Bullish = when both Fast and Slow Kagi are below the current price and Slow is greater than Fast Kagi.
Neutral = when current price is between the Fast and Slow Kagi.
Moderate Bearish = when both Fast and Slow Kagi are above the current price and Slow is less than Fast Kagi.
Strong Bearish = when both Fast and Slow Kagi are above the current price and Slow greater than or equal to Fast Kagi.
In addition, the indicator adds a Trigger Kagi that you can optionally use as a faster Kagi to see more confirmation of trend within the Fast/Slow Kagi combination. It is not used in the bullish/bearish comparison analysis but is simply informative in confirming the trend with a smaller timeframe than the Fast Kagi.
How does it compare to other scripts in the Public Library?
This indicator makes use of the security() function and applies the best-practices as provided by the PineCoders' script called `security()` revisited so that the indicator will not repaint when you refresh the chart or re-open it at a later date. In addition, at the time of initial publishing, this indicator is the only publicly available indicator that combines multiple time-based Kagi lines to offer a simple trend analysis status for short-term or long-term traders.
What does it do and how does it do it?
When applied to the chart for the first time, the default settings will work to produce Kagi lines from the beginning of the chart history up to the real-time bar. All three Kagi lines will default to the current chart's timeframe, therefore it is expected that you open the settings and adjust the Fast and Slow Kagi settings to provide the full effects of the indicator's features. The example chart above is using a 1-Hour chart with a Fast Kagi of 1 day (ATR(6)), a Slow Kagi of 1-Week (ATR(6)) and a Trigger Kagi of 6-Hours (ATR(14)). These settings are not universal for all markets; thus, it will require trial and error adjustments to tune the indicator to the specific market you are evaluating.
Lastly, the example chart above is illustrating how this indicator could be used with the 3Commas DCA Bot Strategy to provide entry and exit signals to simulate a bot's performance using the powerful Strategy Tester within TradingView to further evaluate the indicators influence on hypothetical trading conditions. The indicator provides a plot data point called "Kagi Bullish/Bearish Signal" that can be used in other chart strategies as a signal provider. The following is the meaning of the numeric signal value for this data point:
Strong Bullish = 2
Moderate Bullish = 1
Neutral = 0
Moderate Bearish = -1
Strong Bearish = -2
Enjoy! 😊👍
MTF Kagi Indicator v1.0Introduction
The indicator attempts to implement a time-based, multi-timeframe, non-repainting Kagi lines as an overlay to your chart using traditional candlesticks.
How is it original and useful?
This indicator is unique in that it allows you to choose from among three different methods to define the reversal amount. They are:
ATR (Average True Range): After each Kagi line is drawn, the latest ATR value from the selected timeframe will be used until a new vertical Kagi line is drawn. At this point, the latest ATR value will be used for the reversal amount until it changes again. This means that the reversal amount will adjust as price action volatility changes.
Fixed Amount: This method will be useful if you desire to fix the reversal amount, like the normal Kagi Chart. Thus, use this option if you desire to mimic the same Kagi Chart on TradingView.
Percent of Price: This method, like the ATR, will produce the reversal amount using the latest close price against the given percentage value.
In addition, the indicator will allow you to define the Up and Down line colors and width. You can even elect to have a Kagi line drawn on the real-time bar or not.
How does it compare to other scripts in the Public Library?
This indicator makes use of the security() function and applies the best-practices as provided by the PineCoders' script called " `security()` revisited " so that the indicator will not repaint when you refresh the chart or re-open it at a later date. In addition, the indicator provides three possible alerts for Alert Conditions or Any Alert() Function Call. They are:
"Break Shoulder" - this alert will trigger (Once Per Bar) when the close price crosses above the shoulder (higher) of the previous Kagi line.
"Break Waist" - this alert will trigger (Once Per Bar) when the close price crosses below the waist (lower) of the previous Kagi line.
"New Kagi Line" - this alert will trigger (Once Per Bar) when the indicator draws a new vertical Kagi line and continues to monitor the next trend change.
When using the "Any alert() function call" option in creating alerts, the following placeholders are supported in the alert message: {{shoulder_price}}, {{waist_price}}, and {{kagi_close_price}}
What does it do and how does it do it?
When applied to the chart for the first time, the default settings will work to produce Kagi lines from the beginning of the chart history up to the real-time bar. The Kagi line width will have a width of 1 pixel and the colors will match the normal color schemes that TradingView charts have for rising and falling colors. The reversal method will default to ATR with a period length of 14 so that it can provide a visually appealing Kagi lines where the reversal amount will be adaptive for all price charts. The default timeframe will be the chart's timeframe, but it can be changed to any higher timeframe. Using a timeframe that is lower than the current chart will not disable the indicator, but the lines will not be accurate since lower timeframe prices are being grouped to fit the current timeframe.
Enjoy! 😊👍

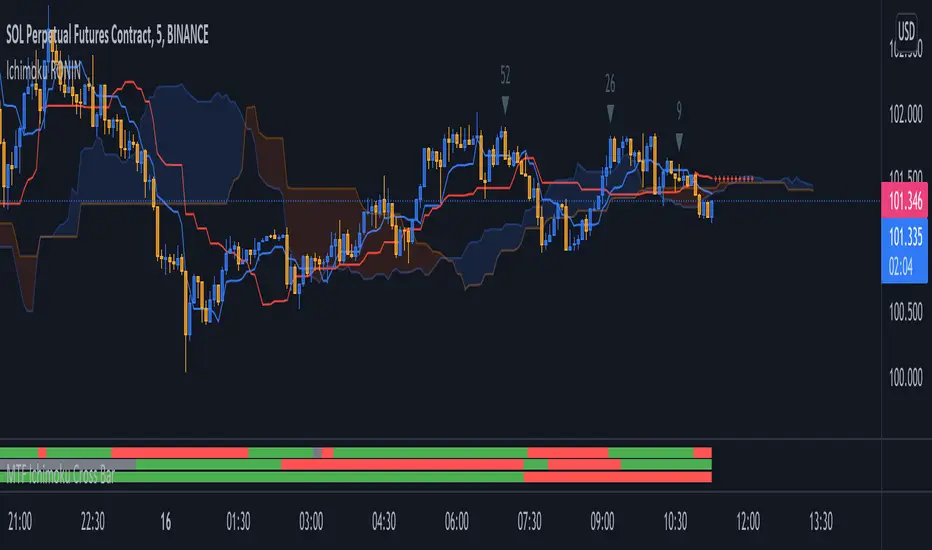
MTF Ichimoku Cross MonitorIchimoku Kinko Hyo is a technical analysis method that builds on candlestick charting to improve the accuracy of forecast price moves and Crossing TenkanSen ((HH + LL)/2 for the last 9 periods) & KijunSen (HH + LL)/2 for the last 26 periods) is One of major strategies on Ichimoku.
This Indicator build for Monitor Tenkansen & Kijunsen Lines status and you can watch 3 Time Frames Status on one bar and in one timeframe.
You can select timeframe and set Inputs for lines from Indicator setting.
Good trading to all ...
MTF Pivots Zones [tanayroy]Dear Fellow Traders,
I only publish scripts that I use and found good for my trading. Pivots are my favorite indicator. I use daily, weekly, monthly, quarterly, and yearly pivots levels. multiple pivot zones are very strong levels and I like to watch these levels for possible price action.
But when I include all pivots levels at a time, my charts get too clumsy. To see price action properly, you need a clean chart. And when we trade we want to see only important levels within the price horizon.
To resolve this, I created this script, which shows important levels within my display option. I control the display option with 14 periods ATR and a multiplier to adjust the display levels.
The following chart displays levels within 14 ATR * 0.5 multipliers. As the price progress, it will automatically add levels and delete levels that do not come within this option.
What levels are included?
I have used traditional pivot calculation and included Daily, Weekly, Monthly, Quarterly, and Yearly pivots with high and low.
What options are available?
You can replace the yearly timeframe with your desired time frame and can adjust the ATR multiplier to increase or decrease display levels.
Use this in 5m, 15m, or 1H chart or any timeframe below Daily.
Please like, share, and comment.

MTF MACD BarThis is a multi time frame momentum indicator. Using this indicator you can measure three different time frame momentums as per user preference. they can customize as per their needs. It will give simple and powerful look.

MTF MACD (PPO) [TANHEF]Mult-Timeframe Moving Average Convergence Divergence (MACD) and Percentage Price Oscillator (PPO) indicator that allows for viewing of 1 to 5 different Timeframes.
Brief Summary
The primary benefit of multi-timeframe indicators is getting better entries and confirmation from viewing multiple time frames at once, which can often get overlooked.
MACD shouldn't be only used by itself, it is a lot more consistent when applied in the same direction as the trend as well as multiple other things including support, resistance, and volume improve the outcomes of the MACD results.
Personally, I look for good entries on higher and lower time frames (multiple timeframes must agree with the buying or selling). For example, if a higher timeframe looks like a good long entry (MACD line is crossing up and below the zero line), then the lower timeframes should be checked to ensure they are not oversold or overextended (the MACD line must be low or below the zero), once the lower and higher timeframes are in agreeance an entry can be made.
What is Moving Average Convergence Divergence (MACD)?
Moving average convergence divergence (MACD) is a trend-following momentum indicator that shows the relationship between two moving averages of the price. The MACD is calculated by subtracting the 26-period exponential moving average (EMA) from the 12-period EMA.
What is the Percentage Price Oscillator (PPO)?
The PPO is identical to the MACD indicator, except the PPO measures percentage difference between two EMAs, while the MACD measures absolute (or dollar) difference. The PPO has the advantage of being comparable to other assets with different prices, whereas MACD readings are not comparable. For example, regardless of the asset's price, a PPO result of 10 means the short-term average is 10% above the long-term average.
A signal line can be displayed on Timeframe, including:
- MACD & Signal Line crosses (Green when MACD above Signal Line and Red when MACD below Signal Line)
- Histogram Direction (fast and slow EMA gap)
- SuperTrend for identifying trend direction (green for uptrend, red for downtrend)
- EMA Trend for identifying trend direction (above EMA = up trend and green, below EMA = down trend and red)
Cross Dots and Potential cross dots
- Green Dot, is displayed when the MACD crosses the Signal Line
- Red Dot, is displayed when the MACD crosses the Signal Line
- Yellow Dot. Potential cross up (green dot) on next bar. Displayed when if the same distance a MACD moves on a bar is applied to the next bar will cause a MACD and Signal Line Cross. This is calculated by checking if the value change of one bar is added to the current MACD value would lead to a cross on the next bar, the it is a potential up dot.
- Purple Dot. Potential cross down (red dot) on next bar. Displayed when if the same distance a MACD moves on a bar is applied to the next bar will cause a MACD and Signal Line Cross. This is calculated by checking if the value change of one bar is added to the current MACD value would lead to a cross on the next bar, the it is a potential down dot.
Best Fit Settings
- Can be applied to the MACD, Signal Line, and Histogram to re-scale (stretch) to fit them within the space of the +2 and -2 range that each timeframe is provided on this indicator.
- The lookback distance value is used to lookback a certain distance to ensure everything scaled to fit well.
Labels are displayed on the right of the indicators, including:
- a label identifying 'line indicator' is currently being displayed
- the Timeframe corresponding to each MACD or PPO indicator
- the MACD or PPO of each Timeframe

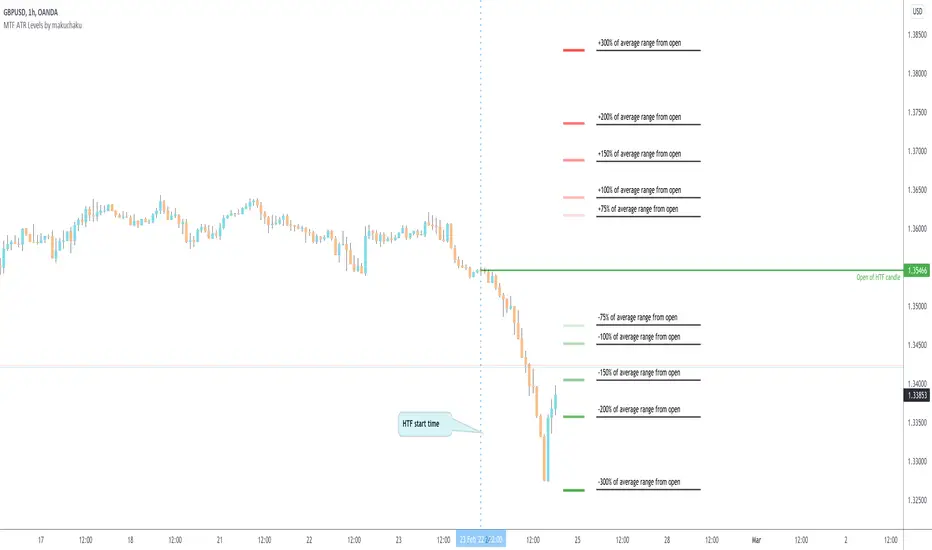
MTF ATR Levels by makuchakuKnowing how big a range one is operating in (from a higher time frame perspective) is very important to understand where the reversals could potentially come from.
This indicator uses the closing price of previous HTF candle and plots its ATR range - and several levels on top of it.
+/- 75%
+/- 100%
+/- 150%
+/- 200%
+/- 300%
MTF Vegas tunnel & pivots A script made to simplify trend identification, major and minor pivot but also bollinger band based signal
It is composed of a suite of indicators tuned to match my trading style. Feel free to tune settings.
Multi timeframe vegas tunnel
As you know, vegas tunnel are composed of 3 ema (144, 169, 233) which you can tune length in the parameters. Those are used to identify possible support & resistance zone.
Having support & resistance allow you to easily identify the trend. But what is even better is to be able to always have an global view of the market
without having to switch time frame. This is why vegas tunnel are displayed from 1m to Daily (1m, 5m, 15m, H1, H4 & D).
This is to be able to identify trend/support/resistance on a given timeframe while keeping an eye on the upper timeframe
Major and minor pivot:
This part is based on benchch Major and Minor Fib points
It will highlight high and low if no new high or low has been established for a given period of time.
Super useful to find high and low to draw fib retracement to find your trade entry point, SL, PTP and TP
BB% Signal:
Last but not least BB signal. This is based on the TV indicator BB% indicator but adding signal on chart when crossing up or down 0.8 & 0.2.
It allow you to potentially find weakness in the current movement and should alarm you that it might be time to find an entry or get out of your current trade.

MTF MA Reference Levels - SamXThe intent of this indicator is to provide a way to easily reference the same moving average across multiple timeframes without the clutter
of multiple moving average lines being printed on the chart (which can also lead to potential difficulty in easily distinguishing which line
represent what timeframe).
This was built at the request of a friend. He would draw up similar lines representing higher timeframe moving averages as a reference
for how a trend might be forming and/or reversing.

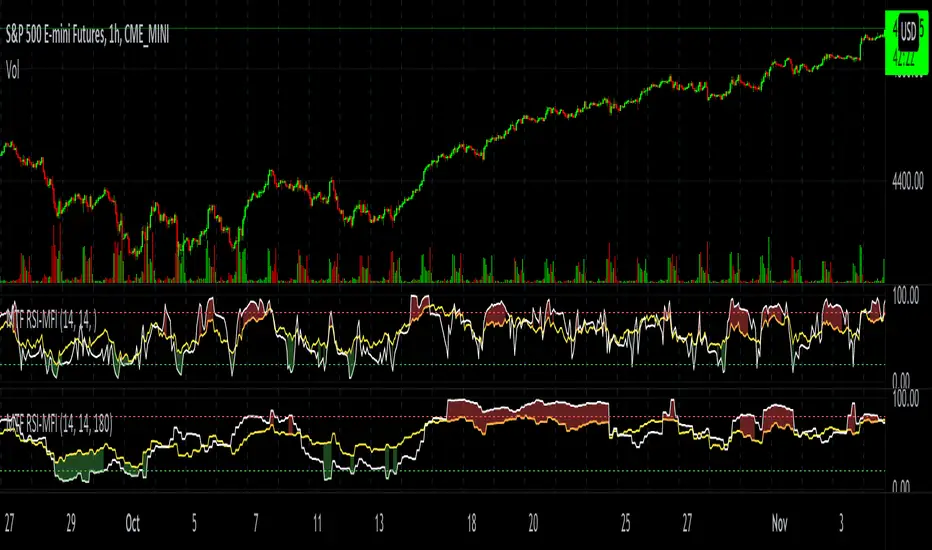
MTF RSI-MFIThe script plots both RSI and MFI of security, automatically highlights oversold and overbought conditions and allows for calculating indicators on timeframes other than the chart.
MTF Bullish/Bearish IndicatorThe script plots a bullish/bearish indicator by evaluating a variety of moving averages for a security across multiple timeframes. It's derived from built in Technical Analysis indicator published by TradingView. The result of evaluation is plotted on the chart in green light/red light format in a configurable location.
evaluated moving averages include
- SMA 10, 20, 30, 50, 100, 200
- EMA 10, 20, 30, 50, 100, 200
- Hull MA 9
- VWMA 20
- Ichimoku Cloud
moving averages are evaluated at chart timeframes and 5 min, 15 min, 30 min, 120 min, 240 min, and daily by default but can be customized.

MTF DPO-RSI IndicatorThis indicator uses the principle of taking the RSI of DPO readings across multiple time frames in order to provide trade signals and an overarching view of market conditions to the trader. My hope with creating this indicator was to present more divergence based signals than your typical indicator, while still keeping those signals at a high quality.
In the settings menu, you may specify:
Indicator Timeframe - the chart resolution that is used to calculate values.
Source DPO Length - the number of bars used to calculate the Detrended Price Oscillator value. The DPO value is the source for the RSI calculations.
DPO Hull Smoothing - how much smoothing is applied to the DPO . Smoothing is accomplished by taking a Hull Moving Average of the closing price, and using this to calculate the DPO value.
RSI Length - the number of bars used to calculate the RSI of the DPO value.
Time Multipliers 1 through 6 - use this to define what resolution each plot will represent. A value of 1 will represent the current Indicator Timeframe. A value of 3 will represent 3 times the current Indicator Timeframe, etc.
Show Plot 1 through 6 - toggles the display of plots.
How I trade with this indicator:
A value of under 30 represents an over sold state for that particular plot. A value of over 70 represents an overbought state for that plot.
Identify divergences on a lower timeframe plot which are apparent in overbought or oversold conditions, and confirm the signal with an overbought or oversold condition, or a divergence on a higher timeframe plot. Divergences which begin in oversold or overbought territory and end inside the 30-70 range tend to be more reliable signals, in my experience. Like all indicators, this is best when used in conjunction with other indicators. Trend indicators, such as double EMA's and Supertrend are my favorite pairing, and a stochastic RSI is a good tool to have as well.
This is my first published indicator! If you find unique ways to use it, drop me a message. I'd love to know what you find. :)
