In den Scripts nach "mtf" suchen
Indicator Panel MTF (MACD, RSI, Momentum, Stoch, CCI)This script shows the values of MACD, RSI, Momentum, Stoch, CCI for current and higher time frames in a panel. if higher time frame is equal or smaller than current time frame and it doesn't show the values for HTF.
And also it shows if their values are increasing, decreasing or equal to last value with "▲", "▼", "="
The signal length for all indicators is 9 and used EMA.
histogram value is indicator value - it's signal value. with this value you can see that indicator and its signal getting closer or not. you may think it's as momentum.
Some functions and idea is used from following scripts:
Thanks to Lucf for the following script:
Thanks to Ricardo Santos for the following script:


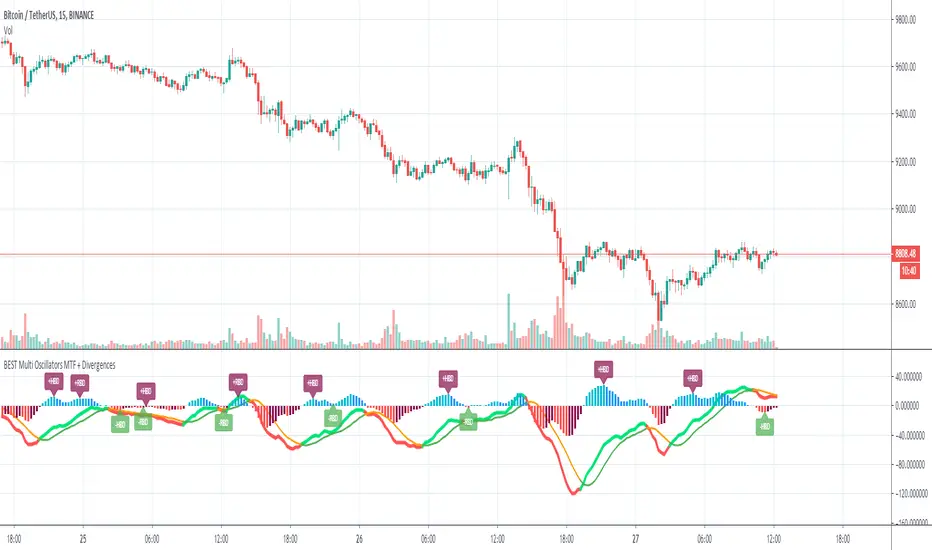
[ALL-IN-ONE] OSCILLATORS MTFHi everyone
I. 💎 SCRIPTS ACCESS 💎
1. My website URL is in this script signature at the very bottom (you'll have to scroll down a bit and going past the long description) and in my profile status available here : Daveatt
Due to the new scripts publishing house rules, I won't mention the URL here directly. As I value my partnership with TradingView very much, I prefer showing you the way for finding them :)
2. You obviously can contact me directly for more information
II. 🔎 ALL-IN-ONE OSCILLATORS MTF 🔎
This indicator offers to display many oscillators with a multi-timeframe option
The available oscillators so far are:
1. MACD
2. MACD ZERO LAG
3. RSI
4. DMI/ADX
5. ATR
6. STOCHASTIC RSI
7. TRUE STRENGTH INDEX
8. CHANDLE MOMENTUM OSCILLATOR
9. VORTEX INDICATOR
10. COMMODITY CHANNEL INDEX
11. RATE OF CHANGE
III - 📊 FEATURES 📊
3.1- 🔔 Alerts 🔔
LONG/SHORT alerts available for all oscillators.
You'll find only two events GoLong or GoShort because I simplified it a lot.
Let's assume the user wants to create alerts on a MACD first, and in a second time on an RSI.
All he/she has to do is :
1) to select the MACD parameter in the indicator and then activating the events GoLong and/or GoShort.
2) once done, select RSI filter in the indicator and then activate the events GoLong and/or GoShort.
3.2- 🔌&🕹️ (Plug and Play)
This feature is optional but very cool regardless.
Compatible with any of my Plug&Play trading tools.
You'll get instant results by connecting the ALL-IN-ONE to another Plug and Play compatible system.
Feel free to send a request my way if you want more details on that
3.3 - ⏱️ Use current chart resolution or any available timeframe
The Multi-timeframes component will expand your analytics capabilities even more.
IV - Use Cases
The use cases are maybe limitless
- an H4 oscillator combined with your indicator Plug&Play applied on an H1 chart.
- an RSI reversal signal used with your Backtest system.
- a 30-minutes True Strength Index plugged to a 5-minute indicator- itself combined into a Backtest system. #mind #blown
- ...
-------------------------------------------------------------------------------------------------------------------------------------
If you have any doubts or questions, please hit me up directly or ask in the comments section of this script.
I'll never claim I have the best trading methodology or indicators.
You only will judge and I'll appreciate all the questions and feedback you're sending my way.
They helped me a ton for developing indicators based on all the requests I received.
Kind regards,
Dave
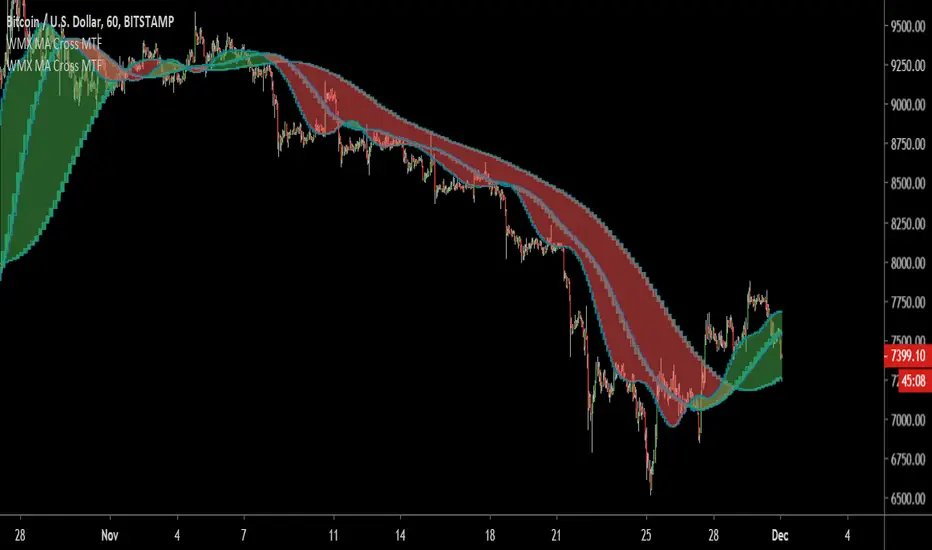
Multi MA MTFMulti MA MTF
The moving averages are generally used as dynamic supports and resistances as well as to determine the trend,
so if the price is above its average it is called an uptrend and otherwise a downtrend.
The crossing of MA if used to confirm a trend and not as a signal
because the moving averages react slowly depending on the type of MA and the periods we are analyzing.
Indicator Functions:
- It allows to display 4 MA at the same time.
- You can use several types of moving averages: SMA, EMA, DEMA, WMA, VWMA, HullMA, TMA, SSMA, SMMA.
- Shows the crossing points of the MA's.
- Multimeframe: so you can visualize the behavior of MA's in different timeframes without changing timeframe.
- Alerts for when crosses occur.
Same chart with 1 week timeframe MA enable

PpSignal Elder Fisher Transform MTF On the chartelder fisher transforms on the chart with alarm and background.
It is the tool to complete the previously published script
Buy when the background is aqua, sell when the background is orange.
Enjoy it

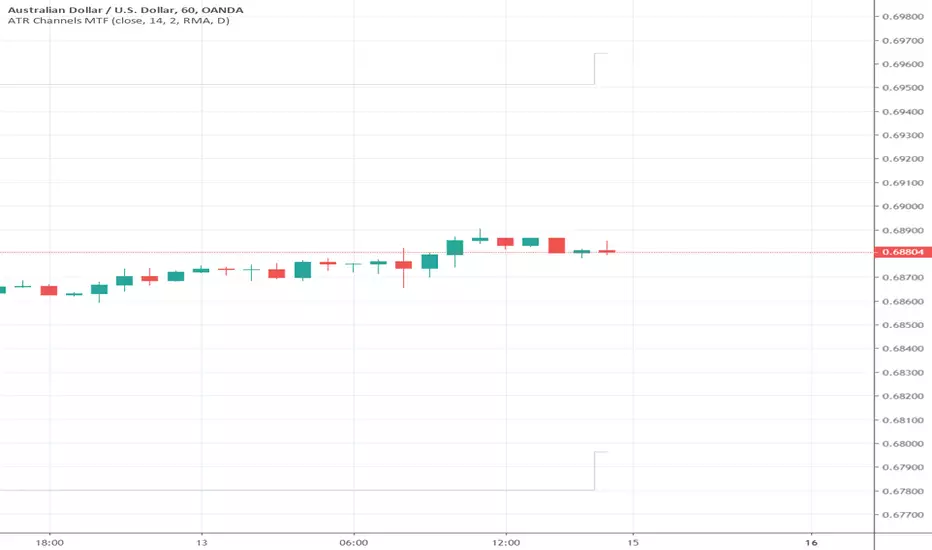
CL MTF Double Bollinger Bands2 Bollinger bands on MTF, good for when you need to use 5-15 min charts with the BBs on 1 or 4 hours.

Smooth HA Candles MTF v1So this is last version of HA
this one has all MA type to choose from and MTF

HA Candles MTFJust try to make non repainting MTF candles
cross over of open and close , seen by small triangles

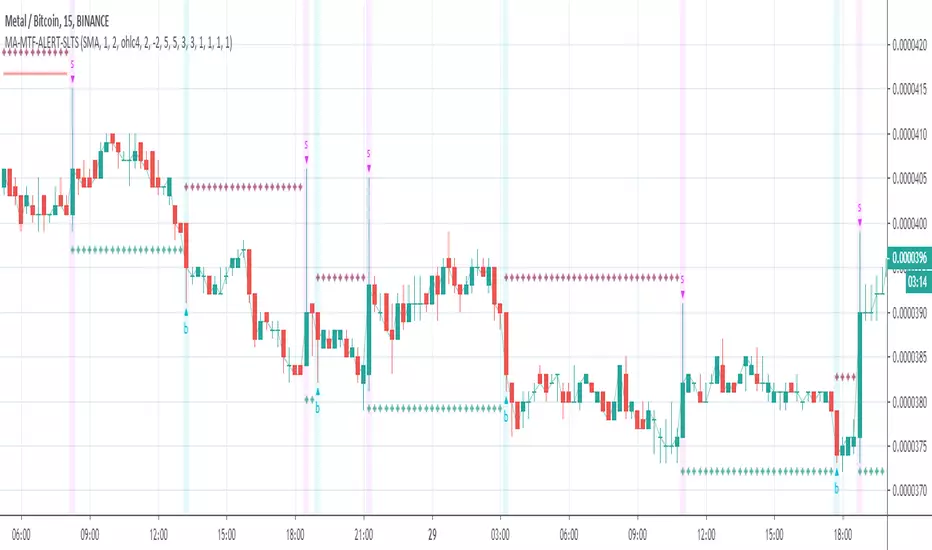
MA-MTF-ALERT-SLTS=== This is an updated version of the MA-MTF Alerts===
+ Take profit
+ Stop Loss
+ Traling Stop
Vortex (VI) MTF Pane [Anan]Hello Friends,,
This is Vortex Indicator with Multi time frame pane
*Note that your current resolution must be <= the multi time frame pane otherwise the MTF pane will not plotting any data (Logic)

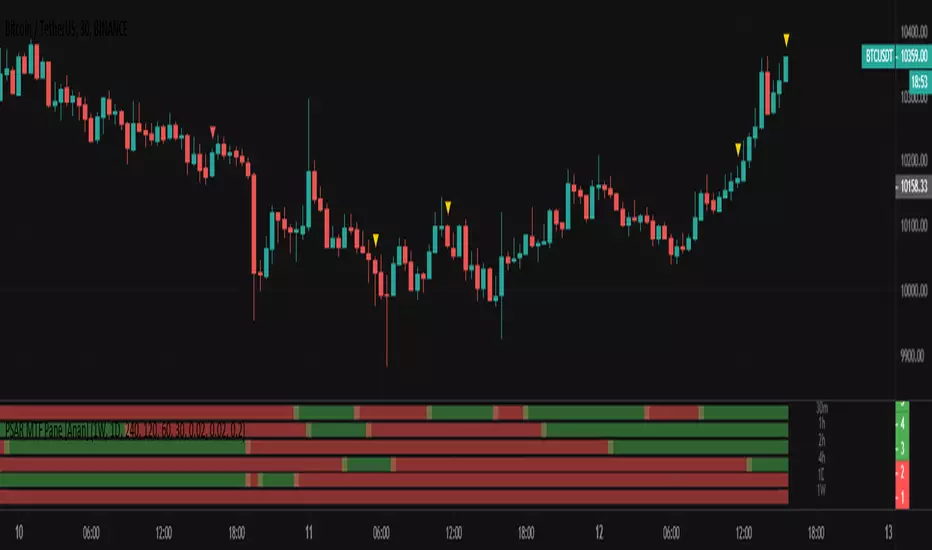
PSAR MTF Pane [Anan]Hello Friends,
My lovely pane now for built-in Parabolic SAR
Green : Bullish Parabolic SAR
Red : Bearish Parabolic SAR
No Green/No Red : The turning point
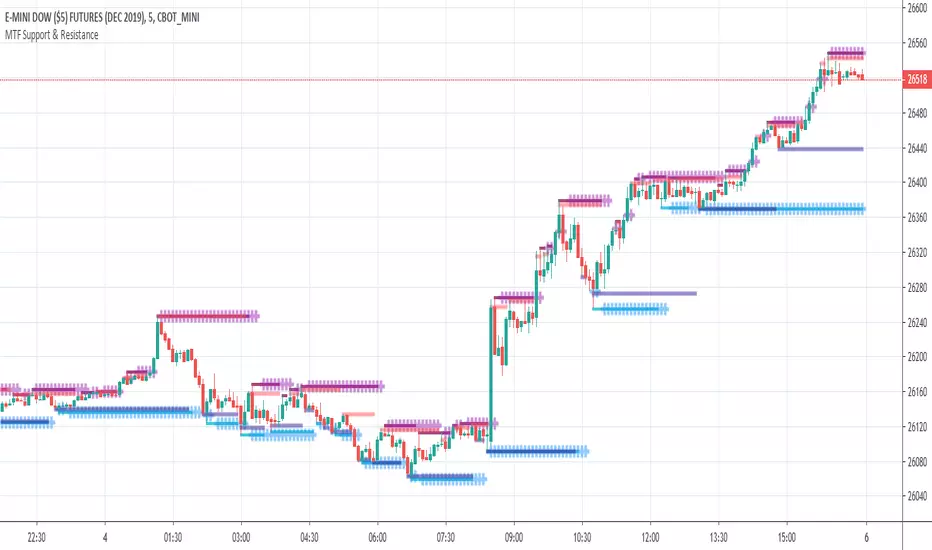
THD MTF Support & ResistanceThe TradersHelpDesk MTF support and resistance identifies the support or resistance on multiple timeframes.
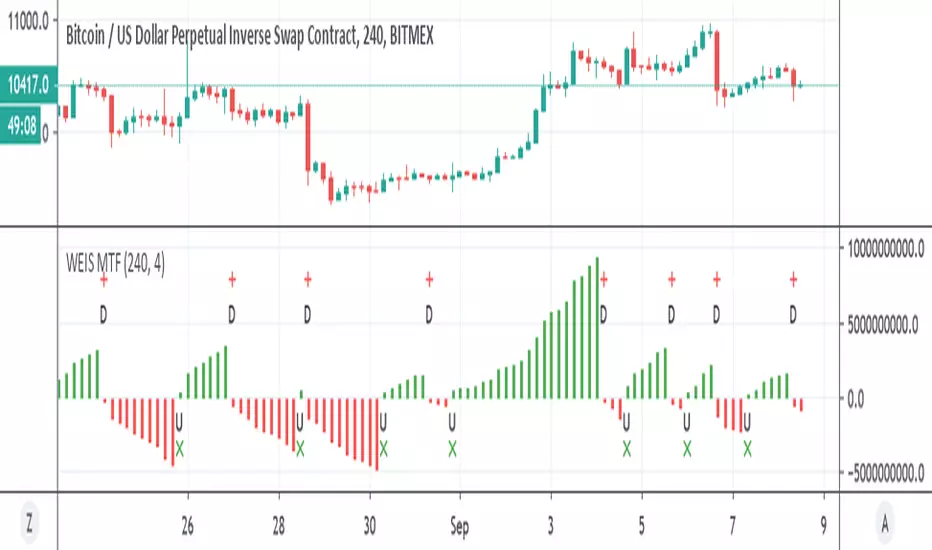
WEIS MTFSo This is Lazy Bear WEIS volume trend indicator , just converted to MTF
up and down trend with alerts
9 Seasons Rainbow Indicator EXPERT [GO8686]A stable release of EXPERT version.
"Expert" is a release with features between Standard and PRO version, with initial features:
9 Ribbons, 4 Alerts Set, Time frame >= 15m, which may change later.
The indicator discovers profitable patterns by associating Price Season of multiple time frames.
Full Name: 9 Seasons Rainbow - Multiple Time Frames Associated Price Wave Pattern Indicator
This is redefined from “9 Seasons Rainbow Indicator PRO”, with clearer definition of 9 Seasons and user manual.
Version: Invite-Only Expert
Language: English
Copyright: 2019
---------- How to use the indicator ----------
Go through the manual and related ideas underneath or follow the tutorials list. Look through the profitable patterns and related cases, wait for or set alert for specific profitable pattern.
---------- Definition: 9 Seasons ----------
A life cycle of Price Wave is divided into 9 Seasons. Each time frame, from 5 minute to 1 month, has 9 seasons, Independent of each other:
Bull (Green)
Bull Pullback (Light Green): a pullback or retracement
Resistance / Overbought (Yellow): a resistance area , may become a Top, or be broken through.
Crazy Bought (Lime): Price is going up in a high volatility , could be a valid breakout, or a Bull Trap.
Neutral (White): a wandering season without direction, evolves into Bull or Bear
Bear (Red)
Bear Bounce (Light Red): Price bounces
Support / Oversold (Blue): a support area , may become a Bottom, or be broken through.
Crazy Sold (Fuchsia): Price is going down in a high volatility , could be a valid breakdown, or a Bear Trap.
---------- Some important evolution between seasons ----------
Resistance / Overbought (Yellow) -> Crazy Bought (Lime):
Bull is breaking through a resistance.
Crazy Bought (Lime) -> Resistance / Overbought (Yellow):
This normally indicates a failed breakout, Price goes back to the resistance.
Crazy Bought (Lime) -> Bull Pullback (Light Green):
This normally indicates Price has risen to a new level
Support / Oversold (Blue) -> Crazy Sold (Fuchsia):
Bear is breaking through a support.
Crazy Sold (Fuchsia) -> Support / Oversold (Blue):
This normally indicates a failed breakdown, Price recovers to the support.
Crazy Sold (Fuchsia) -> Bear Bounce (Light Red):
This normally indicates price has dropped to a new level
---------- Rainbow Ribbons for Multiple Time Frames ----------
Each ribbon of a rainbow represents a time frame.
The uppermost ribbon represents the shortest-term time frame - current time period of the chart, which is the time frame for trading.
The lowermost ribbon represent longest-term time frame, which work as environment, together with the other medium-term and long-term time frames.
The difference between two frames is 1.4142 fold (square root of 2), if level 1 is 15 minute, level 2 is 15 minute * (square root of 2) .
Examples of time frames in a rainbow:
For STANDARD in 15M: 15M - 21M - 30M - 42M - 60M(1H) - 85M
For EXPERT: 15M - 21M - 30M - 42M - 60M(1H) - 85M - 120M(2H) - 170M - 240M(4H)
For PRO in 15M: 15M - 21M - 30M - 42M - 60M(1H) - 85M - 120M(2H) - 170M - 240M(4H) - 339M - 480M(8H) - 679M
---------- Trading Methods ----------
How to open a Long position?
When a profitable Long pattern appears, open small position first based on signal on shortest-term time frame; after retesting and confirming the support, open 2nd position; when it breaks through the resistance, pullbacks and confirms the breakout, open 3rd position.
How to exit a Long position?
Lift the Stop to a confirmed higher low, so that to take advantages of the bull run as possible.
How to open a Short position?
When a profitable Short pattern appears, open small position first based on signal on shortest-term time frame; after retesting and confirming the resistance, open 2nd position; when it breaks through the support, bounces and confirms the breakdown, add 3rd position.
How to exit a Short position?
Lower the Stop to a confirmed lower high, so that to take advantages of the bear run as possible.
---------- Access to Indicators ----------
Please use DEMO version for Trial
PM the author for access to Invite-Only PRO, EXPERT and STANDARD versions:
---------- How to Install Invite Only: STANDARD, EXPERT & PRO Version----------
Ask access to STANDARD, EXPERT or PRO version
Open the chart -> Indicators (On the Top) -> Invite-Only Scripts (2nd button of the left bar)
Like/Favorite the indicator
Click to install on the chart
---------- About Loading Time ----------
It may take up to 2 minutes for your browser to load a new setting, depending on the your computer and network speed.
---------- List of the author's Indicators ----------
www.tradingview.com
---------- Disclaimer ----------
By using or requesting access to the indicator, you acknowledge that you have read and accepted that the indicator and any related content, including but not limited to: product details, user manual, tutorials, ideas, videos, chats, emails, blog, talks are for the purpose of trading strategies studying and paper trading only.
If a customer or user uses the indicator or related content mentioned above for live trading or investment, she/he should take all risks and be responsible for her/his own trading and investment activities.
---------- Updates ----------
The latest updates override the previous description.
To activate a update: Close the browser, Reopen the chart and apply the indicator.
The features may change later.
---------- Tags ----------
MTF, multiple timeframes, multiple time frames, multi timeframes, multi time frames

9 Seasons Rainbow Multi Time Frames Pattern Expert [9SRPEN]"Expert" is a release with features between Standard and PRO version, with initial features:
9 Ribbons, 4 Alerts Set, Time frame >= 15m, which may change later.
The indicator discovers profitable patterns by associating Price Season of multiple time frames.
Full Name: 9 Seasons Rainbow - Multiple Time Frames Associated Price Wave Pattern Indicator
This is redefined from “9 Seasons Rainbow Indicator PRO”, with clearer definition of 9 Seasons and user manual.
Version: Invite-Only Expert
Language: English
Copyright: 2019
---------- How to use the indicator ----------
Go through the manual and related ideas underneath or follow the tutorials list. Look through the profitable patterns and related cases, wait for or set alert for specific profitable pattern.
---------- Definition: 9 Seasons ----------
A life cycle of Price Wave is divided into 9 Seasons. Each time frame, from 5 minute to 1 month, has 9 seasons, Independent of each other:
Bull (Green)
Bull Pullback (Light Green): a pullback or retracement
Resistance / Overbought (Yellow): a resistance area , may become a Top, or be broken through.
Crazy Bought (Lime): Price is going up in a high volatility , could be a valid breakout, or a Bull Trap.
Neutral (White): a wandering season without direction, evolves into Bull or Bear
Bear (Red)
Bear Bounce (Light Red): Price bounces
Support / Oversold (Blue): a support area , may become a Bottom, or be broken through.
Crazy Sold (Fuchsia): Price is going down in a high volatility , could be a valid breakdown, or a Bear Trap.
---------- Some important evolution between seasons ----------
Resistance / Overbought (Yellow) -> Crazy Bought (Lime):
Bull is breaking through a resistance.
Crazy Bought (Lime) -> Resistance / Overbought (Yellow):
This normally indicates a failed breakout, Price goes back to the resistance.
Crazy Bought (Lime) -> Bull Pullback (Light Green):
This normally indicates Price has risen to a new level
Support / Oversold (Blue) -> Crazy Sold (Fuchsia):
Bear is breaking through a support.
Crazy Sold (Fuchsia) -> Support / Oversold (Blue):
This normally indicates a failed breakdown, Price recovers to the support.
Crazy Sold (Fuchsia) -> Bear Bounce (Light Red):
This normally indicates price has dropped to a new level
---------- Rainbow Ribbons for Multiple Time Frames ----------
Each ribbon of a rainbow represents a time frame.
The uppermost ribbon represents the shortest-term time frame - current time period of the chart, which is the time frame for trading.
The lowermost ribbon represent longest-term time frame, which work as environment, together with the other medium-term and long-term time frames.
The difference between two frames is 1.4142 fold (square root of 2), if level 1 is 15 minute, level 2 is 15 minute * (square root of 2) .
Examples of time frames in a rainbow:
For STANDARD in 15M: 15M - 21M - 30M - 42M - 60M(1H) - 85M
For EXPERT: 15M - 21M - 30M - 42M - 60M(1H) - 85M - 120M(2H) - 170M - 240M(4H)
For PRO in 15M: 15M - 21M - 30M - 42M - 60M(1H) - 85M - 120M(2H) - 170M - 240M(4H) - 339M - 480M(8H) - 679M
---------- Trading Methods ----------
How to open a Long position?
When a profitable Long pattern appears, open small position first based on signal on shortest-term time frame; after retesting and confirming the support, open 2nd position; when it breaks through the resistance, pullbacks and confirms the breakout, open 3rd position.
How to exit a Long position?
Lift the Stop to a confirmed higher low, so that to take advantages of the bull run as possible.
How to open a Short position?
When a profitable Short pattern appears, open small position first based on signal on shortest-term time frame; after retesting and confirming the resistance, open 2nd position; when it breaks through the support, bounces and confirms the breakdown, add 3rd position.
How to exit a Short position?
Lower the Stop to a confirmed lower high, so that to take advantages of the bear run as possible.
---------- Access to Indicators ----------
Please use DEMO version for Trial
PM the author for access to Invite-Only PRO, EXPERT and STANDARD versions:
---------- How to Install Invite Only: STANDARD, EXPERT & PRO Version----------
Ask access to STANDARD, EXPERT or PRO version
Open the chart -> Indicators (On the Top) -> Invite-Only Scripts (2nd button of the left bar)
Like/Favorite the indicator
Click to install on the chart
---------- About Loading Time ----------
It may take up to 2 minutes for your browser to load a new setting, depending on the your computer and network speed.
---------- List of the author's Indicators ----------
www.tradingview.com
---------- Disclaimer ----------
By using or requesting access to the indicator, you acknowledge that you have read and accepted that the indicator and any related content, including but not limited to: product details, user manual, tutorials, ideas, videos, chats, emails, blog, talks are for the purpose of trading strategies studying and paper trading only.
If a customer or user uses the indicator or related content mentioned above for live trading or investment, she/he should take all risks and be responsible for her/his own trading and investment activities.
---------- Updates ----------
The latest updates override the previous description.
To activate a update: Close the browser, Reopen the chart and apply the indicator.
---------- Tags ----------
multiple timeframes, MTF, multiple time frames, multi timeframes, multi time frames

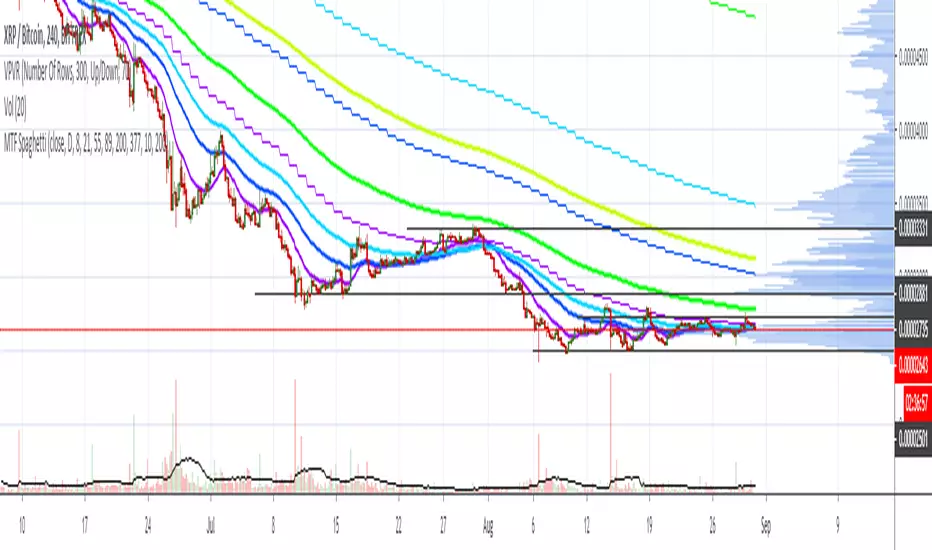
Scott’s MTF SpaghettiIt may be useful to view higher time frame emas on the same chart. For example: view 4hour ema and daily 21ema
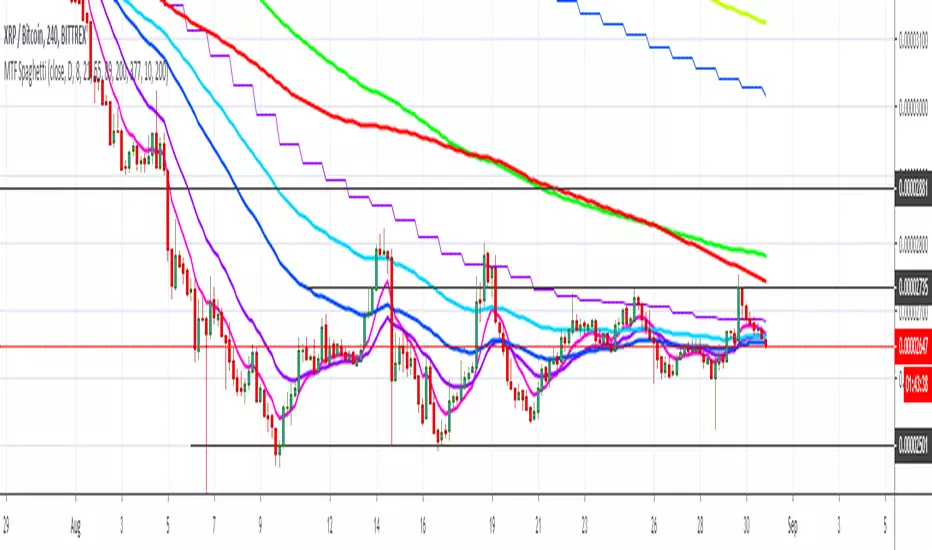
Scott’s MTF SpaghettiIt may be useful to observe emas on higher time frames: to see how 4 hour candles are reacting to daily emas, for example.
Scott's MTF: RSI with ema and stochasticMultiple time frame rsi and stoch may be useful for backtesting.... like... one won't have to switch between time frames when using candle replay mode.

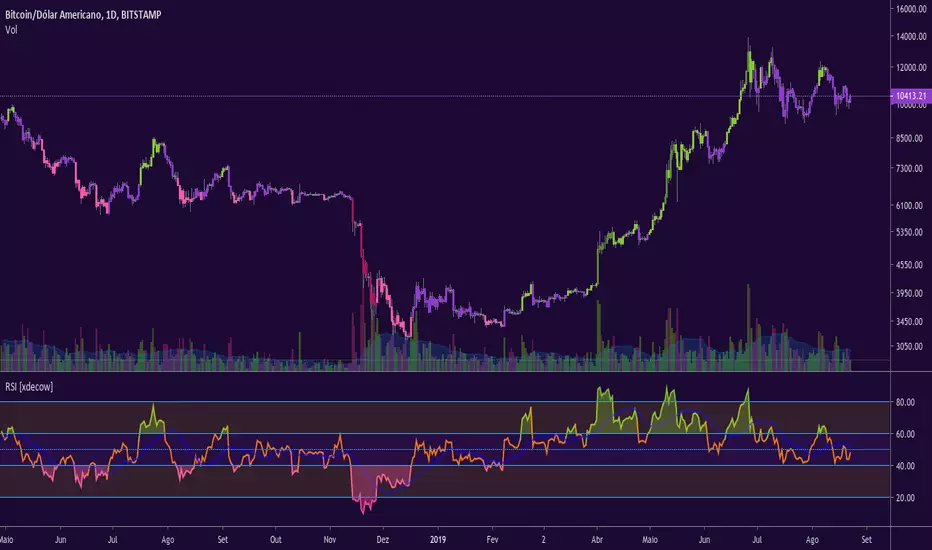
RSI [xdecow]RSI MTF
Options:
-MA
-RSI from another timeframe
-Uptrend/Downtrend zone
-barcolor based on RSI trend
Supertrend MTF Heatmap V2Hello traders and aspiring Pinescripters
You might remember this script Supertrend-Heatmap-Multi-timeframes/ ?
A follower, asked me in a comment to do a version where YOU guys can select the timeframes
Well... what follower asks, follower (sometimes) gets. I'm not Santa Claus but this is Christmas with a few months in advance (#oh #oh #oh)
