Valuation Multi-Asset [MTF]Description This indicator is a specialized Intermarket Analysis tool designed to determine the relative valuation of an asset by comparing its performance against key global benchmarks (Currency, Commodities, Bonds, and Sector ETFs).
Unlike standard oscillators (like RSI) that only look at the asset's own price, this script calculates a Relative Value Index.
Underlying Concepts & Methodology The script operates on the principle of asset correlation and mean reversion ratios. The calculation logic follows these steps:
Ratio Calculation: It computes the price ratio between the Chart Asset and a Benchmark Asset (e.g., Symbol / DXY).
Smoothing: It applies a double smoothing method using Exponential Moving Averages (EMAs) to filter out short-term noise from the ratio.
Historical Normalization: Based on valuation theories (inspired by concepts like Larry Williams' valuation window), the script normalizes the smoothed ratio over a user-defined lookback period (default is 3 years/156 weeks). This ranks the current relative value between 0 and 100.
Key Features
Multi-Benchmark Comparison: Automatically compares the asset against the Dollar Index (DXY), Gold (GC1!), Bonds (ZB1!), and Sector ETFs.
MTF Dashboard: Includes a Multi-Timeframe table to see valuation status across Daily, Weekly, and Monthly views simultaneously.
ETF Reference: A built-in reference table to help you quickly find the correct Sector ETF for stock correlation.
How to Use
Undervalued Zone (< 15): When the line turns Green (or enters the bottom zone), the asset is historically cheap relative to the benchmark. This often indicates a potential accumulation or reversal point.
Overvalued Zone (> 85): When the line turns Red (or enters the top zone), the asset is historically expensive relative to the benchmark, suggesting potential distribution.
Divergences: Watch for divergences between the asset price and the Valuation Index (e.g., Price makes a new high, but the Valuation Index against Gold makes a lower high).
Settings
You can toggle individual benchmark lines (Asset 1 to 4).
Adjust the "Lookback Period" to change the historical normalization window.
Customize the Overbought/Oversold thresholds.
In den Scripts nach "mtf" suchen

LHAMA MTF Structure & Fibs [LTS]Overview
LHAMA MTF Structure & Fibs is a multi-purpose market structure toolkit that combines current-timeframe structure, higher-timeframe structure, Imbalance/FVG-based order blocks, and automatic Fibonacci retracements into a single chart overlay.
Current-Timeframe Structure
The indicator first maps current-timeframe market structure using swing highs and lows based on a user-defined pivot length (“Time-Horizon”):
Labels swing points as HH , HL , LH , and LL .
Draws BOS (Break of Structure) when price breaks beyond a prior swing.
Optionally identifies CHoCH (Change of Character) when a break occurs against the previous direction.
Lets you choose whether BOS/CHoCH confirmation uses closes or wicks .
Provides options to show/hide swing labels, choose line style (solid/dashed/dotted), and configure bullish/bearish colors.
Higher-Timeframe (HTF) Structure
On top of the local structure, the script builds a higher-timeframe structure map and projects it onto your active chart:
Aggregates price into HTF “bars” (e.g., 4h structure on a 5m chart).
Detects HTF pivots with their own pivot length setting.
Draws HTF BOS/CHoCH lines and labels back on the lower timeframe.
Lets you choose wick vs close confirmation for HTF breaks.
Optional “ pending ” HTF levels: lines extended from the latest HTF swing highs/lows that remain “waiting” until price breaks them.
This is designed to make it easier to see how intraday price is moving relative to the dominant higher-timeframe trend.
Order Blocks (Imbalance/FVG-Based)
The indicator detects simple bullish and bearish order blocks based on fair value gaps and prior sweeps:
Identifies bullish/bearish FVGs together with a sweep of a previous low/high.
Creates colored boxes anchored to an “anchor” candle and extends them forward.
Marks boxes as “broken” when price trades inside or through the opposite side.
Broken blocks can have reduced emphasis (more transparent, dashed border) and can optionally be deleted.
Show Nearest Only mode highlights only the closest active bullish and bearish blocks to reduce chart clutter.
Periodic cleanup removes very old boxes to maintain chart responsiveness.
Automatic Fibonacci Levels
The script can draw up to five customizable Fibonacci retracement levels using the HTF structure logic:
Measures swings using HTF pivots and extremes.
Historical mode : measures between two confirmed pivots in one direction.
Live mode : starts from the last confirmed pivot and tracks the evolving extreme; if price reverses through that pivot, measurement can flip to track the new leg.
Each Fib level has its own on/off toggle, ratio value, and color.
Draws a main swing line plus retracement lines projected slightly into the future.
Key Inputs & Customization
Market Structure (Current TF)
Pivot length (“Time-Horizon”).
BOS confirmation: candle close or wicks.
BOS/CHoCH line style and width.
Swing labels on/off and global label size.
Bullish/bearish colors.
Market Structure (HTF)
HTF timeframe selection.
Separate pivot length for HTF swings.
Close vs wick confirmation for HTF breaks.
HTF swing labels and CHoCH labels on/off.
Pending HTF levels: style, color, and visibility.
Order Block Settings
Bullish/bearish box colors and border width.
Maximum number of boxes to display.
Optional deletion of broken blocks.
“Show Nearest Only” filter to highlight the closest active zones.
Max bars to backscan for the anchor candle.
Cleanup frequency for removing very old boxes.
Fibonacci Settings
Show/hide auto Fibs.
Historical vs Live tracking mode.
Five user-defined ratios with individual toggles and colors.

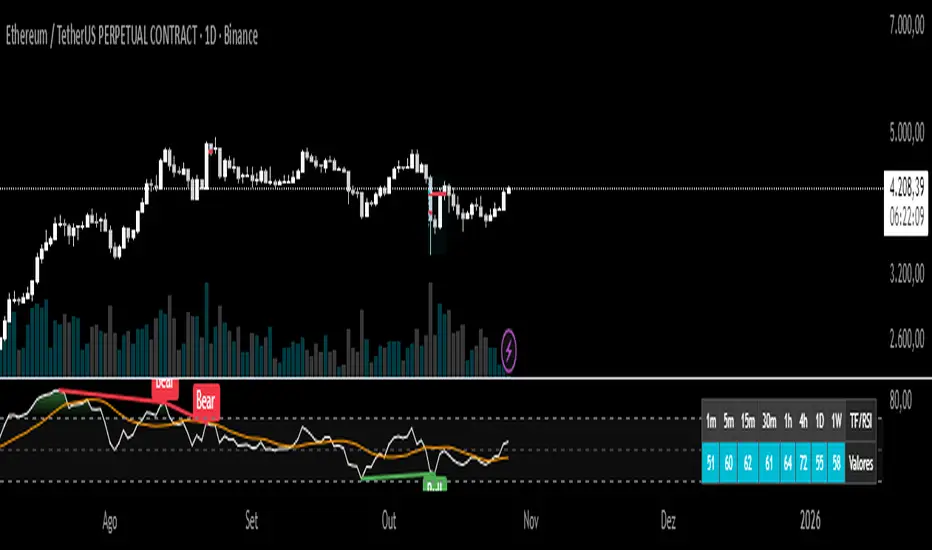
智能趋势-多周期动态信号 Smart Trend Oscillator MTF V1🚀 智能趋势-多周期动态信号 Smart Trend Oscillator MTF V1
—— 让交易像红绿灯一样简单直观 | Making Trading as Simple as Traffic Lights
告别复杂的参数设置,把市场噪音变成明确的信号。 Say goodbye to complex parameters. Turn market noise into clear signals.
🌟 它是做什么的? / What Does It Do?
“智能趋势管家” 就像您的私人交易副驾驶。它内置了一套先进的智能平滑算法,能够自动过滤掉市场中那些骗人的假动作,只把最核心的**“市场真实韵律”通过一条平滑的波浪线展示给您。它不只是一根线,它是一套会思考的系统**。
"Smart Trend Oscillator " is like your personal trading co-pilot. It features a built-in advanced smoothing algorithm that automatically filters out deceptive market "fake-outs," revealing the "true rhythm" of the market through a single, smooth wave. It’s not just a line; it’s a thinking system.
🔥 核心功能 / Core Features
1. 🌊 智能波浪引擎 / Smart Wave Engine
不要被K线的上蹿下跳迷惑。我们的引擎能识别市场内部的真实能量。 Don't be confused by erratic candlesticks. Our engine identifies the true internal energy of the market.
过滤噪音 (Filter Noise):自动忽略短暂的随机波动。
捕捉趋势 (Capture Trends):波浪上升代表买方主导,波浪下降代表卖方主导。
2. 🛡️ 自适应波动通道 / Adaptive Channels
市场有时候像乌龟(波动小),有时候像兔子(波动大)。指标拥有一个“弹性通道”,它会根据市场活跃度自动变宽或变窄,精准判断价格是否“过热”或“超卖”。 The market moves between low and high volatility. The indicator features an "elastic channel" that automatically widens or narrows, accurately judging if the price is "Overheated" or "Oversold."
3. 🌍 全局监控面板 / Global Dashboard
右上角的面板是您的战况指挥室。一眼看懂 6 个不同时间维度的状态。全绿代表多周期共振向上,全红代表多周期共振向下。 The panel in the top-right corner is your Command Center. Understand the status of 6 different time dimensions at a glance. All Green means upward resonance; All Red means downward resonance.
⚙️ 极致的个性化定制 / Ultimate Customization
v16 版本为您提供了前所未有的控制权,让指标完全适应您的交易风格。 Version 16 gives you unprecedented control to tailor the indicator to your trading style.
🕒 1. 时间周期,由你定义 (Customizable Timeframes)
不再局限于系统默认设置。您可以在设置面板中自由输入 6 个您最关心的周期(例如:5分钟、1小时、甚至 3天)。
短线手:设置为 1分/3分/5分/15分...
波段手:设置为 1小时/4小时/日线/周线...
Benefit: You can freely input the 6 timeframes that matter most to you in the settings panel, whether you are a scalper or a swing trader.
🎯 2. 灵敏度调节 (Adjustable Sensitivity)
想要更多交易机会?还是想要更稳健的信号?
高灵敏度:调高 Zone Sensitivity,捕捉每一次微小的回调(适合激进风格)。
低灵敏度:调低数值,过滤掉小波动,只抓大趋势(适合稳健风格)。
Benefit: Dial up the sensitivity to catch every minor pullback (Aggressive), or dial it down to filter noise and catch only big trends (Conservative).
📊 3. 两种平滑模式 (SMA vs. VWMA)
您可以选择通道的计算核心:
Standard (SMA):经典模式,适合大多数市场。
Volume Weighted (VWMA):成交量加权模式。在加密货币或股票市场,它能帮您过滤掉“无量空涨”或“无量空跌”的假信号。
Benefit: Choose Standard (SMA) for general markets, or Volume Weighted (VWMA) to filter out fake moves on low volume (great for Crypto/Stocks).
🚦 信号含义 / Signals Guide
我们把复杂的逻辑浓缩成了最简单的视觉标签: We have condensed complex logic into the simplest visual labels:
🟢 绿色 BUY 标签:市场“便宜”且能量向上。 (Market is "Cheap" & Energy is Up.)
🔴 红色 SELL 标签:市场“过热”且能量向下。 (Market is "Overheated" & Energy is Down.)
🔵 蓝色 HOLD 标签:趋势延续中,建议持仓。 (Trend is continuing, suggest holding position.)
📥 快速上手 / Quick Start
加载指标 (Load):添加到您的图表。
设置周期 (Set Timeframes):在输入选项里填入您习惯查看的 6 个时间周期。
选择模式 (Choose Mode):如果是成交量重要的资产,建议开启 VWMA 模式。
等信号 (Wait):等待带方框的 BUY 或 SELL 标签出现。
把复杂留给算法,把简单留给您。 Leave the complexity to the algorithms, and keep the simplicity for yourself.

Fractal MTF MA System Overview Unlock the fractal nature of the market with a single, clean indicator. This tool allows you to visualize the exact same Moving Average length (default: 50) across 5 different timeframes simultaneously. By comparing "apples to apples" across time dimensions, you get a clear, immediate view of the overall market trend and momentum health.
No more switching charts or manually adding 5 different indicators. This script does it all with a single global setting.
Key Features
🧩 Fractal Logic: Applies one consistent calculation (e.g., 50 Period) to 15m, 30m, 1H, 2H, and 4H timeframes.
🎛️ Global Control: Change the Length or MA Type once, and it instantly updates all 5 lines. No need to adjust each line individually.
🚀 3 Calculation Modes: Switch between DEMA (Double Exponential - Default/Fast), EMA (Standard), or SMA (Smooth) to fit your trading style.
🎨 Visual Clarity: Choose between Step mode (for precise MTF levels) or Line mode (for a smoother, cleaner look).
How to Use This Indicator
1. Trend Following (The Fan) When the market is trending strongly, the lines will stack in perfect order:
Bullish: Price > 15m > 30m > 1H > 2H > 4H.
Bearish: Price < 15m < 30m < 1H < 2H < 4H.
Strategy: Ride the trend as long as the "Fan" is open and orderly.
2. Mean Reversion (The Snap-Back) When the price moves too far from the anchor line (the 4H line) and the gaps between the lines become extreme, the market is "overextended" (like a stretched rubber band).
Strategy: Watch for price to stall and cross back over the fastest line (15m) as an early sign of a correction towards the slower averages.
3. Dynamic Support & Resistance During a trend, price often pulls back to test the 1H or 2H lines before continuing. These lines act as dynamic support zones.
Settings
Global Length: Sets the lookback period for ALL lines (Default: 50).
MA Type: Select DEMA, EMA, or SMA.
Line Style: Toggle between Step (precise) or Line (smooth).
Individual Toggles: You can hide specific timeframes via the settings menu if you want a cleaner chart.
Enjoy the clean charts! Feedback and likes are appreciated. 🚀

Indicator ***TuYa*** V8.2 – HH/HL MTF + Peak Mid ZoneIndicator TuYa V8.0 – HH/HL MTF + Peak Mid Zone
TuYa V8.0 combines multi-timeframe market structure with a Peak Reaction midline to create clean, rule-based reversal and trend entries – designed primarily for 1-minute execution with 1-hour bias.
🧠 Core Concept
This indicator fuses three ideas:
HTF Peak Reaction Midline (1H)
Uses a Peak Reaction style logic on the higher timeframe (HTF, default: 1H).
Identifies a reaction high and reaction low, then calculates their midpoint → the Peak Mid Zone.
This midline acts as a dynamic sentiment divider (above = premium / below = discount).
Multi-Timeframe HH/HL/LH/LL Structure
HTF structure (1H): detects HH, HL, LH, LL using pivot highs/lows.
LTF structure (1m): detects HH, HL, LH, LL on the execution timeframe (chart TF, intended for 1m).
HTF → LTF Confirmation Window
After a 1H structure event (HH, HL, LL, LH), the indicator opens a confirmation window of up to N LTF candles (default: 10 x 1m bars).
Within that window, the required 1m structure event must occur to confirm an entry.
🎯 Signal Logic
All entries are generated on the LTF (e.g. 1m chart), using HTF (e.g. 1H) bias + Peak Mid Zone:
1️⃣ Price ABOVE Peak Mid (Bullish premium zone)
Reversal SELL
HTF: HH (Higher High)
Within N 1m bars: LTF HH
→ SELL signal (fading HTF strength near premium)
Trend/Bullish BUY
HTF: HL (Higher Low)
Within N 1m bars: LTF LL
→ BUY signal (buying dips in an uptrend above midline)
2️⃣ Price BELOW Peak Mid (Bearish discount zone)
Reversal BUY
HTF: LL (Lower Low)
Within N 1m bars: LTF LL
→ BUY signal (catching potential reversal from discount)
Trend/Bearish SELL
HTF: LH (Lower High)
Within N 1m bars: LTF HH
→ SELL signal (shorting strength in a downtrend below midline)
Signals are plotted as small BUY/SELL triangles on the chart and exposed via alert conditions.
🧾 Filters & Options
⏳ HTF → LTF Delay Window
Input: “Max 1m bars after HTF trigger” (default: 10)
After a 1H HH/HL/LL/LH event, the indicator waits up to N LTF candles for the matching 1m structure pattern.
If no match occurs within the window, no signal is generated.
📉 RSI No-Trade Zone (HTF)
Toggle: Use RSI no-trade zone
Inputs:
RSI Length (HTF)
No-trade lower bound (default 45)
No-trade upper bound (default 65)
If HTF RSI is inside the defined band (e.g. 45–65), signals are blocked (no-trade regime), helping to avoid noisy mid-range conditions.
You can turn this filter ON/OFF and adjust the band dynamically.
🧱 5m OB / Direction Filter (Optional)
Toggle: Use 5m OB direction filter
Timeframe: Configurable (default: 5m).
Uses a simple directional proxy on the OB timeframe:
For BUY signals → require a bullish candle on OB timeframe.
For SELL signals → require a bearish candle on OB timeframe.
When enabled, this adds an extra layer of confluence by aligning entries with the short-term directional context.
⚙️ Key Inputs (Summary)
Timeframes
HTF (Peak Reaction & Structure): default 60 (1H)
Peak Reaction
Lookback bars (HTF)
ATR multiplier for zones
Show/Hide Peak Mid line
Structure
Pivot left/right bars (for HH/HL/LH/LL swings)
Toggle structure labels (HTF & LTF)
Confirmation
Max LTF bars after HTF trigger (default 10, fully configurable)
RSI Filter
Use filter (on/off)
RSI length
No-trade range (low/high)
5m OB Filter
Use filter (on/off)
OB timeframe (default 5m)
📡 Alerts & Automation
The script includes alertconditions for both BUY and SELL signals, with JSON-formatted alert messages suitable for routing to external bridges (e.g. bots, MT5/MT4, n8n, etc.).
Each alert includes:
Symbol
Side (BUY / SELL)
Price / Entry
SL & TP placeholders (from hidden plots, ready to be wired to your own logic)
Time
Performance tag
CommentCode (for strategy/type tagging on the receiver side)
You can attach these alerts to a webhook and let your execution engine handle SL/TP and order management.
📌 How to Use
Attach the indicator to a 1-minute chart.
Set HTF timeframe to 60 (or your preferred higher timeframe).
Optionally enable:
RSI regime filter
5m OB direction filter
Watch for:
Price relative to the Peak Mid line
BUY/SELL triangles that respect HTF structure + LTF confirmation + filters.
For automation, create alerts using the built-in conditions and your preferred JSON alert template.
⚠️ Disclaimer
This tool is for educational and informational purposes only.
It is not financial advice and does not guarantee profits. Always test thoroughly in replay / paper trading before using with live funds, and trade at your own risk.

OXE MTF Support/Resistance+Demand/Supply Zone ArsenalOXE MTF Support/Resistance + Demand/Supply Zones Indicator
Your Complete Multi-Timeframe Zone Arsenal
This professional-grade indicator transforms your chart into a zone confluence powerhouse, simultaneously tracking high-probability price reaction areas across 5 timeframes (Daily, H4, H1, M15, M5) – giving you the institutional edge you need to dominate the markets.
🎯 What It Is
A sophisticated dual-system zone detector that identifies both:
Classic Support/Resistance levels using pivot point detection
Smart Money Demand/Supply zones triggered by Break-of-Structure (BOS) confirmations
Unlike basic S/R indicators, this tool employs institutional methodology – capturing order blocks and imbalance zones where smart money is positioned, not just where price bounced.
⚡ Core Capabilities
Multi-Timeframe Mastery
Track up to 5 timeframes simultaneously without switching charts
Identify confluence zones where multiple timeframe levels align
Customize which timeframes to display for clean, focused analysis
Intelligent Zone Management
Automatic zone validation – tracks when zones flip from resistance→support or supply→demand
Invalid zone filtering – hide broken/invalidated zones to focus only on active opportunities
Configurable zone limits – control the number of zones per timeframe (up to 8 each)
Smart Money Detection
BOS-confirmed zones – only marks demand/supply after break-of-structure confirmation
Precise zone timing – captures the exact candle that created the imbalance
Visual differentiation – dashed borders distinguish demand/supply from traditional S/R
Professional Dashboard
Real-time zone counter – shows active zones per timeframe at a glance
Filter status indicators – tracks which validation filters are enabled
Color-coded timeframe labels – instant visual organization
💰 How This Transforms Your Trading
1. Find High-Probability Entries
Enter trades at zones where multiple timeframes converge – when H4 demand aligns with Daily support, you've found institutional backing.
2. Stay on the Right Side of the Market
The zone flipping system shows you when market structure changes – a supply zone that flips to demand tells you the narrative has shifted bullish.
3. Eliminate Guesswork
No more wondering "is this level still valid?" The automatic invalidation tracking removes subjectivity – zones are either active (tradeable) or broken (ignored).
4. Scale Your Timeframe Analysis
Whether you're scalping M5 or swing trading Daily, access all relevant zones without the mental overhead of switching between charts and manually tracking levels.
5. Trade Like Institutions
By combining pivot-based S/R with BOS-confirmed order blocks, you're seeing where retail AND institutional money is positioned – giving you the complete picture.
🔥 Perfect For
Day traders seeking M15/H1 confluence for precise entries
Scalpers needing M5 zones with higher-timeframe confirmation
Swing traders looking for Daily/H4 zone alignment for position trades
ICT/SMC practitioners combining order blocks with traditional analysis
Any trader who values clean, validated, multi-timeframe zones over cluttered charts

ATR/ADR MTF Projection ArrayATR/ADR MTF Projection Array
Overview
A powerful predictive tool that projects ATR (Average True Range) and ADR (Average Daily Range) levels as clean support and resistance arrays on your chart. Designed for traders who want to anticipate the high and low of the day using volatility-based projections with multi-timeframe confluence.
This indicator combines traditional ATR analysis with ICT-style ADR methodology, giving you institutional-grade level projections from a single, customizable tool.
Key Features
🎯 Dual Volatility Metrics
ATR Projections — Classic volatility-based levels with full multi-timeframe support
ADR Projections (ICT Style) — Average Daily Range levels using Inner Circle Trader methodology
Enable/disable each independently based on your trading preference
📊 Multi-Timeframe ATR Analysis
Plot ATR levels from up to 3 timeframes simultaneously (Daily, Weekly, Monthly or custom)
Each timeframe displays with distinct styling for easy identification
Perfect for confluence trading across multiple time horizons
⚡ ICT ADR Methodology
NY Midnight calculation mode (ICT standard) or Classic Daily
Key ICT levels built-in:
1/3 ADR (Judas Swing) — Critical manipulation level where fake moves often terminate
1/2 ADR — Mid-range reference
2/3 ADR — Trending day continuation target
100% ADR — Full daily range completion
150% ADR — Extension target for expansion days
Two projection modes: Static (from anchor) or Dynamic (from session high/low)
🔧 Flexible Anchor Points
Previous Close (default)
Daily Open
Weekly Open
Monthly Open
Session Open
📈 Range Completion Tracking
Real-time display of how much of the expected daily range has been consumed
Visual status indicator helps identify when the day's move may be exhausted
How To Use
For Bias Confirmation:
Establish your directional bias using your preferred method (trigger day, market structure, etc.)
Monitor the 1/3 ADR level during London/NY open for potential Judas Swing (manipulation move)
Target 2/3 to 100% ADR for your HOD/LOD objective
For Target Setting:
Use ATR levels as volatility-based profit targets
ADR 100% level often marks session extremes
When Range Used reaches 100%+, expect consolidation or reversal
For Multi-Timeframe Confluence:
Enable Weekly/Monthly ATR levels alongside Daily
Look for clustering of levels across timeframes for high-probability zones
Settings Guide
Master Controls — Toggle ATR/ADR systems and bull/bear levels independently
ATR Settings — Configure period, multiplier, anchor point, and select which timeframes to display
ATR Level Multipliers — Choose which projection levels to show (0.5x, 0.75x, 1.0x, 1.25x, 1.5x)
ADR Settings (ICT Style) — Select calculation mode (NY Midnight recommended), period (5 days is ICT standard), and projection mode
ADR Level Selection — Toggle individual ICT levels (1/3, 1/2, 2/3, 100%, 150%)
Visual Settings — Customize colors, line styles, labels, and info table position
Alerts Included
ATR 1.0x Bull/Bear Cross
ADR 1/3 Judas Swing Zone (Bull/Bear)
ADR 100% Range Completion (Bull/Bear)

Symbol Magnifier & MTF Clock# Symbol Magnifier & MTF Clock
Shows your symbol, price, and countdown timers for multiple timeframes on one chart.
## What It Does
**Symbol Display:**
- Big, easy-to-read symbol and price
- Shows time left until current candle closes
- Green for bullish, red for bearish
- Put it anywhere on your chart
**Multi-Timeframe Clock:**
- Track up to 6 timeframes at once: D1, H4, H1, M30, M15, M5
- See exactly when each candle will close
- Turns orange/red in the last 5 minutes as a warning
- Choose which timeframes to show
## Why Use It?
Never miss important candle closes across multiple timeframes. Perfect if you trade using multiple timeframe analysis or need to time your entries better.
## Settings
- Move displays to any corner
- Change text size
- Pick your colors
- Show only the timeframes you care about
That's it. Simple timing tool for multi-timeframe traders.

4H Supply & Demand – 50% Mitigation (MTF clean)4H Supply & Demand – 50% Mitigation (MTF clean)
This indicator shows strictly 4h supply & demand zones
automatically deletes any zone that got filled by 51%

STRAT - MTF Dashboard + FTFC + Reversals v2.7# STRAT Indicator - Complete Description
## Overview
A comprehensive multi-timeframe STRAT trading system indicator that combines market structure analysis, flip levels, Full Timeframe Continuity (FTFC), and reversal pattern detection across 12 timeframes.
## Core Features
### 1. **Multi-Timeframe STRAT Dashboard**
- Displays STRAT combos (1, 2u, 2d, 3) across 12 timeframes: 1m, 5m, 15m, 30m, 1H, 4H, 12H, Daily, Weekly, Monthly, Quarterly, Yearly
- Color-coded directional bias (green/red/doji)
- Inside bars (●) and Outside bars (●) highlighted
- Current timeframe marked with ★
### 2. **HTF Flip Levels with Smart Grouping**
- Displays higher timeframe (HTF) flip levels (open prices) as labels on the right side
- Automatically groups multiple timeframes at the same price level (e.g., "★ 1H/4H/D")
- Current timeframe flip level always displayed with ★ marker
- Color-coded: Green (above price) / Red (below price)
### 3. **Full Timeframe Continuity (FTFC)**
- User-selectable 4 timeframes for FTFC analysis (default: D, W, M, Q)
- Green line: FTFC Up (highest open of 4 timeframes)
- Red line: FTFC Down (lowest open of 4 timeframes)
- Identifies when price is above/below all 4 timeframe opens
### 4. **Hammer & Shooting Star Detection**
- **Hammer Pattern**: Long lower wick (≥2x body), small upper wick, signals potential bottom reversal
- **Shooting Star Pattern**: Long upper wick (≥2x body), small lower wick, signals potential top reversal
- Scans last 100 bars (adjustable) and marks ALL historical patterns
- Chart markers: 🔨 (Hammer) below bars, 🔻 (Shooting Star) above bars
- Dashboard column shows reversal patterns for each timeframe
- Adjustable wick-to-body ratio sensitivity (1.5 to 5.0)
### 5. **Debug Tables**
- **FTFC Debug**: Shows close vs. 4 timeframe opens, confirms all-green/all-red conditions
- **Reversal Debug**: Real-time analysis of current bar - body size, wick measurements, ratios, and pattern qualification
## Settings
### Display Settings
- Dashboard position (9 options: top-left to bottom-right)
- Dashboard text size (tiny to huge)
- Label offset and text size
- Toggle individual features on/off
### FTFC Settings
- Select 4 custom timeframes for continuity analysis
- Default: Daily, Weekly, Monthly, Quarterly
### Reversal Settings
- **Wick to Body Ratio**: Sensitivity for pattern detection (default 2.0)
- **Lookback Bars**: How many historical bars to scan (default 100, max 500)
- Show/hide reversal markers on chart
- Show/hide reversal debug table
## Use Cases
1. **Momentum Trading**: Identify STRAT setups (2-2, 2-1-2 reversals, 3-bar plays) across multiple timeframes
2. **Swing Trading**: Use HTF flip levels as support/resistance and FTFC for trend confirmation
3. **Reversal Trading**: Catch hammer/shooting star patterns at key levels for counter-trend entries
4. **Multi-Timeframe Analysis**: Confirm alignment across timeframes before entering trades
## How to Use
### For STRAT Traders
- Look for 2-1-2 reversal setups in the dashboard
- Watch for inside bars (●) at HTF flip levels for breakout trades
- Use outside bars (●) to identify potential volatility expansion
### For Reversal Traders
- 🔨 Hammers after downtrends = potential long entries
- 🔻 Shooting stars after uptrends = potential short entries
- Combine with HTF flip levels for high-probability setups
### For Trend Followers
- FTFC green line above = bullish structure
- FTFC red line below = bearish structure
- Enter when price breaks and holds above/below FTFC levels
## Visual Elements
- **Green Labels**: HTF flip levels above current price (resistance)
- **Red Labels**: HTF flip levels below current price (support)
- **Lime Line**: FTFC Up (highest timeframe open)
- **Red Line**: FTFC Down (lowest timeframe open)
- **🔨 Icon**: Hammer pattern (potential reversal up)
- **🔻 Icon**: Shooting Star pattern (potential reversal down)
- **★ Symbol**: Current timeframe or multiple timeframes grouped
## Performance Notes
This indicator performs 12 multi-timeframe security calls and may take 15-30 seconds to calculate on initial load. This is normal for comprehensive MTF analysis.
## Version
v2.7 - Simplified reversal detection, current TF labeling, optimized performance
---
**Perfect for**: STRAT traders, multi-timeframe analysts, reversal pattern traders, swing traders looking for high-probability setups with confluence across timeframes.

VB Finviz-style MTF Screener📊 VB Multi-Timeframe Stock Screener (Daily + 4H + 1H)
A structured, high-signal stock screener that blends Daily fundamentals, 4H trend confirmation, and 1H entry timing to surface strong trading opportunities with institutional discipline.
🟦 1. Daily Screener — Core Stock Selection
All fundamental and structural filters run strictly on Daily data for maximum stability and signal quality.
Daily filters include:
📈 Average Volume & Relative Volume
💲 Minimum Price Threshold
📊 Beta vs SPY
🏢 Market Cap (Billions)
🔥 ATR Liquidity Filter
🧱 Float Requirements
📘 Price Above Daily SMA50
🚀 Minimum Gap-Up Condition
This layer acts like a Finviz-style engine, identifying stocks worth trading before momentum or timing is considered.
🟩 2. 4H Trend Confirmation — Momentum Check
Once a stock passes the Daily screen, the 4-hour timeframe validates trend strength:
🔼 Price above 4H MA
📈 MA pointing upward
This removes structurally good stocks that are not in a healthy trend.
🟧 3. 1H Entry Alignment — Timing Layer
The Hourly timeframe refines near-term timing:
🔼 Price above 1H MA
📉 Short-term upward movement detected
This step ensures the stock isn’t just good on paper—it’s moving now.
🧪 MTF Debug Table (Your Transparency Engine)
A live diagnostic table shows:
All Daily values
All 4H checks
All 1H checks
Exact PASS/FAIL per condition
Perfect for tuning thresholds or understanding why a ticker qualifies or fails.
🎯 Who This Screener Is For
Swing traders
Momentum/trend traders
Systematic and rules-based traders
Traders who want clean, multi-timeframe alignment
By combining Daily fundamentals, 4H trend structure, and 1H momentum, this screener filters the market down to the stocks that are strong, aligned, and ready.

CRT MTF + HTF Candles - Milana TradesCRT MTF + HTF Candles is an educational tool that helps you visualize higher-timeframe CRT and HTF candles on your intraday chart
The script automatically tracks key HTF levels and shows three types of CRT events:
1. Pending CRT
When a higher-timeframe candle breaks the previous high or low, the indicator marks this as a “pending” CRT.
This helps you see potential liquidity grabs and where price is currently trapped inside the HTF range
2. Completed CRT
A CRT becomes “completed” when price reaches the opposite side of the previously broken level
3. Invalid CRT
If price closes outside the HTF range before completion, the CRT is marked as invalid.
This helps you identify failed breaks and possible reversals.
Multi-Timeframe HTF Candles
The script draws clean higher-timeframe candles directly on your lower timeframe chart.
Each candle includes:
Body and wicks
HTF open & close
Swing high/low markers
Timeframe labels
Optional timers (showing time remaining in the candle)
Optional imbalances (FVG / volume imbalance)
Optional Midpont line (0.5)
HTF candle spacing
You can adjust candle width, spacing, and alignment so HTF candles fit nicely over lower-TF bars.
Gaps & Imbalances
The tool can highlight:
Fair value gaps
Volume imbalance
Swing Sweep line
When price tried update swing but closed inside the candle cange
Equlibrium line (Midpoint 0.5)
Timeframe tags & timers
Shows clear labels for each HTF candle
You can choose which timeframes to show (1H, 2H, 4H, Daily, etc.) and how many candles should be displayed
Trade smart, stay disciplined, and keep improving every day
Enjoy :)

LockedEye MTF CRT Map SentinelOverview
This script provides a structured multi-timeframe display of market conditions.
It summarizes key elements from M1 up to D1 using five components:
- CRT (Continuation/Reversal Trigger)
- MA6 micro-trend filter
- Candle-close direction
- MA250 macro trend filter
- Sentiment percentage computed from the above signals
The panel is designed to present information at a glance, allowing traders to understand how different timeframes align or disagree.
The purpose is not to merge random indicators. Each row uses a specific rule-based calculation that contributes to an integrated multi-timeframe read. The focus is on market structure, micro-trend, and directional pressure as expressed across several intervals.
How the Script Works
The script does not rely on external indicators. All calculations are performed internally through candle relationships, moving averages, MTF requests, and simple classification logic.
1. CRT Logic (Continuation and Reversal)
CRT identifies two types of behavior in each timeframe:
Continuation: The current candle closes outside the previous candle’s high or low.
Reversal after a sweep: Price takes the previous high or low but closes back inside the range.
A close outside the previous range suggests continuation.
A sweep followed by a close back inside suggests a shift in pressure or reversal .
The CRT row labels these conditions as Bull, Bear, or Wait.
2. MA6 Micro-Trend
The script uses a 6-period simple moving average to understand immediate trend pressure.
Close and open both above the MA6 = Bull
Close and open both below the MA6 = Bear
Mixed = Wait
This gives a quick view of short-term momentum without repainting.
3. Candle-Close Direction
This uses a simple comparison:
Close > Open = Bull
Close < Open = Bear
Equal = Neutral
It is a raw directional signal without interpretation.
4. MA250 Macro Filter
The script applies a 250-period MA to understand the broader trend.
Break above the MA250 = BR (BullRun)
Break below the MA250 = BC(BearCrash)
Inside range = Neutral
This acts as a long-term directional filter .
5. Sentiment Computation
The script aggregates CRT, MA6, and Candle-Close across all timeframes.
Each timeframe contributes a value.
The script then calculates the percentage of bull, bear, and neutral signals.
A short text summary explains whether signals are aligned or mixed.
How to Use the Panel
Multi-Timeframe Alignment
The panel is most useful when interpreting how lower and higher timeframes behave together:
When many timeframes show the same direction, it reflects stronger alignment.
When timeframes disagree, market conditions are more mixed or range-bound.
Users can watch for shifts when multiple rows turn from mixed to aligned.
Trend-Following Context
If higher timeframes (H2–D1) show consistent directional readings in CRT, MA6, and MA250, users may treat that as broader structural context.
Lower timeframes (M1–M15) can then be used to observe pullbacks or shifts within that larger trend.
Counter-Trend Context
If higher timeframes show one direction but lower timeframes show the opposite, this may indicate short-term reactions or pullbacks.
The script does not assume these reactions will continue; it only shows the multi-frame condition so users can decide how to interpret it.
Liquidity Sweep Context
CRT will classify moments when price takes a previous high or low and re-enters the range.
This is included so users can detect areas where the market moves beyond a level and immediately rejects it.
Alerts
The script includes alert conditions for:
CRT Bull or Bear flips on the chart’s timeframe
Multi-timeframe consensus reaching a user-defined threshold
Users can create alerts through the TradingView alert menu once the indicator is added to the chart.
Note:
The script includes a non-repaint mode for alert stability. This mode ensures only confirmed candle closes are used in calculations.
Chart Use
The script displays a fixed panel on the chart.
Users may select the panel’s position to avoid covering price action.
Users are advised to publish with a clean chart where only this script is active, unless pairing is required for explanation.
Toggles:
Close Candle(Non Repaint)
Monitor: BTCUSD along w RSI
Monitor 2: Any Coin
Flip M1-D1
Fast CRT
Final Notes
This script does not forecast future price movement and does not claim accuracy, profitability, or performance results.
It is a diagnostic tool that organizes real-time price behavior across multiple timeframes.
Users should apply their own judgment and risk management.

Fib and Slope Trend Detector [EWT] + MTF Dashboard🚀 Overview
The Momentum Structure Trend Detector is a sophisticated trend-following tool that combines Price Velocity (Slope) with Market Structure (Fibonacci) to identify high-probability trend reversals and continuations.
Unlike traditional indicators that rely heavily on lagging moving averages, this script analyzes the speed of price action in real-time. It operates on the core principle of market structure: Impulse moves are fast and steep, while corrections are slow and shallow.
🧠 The Logic: Physics Meets Market Structure
This indicator determines the trend direction by calculating the Slope (Velocity) of price swings.
ZigZag Calculation: It first identifies market swings (Highs and Lows) using a standard pivot detection algorithm.
Slope Calculation: It calculates the velocity of every completed leg using the formula: $Slope = \frac{|Price Change|}{|Time Duration|}$.
Trend Definition:
Uptrend : If the previous Up-move was fast (Impulse) and the subsequent Down-move is slower (Correction), the market is primed for an uptrend.
Downtrend : If the previous Down-move was fast (Impulse) and the subsequent Up-move is slower (Correction), the market is primed for a downtrend.
🔥 Key Features
1. Aggressive Real-Time Detection (No Lag)
Most structure indicators wait for a "Higher High" to confirm a trend, which often leads to late entries. This script uses an Aggressive Live Slope calculation:
It compares the current developing slope of the live price action against the slope of the previous completed leg.
Result: As soon as the current move becomes "steeper" (faster) than the previous correction, the trend flips immediately. This allows you to catch the "meat" of the move before a new pivot is even confirmed.
2. Fibonacci Validity Filter
Momentum alone isn't enough; we need structural integrity.
The script calculates the 78.6% Retracement level of the impulse leg.
If a correction moves deeper than this Fibonacci limit (on a closing basis), the trend structure is considered "broken" or "invalid," and the indicator switches to a Neutral state. This filters out choppy/ranging markets.
3. Multi-Timeframe (MTF) Dashboard
A customizable dashboard on the chart allows for fractal analysis. You can view the trend state (UP/DOWN/NEUTRAL) across 9 different timeframes (1m to 1M) simultaneously.
Green Row : Uptrend
Red Row : Downtrend
Gray : Neutral/Indeterminate
4. Smart Visuals
Background Colo r: Changes dynamically (Teal for Bullish, Red for Bearish, Gray for Neutral) to give you an instant read of the market state.
Slope Labels : Displays the calculated numeric slope on the chart, helping you visualize the momentum difference between impulse and corrective waves.
Invalidation Levels : Automatically plots the invalidation line (Stop Loss level) based on the market structure.
🛠️ Settings & Inputs
Strategy Settings
Pivot Deviation Length : Sensitivity of the ZigZag calculation (Default: 5). Lower numbers = more sensitive to small swings.
Max Retracement % : The Fibonacci limit for a valid correction (Default: 78.6%).
Min Bars for Live Calc : To prevent noise, the script waits for this many bars after a pivot before calculating the "Live Slope" (Default: 3).
Dashboard Settings
Show Dashboard : Toggle the table on/off.
Timeframe Toggles : Enable/Disable specific timeframes (1m, 5m, 15m, 30m, 1H, 4H, 1D, 1W, 1M) to suit your trading style.
🎯 How to Use
Wait for Background Change : When the background turns Teal, it indicates that a corrective pullback has ended and a new impulse with high velocity has begun.
Check Invalidation : Look at the plotted Stop Loss Level. If price closes below this line, the trade idea is invalid.
Confirm with Dashboard : Use the table to ensure the higher timeframes (e.g., 1H, 4H) align with your current chart's direction for higher probability setups.
Disclaimer : This tool is designed for trend analysis and educational purposes. Past performance (momentum) is not indicative of future results. Always manage your risk.

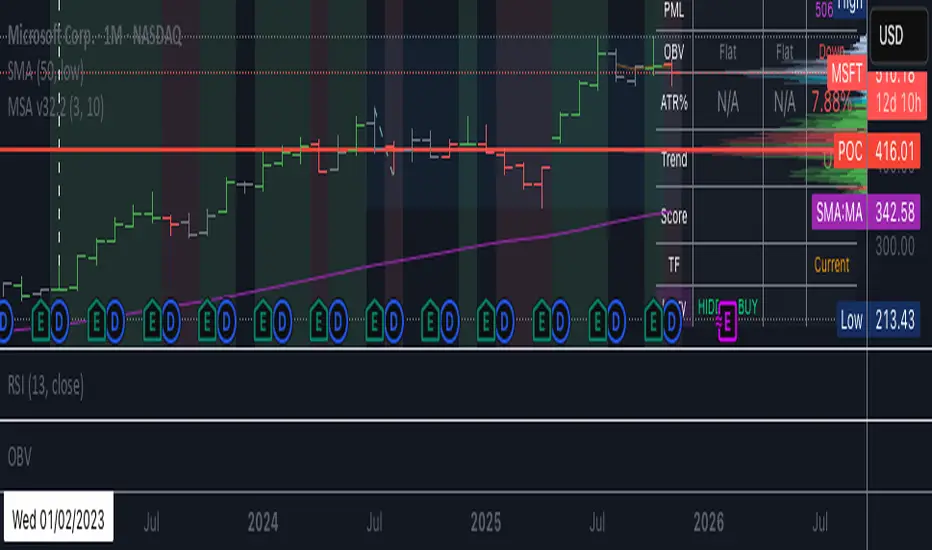
BC_Monthly Strength Armor [xAI] - v32.2 MTF LOCKED + SCORE FIXED🛡️ **Monthly Strength Armor - v32.2**
**Multi-Timeframe Institutional Edge Indicator**
🔥 **Detects smart money moves** using:
- **Monthly Range Position (Score 0–100)**
- **Higher High/Low Trend Structure (Daily/Weekly/Monthly)**
- **OBV Trend Lock (100% consistent)**
- **Larry Williams OHLC Institutional Patterns (Daily)**
📊 **MTF Table (locked values — no flicker)**
| Daily | Weekly | Monthly |
|-------|--------|---------|
| OBV | Trend | Score |
| ATR% | Larry | PMH/PML |
🎯 **Confluence Alerts**
- **3-TF Bullish / Bearish**
- **ULTRA BUY/SELL** (all TFs aligned)
- **Larry Institutional Buying/Selling**
✅ **No repaint | No warnings | Live-ready**
Built for **NVDA, MSFT, URA, QQQ, SPY**
*By @TedPrime x Grok @ xAI*
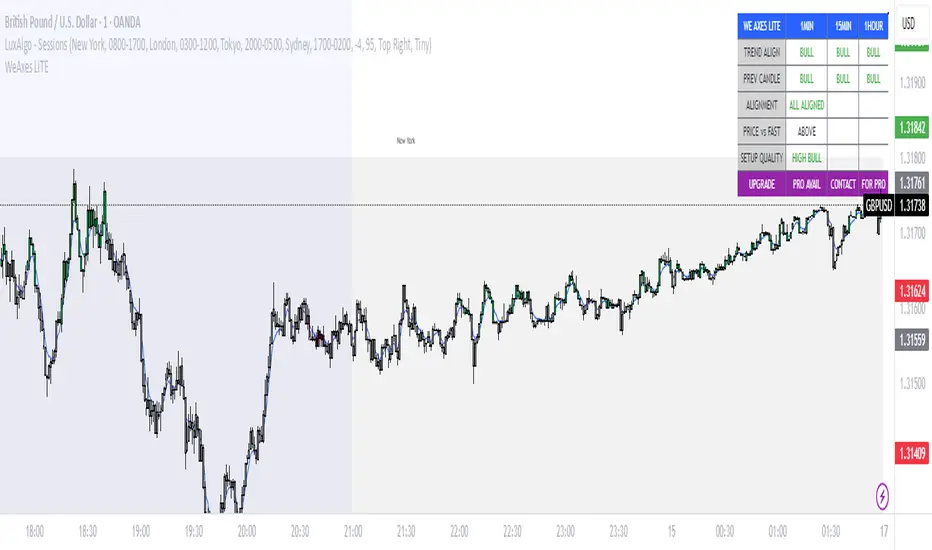
WeAxes MTF Scalper [LITE] WeAxes MTF Scalper
Professional Multi-Timeframe Alignment Tool - LITE Version
What This LITE Version Offers:
3-Timeframe Sync: Monitor 1min, 15min, and 1hr trends simultaneously
Visual Alignment System: Color-coded candles for perfect setups
Quick Setup Recognition: Instant HIGH/MEDIUM/LOW quality ratings
Clean Data Display: Essential alignment information at a glance
Perfect for Scalping:
Green Candles: Perfect bullish alignment across all timeframes
Red Candles: Perfect bearish alignment across all timeframes
Setup Quality: Know immediately if conditions are favorable
Multi-Timeframe Context: Never trade blind again
How to Use:
1. HIGH Quality Setups (Green/Red candles): Highest probability trades
2. MEDIUM Quality: All trends aligned, good for trend following
3. LOW Quality: Mixed signals, better to wait for alignment
PRO Version Includes:
- Advanced volume profiling across all timeframes
- Momentum strength calculations
- Detailed market structure analysis
- Smart Money Concepts integration
- Complete volume analysis
- And much more...
This LITE version gives you a taste of professional multi-timeframe analysis. Contact for PRO version access with full features.
Disclaimer: Use proper risk management. This tool assists analysis but doesn't guarantee profits.
Simple HEMAs Color(MTF)Simple HEMAs, MTF for both fast and slow HEMA and color selection for multimple use.

RSI MTF 15m + 1h (Oriol)//@version=5
indicator("RSI MTF 15m + 1h (Oriol)", overlay = false, timeframe = "", timeframe_gaps = true)
// ─── PARÀMETRES ─────────────────────────────────────────────
rsiLength = input.int(14, "Període RSI")
src = input.source(close, "Font de preu")
tfFast = input.timeframe("15", "Timeframe ràpid (RSI 15m)")
tfSlow = input.timeframe("60", "Timeframe lent (RSI 1h)")
showSignals = input.bool(true, "Mostrar senyals LONG/SHORT")
// ─── RSI MULTITIMEFRAME ────────────────────────────────────
// RSI del timeframe ràpid (per defecte 15m)
src_fast = request.security(syminfo.tickerid, tfFast, src)
rsi_fast = ta.rsi(src_fast, rsiLength)
// RSI del timeframe lent (per defecte 1h)
src_slow = request.security(syminfo.tickerid, tfSlow, src)
rsi_slow = ta.rsi(src_slow, rsiLength)
// ─── DIBUIX RSI ─────────────────────────────────────────────
plot(rsi_fast, title = "RSI ràpid (15m)", color = color.new(color.aqua, 0), linewidth = 2)
plot(rsi_slow, title = "RSI lent (1h)", color = color.new(color.orange, 0), linewidth = 2)
hline(70, "Sobrecomprat", color = color.new(color.red, 70), linestyle = hline.style_dashed)
hline(30, "Sobrevenut", color = color.new(color.lime, 70), linestyle = hline.style_dashed)
hline(50, "Mitja", color = color.new(color.gray, 80))
// ─── CONDICIONS D’EXEMPLE ───────────────────────────────────
// LONG: RSI 1h < 40 i RSI 15m creua cap amunt 30
// SHORT: RSI 1h > 60 i RSI 15m creua cap avall 70
longCond = (rsi_slow < 40) and ta.crossover(rsi_fast, 30)
shortCond = (rsi_slow > 60) and ta.crossunder(rsi_fast, 70)
// ─── SENYALS (SENSE SCOPE LOCAL) ────────────────────────────
plotshape(showSignals and longCond,
title = "Possible LONG",
style = shape.triangleup,
location = location.bottom,
color = color.new(color.lime, 0),
size = size.small,
text = "LONG")
plotshape(showSignals and shortCond,
title = "Possible SHORT",
style = shape.triangledown,
location = location.top,
color = color.new(color.red, 0),
size = size.small,
text = "SHORT")
// ─── ALERTES ────────────────────────────────────────────────
alertcondition(longCond, title = "Senyals LONG RSI 15m+1h",
message = "Condició LONG RSI 15m + 1h complerta")
alertcondition(shortCond, title = "Senyals SHORT RSI 15m+1h",
message = "Condició SHORT RSI 15m + 1h complerta")

Ultimate Ichimoku Trend Board MTF – 6× Cloud Analyzer⚡️ Ultimate Ichimoku Trend Board MTF – 6× Cloud Analyzer
Unleash the full power of Ichimoku with this multi-timeframe trend dashboard ⚙️
Quickly identify whether each timeframe is Bullish 🟢, Bearish 🔴, or Inside the Cloud 🟠, and align your trades with the dominant trend like a pro.
🔥 Features:
✅ 6 customizable timeframes (M5 → H4)
✅ Clean & minimal dashboard — no chart clutter
✅ Instantly visualize market direction across all layers
✅ Perfect for scalpers, intraday, and swing traders
💡 See the Clouds. Read the Trends. Dominate the Market. 🌥💪

FVGC — MTF ScreenerFVGC — MTF Screener (by Capital Complex)
Part of the FVGC Suite.
A compact, real-time dashboard that scans the 30s, 1m, 2m, and 3m timeframes for FVGC-compliant conditions—showing a green/red dot when a bullish/bearish setup is arming, and a green/red square when the setup confirms. Built to sit beside FVGC — Signals and FVGC — Visual Overlay so you can monitor multiple timeframes at once without clutter.
---
## What it does
Multi-TF heads-up display : Tracks 30s, 1m, 2m, 3m for valid FVGC criteria.
Clear state encoding:
* Dot = conditions are aligning (setup arming).
* Square = entry model confirmed (go/no-go).
Rule-true logic: Mirrors your FVGC rule set (tap/engulf/inversion and guardrails) so the screener matches what your Signals indicator would accept on each timeframe.
Noise control: Honors your Trading Windows to keep the screen focused on the session you actually trade.
---
## Why traders use it
Time compression: See four lower timeframes progress from “almost” to “confirmed” at a glance.
Discipline aid: Use the dot phase as a heads-up, and the square as the only moment you consider action—no more chart hopping.
Suite cohesion: Screener tells you when, Visual Overlay shows where, Signals defines how.
---
## Key features & options
Timeframes: 30s, 1m, 2m, 3m (fixed for clarity and speed).
FVGC-aligned filters: Honors your suite’s guardrails (e.g., IFVG/BOS logic, midpoint FTC checks, opposing-FVG 50% behavior, opening-range distance caps by TF).
Trading Windows aware: Optional pre-window arming visibility for early heads-up.
Readable UI: On-chart table/HUD with per-state colors (dot/square), custom text color control, and minimal footprint.
Timezone aware: Defaults to America/New_York to align with RTH and your other FVGC tools.
---
## Notes
Designed for index futures, indices, and liquid FX.
This is a visual scanner; it does not place orders. Pair with FVGC — Signals for your actual entry/management logic.
---
## Credits & suite
Capital Complex — FVGC Suite
© TheHiddenMarkets (code components)
---
## Disclaimer
This tool is for educational purposes only and does not constitute financial advice. Trading involves risk; do your own research and manage risk appropriately.

Directional Volume Cloud MTFThe Directional Volume Cloud MTF transforms raw volume into a visually intuitive cloud histogram that highlights directional bias and exhaustion zones.
🔍 Core Logic
- Volume bias is calculated using candle direction (bullish/bearish) and smoothed via EMA.
- Bias strength is normalized against average volume to produce a ratio from -1 to +1.
- Color and opacity dynamically reflect bias direction and strength — pale clouds indicate weak volume, while vivid clouds signal strong conviction.
Features
- Customizable bullish/bearish colors
- Dynamic opacity based on volume strength
- Declining volume signals for potential reversals
- Multi-timeframe bias overlay (e.g., daily bias on intraday chart)
📈 Use Cases
- Spot volume exhaustion before reversals
- Confirm breakout strength with bias intensity
- Compare short-term vs long-term volume pressure
Whether you're scalping intraday moves or validating swing setups, this cloud-based volume heatmap offers a clean, modular way to visualize market conviction.

Weis Wave Volume MTF 🎯 Indicator Name
Weis Wave Volume (Multi‑Timeframe) — adapted from the original “Weis Wave Volume by LazyBear.”
This version adds multi‑timeframe (MTF) readings, configurable colors, font size, and screen position for clear dashboard‑style display.
🧠 Concept Background — What is Weis Wave Volume (WWV)?
The Weis Wave Volume indicator originates from Wyckoff and David Weis’ techniques.
Its purpose is to link price movement “waves” with the amount of traded volume to reveal how strong or weak each wave is.
Instead of showing bars one by one, WWV accumulates the total volume while price keeps moving in the same direction.
When price direction changes (up → down or down → up), it:
Finishes the previous wave volume total.
Starts a new wave and begins accumulating again.
Those wave volumes help traders see:
Effort vs Result: Big volume with small price move ⇒ absorption; low volume with big move ⇒ weak participation.
Trend confirmation or exhaustion: High volume waves in trend direction strengthen it, while low‑volume waves hint exhaustion.
⚙️ How this Script Works
Trend & Wave Detection
Compares close with the previous bar to determine up or down movement (mov).
Detects trend reversals (when mov direction changes).
Builds “waves,” each representing a continuous run of bars in one direction.
Volume Accumulation
While price keeps the same direction, the script adds each bar’s volume to the running total (vol).
When direction flips, it resets that total and starts a new wave.
Multi‑Timeframe Computation
Calculates these wave volumes on three timeframes at once, chosen dynamically:
Active Chart Timeframe Displays WWV for:
1 min 1 min
5 min 5 min
15 min 15 min
Any other Chart TF
It uses request.security() to pull each timeframe’s latest WWV value and current wave direction.
Visual Output
Instead of plotting histogram bars, it shows a table with three numeric values:
WWV (1): 25.3 M | (15): 312 M | (240): 2.46 B
Each value is color‑coded:
user‑selected Uptrend Color when price wave = up
user‑selected Downtrend Color when wave = down
You can position this small table in any corner/center (top / bottom × left / center / right).
Font size is user‑adjustable (Tiny → Huge).
📈 How Traders Use It
Quickly gauge buying vs selling effort across multiple horizons.
Compare short‑term wave volume to higher‑timeframe waves to spot:
Alignment → all up and big volumes = strong trend
Divergence → small or opposite‑colored higher‑TF wave = potential reversal or pause
Combine with Wyckoff, VSA, or standard trend analysis to judge if a breakout or pullback has real participation.
🧩 Key Features of This Version
Feature Description
Multi‑Timeframe Panel Displays WWV values for 3 selected TFs at once
Dynamic TF Mapping Auto‑adjusts which TFs to use based on chart
Up/Down Color Coding Customizable colors for wave direction
Adjustable Font and Placement Set font size (Tiny→Huge) and screen corner/center
No Histograms Keeps chart clean; acts as a compact WWV dashboard

Relative Strength Index + MTF VEIODORIOAn advanced technical indicator that combines multiple RSI (Relative Strength Index) analysis features into a single, comprehensive tool.
Main Features:
1. Traditional RSI
Calculates the standard Relative Strength Index with a configurable period (default: 14)
Displays overbought and oversold levels
Includes colored background fill for better visualization
2. Multi-Timeframe (MTF) Chart
Displays RSI values simultaneously across 8 different timeframes:
1 minute, 5 minutes, 15 minutes, 30 minutes
1 hour, 4 hours, 1 day, 1 week