Weighted Average Volume Depth [QuantraSystems]Weighted Average Volume Depth
Introduction
The Weighted Average Volume Depth (𝓦𝓐𝓥𝓓) indicator is calibrated to provide extensive insights, calculated using volumetric price action and volume depth, and provides dynamic adjustments based upon historical volatility.
This indicator is a valuable asset for traders and investors, aiming to capture trends, measure dynamic volatility, and provide market reversion analysis in a systematic way.
Legend
Volumetric Top Cap: Plotted at y = 0, this line represents the probabilistic maximum value, or ‘cap’ for the signal line. It is colored using a binary color scheme, and indicates the dominant trend direction - green for an uptrend and purple for a downtrend.
Base Line: Calculated using a volume-weighted volatility measurement, this line is used as the benchmark to calculate momentum in the 𝓦𝓐𝓥𝓓 indicator.
Signal Line: The signal line represents the volume and volatility weighted measurements, and oscillates between the Base Line and Top Cap. Its position between these levels provides the depth of insights available in this script.
When the signal line is remaining in close proximity to the base line, this is indicative of a low volatility market environment. These periods are also reflected as muted bar coloring when the ‘Trend Intensity’ setting is enabled.
Conversely, when the signal line approaches, or even breaks above the Top Cap, this is characteristic of an unsustainable trending action - and probabilistically speaking, a reversion or consolation is likely to occur at these levels.
Highlighting: When this setting is enabled, background coloring is applied when the Signal Line breaks above the Top Cap. This highlights green as an oversold zone, and purple as an overbought zone.
Reversal Signals: When price begins to reverse from a zone of overextension, a signal is plotted when this reversion occurs from a high probability zone.
Circle - Shows a possible bullish reversal.
Cross - Shows a possible bearish reversal.
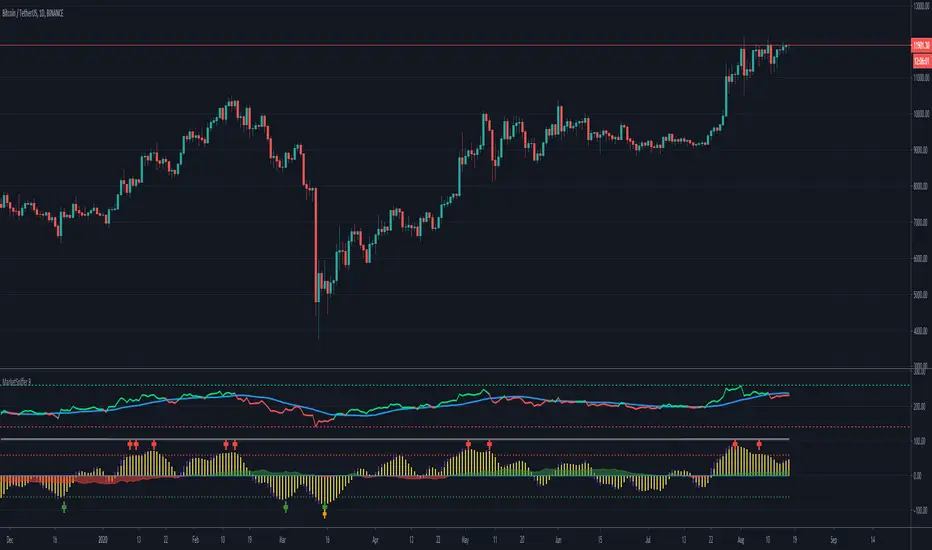
Case Study
In the above image, we showcase three distinct trades in short succession, showcasing the 𝓦𝓐𝓥𝓓’s speed and accuracy under the right conditions.
The first long trade was initiated upon receiving a bullish reversal signal. The trade was then closed after the price experienced a sharp upwards movement - and an overbought signal was indicated by the purple shading.
The second, short trade was entered on the next bar, after a bearish reversal signal was printed by the indicator (a white cross). Similarly, this trade was closed upon the oversold signal.
Once again, a reversal signal was indicated by the 𝓦𝓐𝓥𝓓 indicator. This time a bullish signal (a white circle), and hence a long position was opened. However, this trade was held until a negative trend confirmation (signaled by the Top Cap’s shift in color). This makes apparent the indicator’s flexible nature, and showcases the multiple signaling types available for traders to use.
Recommended Settings
The optimal settings for the 𝓦𝓐𝓥𝓓 indicator will vary upon the chosen asset’s average level volatility, as well as the timeframe it is applied to.
Due to increased volatility levels on lower timeframes, it is recommended to increase the 'Top Cap Multiplier' to take into account the increased frequency of false signals found in these trading environments. The same can be said when used on highly volatile assets - a trader will likely benefit from using a higher 'Top Cap Multiplier.'
On more price-stable assets, as well as any asset on higher timeframes, there is merit to tightening the length of the 'Top Cap Multiplier,' due to the slower nature of price action.
Methodology
The 𝓦𝓐𝓥𝓓 starts with calculating the volume weighted average price and the volume weighted variance - which is the expectation of the squared deviation of a variable from its mean, giving insights into the distribution of trading volume.
Using the volume weighted variance, a standard deviation value is calculated based on user input. This value acts as the ‘Volumetric Top Cap’ - seen in the 𝓦𝓐𝓥𝓓 indicator window as the zero line.
The signal line is calculated as the difference between the current price and the theoretical upper or lower VWAP deviation bands. This line acts as the trigger for identifying prevailing trends and high probability reversal points.
The base line serves as a reference point for historical momentum. It is calculated using an exponential moving average of the lowest signal line values over a defined lookback period. This baseline helps in assessing whether the current momentum is high or low relative to historical norms.
Notes
Bar coloring can be turned off - especially useful when stacking multiple indicators as recommended, or set to 'Trend Intensity,' or 'Binary Trend' (which reflects the top cap coloring).
It is always recommended to never rely on a single indicator - and instead build and test multiple strategies utilizing more than one indicator as confirmation.
In den Scripts nach "momentum" suchen

TTM Waves ABC ATR AO MOM SQZ//All code picked from many indicators, if you recognize your code, pls comment so people can see your awesome work! I only edited and added them all together so people don't use all their indicator slots. Hope this indicator helps as many people as it can. LFG!!!
AO (Awesome Oscillator) Useful to find potential reversals in trend.
MOM (Momentum) An oscillator that measures momentum.
ATR (Average True Range) Measures the upside and downside from the average price movement occuring. 1 ATR is the general measurement. Many traders use 2ATR to set a stop and 4ATR to set take profit from their entry based on current reading from the ATR.
SQZ ( TTM Squeeze) Measures when bollinger bands have left the interior of the Keltner Channel in an attempt to predict volatility thats about to happen to either side. Green = Move is probably about to happen.
TTM Waves ( Waves A, B, and C) Measure the previous candles to determine chop, positive or negative trends. C measures the previous 30 candles or so, B the last 15 or so, and A measures the last 8 or so. You can use all three or just one. You can sneak in a move if the 2 fastest ones have moved into your preferred area. (Positive or Negative) If the wave is not fully positve or negative then that is probably chop.
-Penguincryptic

CoffeeShopCrypto 3pl MAThe CoffeeShopCrypto 3pl MA indicator is a technical analysis tool that uses three different moving averages to identify trends in the price of an asset. The three moving averages have lengths of 12, 26, and 50. If these numbers sound familiar its because they are based off the standard of the MACD indicator, and can be either simple moving averages (SMA) or exponential moving averages (EMA), depending on user preference.
The following is plotted on the chart
The fast EMA/SMA (based on the 12-period length) in yellow.
The mid EMA/SMA (based on the 26-period length) in gray.
The slow EMA/SMA (based on the 50-period length) in either green or red, depending on whether the current close price is above or below the Overall Trend MA.
In addition to the moving averages, the indicator also calculates the MACD (Moving Average Convergence Divergence), and uses it to color the bars based on the momentum of the asset.
The MACD is calculated using two user-defined lengths (fast and slow), as well as a user-defined smoothing length for the signal line. The oscillator and signal line can be either SMA or EMA, and the colors of the MACD bars are based on whether the histogram is growing or falling, and whether it is above or below the zero line.
Overall, this indicator provides traders with a comprehensive tool for understanding the trend of an asset, as well as the momentum behind that trend. The moving averages provide a clear visual representation of the trend, while the MACD bars give insight into the strength of that trend and potential shifts in momentum.
---------------LONG ENTRY----------------
MA1 above MA2 and Overall trend = Green
IF RSI is above its midline you are confirmed for a long entry
-----------Short Entry--------------
MA1 below MA2 and Overall trend = Red
IF RSI is below its midline you are confirmed for a short entry

RSI Potential Divergence - FontiramisuIndicator showing potential momentum divergences on RSI Momentum.
The problem with the classic divergence is that when the signal appears, it is sometimes too late to enter a trade.
The potential divergence corrects this problem by signaling the beginning of a potential divergence.
RSI is a momentum indicator that offers relevant insights with divergences.
Potential divergences are indicated with the letter B and a red color for Bearish Div or Green color for Bullish Div .
Potential divergence is confirmed when the line and the label "Bear"' or "Bull" appear.

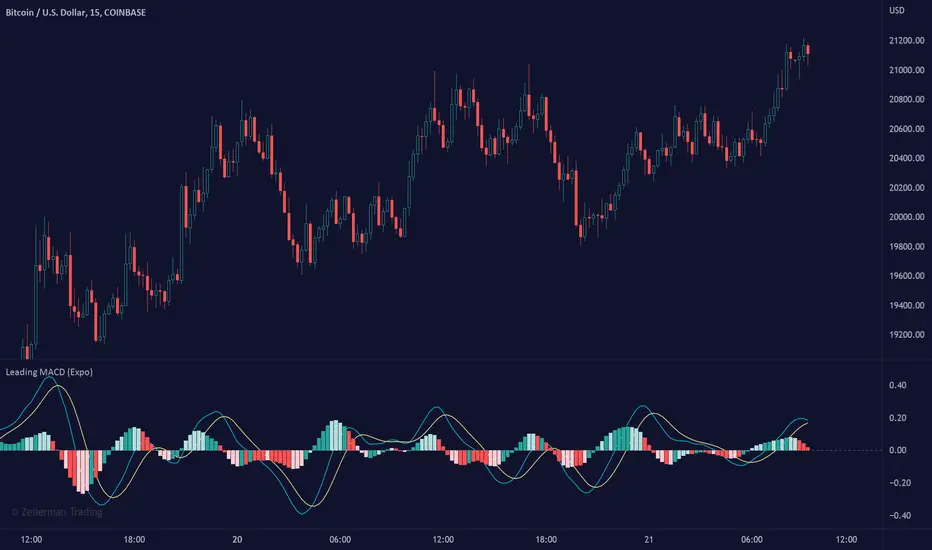
Leading MACD (Expo)Leading MACD (Expo) is designed to anticipate future price action, enabling traders to predict market movements ahead of time. The idea of a leading indicator is that traders can get in before the price move happens and ride the entire trend.
█ Moving average convergence divergence (MACD) is considered one of the most effective momentum and trend-following oscillators. However, the MACD is based on historical price action, making it a lagging indicator. A lagging indicator usually provides signals or insight once the price movement has passed or is in progress. That is why lagging indicators often are used to confirm a price trend or a move. On the other hand, the MACD histogram is more of a leading feature that can act as a sign of future trend changes.
█ The Leading MACD indicator takes all advantages of the traditional MACD and converts it into a fast-moving and leading oscillator that provides real-time insights about potential future price moves. As a result, it gives traders time to analyze a possible upcoming price move before it happens and be prepared for what's coming. However, the leading MACD should be combined with other forms of technical analysis to confirm potential entries and exits.
█ Leading vs. Lagging MACD
The leading MACD looks ahead and helps traders prepare for potential price moves. The traditional (lagging) MACD confirms price action that already has happened. A leading indicator reacts quicker to price changes, while a lagging indicator reacts slower. The different types of MACD have their own advantages and drawbacks, so make sure you understand the leading MACD and see if it fits in with your trading strategy.
█ HOW TO USE
Use the Leading MACD to get insights about potential price changes ahead of time. Get insights about whether a bullish or bearish move is strengthening or weakening. Other common ways are looking for divergences, finding trends, and measuring current momentum.
-----------------
Disclaimer
Copyright by Zeiierman.
The information contained in my Scripts/Indicators/Ideas/Algos/Systems does not constitute financial advice or a solicitation to buy or sell any securities of any type. I will not accept liability for any loss or damage, including without limitation any loss of profit, which may arise directly or indirectly from the use of or reliance on such information.
All investments involve risk, and the past performance of a security, industry, sector, market, financial product, trading strategy, backtest, or individual's trading does not guarantee future results or returns. Investors are fully responsible for any investment decisions they make. Such decisions should be based solely on an evaluation of their financial circumstances, investment objectives, risk tolerance, and liquidity needs.
My Scripts/Indicators/Ideas/Algos/Systems are only for educational purposes!
Williams %R - SmoothedFrom TradingView's description:
Williams %R (%R) is a momentum-based oscillator used in technical analysis, primarily to identify overbought and oversold conditions. The %R is based on a comparison between the current close and the highest high for a user defined look back period. %R Oscillates between 0 and -100 (note the negative values) with readings closer to zero indicating more overbought conditions and readings closer to -100 indicating oversold. Typically %R can generate set ups based on overbought and oversold conditions as well overall changes in momentum.
What's special?
This indicator adds two additional EMA lines to the original Williams %R indicator. Default EMA lengths are 5 and 13. The result is 2 smoother average lines, which are easier to read.
This indicator includes:
- signals for EMA crosses. EMA crosses can help indicate confirmed trend changes. Default colors are green and red
- signals for trend reversals on the faster EMA line. Default colors are blue and orange
Alerts available for bullish/bearish crossovers and reversals.
Enjoy~~!

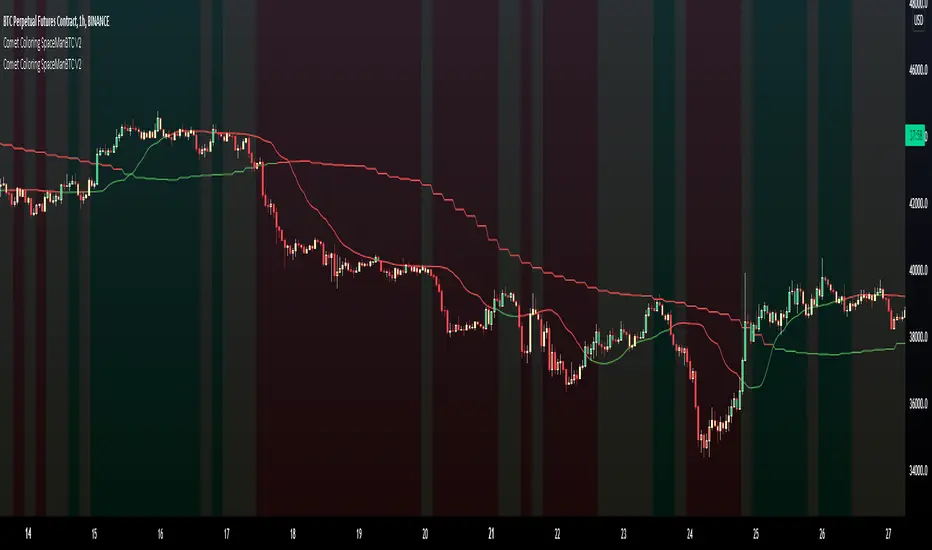
Comet Coloring SpaceManBTC Comet Coloring SpaceManBTC
Comet Coloring is a trend coloring tool used to provide additional confluences to trading. Using the tools together on dip entries the color shift can be used to detect a change in trend/show a weakening trend. Green for an uptrend, Red for downtrend and yellow for waning momentum.
Comet Coloring also comes with a guide line for trading, the line itself is not used in the calculation of trend but has its own trend analysis applied to determine an entry point on failures of claiming the line from either side allowing for directional plays long or short. This can be disabled in settings.
The Trend analysis comes in 2 forms, normal and smoothed , smoothed will filter some noise in sacrifice of early detections.
Aggregator is a proprietary determinent of how much data can be referenced, lowering the aggregate is better and produces more accurate results, the downside is load times.
Auto Aggregator is the primary difference by providing its own calculations very different to how previous auto calculations have worked in spacemanbtc indicators, this aggregator is a work in progress but should produce results that can be replicated accross all coins. Doing so allows for chart by chart switching and is useful for anyone who is in need of quick trend analysis.
The benefits of waning momentum , waning momentum was shown to show potential weakness in trend but also give oppurtunity to enter trend on a pull back, it can signify stagnation or minimal decrease in price allowing for a pull back entry on a strong uptrend.
To Do:
Reversion weakness detection is being considered.
Highlight areas where guide line reclaim has failed
+ Rate of Change (and OBV)The Rate of Change, or RoC, is a momentum indicator that measures the percentage change in price between the current period and the price n periods ago. It oscillates above and below a zeroline, basically showing positive or negative momentum. I applied the OBV's calculation to it, but without the inclusion of volume (also added a lookback period) to see what would happen.
Actually what happened was I was looking at hot-rodding the OBV indicator, but then wondered if I could apply the cumulative calculation to another indicator to see what would happen. Not sure why I chose the Rate of Change, but it seemed a neat idea. And it worked! And so I called it the "Cumulative Rate of Change." I only recently realized that this is actually just the OBV without volume, HOWEVER the OBV does not have a lookback period, and its source is the close of each period. Basically, when you look at the calculation for the OBV you'll notice that it's a cumulative measure of the "change" of the closing price against the previous close times the volume. The Rate of Change is basically that measurement over more than one period, excluding the volume, and is not cumulative. Thus the "Cumulative Rate of Change" is basically an OBV without the volume but with the capability to adjust the lookback period.
Anyway, after days and weeks of playing with the indicator pretty infrequently I did decide that I actually really liked it, especially with the addition of moving averages and bollinger bands. So I decided to play with it a bit more.
I added a drop-down menu to include the standard Rate of Change indicator, and then thought I may as well add the OBV too, in case someone might like to compare that to the C-RoC, or just wants an OBV with myriad moving averages and bollinger bands.
By default I have the indicator set to the "C-RoC" and the lookback is set to 1, but play with longer settings (this is pretty much necessary if using the traditional RoC, which is by default set to 10 in TradingView, and is nigh on useless at 1).
I also recommend playing with the source. 'Close' is nice, but 'ohlc4' provides some very nice signals as well, as it follows the price flow for each period completely, filtering the noisiness of 'close' as source.
Hope you guys like this. With the bollinger bands and your preferred moving average settings this can be a powerful tool for re-entering trades in trend, taking profits, determining momentum swings.
MarketSniffer BMarketSniffer B is a custom made indicator made by 2 friends that combined 2 strategies to make 1 indicator. It can detect good moments to buy and sell based on our strategy.
The indicator gives the same signals als marketsniffer A but has a diffrent way of showing it by using a histogram to make the momentum more clear when a buy / sell signal will be printed.
Marketsniffer B can be used in any market since its for a big part based on momentum. Although we recommend using it in the crypto market since it was tested and mainly made for crypto.
How to use it: MarketSniffer B can be used in many ways, own strategies can be made.
Example strategy: Lower timeframes (anything below the 1d) if the price is trading above the yellow 200 EMA, take the buy signals. If its trading below the 200 ema and you see a sell signal then sell / short
Example strategy: Higher timeframes (anything above the 1d) Any timeframe above the 1d, the 200 ema rule doesn't exist. Any buy signals should be good for taking a spot position. The sell signals therfore are NOT short signals but sell signals. Its just points to take profit from the buy signal.
Example strategy: Divergences and trendlines can be drawn on the waves as strategy. This indicator also had a RSI with EMA that can be used for this.
Its recommended to use the small timeframe signals (anything below 1d) for leverage trading. Any signals above 1day timeframe should be spot trading.
This indicator should be used in combination with MarketSniffer A
Use the link on our profile to get acces to this indicator.
Stochastic CandlesA series of up to 28 stochastics oscillators used to form an average stochastic value, which is then used to colour the candles based on the momentum.
Each candle can be coloured one of ten colours and each one represents a position on the stochastic oscillator.
The indicator helps traders to visualise the momentum and helps trend following.
Inputs:
MA: multiple smoothing methods
Theme: multiple colours
Increment: stochastic length start and increments
End: stochastic length end
Smooth: smooth stochastic
UCS_Top & Bottom CandleThis is an experimental Indicator based on Momentum. Picks the Top & Bottom Candle for most Swing. Please post your opinion or suggestion to improve this indicator.
I have not back tested this completely. This is recently developed Indicator.

Quantum Algo Matrix Quantum Algo Matrix
Multi-Layer Market Intelligence
🔹 Overview
Quantum Algo Matrix is a multi-dimensional market analysis system designed to identify high-probability reversal and continuation zones by combining momentum, volatility, trend structure, multi-timeframe correlation, and AI-based confirmation into a single, coherent framework.
Instead of relying on a single indicator, this script cross-validates signals across independent methodologies, significantly reducing noise and false positives.
It is best suited for active traders, swing traders, and systematic traders who value confirmation, structure, and context over single-trigger signals.
🧠 Core Components & How They Work Together
1️⃣ WaveTrend Engine (Market Structure & Extremes)
At the heart of the system lies a WaveTrend oscillator, which identifies overbought and oversold market conditions with multiple graded levels:
Level 1 (L1) → Primary extreme zones
Level 2 (L2) → Secondary confirmation zones
Level 0 (L0) → Extended exhaustion zones beyond normal extremes
Signals are only considered when WaveTrend momentum confirms a structural extreme, ensuring trades are taken where risk-reward is asymmetric, not mid-range.
Visual differentiation (lines, dots, and crosses) clearly communicates signal strength and hierarchy.
2️⃣ WVF – Volatility Reversal Detection
The WVF module tracks volatility expansion and contraction relative to historical extremes:
Identifies panic selling and emotional spikes
Uses percentile-based thresholds, not fixed values
Optional standard deviation & range filters reduce noise
WVF reversal signals are gated by WaveTrend zones, meaning volatility alone is never enough — price must also be in a statistically significant location.
This avoids the common pitfall of chasing volatility in trending or neutral conditions.
3️⃣ Squeeze Momentum (SQZ) – Pressure & Energy Release
The Squeeze Momentum module measures volatility compression vs expansion, highlighting when the market is:
Building pressure (compression)
Releasing energy (expansion)
Unlike traditional implementations, SQZ is scaled to the WaveTrend range, allowing it to visually integrate with the rest of the system.
The result is a clear momentum context that confirms whether a signal occurs:
Into expansion (higher probability)
Or during decay (lower probability)
4️⃣ Multi-Timeframe Correlation (MTF Filter)
One of the most powerful features of Quantum Algo Matrix is its Multi-Timeframe WaveTrend Correlation Filter.
When enabled, the script checks WaveTrend conditions across multiple higher timeframes (user-selectable):
45m
60m
120m
(optional lower / higher frames)
A signal is only validated when current timeframe conditions align with higher-timeframe momentum, ensuring:
Trades are with the broader market context
Lower-timeframe noise is filtered out
Counter-trend signals are reduced
This is especially effective in volatile or choppy markets.
5️⃣ AI SuperTrend Clustering (Advanced Confirmation Layer)
The AI module introduces a machine-learning-inspired clustering approach:
Multiple SuperTrend variations are generated
Their behavior is clustered using K-means logic
Bullish, bearish, and neutral consensus streams are extracted
Output is normalized and scaled to the WaveTrend environment
Rather than predicting price, the AI acts as a confidence validator:
Confirms strength
Filters weak setups
Prevents entries during indecision
This layer dramatically improves signal quality consistency, especially during transitions and regime changes.
🎯 Final Signal Logic (Why It’s Accurate)
A final LONG or SHORT signal is only produced when:
✔ WaveTrend confirms a valid extreme
✔ Volatility (WVF) shows a qualified reversal or memory condition
✔ Momentum (SQZ) supports expansion or pressure release
✔ Multi-Timeframe structure is aligned (optional)
✔ AI consensus confirms directional confidence (optional)
Because each component is independent, the probability of random alignment is low — this is what makes the system robust and statistically sound.
🧩 Customization & Flexibility
Every module can be enabled or disabled
Visuals are clean and user-controlled
Works on all markets (crypto, forex, indices, stocks)
Optimized for intraday to swing timeframes
No repainting logic in signal generation
⚠️ Important Notes
This script is a decision-support system, not a prediction tool.
It is designed to help traders identify high-quality opportunities, manage risk more effectively, and avoid emotional trading.
Always combine with:
Proper risk management
Market structure awareness
Personal trading rules
⭐ Summary
Quantum Algo Matrix is not a single indicator —
it is a complete market intelligence framework.
By blending structure, volatility, momentum, correlation, and AI-based confirmation, it delivers clearer signals, fewer false positives, and stronger contextual awareness across all timeframes.

OPR Asia-New-York [Elykia]This Pine Script indicator, is designed to help traders identify potentially significant price zones based on morning and afternoon Opening Price Ranges (OPR), while integrating a customizable Relative Strength Index (RSI) to assess market momentum.
Key Features:
1. Morning and Afternoon Opening Price Ranges (OPR):
The indicator defines two distinct OPR periods: one for the morning and one for the afternoon (often used for European and American trading sessions, respectively).
Initial OPR Boxes: For each period, a box is drawn in real-time during the defined opening range. It dynamically adjusts to encompass the high and low prices reached during that period.
OPR Fixation: Once the initial opening period ends, the OPR box becomes fixed at the final high and low levels of that period.
OPR Extensions: After the initial OPR is fixed, an extension box is drawn. This extension box maintains the price levels (high and low) of the initial OPR but extends horizontally in time, providing a continuous reference zone.
Midline: Each box (initial and extension) is accompanied by a dashed midline, representing the midpoint of the OPR range.
Color and Transparency Customization: Users can adjust the colors of the boxes, midlines, and their transparency for both initial OPRs and their extensions, independently for morning and afternoon.
Adjustable Time Zone: A global time zone setting allows precise adaptation of OPR start and end times to the user's local trading session, which is crucial for the accuracy of these zones.
2. Integrated Relative Strength Index (RSI):
A fully customizable RSI is included, calculated on the closing price.
RSI Table (Optional): Displays the current RSI value in a table at the top right of the chart. The table's background color changes based on the RSI's state (green for neutral, red for overbought/oversold).
Dynamic RSI Label (Optional): A floating label follows the price, displaying the current RSI value. This label also changes its background color (green/red) based on overbought/oversold levels.
Full RSI Customization: Users can define the RSI length, overbought and oversold levels, text and background colors, text size for both the table and label, and the horizontal shift of the dynamic label.
Originalities:
Advanced OPR Management with Extension: Unlike many simple OPR indicators, this one offers sophisticated management of range fixation and extension. The extension that maintains the initial price levels is an asset for observing price reactions to these historical zones throughout the day.
Dual OPR (Morning/Afternoon) with Independent Settings: The ability to clearly define and visualize two distinct OPRs for different trading sessions is highly beneficial for multi-market traders or those tracking major session openings.
RSI Integration and Flexibility: The RSI is not just an add-on; it's finely integrated with distinct display options (table or dynamic label), allowing traders to choose how they prefer to visualize this crucial information without cluttering the chart.
Global Time Zone Setting: The inclusion of a global time zone parameter is a practical feature that ensures the indicator's accuracy for traders worldwide, without requiring complex manual calculations.
Setups for Information
Here are some typical configurations that may be useful. These setups are starting points and should be adapted to your trading style and the instruments you use.
OPR Setup "Europe/US Opening" (for EURUSD, European/US Indices):
Time Zone: GMT+2 (for summer in Europe, adjust to GMT+1 for winter)
Morning OPR:
Start Hour: 9:00 (London/Europe opening)
End Hour: 9:15
Extension Hour: 11:30 (before New York opening)
Afternoon OPR:
Start Hour: 15:30 (New York opening)
End Hour: 15:45
Extension Hour: 18:30
RSI Setup "Standard Momentum":
RSI Length: 14
Overbought Level: 70
Oversold Level: 30
Display: Dynamic RSI Label enabled for quick reading near the price.
Disclaimer on Usage:
This indicator is provided for informational and educational purposes only. It does not constitute investment advice or a trading recommendation in any way. Trading in financial markets carries substantial risks of loss, including the total loss of invested capital.
No Guarantee: There is no guarantee that using this indicator will result in profits or prevent losses. Past performance is not indicative of future results.
Personal Analysis: OPR zones and RSI readings are analytical and decision-making tools. They should always be used in conjunction with your own technical and fundamental analysis, risk management, and trading plan.

TradePulse ProTradepulse is a proprietary trading tool that combines a directional signal engine, a trend-adaptive trailing stop system, and a momentum confirmation oscillator into a unified decision framework. Instead of simply stacking separate indicators on a chart, TradePulse integrates these components into a single rules-based system designed to help traders act with structure rather than emotion by identifying conditions where trend and momentum are aligning.
How It Works:
Directional Signals - TradePulse uses a custom price-average model with ATR-based volatility thresholds to detect transitions between bullish and bearish environments. Buy and Sell markers appear only when price strength and volatility conditions confirm a shift. Reducing noise and late entries.
Trend-Adaptive Trailing Stop - A dynamic trailing system combines smoothed moving averages with ATR expansion logic. As price develops, the trailing level adjusts automatically and target projections update based on symmetry extensions. Helping guide structured exits and trade management.
Momentum Confirmation - A proprietary oscillator blends stochastic positioning with center-of-gravity transformation and dual smoothing. It highlights whether momentum aligns with the directional shift, helping traders avoid weaker setups and focus on higher-quality conditions.
Key Features:
- Clear Buy/Sell transitions based on multi-factor confluence
- Adaptive trailing stop + projected targets for structured management
- Momentum filtering to support higher-quality opportunities
- Sensitivity adjustments to suit different markets & styles
TradePulse is original work protected under invite-only access. It is provided for educational and informational purposes only. Trading involves risk, and signals should always be validated with your own analysis and risk management.

Triple Screen System [FlexibleMAs MACD-RSI-ADX]#### Triple Screen System (TSS-FMR)
The TSS-FMR script is a specialized, multi-timeframe confirmation tool built for Swing, Positional Traders, and Longer Term Investors. It is engineered to filter out low-conviction noise by implementing an advanced interpretation of the Elder's Triple Screen strategy, relying on proprietary momentum, volatility, and volume analysis to isolate high-probability setups.
---
#### 🧠 Core Methodology & Logic
The TSS-FMR synthesizes three distinct layers of confirmation to generate signals:
1. Macro Trend & Volatility: Determines the primary trend and overall market condition using configurable EMA+RSI metrics , the script uses Average Directional Index (ADX) as an internal component to filter out non-trending, consolidating market conditions.
2. Momentum Synchronization: A proprietary filter requiring MACD,MAs and RSI to be synchronized * within a specified bar window (`MACD/RSI Sync Window`) ensures that entries align with current short-term momentum shifts.
3. Volume & Price Action: Final entry is triggered only when the higher timeframes align and the entry timeframe (Daily or 4H) confirms the move, optionally requiring * Candle Confirmation * and filtering out low-quality trades using the * Volume Filter *
The key is the separation of input thresholds and lengths for Weekly and Daily lookbacks, allowing for precise tuning unavailable in standard public libraries.
---
#### 🎯 Understanding Signal Strength & Conviction
Signals are categorized using a proprietary Strength scale (from Overbought/Oversold to 6) to help traders gauge the potential size and probability of the momentum move, This scale is dynamically influenced by the ADX volatility readings.
#### 🔍 Integrating External Visual Tools (Addressing Rule: Vendor/Chart)
The TSS-FMR generates signals based solely on its internal logic and inputs .*
We recommend overlaying the TSS-FMR signals with external tools (such as the Lux Algo SmartMoneyConcepts indicator or similar public S/R tools) for visual confirmation only :
* Signals (2, 3, 4) + CHOCH/BOS: * A signal with lower internal strength (2-4) gains stronger conviction if it aligns precisely with a CHOCH or BOS event visually identified by the external tool. This confirms that the market structure is validating the script's momentum reading.
Zone Confirmation: When signals land precisely within visually defined Liquidity or Accumulation/Distribution Zones (provided by external visual tools), it adds significant conviction to the TSS-FMR's output.
The *Overbought/Oversold regions* are decided based on the script's internal strength calculation and prevailing price action.
#### Summary:
--- This script is for Swing, Positional Traders and Longer Term Investors
--- It will only work with Monthly,Weekly, Daily and 4H chart to help you make confirmation based positions.
--- Sell Signals are Overbought Exits and Short sell signals, Plan according to Weekly Signals and Daily signals
--- Use the Momentum Table/matrix at the right top of the chart when TSS indicator is active.
--- Use Volume Filter enable to remove chaos of signals
--- Keep *Lux Algo -SmartMoneyConcepts* indicator active for visual of zones
--- Adjust Volume Filter in Settings to avoid crowding of signals
--- Adjust Input signal length to select number of history bars
--- Watch-out for Weekly 100ema Line and
--- Watch-out for Sell Signals, in discount region they are marked as Buy oversold or moderate, vise versa Sell Overbought signals are added to the charts.
--- To earn money, we need to look out for early signals, fake breakouts, breakdowns and what we want the table/matrix turning all green or red in Momentum trades.
---
#### House Rule Compliance Statement
This script description is provided strictly for technical clarity. It is free from all promotional content, external links, contact information, social media references, and solicitations, as per TradingView's General House Rule #2. The justification for its closed-source nature is based on its proprietary signal synchronization logic and flexible, multi-timeframe implementation.

NICHI Beta (NuwenPham's Ichimoku)# **NuwenPham’s Ichimoku (NICHI)**
**Version BETA.251123a.3.1.2 – Pine Script v6**
**Author:** NuwenPham
**Forked from:** Donovan Wall
**Contributors:** Claude (Anthropic)
**License:** MPL 2.0
---
# **Overview**
**NICHI (Nuwen’s Ichimoku)** is a next-generation Ichimoku system that merges the classical Hosoda Ichimoku with a modular adaptive-smoothing engine, enhanced Kumo logic, directional trend counters, and multi-mode bar coloring.
The indicator includes **two completely separate Ichimoku engines**:
* **Standard Ichimoku** – Traditional Donchian-based Tenkan, Kijun, Senkou A/B, and Chikou
* **Advanced Ichimoku** – Fully customizable Ichimoku using 15+ moving-average filters and enhanced logic
NICHI is designed for modern markets—especially **futures and volatile instruments** (NG, CL, ES, NQ, crypto).
---
# **Key Features**
## **1. Dual Ichimoku Systems**
* **Standard Mode:**
Classic Donchian Ichimoku with Tenkan, Kijun, Senkou A/B, and Chikou.
Clean, faithful implementation.
* **Advanced Mode:**
Every Ichimoku line uses a **selected smoothing filter** (EMA, KAMA, FRAMA, Hull, McGinley, etc.).
Includes directional persistence tracking, enhanced cloud logic, and adaptive bar coloring.
---
## **2. Advanced Filter Engine (15+ Smooth Types)**
Use any of the following for Tenkan, Kijun, Senkou B, or Chikou:
* EMA
* DEMA
* SMA
* SMMA (RMA)
* WMA
* VWMA
* Hull MA
* ALMA
* LSMA (Linear Regression)
* McGinley Dynamic
* KAMA
* FRAMA
* COVWMA
* Moving Median
* 50th Percentile (Nearest Rank)
This transforms Ichimoku into an **adaptive trend system**.
---
## **3. Enhanced Cloud (Kumo) Modeling**
* Independent forward offsets for Span A & Span B
* Cloud colors adapt based on strength, direction, and filter behavior
* Cloud thickness reflects volatility
* Neutral cloud state available when spans disagree
---
## **4. Directional Persistence Counters**
NICHI tracks the **trend streak** of each main component:
* Tenkan rising/falling
* Kijun rising/falling
* Span A rising/falling
* Span B rising/falling
These counters make cloud and line colors more accurate and stable.
---
## **5. Regime-Based Bar Coloring (3 Modes)**
NICHI includes three built-in trading frameworks:
### **Mode 1: Kumo-Based**
Bar color reflects price relative to the cloud:
* Green = Above Kumo
* Red = Below Kumo
* Orange = Inside Kumo
Ideal for **trend-following** and **market regime detection**.
---
### **Mode 2: Tenkan/Kijun-Based**
Bar color reflects momentum structure:
* Green = Price above both Tenkan & Kijun
* Red = Price below both
Designed for **momentum entries and TK breakouts**.
---
### **Mode 3: Chikou-Based**
Bars reflect historical confirmation:
* Green = Chikou > price (offset period)
* Red = Chikou < price
Excellent for **confirmation-first strategies** where accuracy matters most.
---
## **6. Multi-MA Overlay System**
Up to **four optional moving averages**:
* SMA, EMA, SMMA, WMA, HMA, VWMA
* Independent lengths, widths, colors
* Useful for bias, confluence, trend filters
Default: **SMA 200** enabled.
---
## **7. TK Cross Signals**
Both systems show TK crosses:
* Standard TK Cross (classic)
* Advanced TK Cross (filtered version)
Crosses appear with clear markers for entry/exit logic.
---
# **How to Use NICHI**
## **1. Choose Your Engine**
* **Standard:** Clean, classic Ichimoku
* **Advanced:** Adaptive, filter-driven Ichimoku
* **Both:** Comparative analysis
---
## **2. Select Your Filter Type (Advanced Mode)**
Suggested filters:
| Market | Filter Type | Notes |
| ---------------- | ---------------- | -------------------------- |
| Natural Gas (NG) | KAMA or FRAMA | Handles extreme volatility |
| Crude Oil (CL) | McGinley Dynamic | Smooths spikes |
| ES / NQ | SMMA or WMA | Balanced response |
| Crypto | Hull or ALMA | Handles momentum bursts |
| FX | EMA or SMMA | Classic, stable |
---
## **3. Choose a Bar-Color Strategy**
* **Kumo-Based:** Trend following
* **TK-Based:** Momentum and breakouts
* **Chikou-Based:** Highest confirmation/accuracy
Each strategy is valid and intentionally distinct.
---
## **4. Reading the Cloud**
* **Bullish Cloud:** Span A > Span B
* **Bearish Cloud:** Span A < Span B
* **Neutral Cloud:** Disagreement between spans
* **Thick Cloud:** High volatility / stronger structure
* **Thin Cloud:** Weak trend / potential twist
---
## **5. Entry & Exit Concepts**
### **Entries**
* **Momentum Entry:** TK cross with price above the cloud
* **Reversal Entry:** TK cross before a cloud twist
* **Confirmation Entry:** Chikou breaks cleanly above/below past price
### **Exits**
* Price falling through Kijun
* Re-entering the cloud
* Opposite TK cross
* Cloud flipping against position
---
# **Recommended Trading Approaches**
## **Kumo-Based Trend Strategy**
* Long above cloud, short below
* Avoid signals inside cloud
Best for swing/position trading.
---
## **TK-Based Momentum Strategy**
* Enter on Tenkan/Kijun breakout
* Bar color confirms momentum
* Cloud filter optional but helps
Great for high-velocity markets.
---
## **Chikou-Based Confirmation Strategy**
* Enter only when Chikou confirms structure
* Highest accuracy, fewest trades
* Ideal for volatile markets (NG, CL)
---
# **Closing Notes**
NICHI is a **research-grade Ichimoku framework** designed to handle modern volatility where traditional Ichimoku often fails.
It supports scalpers, swing traders, and system developers alike.
Experiment with:
* Filter types
* Cloud offsets
* Bar-color modes
* MA overlays
to match your strategy and market.
Trapper Absolute PriceActionThe Trapper Absolute PriceAction (TAPA) indicator is a custom, momentum-based oscillator designed to help traders visually read shifts in bullish and bearish price strength — with no reliance on volume or external data.
TAPA calculates and smooths both bullish and bearish momentum using multiple methods (RSI, Stochastic, or ADX) and compares their relative strength in real time. The result is a clean dual-line oscillator with color-coded histograms that highlight which side of the market currently has control.
It was built to give traders a sniper-level precision tool for detecting early momentum shifts before they appear clearly on price charts, allowing confirmation or invalidation of setups faster than with lagging indicators.
How It Works
Momentum Strength Calculation
The script measures directional price movement across the chosen mode (RSI, Stochastic, or ADX).
These values are smoothed twice using a selectable moving average type (WMA, EMA, SMA, ALMA, HMA, etc.).
Bullish & Bearish Curves
The green line represents smoothed bullish momentum (SmthBulls).
The orange/red line represents smoothed bearish momentum (SmthBears).
Histogram Strength Visualization
The distance between the two curves forms a color-coded histogram.
Green/Lime bars indicate growing bullish control, while Orange/Red bars show bearish dominance.
A gray neutral zone reflects indecision or range-bound conditions.
Signal Triggers
BUY 🐂 appears when the green line crosses up through the orange — signaling a bullish momentum flip.
SELL 🐻 appears when the green line crosses down through the orange — signaling bearish control.
Alerts can be enabled directly in TradingView through the BUY (🐂) or SELL (🐻) alert conditions for automated notifications or integrations.
How to Use
1. Confirm Early Momentum Shifts
When a crossover appears, check that the histogram color supports the move (green shades for bullish, red/orange for bearish).
Avoid signals when both lines are tangled and the histogram alternates gray, that usually indicates consolidation or low volatility.
2. Validate with Higher-Timeframe Structure
TAPA is most powerful when aligned with trend structure from higher timeframes.
Example: A bullish crossover on the 1-hour timeframe, while the daily TAPA shows the green line already rising, can confirm momentum alignment before entry.
3. Combine with Support/Resistance
Mark your key support and resistance zones (manual or using your “Trapper S&R PRO” indicator).
Look for a TAPA bullish crossover occurring at a major support zone, that’s often the start of a reversal move.
4. Multi-Mode Analysis
Experiment with “Indicator Method” in the inputs:
RSI Mode - smoother and responsive for swing trading.
Stochastic Mode - better for short-term entries and exits.
ADX Mode - captures trending momentum on strong breakouts.
Examples
Bullish Example:
Price forms a higher low on the chart while TAPA’s green line crosses up through orange with a lime/green histogram. That’s a strong early signal that momentum is reversing before price confirms on structure.
Bearish Example:
Price rallies into resistance, then TAPA shows a red histogram and a bearish cross (green dropping under orange). That’s typically a high-probability short signal once structure breaks.
What Makes TAPA Different
No Volume Dependency: Focuses purely on price behavior, not volume spikes or anomalies.
Multi-Mode Engine: Switch between RSI, Stochastic, or ADX-style momentum math instantly.
Customizable Visuals: Editable histogram color layers (weak/strong bull/bear, neutral) and line color control.
Sniper Labeling System: Clean, minimal BUY/SELL cues at each verified crossover.
Alert-Ready: Built-in conditions allow for TradingView alerts, webhooks, or bot automation.
Modernized Core: Rebuilt in Pine v6 with optimized performance and compliance to TradingView standards.
TAPA is designed to filter out the noise and show what truly drives a move — the shift in control between buyers and sellers.
Best Pairing Indicators
To get maximum clarity and confluence:
Trapper Support & Resistance PRO
Helps identify key zones where momentum flips from TAPA have the most impact. A bullish crossover at a defined support level often marks an early trend reversal.
Trapper Volume Trigger
While TAPA doesn’t use volume internally, pairing it with a volume-based trigger confirms that momentum shifts have institutional participation.
Simple Moving Averages (5, 20, or 50)
Overlay short and mid-term SMAs on your chart to confirm directional bias. A bullish TAPA cross that aligns with SMA-5 crossing above SMA-20 increases reliability.
Disclaimer
This indicator is provided for educational and analytical purposes only.
It does not constitute financial advice or a recommendation to buy or sell any security.
Always conduct your own due diligence and practice proper risk management before trading any strategy.
© 2025 RAMS-offthecharts | “Read • Analyze • Mark • Snipe.”
TAPA is part of the RAMS ecosystem of tactical market tools, designed for traders who focus on precision, discipline, and momentum awareness.
RSI(Min-Max)RSI (Min-Max) is an enhanced version of Welles Wilder's Relative Strength Index, designed to offer greater analytical precision and dynamic insight into the behavior of the RSI within each candlestick.In addition to displaying the traditional RSI value, this script calculates the possible extreme values — the minimum and maximum RSI — based on the low and high prices of the current candle. This allows you to estimate how the RSI would react if the price moved to the extremes of the bar, providing a predictive and refined reading of momentum.

Twisted Analytics ATR Model ProThe Trend Spotter Indicator is a sophisticated technical analysis tool engineered to identify high-probability trend formations across all timeframes and asset classes. Built with proprietary algorithms, this indicator combines multiple technical methodologies to deliver clear, actionable signals for traders at all experience levels.
What Makes It Unique
Unlike basic moving average systems, the Trend Spotter employs a multi-layered approach that validates trends through:
Multi-Timeframe Analysis: Confirms signals across higher timeframes to filter false positives
Adaptive Volatility Filtering: Adjusts thresholds based on ATR to optimize for both ranging and trending markets
Momentum Confirmation: Validates trend strength using proprietary oscillators before generating signals
Dynamic Trend Strength Measurement: Real-time assessment of trend intensity and potential exhaustion
Key Features
✅ Universal Compatibility: Works seamlessly on crypto, stocks, forex, commodities, and indices
✅ No Repainting: Signals remain fixed once generated - reliable for backtesting and live trading
✅ Customizable Alerts: Set up notifications for trend reversals, breakouts, and momentum shifts
✅ Visual Clarity: Color-coded signals with adjustable display settings
✅ Smart Noise Filtering: Advanced algorithms eliminate market noise and focus on genuine trends
✅ Support/Resistance Detection: Automatically identifies key levels based on trend structure
How It Works
The indicator analyzes price action through four independent validation layers:
Trend Identification: Detects higher highs/lows (uptrend) or lower highs/lows (downtrend)
Momentum Confirmation: Ensures signals align with prevailing momentum
Volatility Analysis: Adapts to changing market conditions using ATR-based thresholds
Signal Validation: Cross-references multiple factors before generating final signals
This multi-factor approach significantly reduces false signals by requiring confirmation from multiple independent analysis methods.
Best Use Cases
Trend Following: Ride major trends from early entry to exhaustion
Breakout Trading: Catch strong momentum moves out of consolidation
Reversal Trading: Identify trend exhaustion and potential reversals
Multi-Timeframe Strategies: Confirm lower timeframe entries with higher timeframe trends
Who Should Use This
Day traders seeking reliable trend signals on intraday charts
Swing traders looking for multi-day trend opportunities
Position traders wanting to identify major trend changes
Both beginner and professional traders who value data-driven decision making
Configuration Flexibility
The indicator offers extensive customization options:
Trend Period: Adjust sensitivity from 5 to 200 bars
Signal Sensitivity: Choose Low/Medium/High based on trading style
Trend Strength Threshold: Filter weak trends (0-100 scale)
Multi-Timeframe Mode: Enable/disable higher timeframe confirmation
Visual Settings: Customize colors, signal size, and labels
Trading Strategy Examples
Trend Following: Enter on initial signal, add on pullbacks, exit on reversal
Breakout Strategy: Wait for consolidation, enter on trend signal breakout
Reversal Strategy: Identify exhaustion, enter on first opposite signal
Scalping: Use high sensitivity on 1-15 min charts for quick trades
Risk Management Note
While the Trend Spotter provides high-probability signals, no indicator guarantees profits. Always use proper risk management:
Risk only 1-2% of capital per trade
Set stop-losses based on technical levels
Combine with volume analysis and support/resistance
Backtest settings on historical data before live trading
What You Get
Professional-grade trend detection algorithm
Real-time signal generation with no lag
Comprehensive parameter customization
Visual clarity with intuitive color coding
Compatible with all TradingView account types
Ongoing updates and improvements
Technical Specifications
Calculation Method: Proprietary multi-factor analysis
Signal Type: Non-repainting trend direction and strength
Overlay: Yes - displays directly on price chart
Alerts: Fully customizable alert conditions
Timeframes: All timeframes from 1-minute to monthly
Asset Classes: Universal - works on all tradable instruments
Support
Published by Twisted Analytics - Professional trading tools built by traders, for traders.

CCI [Hash Adaptive]Adaptive CCI Pro: Professional Technical Analysis Indicator
The Commodity Channel Index is a momentum oscillator developed by Donald Lambert in 1980. CCI measures the relationship between an asset's price and its statistical average, identifying cyclical turns and overbought/oversold conditions. The indicator oscillates around zero, with values above +100 indicating overbought conditions and values below -100 suggesting oversold conditions.
Standard CCI Formula: (Typical Price - Moving Average) / (0.015 × Mean Deviation)
This indicator transforms the traditional CCI into a sophisticated visual analysis tool through several key enhancements:
Implements dual exponential moving average smoothing to eliminate market noise
Preserves signal integrity while reducing false signals
Adaptive smoothing responds to market volatility conditions
Dynamic Color Visualization System
Continuous gradient transitions from red (bearish momentum) to green (bullish momentum)
Real-time color intensity reflects momentum strength
Eliminates discrete color jumps for fluid visual interpretation
Adaptive Intelligence Features
Dynamic overbought/oversold thresholds adapt to market conditions
Reduces false signals during high volatility periods
Maintains sensitivity during low volatility environments
Momentum Vector Analysis
Incorporates velocity calculations for early trend identification
Crossover detection with momentum confirmation
Advanced signal filtering reduces market noise
Extreme Level Analysis
Values above +100: Strong overbought conditions, potential reversal zones
Values below -100: Strong oversold conditions, potential buying opportunities
Zero-line crossovers: Momentum shift confirmation
Optimization Parameters
CCI Period (Default: 14)
Shorter periods (10-12): Increased sensitivity, more signals
Standard periods (14-20): Balanced responsiveness and reliability
Longer periods (21-30): Reduced noise, stronger signal confirmation
Smoothing Factor (Default: 5)
Lower values (1-3): Maximum responsiveness, suitable for scalping
Medium values (4-6): Balanced approach for swing trading
Higher values (7-10): Institutional-grade smoothness for position trading
Signal Sensitivity (Default: 6)
Conservative (7-10): High-probability signals, reduced frequency
Balanced (5-6): Optimal risk-reward ratio
Aggressive (1-4): Maximum signal generation, requires additional confirmation
Strategic Implementation
Oversold reversals in red zones with momentum confirmation
Zero-line breaks with sustained color transitions
Extreme readings followed by momentum divergence
Risk Management
Use extreme levels (+100/-100) for position sizing decisions
Monitor color intensity for momentum strength assessment
Combine with price action analysis for comprehensive market view
Market Context Application
Trending markets: Focus on momentum direction and extreme readings
Range-bound markets: Utilize overbought/oversold levels for mean reversion
Volatile markets: Increase smoothing parameters and signal sensitivity
Professional Advantages
Instantaneous momentum assessment through color visualization
Reduced cognitive load compared to traditional oscillators
Professional presentation suitable for client reporting
Adaptive Technology
Self-adjusting parameters reduce manual optimization requirements
Consistent performance across varying market conditions
Advanced mathematics eliminate common CCI limitations
The Adaptive CCI Pro represents the evolution of momentum analysis, combining Lambert's foundational CCI concept with modern computational techniques to deliver institutional-grade market intelligence through an intuitive visual interface.

HTF Candles with PVSRA Volume Coloring (PCS Series)This indicator displays higher timeframe (HTF) candles using a PVSRA-inspired color model that blends price and volume strength, allowing traders to visualize higher-timeframe activity directly on lower-timeframe charts without switching screens.
OVERVIEW
This script visualizes higher-timeframe (HTF) candles directly on lower-timeframe charts using a custom PVSRA (Price, Volume & Support/Resistance Analysis) color model.
Unlike standard HTF indicators, it aggregates real-time OHLC and volume data bar-by-bar and dynamically draws synthetic HTF candles that update as the higher-timeframe bar evolves.
This allows traders to interpret momentum, trend continuation, and volume pressure from broader market structures without switching charts.
INTEGRATION LOGIC
This script merges higher-timeframe candle projection with PVSRA volume analysis to provide a single, multi-timeframe momentum view.
The HTF structure reveals directional context, while PVSRA coloring exposes the underlying strength of buying and selling pressure.
By combining both, traders can see when a higher-timeframe candle is building with strong or weak volume, enabling more informed intraday decisions than either tool could offer alone.
HOW IT WORKS
Aggregates price data : Groups lower-timeframe bars to calculate higher-timeframe Open, High, Low, Close, and total Volume.
Applies PVSRA logic : Compares each HTF candle’s volume to the average of the last 10 bars:
• >200% of average = strong activity
• >150% of average = moderate activity
• ≤150% = normal activity
Assigns colors :
• Green/Blue = bullish high-volume
• Red/Fuchsia = bearish high-volume
• White/Gray = neutral or low-volume moves
Draws dynamic outlines : Outlines update live while the current HTF candle is forming.
Supports symbol override : Calculations can use another instrument for correlation analysis.
This multi-timeframe aggregation avoids repainting issues in request.security() and ensures accurate real-time HTF representation.
FEATURES
Dual HTF Display : Visualize two higher timeframes simultaneously (e.g., 4H and 1D).
Dynamic PVSRA Coloring : Volume-weighted candle colors reveal bullish or bearish dominance.
Customizable Layout : Adjust candle width, spacing, offset, and color schemes.
Candle Outlines : Highlight the forming HTF candle to monitor developing structure.
Symbol Override : Display HTF candles from another instrument for cross-analysis.
SETTINGS
HTF 1 & HTF 2 : enable/disable, set timeframes, choose label colors, show/hide outlines.
Number of Candles : choose how many HTF candles to plot (1–10).
Offset Position : distance to the right of the current price where HTF candles begin.
Spacing & Width : adjust separation and scaling of candle groups.
Show Wicks/Borders : toggle wick and border visibility.
PVSRA Colors : enable or disable volume-based coloring.
Symbol Override : use a secondary ticker for HTF data if desired.
USAGE TIPS
Set the indicator’s visual order to “Bring to front.”
Always choose HTFs higher than your active chart timeframe.
Use PVSRA colors to identify strong momentum and potential reversals.
Adjust candle spacing and width for your chart layout.
Outlines are not shown on chart timeframes below 5 minutes.
TRADING STRATEGY
Strategy Overview : Combine HTF structure and PVSRA volume signals to
• Identify zones of high institutional activity and potential reversals.
• Wait for confirmation through consolidation or a pullback to key levels.
• Trade in alignment with dominant higher-timeframe structure rather than chasing volatility.
Setup :
• Chart timeframe: lower (5m, 15m, 1H)
• HTF 1: 4H or 1D
• HTF 2: 1D or 1W
• PVSRA Colors: enabled
• Outlines: enabled
Entry Concept :
High-volume candles (green or red) often indicate market-maker activity , such zones often reflect liquidity absorption by larger players and are not necessarily ideal entry points.
Wait for the next consolidation or pullback toward a support or resistance level before acting.
Bullish scenario :
• After a high-volume or rejection candle near a low, price consolidates and forms a higher low.
• Enter long only when structure confirms strength above support.
Bearish scenario :
• After a high-volume or rejection candle near a top, price consolidates and forms a lower high.
• Enter short once resistance holds and momentum weakens.
Exit Guidelines :
• Exit when next HTF candle shifts in color or momentum fades.
• Exit if price structure breaks opposite to your trade direction.
• Always use stop-loss and take-profit levels.
Additional Tips :
• Never enter directly on strong green/red high-volume candles, these are usually areas of institutional absorption.
• Wait for market structure confirmation and volume normalization.
• Combine with RSI, moving averages, or support/resistance for timing.
• Avoid trading when HTF candles are mixed or low-volume (unclear bias).
• Outlines hidden below 5m charts.
Risk Management :
• Use stop-loss and take-profit on all positions.
• Limit risk to 1–2% per trade.
• Adjust position size for volatility.
FINAL NOTES
This script helps traders synchronize lower-timeframe execution with higher-timeframe momentum and volume dynamics.
Test it on demo before live use, and adjust settings to fit your trading style.
DISCLAIMER
This script is for educational purposes only and does not constitute financial advice.
SUPPORT & UPDATES
Future improvements may include alert conditions and additional visualization modes. Feedback is welcome in the comments section.
CREDITS & LICENSE
Created by @seoco — open source for community learning.
Licensed under Mozilla Public License 2.0 .

Cycle-Synced Channel Breakout📌 Cycle-Synced Channel Breakout – Detect Breakouts Confirmed by Candles and Momentum Cycles
📖 Overview
The Cycle-Synced Channel Breakout indicator is a precision breakout detection tool that combines the power of:
• Adaptive Keltner Channels
• Dominant Cycle Period Analysis (Ehlers-inspired)
• Candlestick Pattern Recognition (Engulfing)
This multi-layered approach helps identify true breakout opportunities by filtering out noise and false signals, making it ideal for swing traders and intraday traders seeking high-probability directional moves.
⚙️ How It Works
1. Keltner Channel Envelope
A dynamic volatility channel based on the EMA and ATR defines the upper and lower bounds of price movement.
2. Engulfing Candle Detection
The script detects strong bullish and bearish engulfing patterns, which often signal trend reversals or momentum continuations.
3. Dominant Cycle Momentum (Ehlers-inspired)
Using a smoothed power oscillator derived from a detrended price series, the indicator assesses whether momentum is accelerating during the breakout — filtering out weak moves.
4. Signal Confirmation Logic
A signal is only shown when:
• An engulfing pattern is detected, and
• Price breaks out of the Keltner Channel, and
• Momentum (cycle power) is rising
5. Visual Feedback
• Breakout signals are plotted with “BUY” or “SELL” labels
• Faded green/red background highlights confirmed breakouts
• Optional display of engulfing candles with triangle markers
⸻
🛠️ Key Features
• ✅ Adaptive Keltner Channels
• ✅ Bullish/Bearish Engulfing Candle Recognition
• ✅ Ehlers-style Cycle Momentum Confirmation
• ✅ Background highlights for confirmed breakouts
• ✅ Optional candle pattern visualization
• ✅ Lightweight and Pine v6 compatible
⸻
🧪 Inputs
• Keltner Length – EMA period for channel basis
• Multiplier – Multiplied with ATR to determine band width
• Cycle Lookback – Used to calculate smoothed cycle power
• Show Engulfing Candles? – Toggles candlestick signals
• Show Breakout Signals? – Toggles breakout labels and backgrounds
⸻
🧠 How to Use
• Look for “BUY” or “SELL” labels when:
• An engulfing candle breaks through the Keltner Channel
• Cycle momentum confirms strength behind the move
• The background color will faintly highlight the breakout direction.
• Use in combination with other trend or volume indicators for added confluence.
🔒 Notes
• This indicator is not repainting.
• It is designed for educational and research purposes only.
• Works across all timeframes and asset classes (stocks, crypto, forex, etc.)

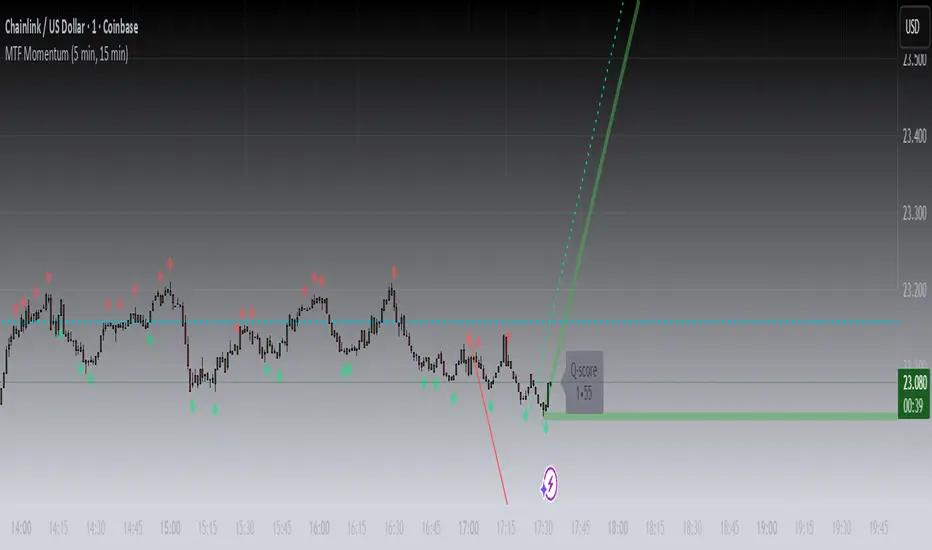
MTF MomentumUniqueness:
MTF Momentum is designed to provide true multiple-timeframe information at once on a single screen with as little clutter as possible. What makes MTF Momentum unique is the way it condenses the perspectives of our other internal models into a single bullish or bearish slope near the current candle, then automatically draws the same bullish or bearish momentum slopes of the next higher timeframes. The structure is engineered to highlight shifts in momentum as they happen on the current candle (angled lines), marking potential reversal points as they build (red and green diamonds), and provides a numerical Q-Score that draws a horizontal marker for elevated Q-Score exhaustion. The design avoids telling you when to buy or sell. Instead, it structures the raw inputs in a way that makes interpretation easier. That makes it useful whether you’re trading actively or simply learning to recognize how momentum flows across layers.
Usefulness:
This indicator is designed to work across multiple timeframes. Instead of juggling the same indicator on 3 different screens, you can see a unified picture that captures both the local momentum and higher timeframes that provide time-dimensional context. When short-term and higher-timeframe angles point in the same direction, MTF Momentum makes that visible in a straightforward way and may help highlight when momentum is consistent across multiple timeframes. When short-term layers push against a stronger higher timeframe, it signals that momentum may be shifting or exhausting. This indicator provides an efficient workflow and helps reduce clutter.
How It Works:
At its core, MTF Momentum is a blend of momentum readings from multiple sources — RSI slopes, EMA stacks, Gaussian smoothing, Fisher-style transforms, and MACD widening analysis built from the same shared core mathematical engines as our other indicators. The uniqueness of this indicator is not tied to any single formula as each component is well-known, but it is in the way they are layered, smoothed, and consolidated that entirely new readings are created.
The process begins with multiple RSI calculations, offset and averaged to reduce jitter. These are smoothed through EMA stacks of varying lengths, then run through Gaussian-style filters that emphasize directional change while filtering noise. The slope differences across these layers form the foundation of the momentum calculation. This momentum reading is then checked against MACD widening conditions. MACD gap expansion is treated as a momentum confirmation — widening gaps with price in agreement add weight, while narrowing gaps or misaligned candles reduce confidence. Additional derivative logic, including Fisher-style transforms, is applied to normalize the outputs and make them more stable across different assets.
Multi-timeframe integration comes from using request.security to pull higher timeframe versions of the same structures that are on the base chart. For example, you can see a one-minute chart overlaid with five-minute and fifteen-minute context. The blending is seamless — higher timeframe momentum is displayed alongside lower timeframe signals that help the user see where current timeframe momentum is in relation to higher timeframes.
How to Use the MTF Momentum Indicator:
Applying the MTF Momentum indicator is straightforward, but interpretation depends on your process.
To use, load the indicator on your preferred base timeframe. Use this general guideline to setup your indicators:
Base timeframe -> 1st HTF -> 2nd HTF
1min -> 5min -> 15min
5min -> 15min -> 1hr
15min -> 1hr -> 4hr
1hr -> 4hr -> 1day
4hr -> 1day -> Weekly
1day -> Weekly -> Monthly
Weekly -> Monthly -> Yearly
When used at base timeframes at 1 hour or lower, higher timeframe lines ARE drawn automatically.
When using a base timeframe above 1 hour (e.g., 4h, Daily), higher-timeframe slopes are NOT drawn automatically. To view them, switch to the higher-timeframe chart itself (for example, Daily or Weekly) and draw an arrow along the slope using TradingView’s drawing tools. Once placed, the arrow will remain visible when you return to your lower base timeframe chart, giving you the higher-timeframe context alongside your current view. This step is optional, purely for visual reference, and does not affect the indicator’s calculations.
These are your higher timeframe momentum angles that can help provide context to the automatically drawn angle on your current timeframe. You can even practice drawing these lines on the lower timeframes such as using a 5min base and 15min and 1hr HTF charts. You can compare your manually drawn angles with the automatic HTF lines by enabling them in the INPUTS tab of the MTF Momentum settings menu.
Q-SCORE:
The Q-Score label presents two values ranging from 0 to 100. These values are a numerical translation of the same momentum conditions our other indicators display visually. Higher values indicate stronger readings of exhaustion within the current trend model, while lower values indicate less. You can think of this as similar to a distribution curve, where some states occur less frequently at the extreme ends of the range and more frequently near the middle. Q-Score values are provided as contextual information only and do not predict reversals or guarantee outcomes.
Blue Dotted & Solid Horizontal line:
The aqua blue horizontal line is a visual representation of the Q-Score values. When one or both numerical values is below 85 the line stays dotted -- it is only when both numerical values exceed 85 that the line changes from dotted to solid.
Green & Red Diamonds:
Diamonds mark areas where the underlying model detects counter-trend behavior. They may flicker on the current candle during intrabar calculations but are locked in at candle close and never get altered or repainted.
Red diamonds highlight points where the model detects counter-trend pressure during a bullish phase. Green diamonds highlight counter-trend pressure during a bearish phase. These markers reflect where momentum conditions have shifted relative to the prevailing trend. They appear where short-term dynamics differ from the broader trend. Traders can interpret these areas in their own context; the diamonds themselves do not predict reversals or guarantee outcomes.
Example ways to use the MTF Momentum indicator:
Look for agreement -- when both your base timeframe and higher timeframe momentums are pointing in the same direction, it reflects stronger alignment. This may help identify areas of trend continuation.
Watch for divergence -- if your short-term momentum pushes opposite to the higher timeframe, it flags a potential transition.
Disclaimer:
This tool does not generate buy or sell signals. It is a framework for visualizing momentum across layers, allowing you to incorporate that information into your own decision-making. How you apply it depends entirely on your goals, timeframe, and risk tolerance. This indicator is provided for educational and informational purposes only. It does not constitute financial advice, trading advice, or investment recommendations. Trading involves risk, and you may lose some or all of your capital. Past performance is not a guarantee of future results. You are solely responsible for any decisions you make — always trade to the best of your own abilities and within your own risk tolerance.
Release Notes:
v1.0 (Initial Release)