In den Scripts nach "momentum" suchen

Momentum x OBV - SignalsSignals for shorts and long with average the Momentum and On Balance Volume.
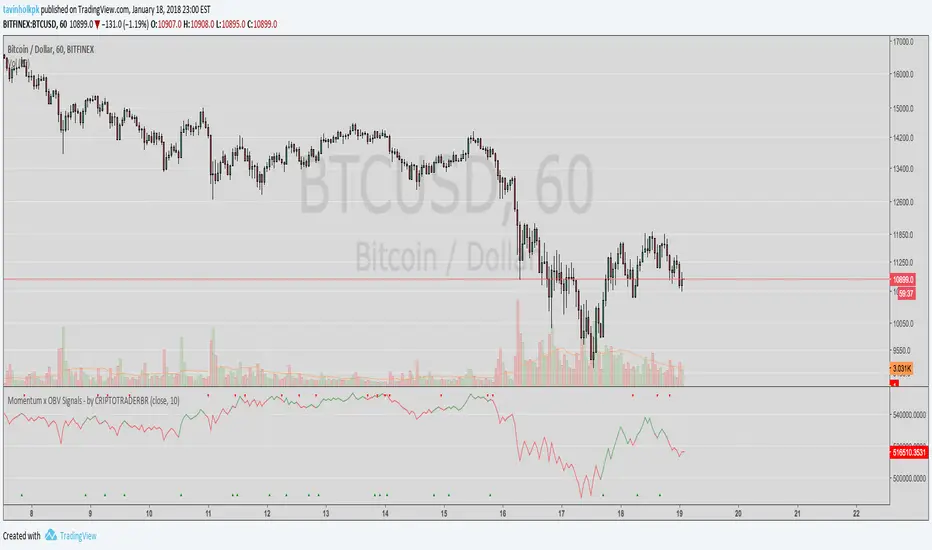
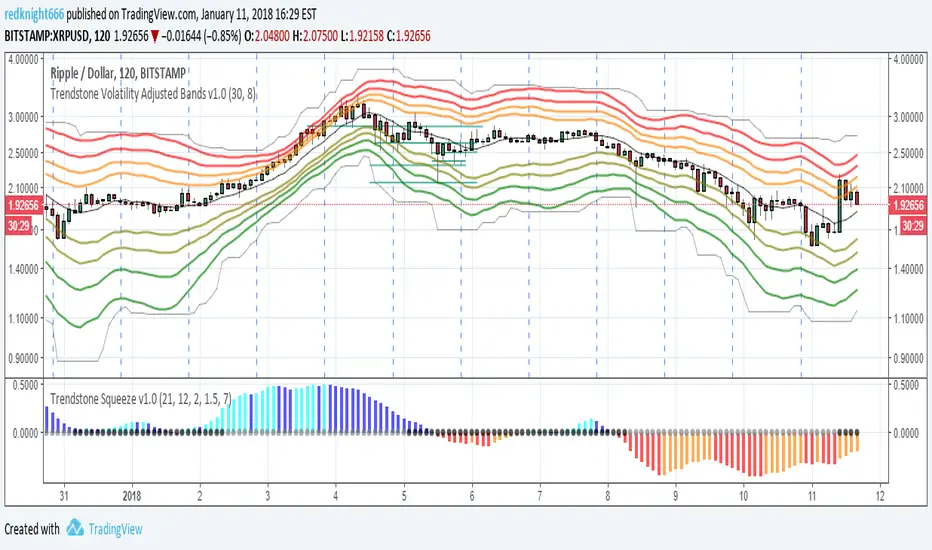
Trendstone Squeeze v1.0The idea of the Squeeze is to figure out when the market is primed for a movement. The script is based on the excellent description of John Carter on the second edition of his book. I made a few changes regarding the sources of data, he uses a plain momentum oscillator, I have added an aggressive and a conservative profile. Aggresive profile is good for entries as the oscillator has a faster response while the conservative is better for entries as it will keep you in the trade. In conjunction with other tools like volatility adjusted bands you can create rules that would use both triggers.
Momentum Strategy Alerts V1Alerts for trading views Momentum Strategy, still in development as alerts can be premature.

[RS]Volume Price ChangeEXPERIMENTAL
calculates, price change * volume over a specific time window.
It reflects trend, momentum and volume participation.
It can be used to find divergences.


Kovach OBVThe Kovach OBV measures sustained buying pressure. It features advanced signal processing algorithms to minimize lag and filter the effects of volatility. Consider using it with the Kovach Chande indicator and Kovach Momentum indicator.

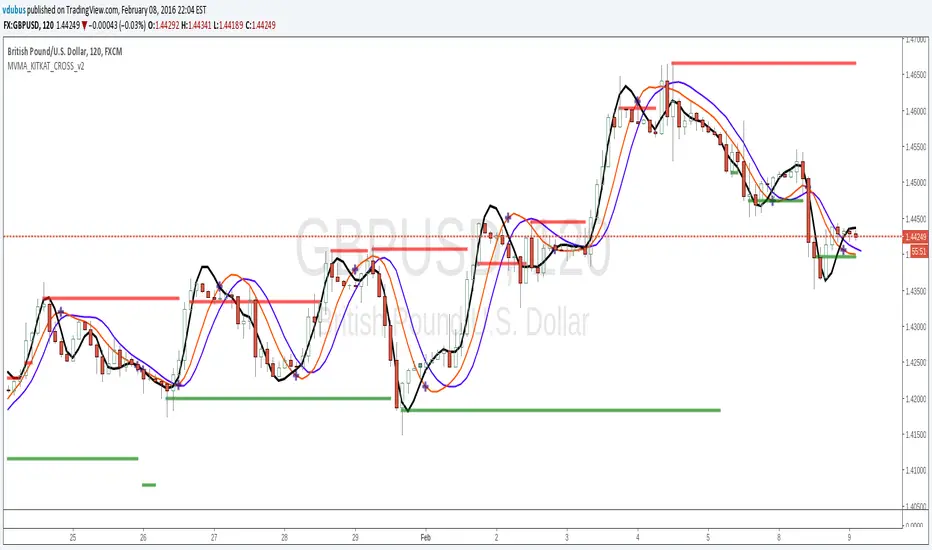
Momentum VMA KITKAT CROSS v2*Update Momentum VMA KITKAT CROSS v2
triple MVMA (Hull MA) with integrated Kitkat
[RS]Chande's Momentum Oscilator - MMA - Candles V0update to old script: using candles to plot multiple moving averages increases readability.


Momentogram - WaveThis is another way you can plot the Momentum Histograms. This can be manipulated to Wave A, B, C from trade the market.
TTM WAVES - if you can manipulate the settings, this will work. 100%
List of All my Indicators - www.tradingview.com

Momentum HistogramThis creates a replica of relative distance from the moving averages, a good way to measure the strength, divergences etc.... short, mid and long term waves.
List of All my Indicators - www.tradingview.com

Screener (MC) [AlgoAlpha]🟠 OVERVIEW
This script is a multi-symbol scanner that works as a companion to the "Momentum Concepts" indicator. It provides a comprehensive dashboard view, allowing traders to monitor the momentum signals of up to 18 different assets in real-time from a single chart. The main purpose is to offer a bird's-eye view of the market, helping you quickly identify assets with strong momentum confluence or potential reversal opportunities without having to switch between different charts.
The screener displays the status of all key components from the Momentum Concepts indicator, including the Fast Oscillator, Scalper's Momentum, Momentum Impulse Oscillator, and Hidden Liquidity Flow, organizing them into a clear and easy-to-read table.
🟠 CONCEPTS
The core of this screener is built upon the analytical framework of the "Momentum Concepts" indicator, which evaluates market momentum across multiple layers: short-term, medium-term, and long-term. This screener applies those complex, proprietary calculations to each symbol in your watchlist and visualizes the current state of each component.
Each column in the table represents a specific aspect of momentum analysis:
Fast Oscillator Columns: These columns reflect the short-term momentum. They show the immediate trend direction, whether the asset is in an overbought or oversold condition, and flag high-probability events like divergences, reversals, or diminishing momentum.
Scalper's Momentum Column: This column gives insight into medium-term momentum. It distinguishes between strong, sustained moves and weakening, corrective moves, which is useful for gauging the health of a trend.
Momentum Impulse Column: This column represents the dominant, long-term trend bias. It helps you understand the underlying market regime (bullish, bearish, or consolidating) to align your trades with the bigger picture.
Hidden Liquidity Flow Column: This column provides a unique view into the market's underlying liquidity dynamics. It signals whether there is net buying or selling pressure and uses special coloring to highlight periods of unusually high liquidity activity, which often precedes volatile price movements.
By combining these perspectives, the screener justifies its utility by enabling traders to make more informed decisions based on multi-layered signal confluence.
🟠 FEATURES
This screener organizes momentum data into several key columns. Here is a breakdown of each column and its possible values:
Asset: Displays the symbol for the asset being analyzed in that row.
Fast Oscillator Trend: Shows the immediate, short-term momentum direction.
▲: Indicates a bullish short-term trend.
▼: Indicates a bearish short-term trend.
–: Indicates a neutral or transitional state.
Fast Oscillator Valuation: Measures whether the asset is in a short-term overbought or oversold state.
OB: Signals an "Overbought" condition, often associated with bullish exhaustion.
OS: Signals an "Oversold" condition, often associated with bearish exhaustion.
Neutral: The asset is trading in a neutral zone, neither overbought nor oversold.
Scalper's Momentum: Assesses the strength and direction of medium-term momentum.
Strong▲: Strong bullish momentum.
Weak▲: Bullish momentum exists but is weakening or corrective.
Strong▼: Strong bearish momentum.
Weak▼: Bearish momentum exists but is weakening or corrective.
–: Neutral or no clear medium-term momentum.
Momentum Impulse: Identifies the dominant, long-term trend bias. A colored background indicates that the momentum is in a strong "impulse" phase.
▲: Indicates a bullish long-term bias.
▼: Indicates a bearish long-term bias.
0: Indicates a neutral or ranging market condition.
Hidden Liquidity Flow: Tracks underlying buying and selling pressure. The background color highlights periods of unusual liquidity activity.
▲: Positive liquidity flow, suggesting net buying pressure.
▼: Negative liquidity flow, suggesting net selling pressure.
–: Neutral liquidity flow.
Dim. Momentum: Provides an early warning that short-term momentum is beginning to fade.
● (Bullish Color): Bullish momentum is weakening.
● (Bearish Color): Bearish momentum is weakening.
–: No diminishing momentum detected.
Divergence: Flags classic or hidden divergences between price and the Fast Oscillator.
Div▲: A bullish divergence has been detected.
Div▼: A bearish divergence has been detected.
–: No active divergence signal.
Reversal: Signals a potential reversal when the Fast Oscillator crosses its trend line from an overbought or oversold zone.
Rev▲: A bullish reversal signal has occurred.
Rev▼: A bearish reversal signal has occurred.
–: No active reversal signal.
🟠 USAGE
The primary function of this screener is to quickly identify trading opportunities and filter setups based on momentum confluence across your watchlist.
1. Setup and Configuration:
Add the indicator to your chart.
Go into the script settings and populate the "Watchlist" group with the symbols you wish to monitor.
Adjust the settings for the various momentum components (Fast Oscillator, Scalper's Momentum, etc.) to align with your trading strategy. These settings will be universally applied to all symbols in the screener.
2. Interpreting the Columns for Trading Decisions:
Momentum Impulse & Hidden Liquidity Flow: Use these columns to establish a directional bias. A bullish "▲" in both columns on an asset suggests a strong underlying uptrend with supportive buying pressure, making it a good candidate for long positions.
Scalper's Momentum: Use this for entry timing and trend health. A "Strong▲" reading can confirm the strength of an uptrend, while a shift to "Weak▲" might suggest it's time to tighten stops or look for an exit.
Fast Oscillator Trend & Valuation: These are best for precise entry triggers. For a "buy the dip" strategy in an uptrend, you could wait for the Fast Oscillator to show "OS" (Oversold) and then enter when the "Trend" column flips back to "▲".
Dim. Momentum: This is an excellent take-profit signal. If you are in a long position and a bullish-colored "●" appears, it's a warning that the upward move is losing steam, and you might consider closing your trade.
Divergence & Reversal: These columns are for identifying potential turning points. A "Div▲" or "Rev▲" signal is a strong alert that a downtrend might be ending, making the asset a prime candidate to watch for a long entry.
3. Finding High-Probability Setups:
Trend Confluence: Look for assets where multiple components show alignment. For example, an ideal long setup might show a bullish "Momentum Impulse" (▲), a "Strong▲" reading in "Scalper's Momentum," and a bullish trend in the "Fast Oscillator." This indicates that the long-term, medium-term, and short-term momentums are all in agreement.
Reversal and Exhaustion: Use the "Divergence" and "Reversal" columns to spot potential turning points. A "Div▲" signal appearing in an asset that is in an oversold "Fast Oscillator Valuation" zone can be a strong indication of an upcoming bounce.
Bezahltes Script

CMF and Scaled EFI OverlayCMF and Scaled EFI Overlay Indicator
Overview
The CMF and Scaled EFI Overlay indicator combines the Chaikin Money Flow (CMF) and a scaled version of the Elder Force Index (EFI) into a single chart. This allows traders to analyze both indicators simultaneously, facilitating better insights into market momentum and volume dynamics , specifically focusing on buying/selling pressure and momentum , without compromising the integrity of either indicator.
Purpose
Chaikin Money Flow (CMF): Measures buying and selling pressure by evaluating price and volume over a specified period. It indicates accumulation (buying pressure) when values are positive and distribution (selling pressure) when values are negative.
Elder Force Index (EFI): Combines price changes and volume to assess the momentum behind market moves. Positive values indicate upward momentum (prices rising with strong volume), while negative values indicate downward momentum (prices falling with strong volume).
By scaling the EFI to match the amplitude of the CMF, this indicator enables a direct comparison between pressure and momentum , preserving their shapes and zero crossings. Traders can observe the relationship between price movements, volume, and momentum more effectively, aiding in decision-making.
Understanding Pressure vs. Momentum
Chaikin Money Flow (CMF):
- Indicates the level of demand (buying pressure) or supply (selling pressure) in the market based on volume and price movements.
- Accumulation: When institutional or large investors are buying significant amounts of an asset, leading to an increase in buying pressure.
- Distribution: When these investors are selling off their holdings, increasing selling pressure.
Elder Force Index (EFI):
- Measures the strength and speed of price movements, indicating how forceful the current trend is.
- Positive Momentum: Prices are rising quickly, indicating a strong uptrend.
- Negative Momentum: Prices are falling rapidly, indicating a strong downtrend.
Understanding the difference between pressure and momentum is crucial. For example, a market may exhibit strong buying pressure (positive CMF) but weak momentum (low EFI), suggesting accumulation without significant price movement yet.
Features
Overlay of CMF and Scaled EFI: Both indicators are plotted on the same chart for easy comparison of pressure and momentum dynamics.
Customizable Parameters: Adjust lengths for CMF and EFI calculations and fine-tune the scaling factor for optimal alignment.
Preserved Indicator Integrity: The scaling method preserves the shape and zero crossings of the EFI, ensuring accurate analysis.
How It Works
CMF Calculation:
- Calculates the Money Flow Multiplier (MFM) and Money Flow Volume (MFV) to assess buying and selling pressure.
- CMF is computed by summing the MFV over the specified length and dividing by the sum of volume over the same period:
CMF = (Sum of MFV over n periods) / (Sum of Volume over n periods)
EFI Calculation:
- Calculates the EFI using the Exponential Moving Average (EMA) of the price change multiplied by volume:
EFI = EMA(n, Change in Close * Volume)
Scaling the EFI:
- The EFI is scaled by multiplying it with a user-defined scaling factor to match the CMF's amplitude.
Plotting:
- Both the CMF and the scaled EFI are plotted on the same chart.
- A zero line is included for reference, aiding in identifying crossovers and divergences.
Indicator Settings
Inputs
CMF Length (`cmf_length`):
- Default: 20
- Description: The number of periods over which the CMF is calculated. A higher value smooths the indicator but may delay signals.
EFI Length (`efi_length`):
- Default: 13
- Description: The EMA length for the EFI calculation. Adjusting this value affects the sensitivity of the EFI to price changes.
EFI Scaling Factor (`efi_scaling_factor`):
- Default: 0.000001
- Description: A constant used to scale the EFI to match the CMF's amplitude. Fine-tuning this value ensures the indicators align visually.
How to Adjust the EFI Scaling Factor
Start with the Default Value:
- Begin with the default scaling factor of `0.000001`.
Visual Inspection:
- Observe the plotted indicators. If the EFI appears too large or small compared to the CMF, proceed to adjust the scaling factor.
Fine-Tune the Scaling Factor:
- Increase or decrease the scaling factor incrementally (e.g., `0.000005`, `0.00001`, `0.00005`) until the amplitudes of the CMF and EFI visually align.
- The optimal scaling factor may vary depending on the asset and timeframe.
Verify Alignment:
- Ensure that the scaled EFI preserves the shape and zero crossings of the original EFI.
- Overlay the original EFI (if desired) to confirm alignment.
How to Use the Indicator
Analyze Buying/Selling Pressure and Momentum:
- Positive CMF (>0): Indicates accumulation (buying pressure).
- Negative CMF (<0): Indicates distribution (selling pressure).
- Positive EFI: Indicates positive momentum (prices rising with strong volume).
- Negative EFI: Indicates negative momentum (prices falling with strong volume).
Look for Indicator Alignment:
- Both CMF and EFI Positive:
- Suggests strong bullish conditions with both buying pressure and upward momentum.
- Both CMF and EFI Negative:
- Indicates strong bearish conditions with selling pressure and downward momentum.
Identify Divergences:
- CMF Positive, EFI Negative:
- Buying pressure exists, but momentum is negative; potential for a bullish reversal if momentum shifts.
- CMF Negative, EFI Positive:
- Selling pressure exists despite rising prices; caution advised as it may indicate a potential bearish reversal.
Confirm Signals with Other Analysis:
- Use this indicator in conjunction with other technical analysis tools (e.g., trend lines, support/resistance levels) to confirm trading decisions.
Example Usage
Scenario 1: Bullish Alignment
- CMF Positive: Indicates accumulation (buying pressure).
- EFI Positive and Increasing: Shows strengthening upward momentum.
- Interpretation:
- Strong bullish signal suggesting that buyers are active, and the price is likely to continue rising.
- Action:
- Consider entering a long position or adding to existing ones.
Scenario 2: Bearish Divergence
- CMF Negative: Indicates distribution (selling pressure).
- EFI Positive but Decreasing: Momentum is positive but weakening.
- Interpretation:
- Potential bearish reversal; price may be rising but underlying selling pressure suggests caution.
- Action:
- Be cautious with long positions; consider tightening stop-losses or preparing for a possible trend reversal.
Tips
Adjust for Different Assets:
- The optimal scaling factor may differ across assets due to varying price and volume characteristics.
- Always adjust the scaling factor when analyzing a new asset.
Monitor Indicator Crossovers:
- Crossings above or below the zero line can signal potential trend changes.
Watch for Divergences:
- Divergences between the CMF and EFI can provide early warning signs of trend reversals.
Combine with Other Indicators:
- Enhance your analysis by combining this overlay with other indicators like moving averages, RSI, or Ichimoku Cloud.
Limitations
Scaling Factor Sensitivity:
- An incorrect scaling factor may misalign the indicators, leading to inaccurate interpretations.
- Regular adjustments may be necessary when switching between different assets or timeframes.
Not a Standalone Indicator:
- Should be used as part of a comprehensive trading strategy.
- Always consider other market factors and indicators before making trading decisions.
Disclaimer
No Guarantee of Performance:
- Past performance is not indicative of future results.
- Trading involves risk, and losses can exceed deposits.
Use at Your Own Risk:
- This indicator is provided for educational purposes.
- The author is not responsible for any financial losses incurred while using this indicator.
Code Summary
//@version=5
indicator(title="CMF and Scaled EFI Overlay", shorttitle="CMF & Scaled EFI", overlay=false)
cmf_length = input.int(20, minval=1, title="CMF Length")
efi_length = input.int(13, minval=1, title="EFI Length")
efi_scaling_factor = input.float(0.000001, title="EFI Scaling Factor", minval=0.0, step=0.000001)
// --- CMF Calculation ---
ad = high != low ? ((2 * close - low - high) / (high - low)) * volume : 0
mf = math.sum(ad, cmf_length) / math.sum(volume, cmf_length)
// --- EFI Calculation ---
efi_raw = ta.ema(ta.change(close) * volume, efi_length)
// --- Scale EFI ---
efi_scaled = efi_raw * efi_scaling_factor
// --- Plotting ---
plot(mf, color=color.green, title="CMF", linewidth=2)
plot(efi_scaled, color=color.red, title="EFI (Scaled)", linewidth=2)
hline(0, color=color.gray, title="Zero Line", linestyle=hline.style_dashed)
- Lines 4-6: Define input parameters for CMF length, EFI length, and EFI scaling factor.
- Lines 9-11: Calculate the CMF.
- Lines 14-16: Calculate the EFI.
- Line 19: Scale the EFI by the scaling factor.
- Lines 22-24: Plot the CMF, scaled EFI, and zero line.
Feedback and Support
Suggestions: If you have ideas for improvements or additional features, please share your feedback.
Support: For assistance or questions regarding this indicator, feel free to contact the author through TradingView.
---
By combining the CMF and scaled EFI into a single overlay, this indicator provides a powerful tool for traders to analyze market dynamics more comprehensively. Adjust the parameters to suit your trading style, and always practice sound risk management.

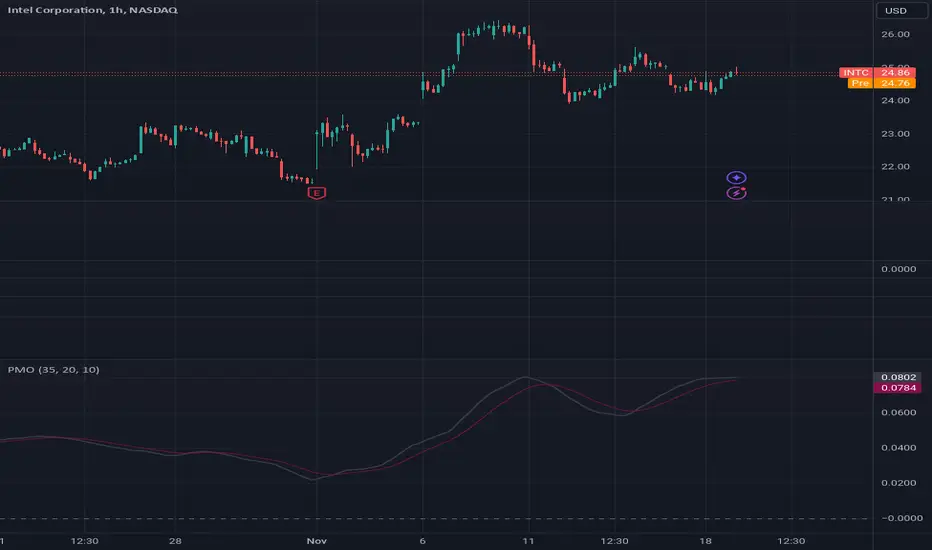
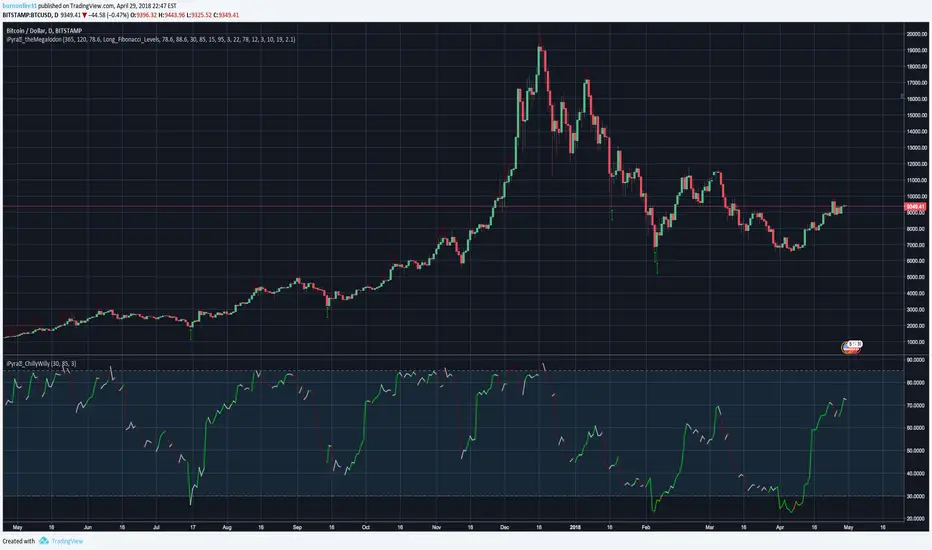
iPyra◬_ChillyWillyCHILLYWILLY
ChillyWilly looks for the momentum trades.
ChillyWilly combines the 4 different well known momentum indicators to bring the best signals.
ChillyWilly works with any kind of market state, any kind of trading, and any kind of asset.
ChillyWilly has more features than any other momentum indicator in the market: Combining shorter term momentum with longer term momentum, and looking for M's and W's for you.
--------------------------------------
ChillyWilly is designed for longer time frame traders and investors.
All you have to do is:
1- Use it like you would use RSI (ChillyWilly is ranging between 0-100 --> Closer to 0 means Long ~~ Closer to 100 means short)
2- Look for green or orange lines. (Orange means momentum is BOTH in a good location to long and showing a W ; Green means EITHER momentum is in a good location to long or showing a W)
3- Look for red or maroon lines. (Red means momentum is BOTH in a good location to short and showing a M ; Green means EITHER momentum is in a good location to short or showing a M)
------------------------------------------------------------
iPyra◬
Enlighten others
FluidFlow OscillatorFluidFlow Oscillator: Study Material for Traders
Overview
The FluidFlow Oscillator is a custom technical indicator designed to measure price momentum and market flow dynamics by simulating fluid motion concepts such as velocity, viscosity, and turbulence. It helps traders identify potential buy and sell signals along with trend strength, momentum direction, and volatility conditions.
This study explains the underlying calculation concepts, signal logic, visual cues, and how to interpret the professional dashboard table that summarizes key indicator readings.
________________________________________
How the FluidFlow Oscillator Works
Core Mechanisms
1. Price Flow Velocity
o Measures the rate of change of price over a specified flow length (default 40 bars).
o Calculated as a percentage change of closing price: roc=close−closelen_flowcloselen_flow×100\text{roc} = \frac{\text{close} - \text{close}_{len\_flow}}{\text{close}_{len\_flow}} \times 100roc=closelen_flowclose−closelen_flow×100
o Smoothed by an EMA (Exponential Moving Average) to reduce noise, generating a "flow velocity" value.
2. Viscosity Factor
o Analogous to fluid viscosity, it adjusts the flow velocity based on recent price volatility.
o Volatility is computed as the standard deviation of close prices over the flow length.
o The viscosity acts as a damping factor to slow down the flow velocity in highly volatile conditions.
o This results in a "flow with viscosity" value, that smooths out the velocity considering market turbulence.
3. Turbulence Burst
o Captures sudden changes or bursts in the flow by measuring changes between successive viscosity-adjusted flows.
o The turbulence value is a smoothed absolute change in flow.
o A burst boost factor is added to the oscillator to incorporate this rapid change component, amplifying signals during sudden shifts.
4. Oscillator Calculation
o The raw oscillator value is the sum of flow with viscosity plus burst boost, scaled by 10.
o Clamped between -100 and +100 to limit extremes.
o Finally, smoothed again by EMA for cleaner visualization.
________________________________________
Signal Logic
The oscillator works with complementary components to produce actionable signals:
• Signal Line: An EMA-smoothed version of the oscillator for generating crossover-based signals.
• Momentum: The rate of change of the oscillator itself, smoothed by EMA.
• Trend: Uses fast (21-period EMA) and slow (50-period EMA) moving averages of price to identify market trend direction (uptrend, downtrend, or sideways).
Signal Conditions
• Bullish Signal (Buy): Oscillator crosses above the oversold threshold with positive momentum.
• Bearish Signal (Sell): Oscillator crosses below the overbought threshold with negative momentum.
Statuses
The oscillator provides descriptive market states based on level and momentum:
• Overbought
• Oversold
• Buy Signal
• Sell Signal
• Bullish / Bearish (momentum-driven)
• Neutral (no clear trend)
________________________________________
Color System and Visualization
The oscillator uses a sophisticated HSV color model adapting hues according to:
• Oscillator value magnitude and sign (positive or negative)
• Acceleration of oscillator changes
• Smooth color gradients to facilitate intuitive understanding of trend strength and momentum shifts
Background colors highlight overbought (red tint) and oversold (green tint) zones with transparency.
________________________________________
How to Understand the Professional Dashboard Table
The FluidFlow Oscillator offers an integrated table at the bottom center of the chart. This dashboard summarizes critical indicator readings in 8 columns across 3 rows:
Column Description
SIGNAL Current signal status (e.g., Buy, Sell, Overbought) with color coding
OSCILLATOR Current oscillator value (-100 to +100) with color reflecting intensity and direction
MOMENTUM Momentum bias indicating strength/direction of oscillator changes (Strong Up, Up, Sideways, Down, Strong Down)
TREND Current trend status based on EMAs (Strong Uptrend, Uptrend, Sideways, Downtrend, Strong Downtrend)
VOLATILITY Volatility percentage relative to average, indicating market activity level
FLOW Flow velocity value describing price momentum magnitude and direction
TURBULENCE Turbulence level indicating sudden bursts or spikes in price movement
PROGRESS Oscillator's position mapped as a percentage (0% to 100%) showing proximity to extreme levels
Rows Explained
• Row 1 (Header): Labels for each metric.
• Row 2 (Values): Current numerical or descriptive values color-coded along a professional scheme:
o Green or lime tones indicate positive or bullish conditions.
o Red or orange tones indicate caution, sell signals, or bearish conditions.
o Blue tones indicate neutral or stable conditions.
• Row 3 (Status Indicators): Emoji-like icons and bars provide a quick visual gauge of each metric's intensity or signal strength:
o For example, "🟢🟢🟢" suggests very strong bullish momentum, while "🔴🔴🔴" suggests strong bearish momentum.
o Progress bar visually demonstrates oscillator movement toward oversold or overbought extremes.
________________________________________
Practical Interpretation Tips
• A Buy signal with green colors and strong momentum usually precedes upward price moves.
• An Overbought status with red background and red table colors warns of potential price corrections or reversals.
• Watch the Turbulence to gauge market instability; spikes may precede price shocks or volatility bursts.
• Confirm signals with the Trend and Momentum columns to avoid false entries.
• Use the Progress bar to anticipate oscillations approaching key threshold levels for timing trades.
________________________________________
Alerts
The oscillator supports alerts for:
• Buy and sell signals based on oscillator crossovers.
• Overbought and oversold levels reached.
These help traders automate awareness of important market conditions.
________________________________________
Disclaimer
The FluidFlow Oscillator and its signals are for educational and informational purposes only. They do not guarantee profits and should not be considered as financial advice. Always conduct your own research and use proper risk management when trading. Past performance is not indicative of future results.
________________________________________
This detailed explanation should help you understand the workings of the FluidFlow Oscillator, its components, signal logic, and how to analyze its professional dashboard for informed trading decisions.

Rahul Prakash's BUY/SELL signal for momentum tradeBuy or Sell signal with just on one confirmation candle.
Show a Buy singal then wait for the confirmation candle, is a strong Buy signal.
Show a Sell singal then wait for the confirmation candle, is a strong Sell signal.
You can use as a free version and earn money. Please are taking lots of price for this type of indicator.

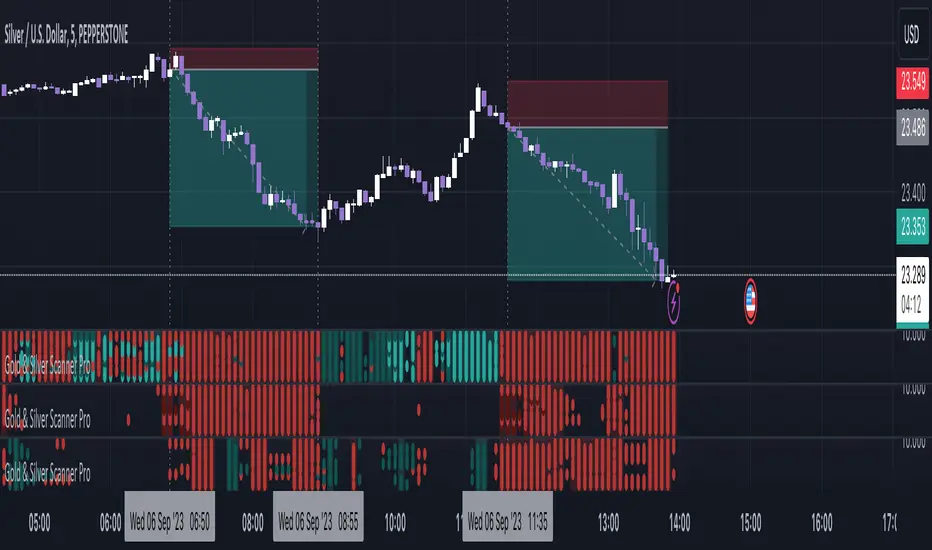
Gold & Silver Scanner Pro [FxScripts]***** FEATURES *****
Gold & Silver Scanner Pro is both a multi-functional indicator and market scanner combined. The combination allows you to have multiple eyes across the market, all from a single chart.
The scanner is comprised of an intuitively designed 3-in-1 tool that tracks the key metrics that drive markets. Each use advanced algorithms to gather information from multiple data points, distilled into one simplified view.
***** TREND SCANNER *****
The first indicator featured on the chart is the Trend Scanner, this allows you to track price action across the wider market. Instantly see pattern shifts and emerging trends; when the market moves, you move with it.
***** MOMENTUM SCANNER *****
The second is the Momentum Scanner which offers a realtime representation of momentum shifts as they occur. This allows you to monitor false breakouts and catch the moves that matter.
***** VOLUME SCANNER *****
The third is the Volume Scanner which provides unique insight into where buy and sell volume is being placed across the market. It offers a further way of determining entry and exit points or simply confirmation that a trend is underway.
***** HOW IT WORKS *****
1. The scanner surveys the market looking for strengths and weaknesses in Trend, Momentum or Volume.
2. It displays the underlying strength or weakness as a series of dots with up to nine green dots showing strength and up to nine red dots showing weakness (nine data points in total).
3. Lighter colored dots are displayed where the strength of the trend, momentum or volume is lesser; if a dot is missing this is a sign of market neutrality.
4. All scanners have a sensitivity setting plus a volatility filter which can be adjusted according to your style of trading and the underlying instrument (full details below).
5. The background can be set to color-fill when the majority of dots are coloured either red or green, with higher values denoting greater strength or greater weakness.
6. Alerts can be configured in the same way as the background to provide both entry and exit signals (further details below).
***** INSTRUMENTS *****
Gold & Silver Scanner Pro works effortlessly with any of the XAG and XAU major or minor crosses:
XAGAUD, XAGCHF, XAGEUR, XAGGBP, XAGJPY, XAGUSD, XAUAUD, XAUCHF, XAUEUR, XAUGBP, XAUJPY, XAUUSD
Plus the following gold and silver futures:
GC, SI
***** SETTINGS OVERVIEW *****
The scanner features the following customizable settings:
~~ Trend Settings ~~
▶ Trend Filter - adjusting this will allow you to focus on short term trends (most suitable for scalping), medium or long term (best for swing trading).
▶ Countertrend Strength - increases the sensitivity of weaker vs stronger countertrends. As countertrends are trends that run against the main trend, this will assist in detecting the strength of a pullback or reversal and allow you to either hold, exit or reverse the trade with confidence.
~~ Momentum Settings ~~
▶ Momentum Filter - increase or decrease the sensitivity of the momentum scanner. Increase to avoid periods of low or weak momentum, decrease to highlight stronger surges in momentum.
~~ Volume Settings ~~
▶ Volume Filter - increase or decrease the sensitivity of the volume scanner. Increase to avoid periods where buy and sell volume can potentially cancel each other out.
~~ Volatility Settings ~~
▶ Volatility Offset - use this to fine tune the volatility filter. A higher value generally delays the volatility filter allowing for confirmation of stronger trends, a lower value will detect trend, momentum or volume movement sooner but may be less accurate.
▶ Each scanner has its own setting allowing you to adjust how you monitor the underlying volatility for each.
▶ As with all settings, we recommend adjusting this to your style of trading, instrument and timeframe.
~~ Alerts ~~
Alerts can be configured to send notifications when anything from 5-9 bullish or bearish dots are showing. Exit markers can be configured when anything from 2+ dots are revealed. This adds an extra layer of sensitivity for traders who appreciate complete control over their trade.
~~ Display Settings ~~
You have the ability to hide all colored dots and only show the background or, alternatively, hide the background and only show colored dots.
***** TRIAL PERIOD *****
We offer a FREE, no questions asked, 7-day trial with every new registration. Visit the link below to register.
Standardized MACD Heikin-Ashi TransformedThe Standardized MACD Heikin-Ashi Transformed (St. MACD) is an advanced indicator designed to overcome the limitations of the traditional MACD. It offers a more robust and standardized measure of momentum, making it comparable across different timeframes and securities. By incorporating the Heikin-Ashi transformation, the St. MACD provides a smoother visualization of trends and potential reversals, enhancing its utility for traders seeking a clearer view of the underlying market direction.
Methodology:
The calculation of St. MACD begins with the traditional MACD, which computes the difference between two exponential moving averages (EMAs) of the price. To address the issue of non-comparability across assets, the St. MACD normalizes its values using the exponential average of the price's height. This normalization process ensures that the indicator's readings are not influenced by the absolute price levels, allowing for objective and quantitatively defined comparisons of momentum strength.
Furthermore, St. MACD utilizes the Heikin-Ashi transformation, which involves deriving candles from the price data. These Heikin-Ashi candles provide a smoother representation of trends and help filter out noise in the market. A predictive curve of Heikin-Ashi candles within the St. MACD turns blue or red, indicating the prevailing trend direction. This feature enables traders to easily identify trend shifts and make better informed trading decisions.
Advantages:
St. MACD offers several key advantages over the traditional MACD-
Standardization: By normalizing the indicator's values, St. MACD becomes comparable across different assets and timeframes. This makes it a valuable tool for traders analyzing various markets and seeking consistent momentum measurements.
Heikin-Ashi Transformation: The integration of the Heikin-Ashi transformation smoothes out the indicator's fluctuations and enhances trend visibility. Traders can more easily identify trends and potential reversal points, improving their market analysis.
Quantifiable Momentum: St. MACD's key levels represent the strength of momentum, providing traders with a quantifiable framework to gauge the intensity of market movements. This feature helps identify periods of increased or decreased momentum.
Utility:
The St. MACD indicator offers versatile utility for traders-
Trend Identification: Traders can use the color-coded predictive curve of Heikin-Ashi candles to swiftly determine the prevailing trend direction. This aids in identifying potential entry and exit points in the market.
Reversal Signals: Colored extremes within the St. MACD signal potential price reversals, alerting traders to potential turning points in the market. This assists in making timely decisions during market inflection points.
Overbought/Oversold Conditions: The histogram version of St. MACD can be used in conjunction with the bands to detect short-term overbought or oversold market conditions, allowing traders to adjust their strategies accordingly.
In conclusion, this tool addresses the limitations of the traditional MACD by providing a standardized and comparable momentum indicator. Its incorporation of the Heikin-Ashi transformation enhances trend visibility and assists traders in making more informed decisions. With its quantifiable momentum measurements and various utility features, the St. MACD is a valuable tool for traders seeking a clearer and more objective view of market trends and reversals.
Key Features:
Display Modes: MACD, Histogram or Hybrid
Reversion Triangles by adjustable thresholds
Bar Coloring Methods: MidLine, Candles, Signal Cross, Extremities, Reversions
Example Charts:
-Traditional limitations-
-Comparisons across time and securities-
-Showcase-
See Also:
-Other Heikin-Ashi Transforms-

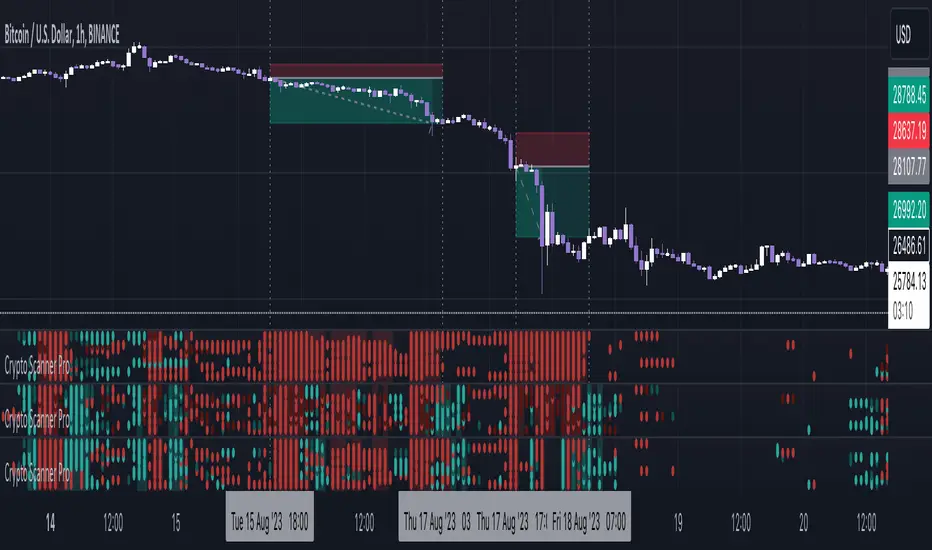
Crypto Scanner Pro [FxScripts]***** FEATURES *****
Crypto Scanner Pro is both an indicator and market scanner combined. The combination allows you to have multiple eyes across the market, all from a single chart.
Each scanner is comprised of an intuitively designed 3-in-1 tool that tracks the key metrics that drive markets.
They each use advanced algorithms to gather information from multiple data points, distilled into one simplified view.
***** TREND SCANNER *****
The Trend Scanner allows you to track price action across the wider market. Instantly see pattern shifts and emerging trends; when the market moves, you can move with it.
***** MOMENTUM SCANNER *****
The Momentum Scanner offers realtime insights into momentum shifts as they occur. This allows you to monitor false breakouts and catch the moves that matter.
***** VOLUME SCANNER *****
The Volume Scanner provides unique indications into where buy and sell volume is being placed. It offers a further way of determining entry and exit points or simply confirmation that a trend is underway.
***** INSTRUMENTS *****
Crypto Scanner Pro works effortlessly with the following large cap coins:
Avalanche, Bitcoin Cash, Bitcoin, BITO, BNB, Cardano, Chainlink, Dogecoin, Ethereum, Litecoin, Polkadot, Polygon, Shiba Inu, Solana, Stellar, Toncoin, XRP (Ripple) *
***** SETTINGS OVERVIEW *****
The scanner features the following customizable settings:
~~ Trend Settings ~~
Trend Filter - adjusting this will allow you to focus on short term trends (most suitable for scalping), medium or long term (best for swing trading).
Countertrend Strength - increases the sensitivity of weaker vs stronger countertrends. As countertrends are trends that run against the main trend, this will assist in detecting the strength of a pullback or reversal and allow you to either hold, exit or reverse the trade with confidence.
~~ Momentum Settings ~~
Momentum Filter - increase or decrease the sensitivity of the momentum scanner. Increase to avoid periods of low or weak momentum, decrease to highlight stronger surges in momentum.
~~ Volume Settings ~~
Volume Filter - increase or decrease the sensitivity of the volume scanner. Increase to avoid periods where buy and sell volume can potentially cancel each other out.
~~ Volatility Settings ~~
Volatility Offset - use this to fine tune the volatility filter. A higher value generally delays the volatility filter allowing for confirmation of stronger trends, a lower value will detect trend, momentum or volume movement sooner but may be less accurate.
Each scanner has its own setting allowing you to adjust how you monitor the underlying volatility for each.
As with all settings, we recommend adjusting this to your style of trading, instrument and timeframe.
~~ Alerts ~~
Alerts can be configured to send notifications when anything from 6-10 bullish or bearish dots are showing. Exit markers can be configured when anything from 2+ dots are revealed. This adds an extra layer of sensitivity for traders who appreciate complete control over their trade.
~~ Display Settings ~~
You have the ability to hide all colored dots and only show the background or, alternatively, hide the background and only show colored dots.
***** TRIAL PERIOD *****
We offer a FREE, no questions asked, 7-day trial with every new registration. Visit the link below to register.
* list subject to change as coins increase or decrease in popularity
Market Zone Analyzer[BullByte]Understanding the Market Zone Analyzer
---
1. Purpose of the Indicator
The Market Zone Analyzer is a Pine Script™ (version 6) indicator designed to streamline market analysis on TradingView. Rather than scanning multiple separate tools, it unifies four core dimensions—trend strength, momentum, price action, and market activity—into a single, consolidated view. By doing so, it helps traders:
• Save time by avoiding manual cross-referencing of disparate signals.
• Reduce decision-making errors that can arise from juggling multiple indicators.
• Gain a clear, reliable read on whether the market is in a bullish, bearish, or sideways phase, so they can more confidently decide to enter, exit, or hold a position.
---
2. Why a Trader Should Use It
• Unified View: Combines all essential market dimensions into one easy-to-read score and dashboard, eliminating the need to piece together signals manually.
• Adaptability: Automatically adjusts its internal weighting for trend, momentum, and price action based on current volatility. Whether markets are choppy or calm, the indicator remains relevant.
• Ease of Interpretation: Outputs a simple “BULLISH,” “BEARISH,” or “SIDEWAYS” label, supplemented by an intuitive on-chart dashboard and an oscillator plot that visually highlights market direction.
• Reliability Features: Built-in smoothing of the net score and hysteresis logic (requiring consecutive confirmations before flips) minimize false signals during noisy or range-bound phases.
---
3. Why These Specific Indicators?
This script relies on a curated set of well-established technical tools, each chosen for its particular strength in measuring one of the four core dimensions:
1. Trend Strength:
• ADX/DMI (Average Directional Index / Directional Movement Index): Measures how strong a trend is, and whether the +DI line is above the –DI line (bullish) or vice versa (bearish).
• Moving Average Slope (Fast MA vs. Slow MA): Compares a shorter-period SMA to a longer-period SMA; if the fast MA sits above the slow MA, it confirms an uptrend, and vice versa for a downtrend.
• Ichimoku Cloud Differential (Senkou A vs. Senkou B): Provides a forward-looking view of trend direction; Senkou A above Senkou B signals bullishness, and the opposite signals bearishness.
2. Momentum:
• Relative Strength Index (RSI): Identifies overbought (above its dynamically calculated upper bound) or oversold (below its lower bound) conditions; changes in RSI often precede price reversals.
• Stochastic %K: Highlights shifts in short-term momentum by comparing closing price to the recent high/low range; values above its upper band signal bullish momentum, below its lower band signal bearish momentum.
• MACD Histogram: Measures the difference between the MACD line and its signal line; a positive histogram indicates upward momentum, a negative histogram indicates downward momentum.
3. Price Action:
• Highest High / Lowest Low (HH/LL) Range: Over a defined lookback period, this captures breakout or breakdown levels. A closing price near the recent highs (with a positive MA slope) yields a bullish score, and near the lows (with a negative MA slope) yields a bearish score.
• Heikin-Ashi Doji Detection: Uses Heikin-Ashi candles to identify indecision or continuation patterns. A small Heikin-Ashi body (doji) relative to recent volatility is scored as neutral; a larger body in the direction of the MA slope is scored bullish or bearish.
• Candle Range Measurement: Compares each candle’s high-low range against its own dynamic band (average range ± standard deviation). Large candles aligning with the prevailing trend score bullish or bearish accordingly; unusually small candles can indicate exhaustion or consolidation.
4. Market Activity:
• Bollinger Bands Width (BBW): Measures the distance between BB upper and lower bands; wide bands indicate high volatility, narrow bands indicate low volatility.
• Average True Range (ATR): Quantifies average price movement (volatility). A sudden spike in ATR suggests a volatile environment, while a contraction suggests calm.
• Keltner Channels Width (KCW): Similar to BBW but uses ATR around an EMA. Provides a second layer of volatility context, confirming or contrasting BBW readings.
• Volume (with Moving Average): Compares current volume to its moving average ± standard deviation. High volume validates strong moves; low volume signals potential lack of conviction.
By combining these tools, the indicator captures trend direction, momentum strength, price-action nuances, and overall market energy, yielding a more balanced and comprehensive assessment than any single tool alone.
---
4. What Makes This Indicator Stand Out
• Multi-Dimensional Analysis: Rather than relying on a lone oscillator or moving average crossover, it simultaneously evaluates trend, momentum, price action, and activity.
• Dynamic Weighting: The relative importance of trend, momentum, and price action adjusts automatically based on real-time volatility (Market Activity State). For example, in highly volatile conditions, trend and momentum signals carry more weight; in calm markets, price action signals are prioritized.
• Stability Mechanisms:
• Smoothing: The net score is passed through a short moving average, filtering out noise, especially on lower timeframes.
• Hysteresis: Both Market Activity State and the final bullish/bearish/sideways zone require two consecutive confirmations before flipping, reducing whipsaw.
• Visual Interpretation: A fully customizable on-chart dashboard displays each sub-indicator’s value, regime, score, and comment, all color-coded. The oscillator plot changes color to reflect the current market zone (green for bullish, red for bearish, gray for sideways) and shows horizontal threshold lines at +2, 0, and –2.
---
5. Recommended Timeframes
• Short-Term (5 min, 15 min): Day traders and scalpers can benefit from rapid signals, but should enable smoothing (and possibly disable hysteresis) to reduce false whipsaws.
• Medium-Term (1 h, 4 h): Swing traders find a balance between responsiveness and reliability. Less smoothing is required here, and the default parameters (e.g., ADX length = 14, RSI length = 14) perform well.
• Long-Term (Daily, Weekly): Position traders tracking major trends can disable smoothing for immediate raw readings, since higher-timeframe noise is minimal. Adjust lookback lengths (e.g., increase adxLength, rsiLength) if desired for slower signals.
Tip: If you keep smoothing off, stick to timeframes of 1 h or higher to avoid excessive signal “chatter.”
---
6. How Scoring Works
A. Individual Indicator Scores
Each sub-indicator is assigned one of three discrete scores:
• +1 if it indicates a bullish condition (e.g., RSI above its dynamically calculated upper bound).
• 0 if it is neutral (e.g., RSI between upper and lower bounds).
• –1 if it indicates a bearish condition (e.g., RSI below its dynamically calculated lower bound).
Examples of individual score assignments:
• ADX/DMI:
• +1 if ADX ≥ adxThreshold and +DI > –DI (strong bullish trend)
• –1 if ADX ≥ adxThreshold and –DI > +DI (strong bearish trend)
• 0 if ADX < adxThreshold (trend strength below threshold)
• RSI:
• +1 if RSI > RSI_upperBound
• –1 if RSI < RSI_lowerBound
• 0 otherwise
• ATR (as part of Market Activity):
• +1 if ATR > (ATR_MA + stdev(ATR))
• –1 if ATR < (ATR_MA – stdev(ATR))
• 0 otherwise
Each of the four main categories shares this same +1/0/–1 logic across their sub-components.
B. Category Scores
Once each sub-indicator reports +1, 0, or –1, these are summed within their categories as follows:
• Trend Score = (ADX score) + (MA slope score) + (Ichimoku differential score)
• Momentum Score = (RSI score) + (Stochastic %K score) + (MACD histogram score)
• Price Action Score = (Highest-High/Lowest-Low score) + (Heikin-Ashi doji score) + (Candle range score)
• Market Activity Raw Score = (BBW score) + (ATR score) + (KC width score) + (Volume score)
Each category’s summed value can range between –3 and +3 (for Trend, Momentum, and Price Action), and between –4 and +4 for Market Activity raw.
C. Market Activity State and Dynamic Weight Adjustments
Rather than contributing directly to the netScore like the other three categories, Market Activity determines how much weight to assign to Trend, Momentum, and Price Action:
1. Compute Market Activity Raw Score by summing BBW, ATR, KCW, and Volume individual scores (each +1/0/–1).
2. Bucket into High, Medium, or Low Activity:
• High if raw Score ≥ 2 (volatile market).
• Low if raw Score ≤ –2 (calm market).
• Medium otherwise.
3. Apply Hysteresis (if enabled): The state only flips after two consecutive bars register the same high/low/medium label.
4. Set Category Weights:
• High Activity: Trend = 50 %, Momentum = 35 %, Price Action = 15 %.
• Low Activity: Trend = 25 %, Momentum = 20 %, Price Action = 55 %.
• Medium Activity: Use the trader’s base weight inputs (e.g., Trend = 40 %, Momentum = 30 %, Price Action = 30 % by default).
D. Calculating the Net Score
5. Normalize Base Weights (so that the sum of Trend + Momentum + Price Action always equals 100 %).
6. Determine Current Weights based on the Market Activity State (High/Medium/Low).
7. Compute Each Category’s Contribution: Multiply (categoryScore) × (currentWeight).
8. Sum Contributions to get the raw netScore (a floating-point value that can exceed ±3 when scores are strong).
9. Smooth the netScore over two bars (if smoothing is enabled) to reduce noise.
10. Apply Hysteresis to the Final Zone:
• If the smoothed netScore ≥ +2, the bar is classified as “Bullish.”
• If the smoothed netScore ≤ –2, the bar is classified as “Bearish.”
• Otherwise, it is “Sideways.”
• To prevent rapid flips, the script requires two consecutive bars in the new zone before officially changing the displayed zone (if hysteresis is on).
E. Thresholds for Zone Classification
• BULLISH: netScore ≥ +2
• BEARISH: netScore ≤ –2
• SIDEWAYS: –2 < netScore < +2
---
7. Role of Volatility (Market Activity State) in Scoring
Volatility acts as a dynamic switch that shifts which category carries the most influence:
1. High Activity (Volatile):
• Detected when at least two sub-scores out of BBW, ATR, KCW, and Volume equal +1.
• The script sets Trend weight = 50 % and Momentum weight = 35 %. Price Action weight is minimized at 15 %.
• Rationale: In volatile markets, strong trending moves and momentum surges dominate, so those signals are more reliable than nuanced candle patterns.
2. Low Activity (Calm):
• Detected when at least two sub-scores out of BBW, ATR, KCW, and Volume equal –1.
• The script sets Price Action weight = 55 %, Trend = 25 %, and Momentum = 20 %.
• Rationale: In quiet, sideways markets, subtle price-action signals (breakouts, doji patterns, small-range candles) are often the best early indicators of a new move.
3. Medium Activity (Balanced):
• Raw Score between –1 and +1 from the four volatility metrics.
• Uses whatever base weights the trader has specified (e.g., Trend = 40 %, Momentum = 30 %, Price Action = 30 %).
Because volatility can fluctuate rapidly, the script employs hysteresis on Market Activity State: a new High or Low state must occur on two consecutive bars before weights actually shift. This avoids constant back-and-forth weight changes and provides more stability.
---
8. Scoring Example (Hypothetical Scenario)
• Symbol: Bitcoin on a 1-hour chart.
• Market Activity: Raw volatility sub-scores show BBW (+1), ATR (+1), KCW (0), Volume (+1) → Total raw Score = +3 → High Activity.
• Weights Selected: Trend = 50 %, Momentum = 35 %, Price Action = 15 %.
• Trend Signals:
• ADX strong and +DI > –DI → +1
• Fast MA above Slow MA → +1
• Ichimoku Senkou A > Senkou B → +1
→ Trend Score = +3
• Momentum Signals:
• RSI above upper bound → +1
• MACD histogram positive → +1
• Stochastic %K within neutral zone → 0
→ Momentum Score = +2
• Price Action Signals:
• Highest High/Lowest Low check yields 0 (close not near extremes)
• Heikin-Ashi doji reading is neutral → 0
• Candle range slightly above upper bound but trend is strong, so → +1
→ Price Action Score = +1
• Compute Net Score (before smoothing):
• Trend contribution = 3 × 0.50 = 1.50
• Momentum contribution = 2 × 0.35 = 0.70
• Price Action contribution = 1 × 0.15 = 0.15
• Raw netScore = 1.50 + 0.70 + 0.15 = 2.35
• Since 2.35 ≥ +2 and hysteresis is met, the final zone is “Bullish.”
Although the netScore lands at 2.35 (Bullish), smoothing might bring it slightly below 2.00 on the first bar (e.g., 1.90), in which case the script would wait for a second consecutive reading above +2 before officially classifying the zone as Bullish (if hysteresis is enabled).
---
9. Correlation Between Categories
The four categories—Trend Strength, Momentum, Price Action, and Market Activity—often reinforce or offset one another. The script takes advantage of these natural correlations:
• Bullish Alignment: If ADX is strong and pointed upward, fast MA is above slow MA, and Ichimoku is positive, that usually coincides with RSI climbing above its upper bound and the MACD histogram turning positive. In such cases, both Trend and Momentum categories generate +1 or +2. Because the Market Activity State is likely High (given the accompanying volatility), Trend and Momentum weights are at their peak, so the netScore quickly crosses into Bullish territory.
• Sideways/Consolidation: During a low-volatility, sideways phase, ADX may fall below its threshold, MAs may flatten, and RSI might hover in the neutral band. However, subtle price-action signals (like a small breakout candle or a Heikin-Ashi candle with a slight bias) can still produce a +1 in the Price Action category. If Market Activity is Low, Price Action’s weight (55 %) can carry enough influence—even if Trend and Momentum are neutral—to push the netScore out of “Sideways” into a mild bullish or bearish bias.
• Opposing Signals: When Trend is bullish but Momentum turns negative (for example, price continues up but RSI rolls over), the two scores can partially cancel. Market Activity may remain Medium, in which case the netScore lingers near zero (Sideways). The trader can then wait for either a clearer momentum shift or a fresh price-action breakout before committing.
By dynamically recognizing these correlations and adjusting weights, the indicator ensures that:
• When Trend and Momentum align (and volatility supports it), the netScore leaps strongly into Bullish or Bearish.
• When Trend is neutral but Price Action shows an early move in a low-volatility environment, Price Action’s extra weight in the Low Activity State can still produce actionable signals.
---
10. Market Activity State & Its Role (Detailed)
The Market Activity State is not a direct category score—it is an overarching context setter for how heavily to trust Trend, Momentum, or Price Action. Here’s how it is derived and applied:
1. Calculate Four Volatility Sub-Scores:
• BBW: Compare the current band width to its own moving average ± standard deviation. If BBW > (BBW_MA + stdev), assign +1 (high volatility); if BBW < (BBW_MA × 0.5), assign –1 (low volatility); else 0.
• ATR: Compare ATR to its moving average ± standard deviation. A spike above the upper threshold is +1; a contraction below the lower threshold is –1; otherwise 0.
• KCW: Same logic as ATR but around the KCW mean.
• Volume: Compare current volume to its volume MA ± standard deviation. Above the upper threshold is +1; below the lower threshold is –1; else 0.
2. Sum Sub-Scores → Raw Market Activity Score: Range between –4 and +4.
3. Assign Market Activity State:
• High Activity: Raw Score ≥ +2 (at least two volatility metrics are strongly spiking).
• Low Activity: Raw Score ≤ –2 (at least two metrics signal unusually low volatility or thin volume).
• Medium Activity: Raw Score is between –1 and +1 inclusive.
4. Hysteresis for Stability:
• If hysteresis is enabled, a new state only takes hold after two consecutive bars confirm the same High, Medium, or Low label.
• This prevents the Market Activity State from bouncing around when volatility is on the fence.
5. Set Category Weights Based on Activity State:
• High Activity: Trend = 50 %, Momentum = 35 %, Price Action = 15 %.
• Low Activity: Trend = 25 %, Momentum = 20 %, Price Action = 55 %.
• Medium Activity: Use trader’s base weights (e.g., Trend = 40 %, Momentum = 30 %, Price Action = 30 %).
6. Impact on netScore: Because category scores (–3 to +3) multiply by these weights, High Activity amplifies the effect of strong Trend and Momentum scores; Low Activity amplifies the effect of Price Action.
7. Market Context Tooltip: The dashboard includes a tooltip summarizing the current state—e.g., “High activity, trend and momentum prioritized,” “Low activity, price action prioritized,” or “Balanced market, all categories considered.”
---
11. Category Weights: Base vs. Dynamic
Traders begin by specifying base weights for Trend Strength, Momentum, and Price Action that sum to 100 %. These apply only when volatility is in the Medium band. Once volatility shifts:
• High Volatility Overrides:
• Trend jumps from its base (e.g., 40 %) to 50 %.
• Momentum jumps from its base (e.g., 30 %) to 35 %.
• Price Action is reduced to 15 %.
Example: If base weights were Trend = 40 %, Momentum = 30 %, Price Action = 30 %, then in High Activity they become 50/35/15. A Trend score of +3 now contributes 3 × 0.50 = +1.50 to netScore; a Momentum +2 contributes 2 × 0.35 = +0.70. In total, Trend + Momentum can easily push netScore above the +2 threshold on its own.
• Low Volatility Overrides:
• Price Action leaps from its base (30 %) to 55 %.
• Trend falls to 25 %, Momentum falls to 20 %.
Why? When markets are quiet, subtle candle breakouts, doji patterns, and small-range expansions tend to foreshadow the next swing more effectively than raw trend readings. A Price Action score of +3 in this state contributes 3 × 0.55 = +1.65, which can carry the netScore toward +2—even if Trend and Momentum are neutral or only mildly positive.
Because these weight shifts happen only after two consecutive bars confirm a High or Low state (if hysteresis is on), the indicator avoids constantly flipping its emphasis during borderline volatility phases.
---
12. Dominant Category Explained
Within the dashboard, a label such as “Trend Dominant,” “Momentum Dominant,” or “Price Action Dominant” appears when one category’s absolute weighted contribution to netScore is the largest. Concretely:
• Compute each category’s weighted contribution = (raw category score) × (current weight).
• Compare the absolute values of those three contributions.
• The category with the highest absolute value is flagged as Dominant for that bar.
Why It Matters:
• Momentum Dominant: Indicates that the combined force of RSI, Stochastic, and MACD (after weighting) is pushing netScore farther than either Trend or Price Action. In practice, it means that short-term sentiment and speed of change are the primary drivers right now, so traders should watch for continued momentum signals before committing to a trade.
• Trend Dominant: Means ADX, MA slope, and Ichimoku (once weighted) outweigh the other categories. This suggests a strong directional move is in place; trend-following entries or confirming pullbacks are likely to succeed.
• Price Action Dominant: Occurs when breakout/breakdown patterns, Heikin-Ashi candle readings, and range expansions (after weighting) are the most influential. This often happens in calmer markets, where subtle shifts in candle structure can foreshadow bigger moves.
By explicitly calling out which category is carrying the most weight at any moment, the dashboard gives traders immediate insight into why the netScore is tilting toward bullish, bearish, or sideways.
---
13. Oscillator Plot: How to Read It
The “Net Score” oscillator sits below the dashboard and visually displays the smoothed netScore as a line graph. Key features:
1. Value Range: In normal conditions it oscillates roughly between –3 and +3, but extreme confluences can push it outside that range.
2. Horizontal Threshold Lines:
• +2 Line (Bullish threshold)
• 0 Line (Neutral midline)
• –2 Line (Bearish threshold)
3. Zone Coloring:
• Green Background (Bullish Zone): When netScore ≥ +2.
• Red Background (Bearish Zone): When netScore ≤ –2.
• Gray Background (Sideways Zone): When –2 < netScore < +2.
4. Dynamic Line Color:
• The plotted netScore line itself is colored green in a Bullish Zone, red in a Bearish Zone, or gray in a Sideways Zone, creating an immediate visual cue.
Interpretation Tips:
• Crossing Above +2: Signals a strong enough combined trend/momentum/price-action reading to classify as Bullish. Many traders wait for a clear crossing plus a confirmation candle before entering a long position.
• Crossing Below –2: Indicates a strong Bearish signal. Traders may consider short or exit strategies.
• Rising Slope, Even Below +2: If netScore climbs steadily from neutral toward +2, it demonstrates building bullish momentum.
• Divergence: If price makes a higher high but the oscillator fails to reach a new high, it can warn of weakening momentum and a potential reversal.
---
14. Comments and Their Necessity
Every sub-indicator (ADX, MA slope, Ichimoku, RSI, Stochastic, MACD, HH/LL, Heikin-Ashi, Candle Range, BBW, ATR, KCW, Volume) generates a short comment that appears in the detailed dashboard. Examples:
• “Strong bullish trend” or “Strong bearish trend” for ADX/DMI
• “Fast MA above slow MA” or “Fast MA below slow MA” for MA slope
• “RSI above dynamic threshold” or “RSI below dynamic threshold” for RSI
• “MACD histogram positive” or “MACD histogram negative” for MACD Hist
• “Price near highs” or “Price near lows” for HH/LL checks
• “Bullish Heikin Ashi” or “Bearish Heikin Ashi” for HA Doji scoring
• “Large range, trend confirmed” or “Small range, trend contradicted” for Candle Range
Additionally, the top-row comment for each category is:
• Trend: “Highly Bullish,” “Highly Bearish,” or “Neutral Trend.”
• Momentum: “Strong Momentum,” “Weak Momentum,” or “Neutral Momentum.”
• Price Action: “Bullish Action,” “Bearish Action,” or “Neutral Action.”
• Market Activity: “Volatile Market,” “Calm Market,” or “Stable Market.”
Reasons for These Comments:
• Transparency: Shows exactly how each sub-indicator contributed to its category score.
• Education: Helps traders learn why a category is labeled bullish, bearish, or neutral, building intuition over time.
• Customization: If, for example, the RSI comment says “RSI neutral” despite an impending trend shift, a trader might choose to adjust RSI length or thresholds.
In the detailed dashboard, hovering over each comment cell also reveals a tooltip with additional context (e.g., “Fast MA above slow MA” or “Senkou A above Senkou B”), helping traders understand the precise rule behind that +1, 0, or –1 assignment.
---
15. Real-Life Example (Consolidated)
• Instrument & Timeframe: Bitcoin (BTCUSD), 1-hour chart.
• Current Market Activity: BBW and ATR both spike (+1 each), KCW is moderately high (+1), but volume is only neutral (0) → Raw Market Activity Score = +2 → State = High Activity (after two bars, if hysteresis is on).
• Category Weights Applied: Trend = 50 %, Momentum = 35 %, Price Action = 15 %.
• Trend Sub-Scores:
1. ADX = 25 (above threshold 20) with +DI > –DI → +1.
2. Fast MA (20-period) sits above Slow MA (50-period) → +1.
3. Ichimoku: Senkou A > Senkou B → +1.
→ Trend Score = +3.
• Momentum Sub-Scores:
4. RSI = 75 (above its moving average +1 stdev) → +1.
5. MACD histogram = +0.15 → +1.
6. Stochastic %K = 50 (mid-range) → 0.
→ Momentum Score = +2.
• Price Action Sub-Scores:
7. Price is not within 1 % of the 20-period high/low and slope = positive → 0.
8. Heikin-Ashi body is slightly larger than stdev over last 5 bars with haClose > haOpen → +1.
9. Candle range is just above its dynamic upper bound but trend is already captured, so → +1.
→ Price Action Score = +2.
• Calculate netScore (before smoothing):
• Trend contribution = 3 × 0.50 = 1.50
• Momentum contribution = 2 × 0.35 = 0.70
• Price Action contribution = 2 × 0.15 = 0.30
• Raw netScore = 1.50 + 0.70 + 0.30 = 2.50 → Immediately classified as Bullish.
• Oscillator & Dashboard Output:
• The oscillator line crosses above +2 and turns green.
• Dashboard displays:
• Trend Regime “BULLISH,” Trend Score = 3, Comment = “Highly Bullish.”
• Momentum Regime “BULLISH,” Momentum Score = 2, Comment = “Strong Momentum.”
• Price Action Regime “BULLISH,” Price Action Score = 2, Comment = “Bullish Action.”
• Market Activity State “High,” Comment = “Volatile Market.”
• Weights: Trend 50 %, Momentum 35 %, Price Action 15 %.
• Dominant Category: Trend (because 1.50 > 0.70 > 0.30).
• Overall Score: 2.50, posCount = (three +1s in Trend) + (two +1s in Momentum) + (two +1s in Price Action) = 7 bullish signals, negCount = 0.
• Final Zone = “BULLISH.”
• The trader sees that both Trend and Momentum are reinforcing each other under high volatility. They might wait one more candle for confirmation but already have strong evidence to consider a long.
---
• .
---
Disclaimer
This indicator is strictly a technical analysis tool and does not constitute financial advice. All trading involves risk, including potential loss of capital. Past performance is not indicative of future results. Traders should:
• Always backtest the “Market Zone Analyzer ” on their chosen symbols and timeframes before committing real capital.
• Combine this tool with sound risk management, position sizing, and, if possible, fundamental analysis.
• Understand that no indicator is foolproof; always be prepared for unexpected market moves.
Goodluck
-BullByte!
---
