MACD with BGThis is a standard MACD indicator with Background colour and the option to draw the Background colour of the next higher timeframe.Pine Script® Indikatorvon ramsay09Aktualisiert 22309
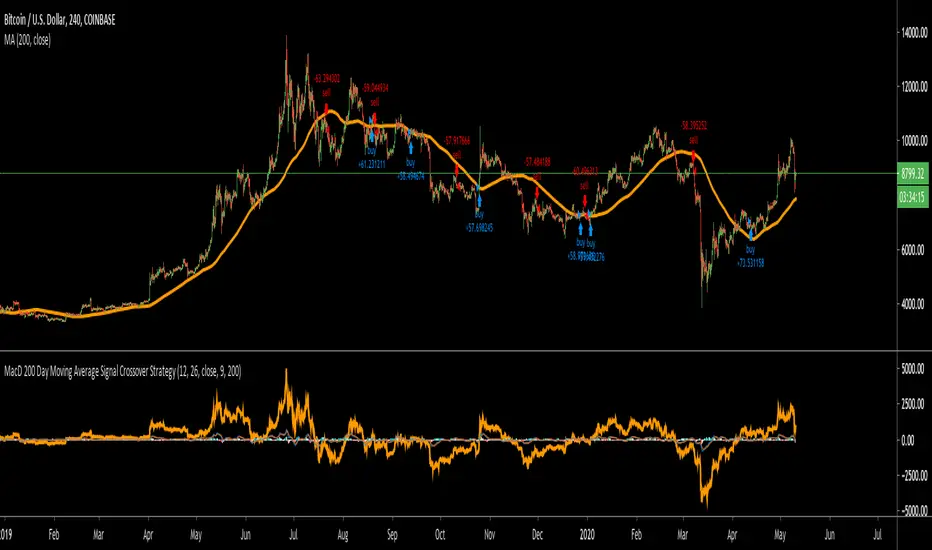
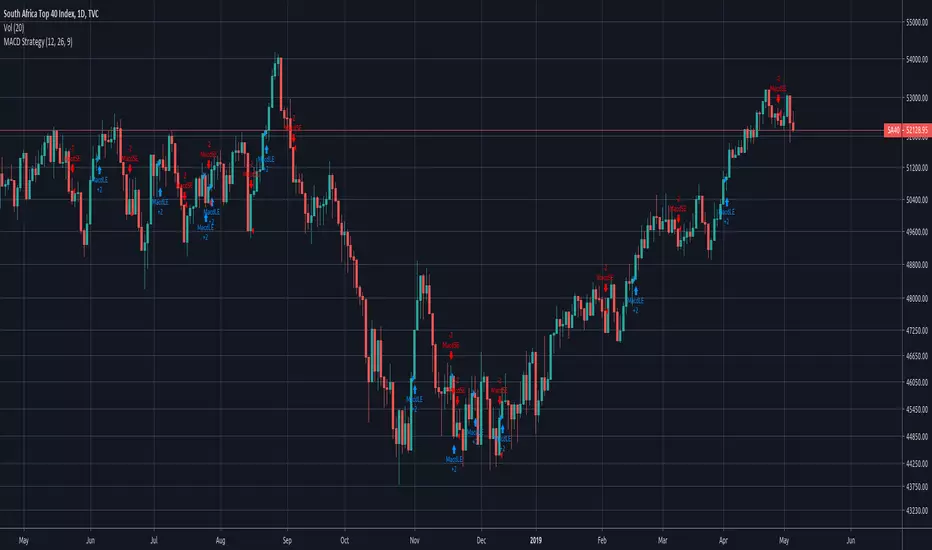
MacD 200 Day Moving Average Signal Crossover StrategyThis works on most time frames, but I noticed the 4 hour for BTCUSD on coinbase seems to work well as an example. The strategy is pretty simple. I was inspired by a youtube video that said to backtest their strategy so I did. Most of the time it doesn't work but sometimes it's pretty good as in the case I showed. Basically, you buy if the MacD crossers over the signal line and the histogram is below 0 and you are above the 200 day moving average. Do the opposite to sell!Pine Script® Strategievon Gentleman-Goat1919404
Minkowski Distance Factor Adaptive Period MACDHi, this script comes from the idea that Ricardo Santos' Minkovski Distance Function is transferred to the period as a factor. Minkowski distance is used as a percentage factor with the help of Relative Strength Index function. Minkowski Distance Function Script : And thus an adaptive MACD was created. This script can give much better results in more optimized larger periods. I leave the decision to determine the periods and weights. I used the weights of 9,12,26 and periods created with multiplied by factor. Regards.Pine Script® Indikatorvon NoldoAktualisiert 33122
Trade Signal Ichimuko, Double Hull MA, Hourly Chart Lookup, MACDPine Script® Strategievon YouDontSeeMe118
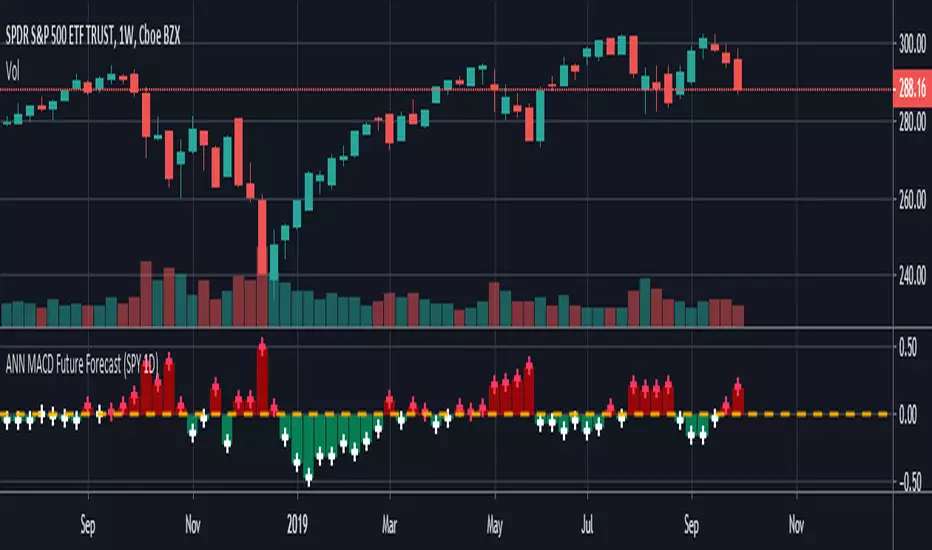
ANN MACD Future Forecast (SPY 1D) NOTE : Deep learning was conducted in a narrow sample set for testing purposes. So this script is Experimental . This system is based on the following article and is inspired by an external program: hackernoon.com None of the artificial neural networks in Tradingview work and are not based on completely correct logic. Unlike others in this system: IMPORTANT NOTE: If the tangent activation function is used, the input data must also have tangent values (compared to the previous values of 1 bar). Inputs were prepared according to this judgment. 1. The tangent function which is the activation function is written correctly. (The tangent function in the article: ActivationFunctionTanh (v) => (1 - exp (-2 * v)) / (1 + exp (-2 * v))) 2. Missing bias parts in the formulas were added. 3. The output function is taken from the next day (historical), so that the next bar can be predicted, which is the truth. 4.The forecast value of the next bar is subtracted from the current bar change and the market direction is determined. 5.When the future forecast and the current close are added together, the resulting data is called seed. The seed carries data both from the present and from yesterday and from the future. 6.And this seed was subjected to the MACD method. Thus, due to exponential averages, more importance will be given to recent developments and The acceleration situations will show us the direction. However, a short position should be taken for crossover and a long position for crossunder . Because the predicted values work in reverse.Even though we use the same period (9,12,26) it is much faster! 7. There is no future code that can cause Repaint. However, the color after closing should be checked. The system is completely correct. However, a very narrow sample was selected. 100 data: Tangent diffs ; volume change, bollinger bands values changes (Upband , Midband , Lowband) and LazyBear's Squeeze Momentum Indicator (SQZMOM_LB) change and the next bar data (historical) price change were put into the deep learning test. IMPORTANT NOTE : The larger the sample set and the more effective dependent variables, the higher the hit rate of the deep learning test! EDIT : This code is open source under the MIT License. If you have any improvements or corrections to suggest, please send me a pull request via the github repository github.com Stay tuned. Best regards! Pine Script® Indikatorvon NoldoAktualisiert 1515608
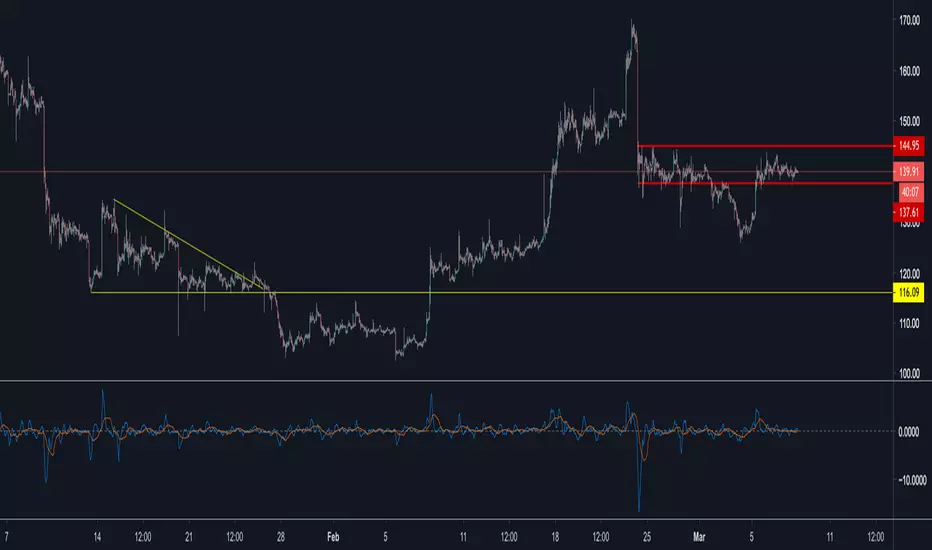
MACD BF 🚀Customised MACD strategy with dynamic stop losses based on ATR. Signals are generated when the delta value becomes positive or negative (when it crosses the zero line) Stop losses are printed on the chart in yellow and orange. They are based on recent average True Range to allow for volatility. INSTRUCTIONS Green background = long Red background = short Yellow dotted line = stop loss placement for long Orange dotted line = stop loss placement for short White background = you have been stopped out, wait patiently for the next signal Pine Script® Strategievon bennef55162
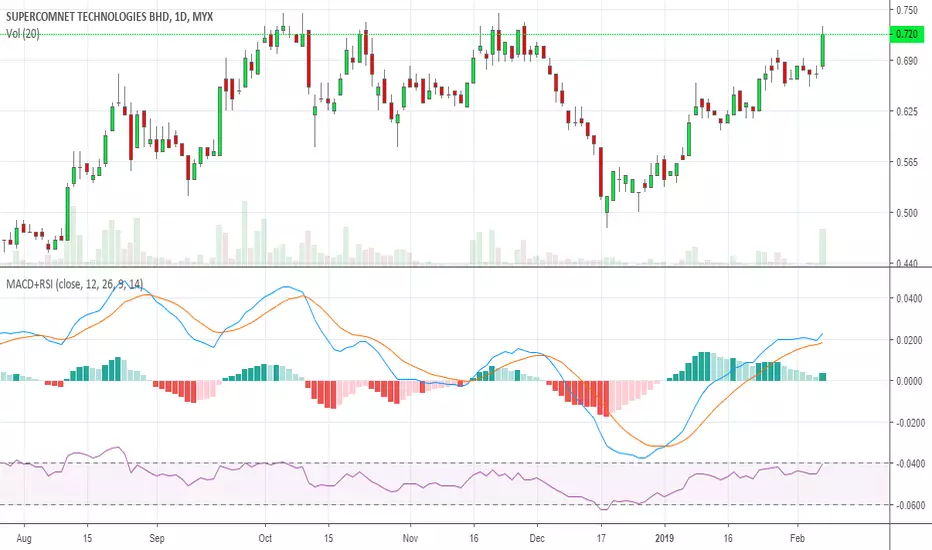
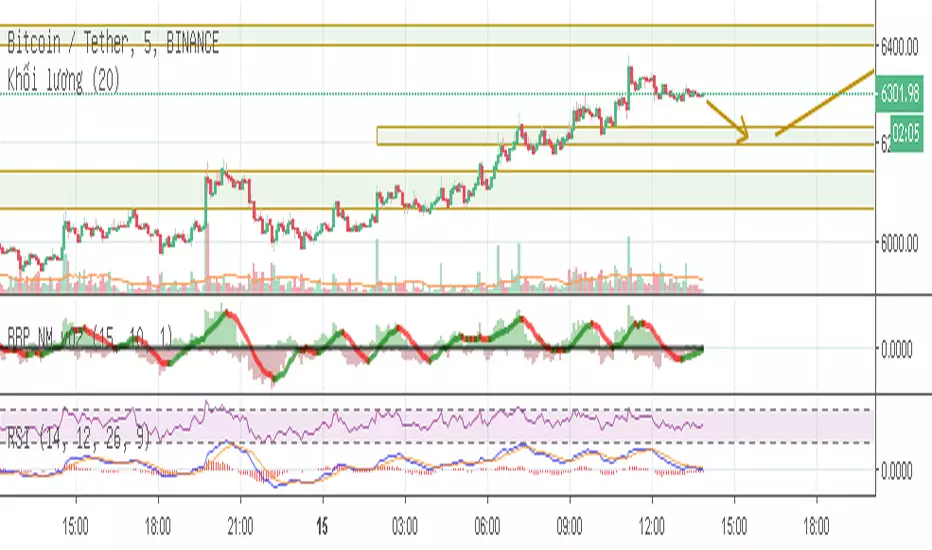
RSI & MACDJust combined the template RSI and MACD scripts from the pine library and it seems to work better in pine version 4 :) ty tradingview!Pine Script® Indikatorvon Biffy1515900
uray MACD margin trade strategysimple margin trading strategy based on MACD i.imgur.comPine Script® Strategievon UrayMeiviar77
Koby's HMA MACDThis my custom MACD based on Hull Moving Average for our SNS group. I will add other features later.Pine Script® Indikatorvon UnknownUnicorn4078706Aktualisiert 1187
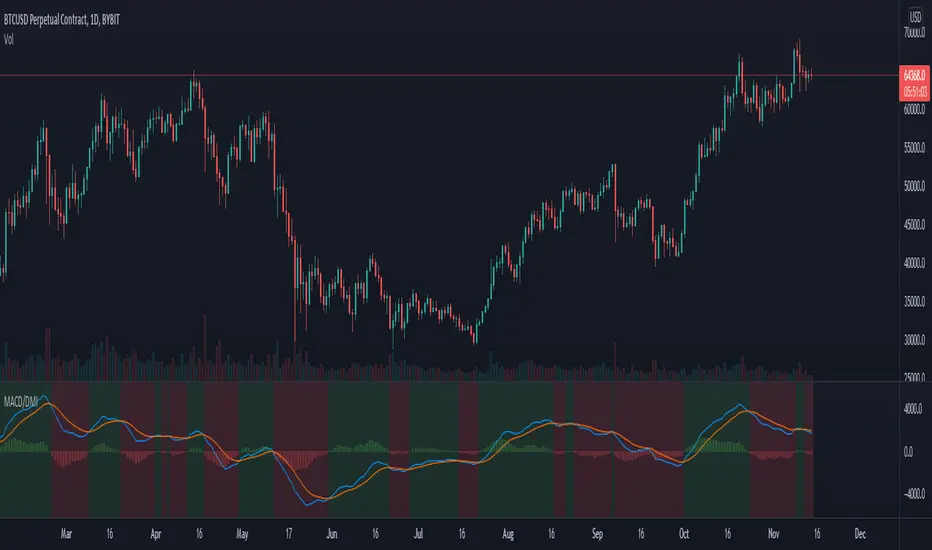
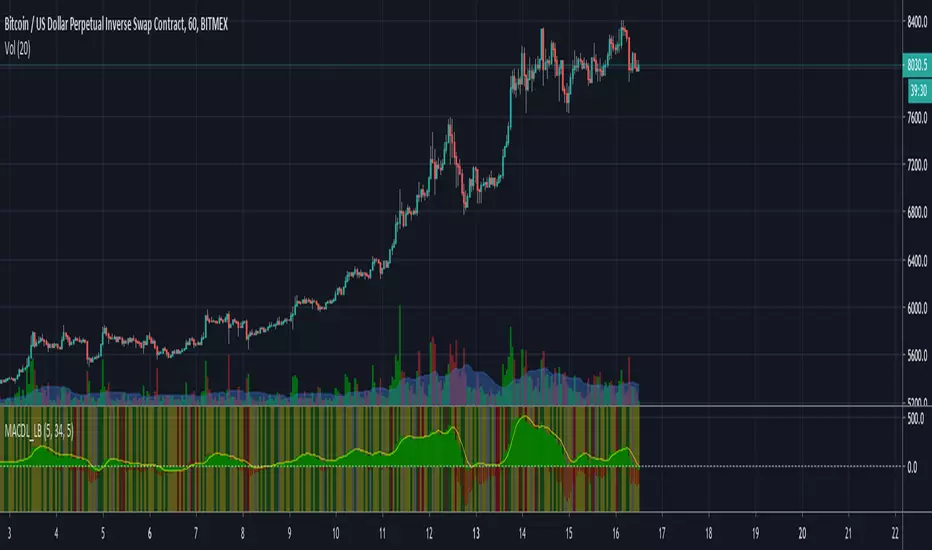
MACD LB MFIThis script includes MACD histogram plus MFI in four states All backgrounds are compared to previous bar in +/- 10% 1. Green (green) + Volume + Range (++) 2. Fading (yellow) - Volume - Range (--) 3. False (gray) - Volume + Range (-+) 4. Crouching (red) + Volume - Range (+-)Pine Script® Indikatorvon nichoga11117
Simple MACD Strategy - CrossoverSimple MACD Crossover Strategy No secret sauce here! Script was requested by userPine Script® Strategievon cgd184
Modified MACD with Zero LineBased on Adam Grimes' 3/10/16 MACD with a Zero LinePine Script® Indikatorvon patrickniddrie1149
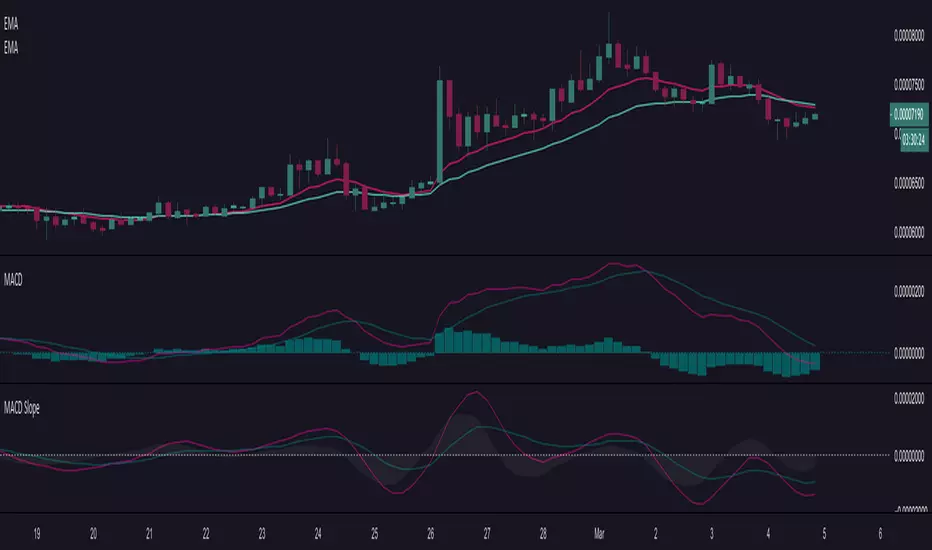
MACD SlopeShows slopes of macd line, signal line and histogram. A negative and rising slope shows improvement within a downtrend. A positive and falling slope shows deterioration within an uptrend. Pine Script® Indikatorvon tmyerskerry88340
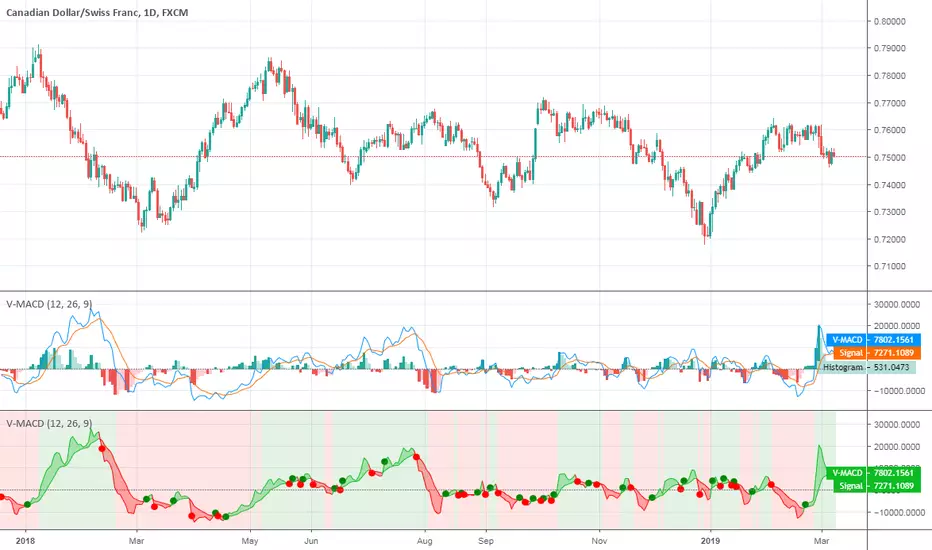
V-MACDHello traders! This is a variation of classical MACD that uses volume instead of price. Like and follow for more cool indicators! Happy Trading! Pine Script® Indikatorvon evergetAktualisiert 354
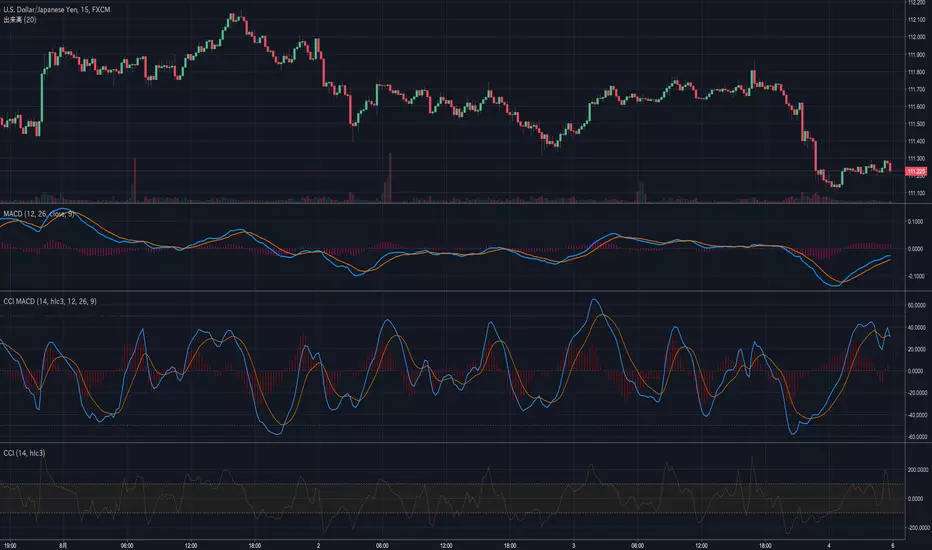
CCI MACDWe usually use closing prices for MACD calculations. However, this indicator is calculated using CCI.Pine Script® Indikatorvon matsu_bitmex11296
MACD with RSI Divergence [BitComRat]Combined MACD with RSI DivergencePine Script® Indikatorvon BatRatAktualisiert 77326
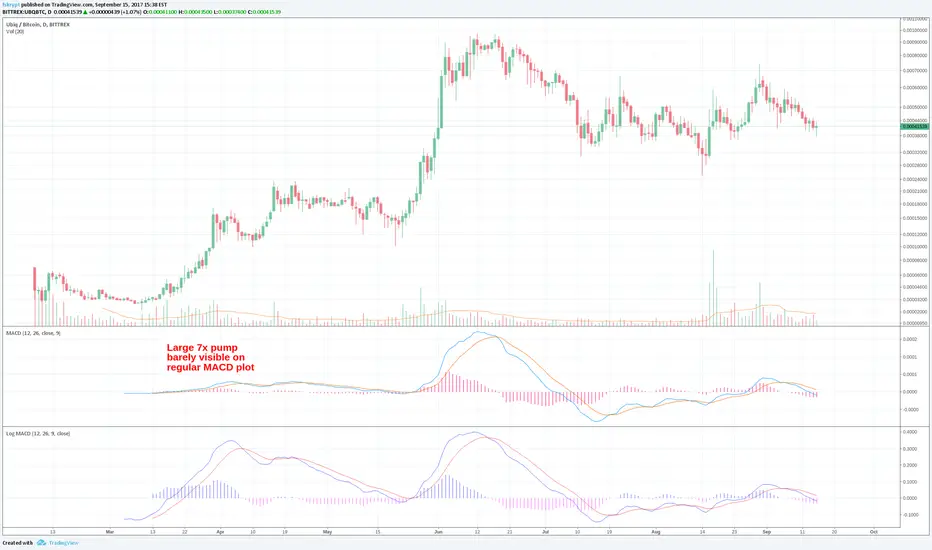
Log-space MACDThis indicator is identical to regular MACD indicator except it is calculated in log space, which is useful for looking at long-term trends.Pine Script® Indikatorvon fskryptAktualisiert 22226
4 Hour MACD (Philip Nel ForexFactory)This is the basic script that shows MACD as described with settings in the thread www.forexfactory.comPine Script® Indikatorvon acolytee11138
Hull MACD with Force Index Backcolorswww.tradingview.com Like many other indicators this tells the past and it will dutifully follow the future price changes whatever they will be. This is an upgrade of the "Hull Moving Average Convergence/Divergence" low lag indicator in my scripts. Added Elder Force Index (background colors) to include effects of Volume. When EFI goes positive the background goes green, when it slopes up (more positive than previous bar) it is darker green. Negative red and slope down darker red. I find it useful in all time frames but I use mostly hour and day. The direction color combined with price action and macd tell whether the volume supports the price movement and the shading (darker green for increasing up volume and darker red for increasing down volume) tells of the degree of support. Since when the EFI is positive and dropping, for example, the price can be dropping with opposite for negative. Dark shading tells where the EFI and possibly the price is headed (at the moment). Light shading says to check more on other indications for likely direction. Changed also the histogram color so it stands out of background and added hlines to make relative volatility and peak height easier to see. Anyway help yourself if any of this code is useful to you, enjoy, happy trading and Keep Smiling!Pine Script® Indikatorvon Tom1trader99445