In den Scripts nach "ma cross" suchen
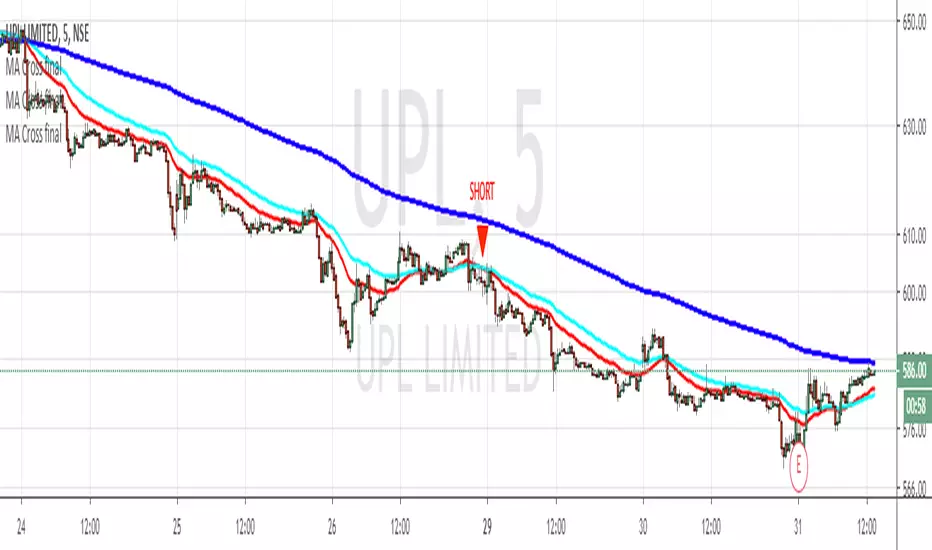


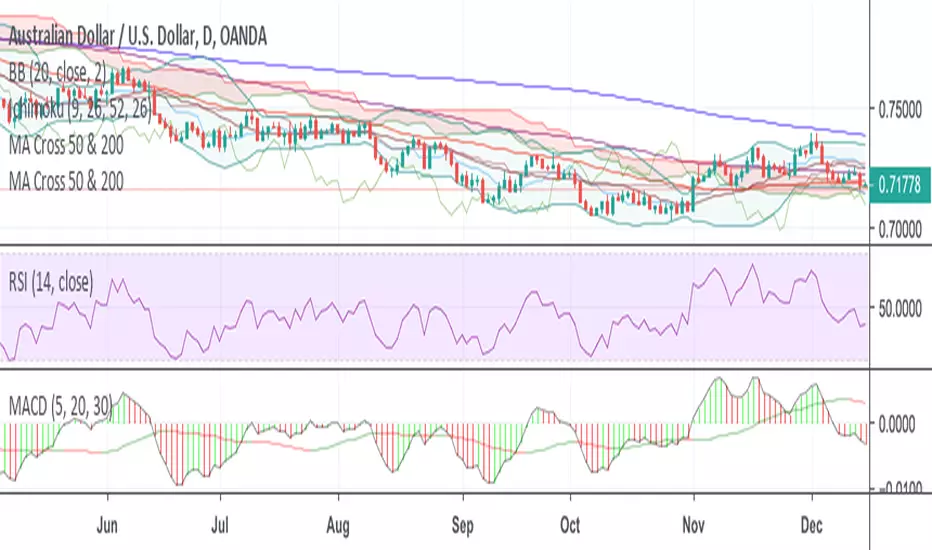
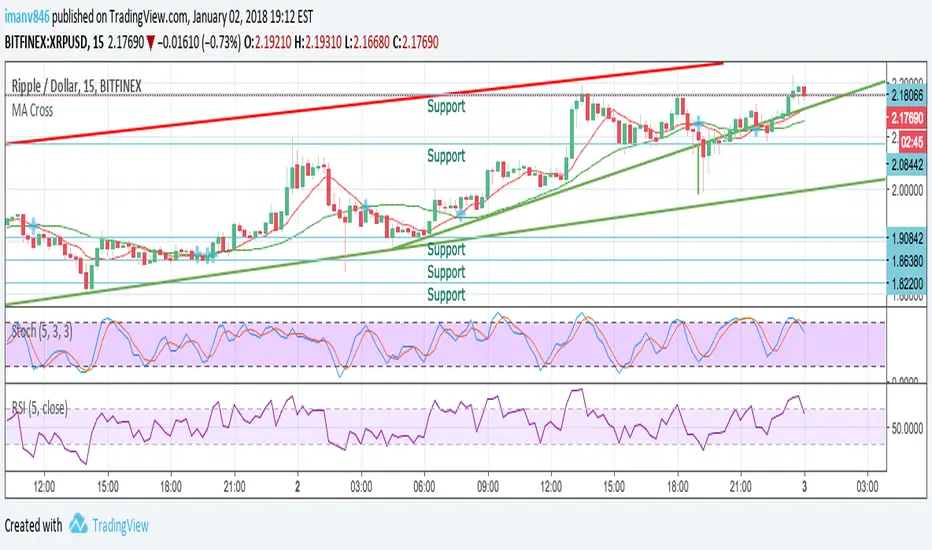
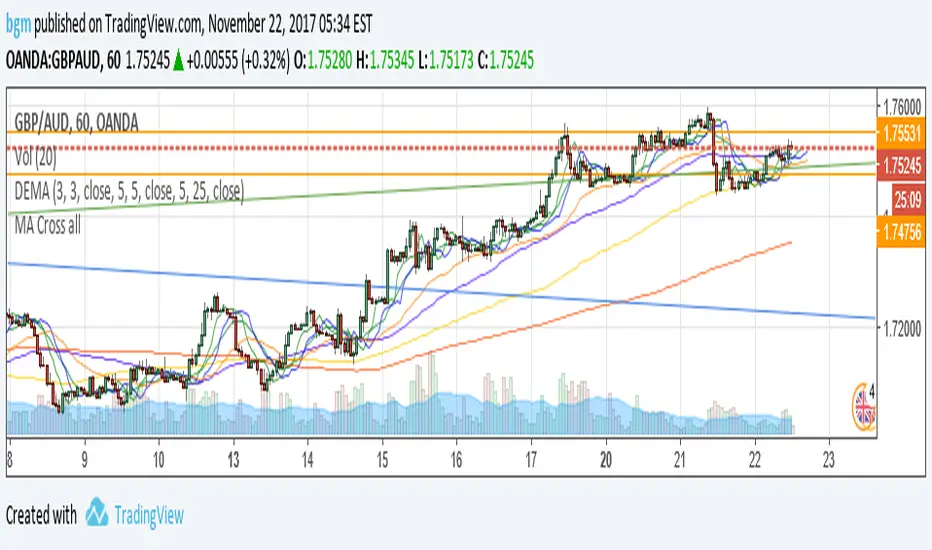
MA Cross 9 & 30 trend analysisvery good fro a simple trend analysis. 9 and 30 did work for me and I want to share.


Advanced custom multi MA signals (EMA/SMA/VWMA/VWAP) Features of Multi Moving Averages
The biggest enemy in trading is "Noise." If you get swayed by minute fluctuations on the chart, you end up missing the forest for the trees.
This indicator (Advanced Custom Multi MA Signals) is not just a simple line. By combining the three core elements of Price, Time, and Volume, it acts as a navigation system that visualizes the market's "true trend." In particular, the ability to analyze 5 moving averages simultaneously across various timeframes is akin to viewing a 3D map of the battlefield.
Understanding Core Concepts
This indicator supports 4 types of moving averages. It is crucial to clearly understand the nature of each tool.
SMA (Simple Moving Average): The most basic average value. Since it produces fewer whipsaws (false signals), it is used as a baseline to judge the "long-term trend."
EMA (Exponential Moving Average): Places more weight on recent prices. It reacts sensitively to market changes, making it advantageous for identifying "entry points."
VWMA (Volume Weighted Moving Average): Incorporates "volume" into the price calculation. It acts as a "false signal filter," weeding out price moves that aren't backed by trading volume.
VWAP (Volume Weighted Average Price): The benchmark price used by institutional investors for daily trading. It is calculated based on the session, regardless of the period settings. It is considered the "lifeline" of day trading.
Indicator Settings Guide
Open the settings window and tune it to fit your trading style.
MA 01 ~ 05 (Moving Average Settings)
MA Type: Select according to your purpose. (Generally, EMA is recommended for short-term analysis, SMA/VWMA for long-term).
Length: Enter the period you wish to analyze (e.g., 20, 60, 120, 200).
Timeframe: This is the core feature. It allows you to overlay moving averages from a higher timeframe (e.g., 4-hour, Daily) onto the chart you are currently viewing (e.g., 15-minute).
Signal Option (Trading Signals)
Golden Cross (GC) / Death Cross (DC): Captures the moment the short-term line breaks through the long-term line. You can run up to 3 strategies simultaneously.
Ribbon Gradient (Trend Visualization)
Represents the gap between two moving averages with color. As the color deepens and the width expands, it indicates a powerful trend; if the width narrows, it suggests a high probability of a trend reversal.
5 Usage Strategies
The highlight of this indicator is the cross strategy utilizing the "Multi-Timeframe (MTF)" feature. Familiarize yourself with the 5 example strategies below and set up your own strategy based on your expertise.
💡 Tip 1. Do not go against the "Major Trend" (The Authority of the Weekly Candle)
Settings: Set MA5 to .
Interpretation: The Weekly 50 line is the "major trend line" managed by institutions and market makers. If the current price is above this line, maintain only a "Buy (Long)" bias; if below, maintain only a "Sell (Short)" bias. Adhering to this rule alone can help you avoid massive losses.
💡 Tip 2. Highly Reliable "Swing Signal" (Daily Golden Cross)
Settings: In Signal 1, configure the Short MA to and the Long MA to .
Interpretation: A Golden Cross where the 4-Hour 50 EMA breaks above the Daily 50 EMA often signifies a major "trend reversal" rather than a temporary rebound. This provides an ideal entry signal for office workers or swing traders who need high reliability.
💡 Tip 3. 4-Hour Candle as the Standard for "Precision Entry"
Situation: When the Daily trend is rising (Bullish alignment).
Strategy: While watching the 15-minute or 1-hour chart, set the indicator's Signal 2 to the cross of and .
Interpretation: When the Daily chart is in an uptrend, a Golden Cross occurring on the 4-Hour chart marks "the point where a correction (pullback) ends and the rise resumes." This is the entry point with the best risk-to-reward ratio.
💡 Tip 4. Filtering Out "Fake Signals" (The Secret of Volume)
Strategy: When creating a cross signal, try using VWMA (Volume Weighted) for the Long MA, even if you use EMA for the Short MA.
Reason: A Golden Cross caused simply by a rise in price can be a trap. However, if it breaks through the heavy VWMA line accompanied by volume, it is strong evidence that "genuine liquidity" has entered.
💡 Tip 5. Remember the "Hierarchy" (Higher Timeframe Priority Rule)
Principle: If a Golden Cross (Buy Signal) appears on the 4-Hour chart, but the Daily chart is in a Death Cross (Sell Signal) state, do not enter.
Interpretation: A signal from a lower timeframe cannot overcome the power of a higher timeframe. The professional approach is to trade with significant volume only when signals align (Sync) in the order of Weekly > Daily > 4-Hour. Keep this indicator's dashboard feature on and always check the status of higher timeframes.
Signal Generation Principle (Operating Mechanism)
Signals are generated when the set short-term moving average and long-term moving average cross each other.
📈 1. Golden Cross (BUY = Buy Signal)
Situation: The moment the short-term MA crosses upward from below the long-term MA.
Principle: It implies that recent buying pressure has broken through the resistance level accumulated over a long period.
📉 2. Death Cross (SELL = Sell Signal)
Situation: The moment the short-term MA crosses downward from above the long-term MA.
Principle: It implies that recent selling pressure has collapsed the long-term support line.
※ If the candles are not displaying correctly or are flickering, please set the indicator's 'Visual order' to 'Bring to front' as shown in the image below.
Investment Caution and Disclaimer
Before using this indicator for actual trading, please strictly read the contents below.
① Auxiliary indicators are a "Compass," not a "Book of Prophecy."
This indicator is merely a tool that mathematically calculates and visualizes past price data. A "magic indicator" that predicts future price fluctuations 100% accurately or guarantees profit does not exist. The signals provided are for reference only and must never be the sole basis for entry/exit decisions.
② The responsibility for all investments lies with "Yourself."
Financial investment (Cryptocurrencies, Stocks, Futures, etc.) involves high volatility and is a risky activity that can result in the loss of some or all of the principal. The final responsibility for all trading results (profits and losses) incurred by utilizing this indicator lies entirely with the investor. The distributor and developer accept no legal responsibility for investment results under any circumstances.
③ Past data does not guarantee the future.
Even a Golden Cross that fit perfectly in backtesting or past charts may operate differently in tomorrow's market situation (News, Macroeconomics, Unexpected Variables, etc.). Do not rely solely on technical analysis; you must conduct fundamental analysis and risk management in parallel.
④ Risk management is the top priority.
No matter how promising a signal appears, "all-in trading" (investing all assets in a single trade) is a shortcut to bankruptcy. More important than the indicator itself is adhering to the principles of strict scaling in (split buying) and Stop-Loss.

ETHThe Indicator is using the combination of below indicators:
Relative Strength Index (RSI): A momentum oscillator used to identify overbought (above 70) or oversold (below 30) conditions, which can signal potential price reversals.
Moving Averages (MA & EMA): These smooth out price data to help identify the direction of the overall trend. Crossovers between different period MAs (e.g., a short-term MA crossing above a long-term MA) can generate buy or sell signals.
Moving Average Convergence Divergence (MACD): A trend-following momentum indicator that shows the relationship between two moving averages. A bullish crossover (MACD line above signal line) suggests upward momentum, while a bearish crossover (MACD line below signal line) indicates downward momentum.
Bollinger Bands: This volatility indicator consists of a middle band (moving average) and two outer bands based on standard deviation. Price touching the upper band may signal overbought conditions, while touching the lower band may signal oversold conditions or a potential bounce.
Volume Indicators (e.g., On-Balance Volume - OBV): Volume confirms the strength of a price movement. A price increase with high volume suggests strong buying pressure, validating the trend.
Ethereum Long/Short Ratio: This sentiment indicator compares the number of traders holding long positions versus short positions. A high ratio might indicate excessive bullish sentiment, potentially preceding a market correction.

Stochastic X-Score Signal📊 Stochastic X-Score Signal
This indicator is designed to analyze market momentum, direction, and strength in a single tool.
It combines Z-Score, Stochastic, Trend Filter, ADX/DI, and Volume to filter out high-quality trading signals.
🎯 Key Highlights
Measures price deviation using Z-Score
Converts data into Stochastic (0–100) to identify Overbought / Oversold
Uses HMA + ALMA to separate short-term momentum from long-term trend
Offers 4 signal sources, adjustable to different trading styles
Includes a Trend Filter to distinguish with-trend vs against-trend signals
Confirms real market strength with ADX/DI and Volume Gauge
⚙️ Signal System
🔺 BUY / 🔻 SELL from Reversal, Z-Score, ALMA, or MA Cross
With-trend signals = darker colors (stronger confirmation)
Against-trend signals = lighter colors (higher risk)
📊 Signal Quality Confirmation
ADX > 25 = strong trend
DI+ / DI- defines trend direction
Volume Candles clearly show buy vs sell pressure
🎨 Visualization
On-chart signals (Triangles + Bar Colors)
Indicator panel: Z-Score Histogram, Oscillator, ALMA, OB/OS zones
Gauge table for instant trend strength reading
🔔 Alerts Included
Bullish / Bearish (with-trend & against-trend)
MA Golden / Death Cross
Strong / Weak Trend alerts
High Buy / Sell Volume alerts
💡 Best For
Trend & Pullback traders
Traders who prefer one powerful indicator instead of many
Those who need signals with full market context
⚠️ This indicator is a market analysis tool and does not guarantee profits.
Always apply proper risk management when trading.
💬 Interested in our Indicator? Feel free to contact us via INBOX
📱 Facebook Page: Overdue Logic Indicator
www.facebook.com

MA RSI MACD Signal SuiteThis Pine Script™ is designed for use in Trading View and generates trading signals based on moving average (MA) crossovers, RSI (Relative Strength Index) signals, and MACD (Moving Average Convergence Divergence) indicators. It provides visual markers on the chart and can be configured to suit various trading strategies.
1. Indicator Overview
The indicator includes signals for:
Moving Averages (MA): It tracks crossovers between different types of moving averages.
RSI: Signals based on RSI crossing certain levels or its signal line.
MACD: Buy and sell signals generated by MACD crossovers.
2. Inputs and Customization
Moving Averages (MAs):
You can customize up to 6 moving averages with different types, lengths, and colors.
MA Type: Choose from different types of moving averages:
SMA (Simple Moving Average)
EMA (Exponential Moving Average)
HMA (Hull Moving Average)
SMMA (RMA) (Smoothed Moving Average)
WMA (Weighted Moving Average)
VWMA (Volume Weighted Moving Average)
T3, DEMA, TEMA
Source: Select the price to base the MA on (e.g., close, open, high, low).
Length: Define the number of periods for each moving average.
Examples:
MA1: Exponential Moving Average (EMA) with a period of 9
MA2: Exponential Moving Average (EMA) with a period of 21
RSI Settings:
RSI is calculated based on a user-defined period and is used to identify potential overbought or oversold conditions.
RSI Length: Lookback period for RSI (default 14).
Overbought Level: Defines the overbought threshold for RSI (default 70).
Oversold Level: Defines the oversold threshold for RSI (default 30).
You can also adjust the smoothing for the RSI signal line and customize when to trigger buy and sell signals based on the RSI crossing these levels.
MACD Settings:
MACD is used for identifying changes in momentum and trends.
Fast Length: The period for the fast moving average (default 12).
Slow Length: The period for the slow moving average (default 26).
Signal Length: The period for the signal line (default 9).
Smoothing Method: Choose between SMA or EMA for both the MACD and the signal line.
3. Signal Logic
Moving Average (MA) Crossover Signals:
Crossover: A bullish signal is generated when a fast MA crosses above a slow MA.
Crossunder: A bearish signal is generated when a fast MA crosses below a slow MA.
The crossovers are plotted with distinct colors, and the chart will display markers for these crossover events.
RSI Signals:
Oversold Crossover: A bullish signal when RSI crosses over its signal line below the oversold level (30).
Overbought Crossunder: A bearish signal when RSI crosses under its signal line above the overbought level (70).
RSI signals are divided into:
Aggressive (Early) Entries: Signals when RSI is crossing the oversold/overbought levels.
Conservative Entries: Signals when RSI confirms a reversal after crossing these levels.
MACD Signals:
Buy Signal: Generated when the MACD line crosses above the signal line (bullish crossover).
Sell Signal: Generated when the MACD line crosses below the signal line (bearish crossunder).
Additionally, the MACD histogram is used to identify momentum shifts:
Rising to Falling Histogram: Alerts when the MACD histogram switches from rising to falling.
Falling to Rising Histogram: Alerts when the MACD histogram switches from falling to rising.
4. Visuals and Alerts
Plotting:
The script plots the following on the price chart:
Moving Averages (MA): The selected MAs are plotted as lines.
Buy/Sell Shapes: Triangular markers are displayed for buy and sell signals generated by RSI and MACD.
Crossover and Crossunder Markers: Crosses are shown when two MAs crossover or crossunder.
Alerts:
Alerts can be configured based on the following conditions:
RSI Signals: Alerts for oversold or overbought crossover and crossunder events.
MACD Signals: Alerts for MACD line crossovers or momentum shifts in the MACD histogram.
Alerts are triggered when specific conditions are met, such as:
RSI crosses over or under the oversold/overbought levels.
MACD crosses the signal line.
Changes in the MACD histogram.
5. Example Usage
1. Trend Reversal Setup:
Buy Signal: Use the RSI oversold crossover and MACD bullish crossover to identify potential entry points in a downtrend.
Sell Signal: Use the RSI overbought crossunder and MACD bearish crossunder to identify potential exit points or short entries in an uptrend.
2. Momentum Strategy:
Combine MACD and RSI signals to identify the strength of a trend. Use MACD histogram analysis and RSI levels for confirmation.
3. Moving Average Crossover Strategy:
Focus on specific MA crossovers, such as the 9-period EMA crossing above the 21-period EMA, for buy signals. When a longer-term MA (e.g., 50-period) crosses a shorter-term MA, it may indicate a strong trend change.
6. Alerts Conditions
The script includes several alert conditions, which can be triggered and customized based on the user’s preferences:
RSI Oversold Crossover: Alerts when RSI crosses over the signal line below the oversold level (30).
RSI Overbought Crossunder: Alerts when RSI crosses under the signal line above the overbought level (70).
MACD Buy/Sell Crossover: Alerts when the MACD line crosses the signal line for a buy or sell signal.
7. Conclusion
This script is highly customizable and can be adjusted to suit different trading strategies. By combining MAs, RSI, and MACD, traders can gain multiple perspectives on the market, enhancing their ability to identify potential buy and sell opportunities.

[GrandAlgo] Moving Averages Cross LevelsMoving Averages Cross Levels
Many traders watch for moving average crossovers – such as the golden cross (50 MA crossing above 200 MA) or death cross – as signals of changing trends. However, once a crossover happens, the exact price level where it occurred often fades from view, even though that level can be an important reference point. Moving Averages Cross Levels is an indicator that keeps those crossover price levels visible on your chart, helping you track where momentum shifts occurred and how price behaves relative to those key levels.
This tool plots horizontal line segments at the price where each pair of selected moving averages crossed within a recent window of bars. Each level is labeled with the moving average lengths (for example, “21×50” for a 21/50 MA cross) and is color-coded – green for bullish crossovers (short-term MA crossing above long-term MA) and red for bearish crossunders (short-term crossing below). By visualizing these crossover levels, you can quickly identify past trend change points and use them as potential support/resistance or decision levels in your trading. Importantly, this indicator is non-repainting – once a crossover level is plotted, it remains fixed at the historical price where the cross occurred, allowing you to continually monitor that level going forward. (As with any moving average-based analysis, crossover signals are lagging, so use these levels in conjunction with other tools for confirmation.)
Key Features:
✅ Multiple Moving Averages: Track up to 7 different MAs (e.g. 5, 8, 21, 50, 64, 83, 200 by default) simultaneously. You can enable/disable each MA and set its length, allowing flexible combinations of short-term and long-term averages.
✅ Selectable MA Type: Each average can be calculated as a Simple (SMA), Exponential (EMA), Volume-Weighted (VWMA), or Smoothed (RMA) moving average, giving you flexibility to match your preferred method.
✅ Auto Crossover Detection: The script automatically detects all crosses between any enabled MA pairs, so you don’t have to specify pairs manually. Whether it’s a fast cross (5×8) or a long-term cross (50×200), every crossover within the lookback period will be identified and marked.
✅ Horizontal Level Markers: For each detected crossover, a horizontal line segment is drawn at the exact price where the crossover occurred. This makes it easy to glance at your chart and see precisely where two moving averages intersected in the recent past.
✅ Labeled and Color-Coded: Each crossover line is labeled with the two MA lengths that crossed (e.g. “50×200”) for clear identification. Colors indicate crossover direction – by default green for bullish (positive) crossovers and red for bearish (negative) crossovers – so you can tell at a glance which way the trend shifted. (You can customize these colors in the settings.)
✅ Adjustable Lookback: A “Crosses with X candles” input lets you control how far back the script looks for crossovers to plot. This prevents your chart from getting cluttered with too many old levels – for example, set X = 100 to show crossovers from roughly the last 100 bars. Older crossover lines beyond this lookback window will automatically clear off the chart.
✅ Optional MA Plots: You can toggle the display of each moving average line on the chart. This means you can either view just the crossover levels alone for a clean look, or also overlay the MA curves themselves for additional context (to see how price and MAs were moving around the crossover).
✅ No Repainting or Hindsight Bias: Once a crossover level is plotted, it stays at that fixed price. The indicator doesn’t move levels around after the fact – each line is a true historical event marker. This allows you to backtest visually: see how price acted after the crossover by observing if it retested or respected that level later.
How It Works:
1️⃣ Add to Chart & Configure – Simply add the indicator to your chart. In the settings, choose which moving averages you want to include and set their lengths. For example, you might enable 21, 50, 200 to focus on medium and long-term crosses (including the golden cross), or turn on shorter MAs like 5 and 8 for quick momentum shifts. Adjust the lookback (number of bars to scan for crosses) if needed.
2️⃣ Visualization – The script continuously checks the latest X bars for any points where one MA crossed above or below another. Whenever a crossover is found, it calculates the exact price level at which the two moving averages intersected. On the last bar of your chart, it will draw a horizontal line segment extending from the crossover bar to the current bar at that price level, and place a label to the right of the line with the MA lengths. Green lines/labels signify bullish crossovers (where the first MA crossed above the second), and red lines indicate bearish crossunders.
3️⃣ On Your Chart – You will see these labeled levels aligned with the price scale. For example, if a 50 MA crossed above a 200 MA (bullish) 50 bars ago at price $100, there will be a green “50×200” line at $100 extending to the present, showing you exactly where that golden cross happened. You might notice price pulling back near that level and bouncing, or if price falls back through it, it could signal a failed crossover. The indicator updates in real-time: if a new crossover happens on the latest bar, a new line and label will instantly appear, and if any old cross moves out of the lookback range, its line is removed to keep the chart focused.
4️⃣ Customization – You can fine-tune the appearance: toggle any MA’s visibility, change line colors or label styles, and modify the lookback length to suit different timeframes. For instance, on a 1-hour chart you might use a lookback of 500 bars to see a few weeks of cross history, whereas on a daily chart 100 bars (about 4–5 months) may be sufficient. Adjust these settings based on how many crossover levels you find useful to display.
Ideal for Traders Who:
Use MA Crossovers in Strategy: If your strategy involves moving average crossovers (for trend confirmation or entry/exit signals), this indicator provides an extra layer of insight by keeping the price of those crossover events in sight. For example, trend-followers can watch if price stays above a bullish crossover level as a sign of trend strength, or falls below it as a sign of weakness.
Identify Support/Resistance from MA Events: Crossover levels often coincide with pivot points in market sentiment. A crossover can act like a regime change – the level where it happened may turn into support or resistance. This tool helps you mark those potential S/R levels automatically. Rather than manually noting where a golden cross occurred, you’ll have it highlighted, which can be useful for setting stop-losses (e.g. below the crossover price in a bullish scenario) or profit targets.
Track Multiple Averages at Once: Instead of focusing on just one pair of moving averages, you might be interested in the interaction of several (short, medium, and long-term trends). This indicator caters to that by plotting all relevant crossovers among your chosen MAs. It’s great for multi-timeframe thinkers as well – e.g. you could apply it on a higher timeframe chart to mark major cross levels, then drill down to lower timeframes knowing those key prices.
Value Clean Visualization: There are no flashing signals or arrows – just simple lines and labels that enhance your chart’s storytelling. It’s ideal if you prefer to make trading decisions based on understanding price interaction with technical levels rather than following automatic trade calls. Moving Averages Cross Levels gives you information to act on, without imposing any bias or strategy – you interpret the crossover levels in the context of your own trading system.

MA Dashboard (NAPC Histogram Table) MADashV1MA Dashboard (MAPC Histogram Table) MADashV1 - User Guide
1. Introduction & Purpose
The "MA Dashboard (MADashV1)" indicator is a tool for TradingView designed to give you a quick, comprehensive overview of how the current price relates to multiple Moving Averages (MAs). It displays key information in a convenient table and provides a visual histogram in a separate pane below your main price chart.
Its main goals are:
To monitor up to six different MAs simultaneously without cluttering your main chart.
To instantly see if the price is currently above or below each MA ("Status").
To show the actual value of each MA ("MA$").
To identify the price level of the most recent price crossover for each MA within a specific lookback period (" TSX:XMA ").
To quantify the exact difference between the current price and each MA ("MAPC" - Moving Average Price Crossover/Difference).
To visualize the MAPC of one selected MA as a histogram for quick momentum assessment.
To optionally plot the historical MAPC values as lines in the histogram pane.
2. Key Features
Configurable MAs: Set up to 6 independent Moving Averages. For each, you can choose:
Type (SMA, EMA, WMA, RMA)
Length (Period)
Source (Close, Open, High, Low, etc.)
Color (Used for identification in the table)
Informative Table: A dashboard summarizing all configured MAs, showing:
MA Number (1-6)
Type & Length settings
Current MA Value (MA$)
Price Status relative to MA (Bullish/Bearish/Neutral)
Last Crossover Price ( TSX:XMA ) with color-coded background (Green=Up, Red=Down)
Price Difference from MA (MAPC) with color-coded text (Green=Positive, Red=Negative)
MAPC Histogram: Plotted in a separate pane, showing the difference between the price and one user-selected MA.
Green bars indicate the price is above the selected MA.
Red bars indicate the price is below the selected MA.
The height of the bars shows the magnitude of the difference.
Optional MAPC Lines: Plot the historical MAPC values for any of the 6 MAs as lines directly on the histogram pane for comparison.
Customizable Appearance: Control the table's position, colors (background, text, header, border), border size, and text size.
Flexible Formatting: Adjust the number of decimal places displayed for price values and MAPC values.
Crossover Lookback: Define how many bars back the indicator should look for the last price crossover ( TSX:XMA ).
3. How It Works (Simplified)
MA Calculation: The indicator calculates the value of each enabled Moving Average based on your chosen settings (Type, Length, Source).
Status Check: For each MA, it compares the current price (from the MA's Source setting) to the MA's calculated value. If the price is higher, the status is "Bullish"; if lower, "Bearish"; if equal, "Neutral".
MAPC Calculation: It simply subtracts the MA's value from the current price (Price - MA Value). This gives the raw price difference, shown in the MAPC column.
TSX:XMA Calculation: It looks back over the number of bars you specified ("Crossover Lookback Bars"). It finds the most recent instance where the price crossed either above or below the MA within that lookback period. It then records the price at which that specific crossover occurred and displays it in the TSX:XMA column. The background color indicates if the last cross within the lookback was upwards (green) or downwards (red). If no cross occurred within the lookback, it shows "N/A".
Histogram: It takes the MAPC value (Price - MA Value) calculated for the single MA you selected in the "Histogram Source MA" setting and plots it as a bar for each candle.
4. Indicator Components
Histogram Pane: This appears below your main price chart.
Histogram Bars: Visual representation of the MAPC for the selected MA.
Zero Line: A horizontal line indicating where the price is exactly equal to the selected MA.
(Optional) MAPC Lines: Lines showing the historical MAPC values for any MAs you choose to plot.
Information Table: Displayed on top of the Histogram Pane (or wherever you position it). This is the main dashboard showing the data for all enabled MAs.
5. Configuration Settings (Inputs)
When you add the indicator to your chart, you'll see these settings:
General Settings:
Show Info Table: Turn the table display on or off.
Table Horizontal/Vertical Position: Choose where the table appears (Top/Middle/Bottom, Left/Center/Right).
Table BG Color, Table Text Color, Table Header Color: Customize the table's colors.
Table Border Size, Table Border Color: Adjust the table's border.
Text Size: Change the font size within the table.
Formatting:
Price Decimals: Set how many decimal places to show for MA values (MA$) and crossover prices ( TSX:XMA ). "Default" uses the chart's setting.
MAPC Decimals: Set how many decimal places to show for the MAPC column values.
Crossover Settings:
Crossover ( TSX:XMA ) Lookback Bars: How many past bars to check for the last price/MA crossover. A smaller number focuses on recent crosses.
Histogram Settings:
Show Histogram Pane: Turn the entire histogram pane (including bars and lines) on or off.
Histogram Source MA: Crucial setting! Select which MA (MA1 to MA6) will be used to generate the histogram bars.
Histogram Positive/Negative Color: Choose the colors for the histogram bars when the price is above (positive) or below (negative) the selected MA.
Plot MAPC Line 1 to Plot MAPC Line 6: Check these boxes to draw the historical MAPC value for the corresponding MA as a line on the histogram pane.
MA 1 to MA 6 Settings:
Enable MA X: Turn each specific MA on or off. If off, it won't be calculated or shown in the table.
Type: Select the calculation type (SMA, EMA, etc.).
Length: Set the period for the MA.
Source: Choose the price data used for the MA calculation (Close, Open, High, Low, hl2, etc.).
Color: Select a color for this MA. This color is used as the background for the MA number in the first column of the table for easy identification.
Style, Width: These primarily affect how the MA would look if plotted on the main chart (which this indicator doesn't do by default), but the Width setting is not used in the table or histogram pane.
6. How to Interpret the Output
Table:
MA, Type, Len: Reminders of your settings for each row.
MA$: The current calculated value of that Moving Average.
Status: Quickly see if the price is currently bullish (above) or bearish (below) relative to that specific MA. Look for confluence (multiple MAs showing the same status). Text color matches MAPC (Green=Bullish, Red=Bearish).
TSX:XMA : Shows the price level of the last crossover within your lookback period. The background color tells you the direction of that cross (Green = Price crossed UP, Red = Price crossed DOWN). Useful for identifying potential support/resistance levels based on recent crosses. "N/A" means no cross occurred within the lookback.
MAPC: Shows the exact price difference between the source price and the MA. A large positive number means the price is significantly above the MA; a large negative number means it's significantly below. The text color indicates the direction (Green = Price > MA, Red = Price < MA). Useful for gauging the strength of deviation from the MA.
Histogram:
Focus on the MA selected in Histogram Source MA.
Bars above Zero: Price is above the selected MA (Bullish). Taller bars mean a larger difference.
Bars below Zero: Price is below the selected MA (Bearish). Longer bars (downwards) mean a larger difference.
Crossing the Zero Line: Indicates the price is crossing the selected MA.
Trend/Momentum: Observe if the histogram bars are generally staying positive or negative, and if their height/length is increasing or decreasing, which can indicate strengthening or weakening momentum relative to that MA.
MAPC Lines (if enabled):
Compare the lines to each other and the zero line. See how the price difference for different MAs has evolved over time. For example, you could plot a short-term MAPC line and a long-term MAPC line to see how they diverge or converge.
7. Potential Use Cases
Trend Confirmation: Check if the price is consistently above (bullish) or below (bearish) multiple MAs according to the "Status" column.
Momentum Gauge: Use the Histogram height/depth or the MAPC values to see how far the price is deviating from key MAs. Increasing deviation might suggest strong momentum, while decreasing deviation might suggest consolidation or reversal potential.
Crossover Signals: Use the " TSX:XMA " column's background color to quickly spot recent crossovers within your defined lookback. Note the price level ( TSX:XMA value) where it happened.
Dynamic Support/Resistance: The current "MA$" values act as potential dynamic support (if price is above) or resistance (if price is below). The " TSX:XMA " price shows where recent interactions occurred.
Comparing MA Relationships: Enable MAPC lines for different MAs (e.g., a fast MA and a slow MA) to visualize how their distance from the price changes relative to each other.
8. Important Notes
This indicator plots in a separate pane (overlay=false), not directly on your price chart.
The MA lines themselves are not plotted on the main chart by default, although the plotting code exists internally. The focus is on the table and histogram data.
MAPC shows the absolute price difference, not a percentage difference.
The usefulness of the " TSX:XMA " column depends heavily on the "Crossover Lookback Bars" setting.
This guide should help you understand and effectively use the MA Dashboard (MADashV1) indicator. Remember to experiment with the settings to tailor it to your specific trading style and the assets you trade.
