Average High-Low Range + IBS Reversal Strategy█ STRATEGY DESCRIPTION
The "Average High-Low Range + IBS Reversal Strategy" is a mean-reversion strategy designed to identify potential buying opportunities when the price deviates significantly from its average high-low range and the Internal Bar Strength (IBS) indicates oversold conditions. It enters a long position when specific conditions are met and exits when the price shows strength by exceeding the previous bar's high. This strategy is suitable for use on various timeframes.
█ WHAT IS THE AVERAGE HIGH-LOW RANGE?
The Average High-Low Range is calculated as the Simple Moving Average (SMA) of the difference between the high and low prices over a specified period. It helps identify periods of increased volatility and potential reversal points.
█ WHAT IS INTERNAL BAR STRENGTH (IBS)?
Internal Bar Strength (IBS) is a measure of where the closing price is relative to the high and low of the bar. It is calculated as:
IBS = (Close - Low) / (High - Low)
A low IBS value (e.g., below 0.2) indicates that the close is near the low of the bar, suggesting oversold conditions.
█ SIGNAL GENERATION
1. LONG ENTRY
A Buy Signal is triggered when:
The close price has been below the buy threshold (calculated as `upper - (2.5 * hl_avg)`) for a specified number of consecutive bars (`bars_below_threshold`).
The IBS value is below the specified buy threshold (`ibs_buy_treshold`).
The signal occurs within the specified time window (between `Start Time` and `End Time`).
2. EXIT CONDITION
A Sell Signal is generated when the current closing price exceeds the high of the previous bar (`close > high `). This indicates that the price has shown strength, potentially confirming the reversal and prompting the strategy to exit the position.
█ ADDITIONAL SETTINGS
Length: The lookback period for calculating the average high-low range. Default is 20.
Bars Below Threshold: The number of consecutive bars the price must remain below the buy threshold to trigger a Buy Signal. Default is 2.
IBS Buy Threshold: The IBS value below which a Buy Signal is triggered. Default is 0.2.
Start Time and End Time: The time window during which the strategy is allowed to execute trades.
█ PERFORMANCE OVERVIEW
This strategy is designed for mean-reverting markets and performs best when the price frequently deviates from its average high-low range.
It is sensitive to oversold conditions, as indicated by the IBS, which helps to identify potential reversals.
Backtesting results should be analyzed to optimize the Length, Bars Below Threshold, and IBS Buy Threshold parameters for specific instruments.
In den Scripts nach "low" suchen

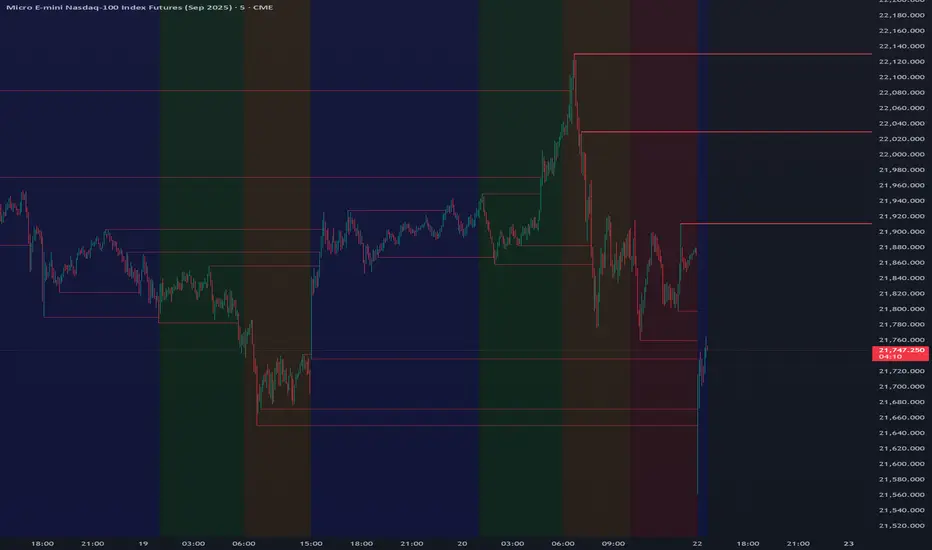
Daily High/Low Levels with mitigationThis Pine Script script defines a TradingView indicator named "Daily High/Low Levels" designed to track and display the daily high and low levels of a trading session, with added functionality for marking levels as mitigated when certain conditions are met. Here's a breakdown of its functionality:
Key Features
Session Start Time: The script allows you to specify a custom session start time in 24-hour format. This ensures the levels align with your trading session preferences.
Daily Highs and Lows:
Tracks the high and low levels for each session.
Retains the highs and lows for a configurable number of previous days.
Visualization:
Creates horizontal lines for each session's high and low levels.
Supports customization of line colors and styles.
Mitigation Tracking:
Monitors whether a high or low level has been "mitigated" (touched or exceeded by subsequent price action).
Changes the line style and color to indicate mitigation.
Provides an alert when mitigation occurs.
Configurable Extensions:
Lines can be extended beyond mitigation or stopped at the bar index where mitigation occurs, depending on user preference.
Efficient Array Management:
Uses arrays to manage daily highs, lows, their respective indices, and lines.
Ensures the size of stored data does not exceed the configured limit (daysToTrack).
Alerts:
Sends alerts when high or low levels are mitigated, which can be used for trading decisions.
Inputs
Session Start Hour/Minute: Defines when a new session starts.
Days to Track: Sets the number of previous days to display high/low levels.
Colors: Allows customization of line colors for unmitigated and mitigated levels.
Extend Lines: Toggles whether lines should extend past the mitigation point.
Code Highlights
New Session Detection: The script detects the start of a new session based on the configured session start time and resets daily highs/lows.
Line Management: Horizontal rays are created for highs and lows, and mitigated lines are updated with a dashed style and faded color.
Mitigation Logic: The script checks whether current price action exceeds stored high or low levels and updates their status and appearance accordingly.
Memory Management: Ensures the size of the arrays (highs, lows, lines) does not exceed the configured daysToTrack, deleting the oldest elements as necessary.
This indicator is highly customizable and useful for traders who want to track and analyze daily support and resistance levels, incorporating mitigation as a dynamic feature.
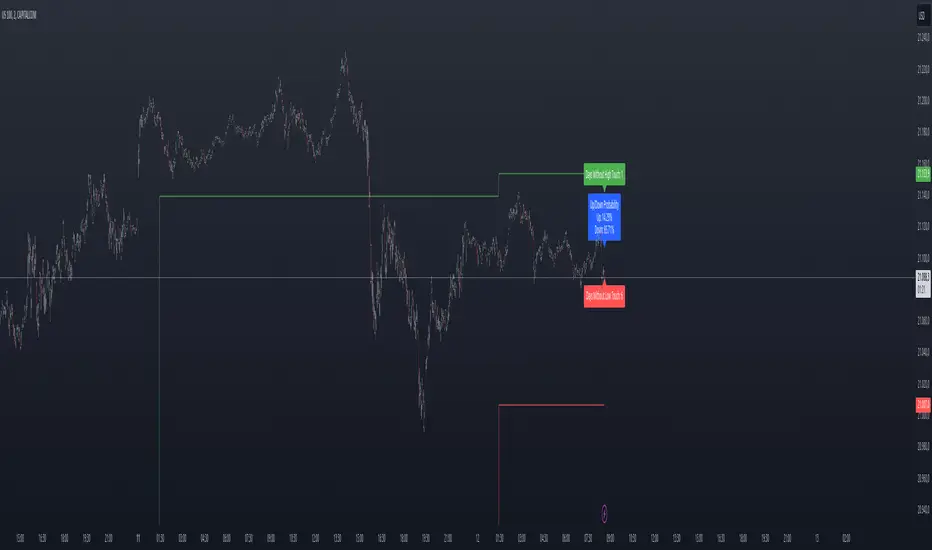
Previous Day High and Low Count with Probabilities
Indicator Explanation
This indicator displays the number of days on which the previous day's high or low prices were not reached and calculates probabilities for future price movements based on this information. It stores the high and low values of the last 45 days and checks daily whether these levels were touched. Based on the number of days without touching either the high or the low, the indicator calculates the probability of future price movements in either direction (Up or Down).
The indicator offers customization options for label placement and color on the chart. The counts for the high and low touches, along with the calculated probabilities (in percentages), are displayed as labels on the chart. These labels can be shifted along the X-axis by up to 50 bars and can be customized in color and size. Additionally, the text for the labels can be freely chosen, giving the user improved flexibility and overview.
In summary, this indicator helps to:
- Track how often previous day's high and low levels were not reached.
- Estimate probabilities for future price movements based on this information.
- Customize the chart display for easier interpretation.
Strategy Concept
Probability and Touch Conditions:
A long position is entered only if:
The probability of reaching the high is at least 60%.
The price has not touched the previous day’s high in the last three days.
Similarly, for short positions:
The probability of reaching the low is at least 60%.
The price has not touched the previous day’s low in the last three days.
Incremental Position Size Increase:
On the 3rd consecutive day without a high/low touch and with the probability condition met, an initial position of 0.01 lots is opened.
On the 4th day, an additional position of 0.01 lots is added.
On the 5th day, an extra position of 0.02 lots is opened.
After a two-day pause, the situation is re-evaluated, and if conditions are still met, a 0.04-lot position is considered.
Trend Reversal Detection:
The strategy also includes a simple trend reversal check. If the market shows clear reversal signals, no new positions will be opened.
Adjustments and Risk Management
This strategy can be adjusted by modifying the probability values, the number of days without a high/low touch, and the lot sizes. Additionally, stop-loss and take-profit levels can be added to further control the risk and secure profits.
Strategy Concept
Probability and Touch Conditions:
A long position is entered only if:
The probability of reaching the high is at least 60%.
The price has not touched the previous day’s high in the last three days.
Similarly, for short positions:
The probability of reaching the low is at least 60%.
The price has not touched the previous day’s low in the last three days.
Incremental Position Size Increase:
On the 3rd consecutive day without a high/low touch and with the probability condition met, an initial position of 0.01 lots is opened.
On the 4th day, an additional position of 0.01 lots is added.
On the 5th day, an extra position of 0.02 lots is opened.
After a two-day pause, the situation is re-evaluated, and if conditions are still met, a 0.04-lot position is considered.
Trend Reversal Detection:
The strategy also includes a simple trend reversal check. If the market shows clear reversal signals, no new positions will be opened.
Risk Disclaimer
The author of this strategy does not assume any liability for potential losses or gains that may arise from the use of this strategy. Trading involves significant risk, and it is important to only trade with capital that you can afford to lose. The strategy presented is for educational purposes only and should not be considered as financial advice. Always conduct your own research and consider seeking advice from a professional financial advisor before making any trading decisions.
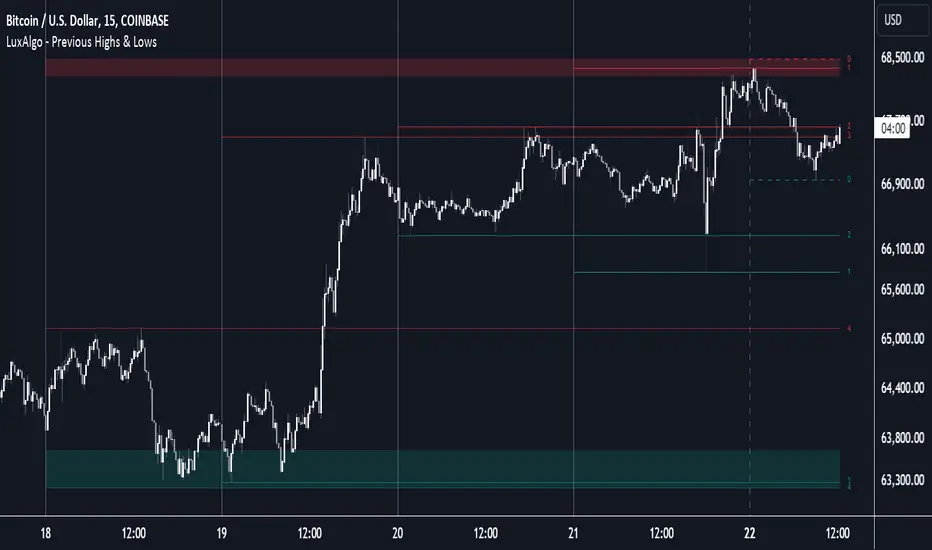
Previous Highs & Lows [LuxAlgo]The Previous Highs & Lows indicator highlights a user-set amount of previous maximum/minimum prices made within specific intervals, these are displayed as levels customizable levels.
Additionally, one upper and lower zone constructed from the previously displayed highs/lows is included, providing support/resistance areas.
🔶 USAGE
Previous highs/lows are often perceived as key trading levels with the potential of generating multiple reactions upon being reached.
While the daily interval is more commonly used, users can use different intervals, with the indicator supporting hourly, daily, weekly, monthly, and yearly intervals. Using higher intervals on low timeframes can return more distant levels relative to the most recent price, which might not be relevant.
Each level is numbered, with more recent previous highs/lows having a lower number associated with them, users can also highlight more recent levels through a transparency gradient.
Users can control the amount of previous highs/lows displayed using the "Show Last" settings, with a higher value providing more potential support/resistance. Returned previous highs/lows can eventually be filtered out based on their position by enabling the "Filter Based On Position" setting, only keeping previous highs above the current closing price and previous lows below the current closing price, giving more relevant levels as a result.
🔹 Previous High/Low Areas
The indicator includes two areas constructed from the respective percentiles of the returned previous highs/lows. These can be useful as more general support/resistance areas.
Wider areas are often indicative of a group of previous highs or lows being more dispersed, resulting in areas that are easier to reach. Wider areas can also be obtained by increasing the "Areas Width" setting.
Note: Areas will only be displayed if "Show Last" is greater than 1
🔶 SETTINGS
Show Last: Determines the amount of more recent previous highs and previous low levels displayed by the indicator.
Interval: Interval used to capture maximum/minimum price values,
Areas Width: Width of the displayed top/bottom areas, with higher values returning wider areas.
Filter Based On Position: When enabled only display previous highs above the current closing price and previous lows below the current closing price.
🔹 Style
Minimum Gradient Transparency: Minimum transparency value applied to the colors of the oldest displayed previous highs/lows levels.
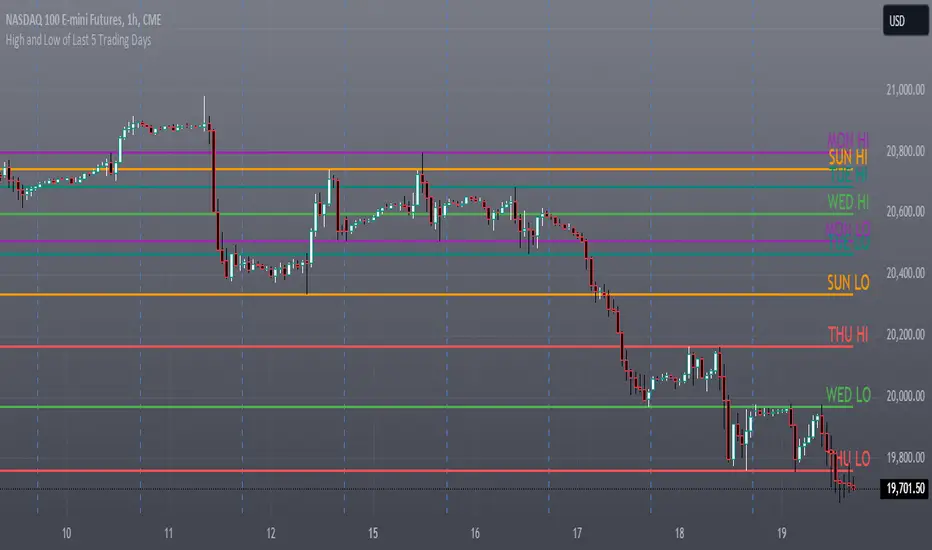
High and Low of Last 5 Trading Days### Indicator Description: High and Low of Last 5 Trading Days
**Indicator Name:** High and Low of Last 5 Trading Days
**Purpose:**
This indicator plots the high and low levels for each of the last 5 trading days on your TradingView chart. It helps traders to visualize important price levels from the recent trading history, which can act as potential support and resistance levels.
**Features:**
1. **Daily High and Low Levels:** Plots the high and low prices for each of the last 5 trading days.
2. **Unique Colors for Each Day:** Each trading day's high and low levels are color-coded uniquely for easy identification.
3. **Solid Lines:** The high and low levels are represented by solid lines for better visibility.
4. **Day Labels:** The lines are labeled with the corresponding day and whether it is a high or low level (e.g., "MON HI", "MON LO").
5. **Dynamic Updates:** The levels and labels are updated at the beginning of each new day, ensuring that the most recent 5 days are always displayed.
**Usage:**
- **Support and Resistance:** Identify key support and resistance levels based on the previous 5 days' high and low prices.
- **Trend Analysis:** Determine the recent price trend by observing the relative positioning of the daily high and low levels.
- **Price Action:** Analyze price action around these levels to make informed trading decisions.
**Configuration:**
- The indicator does not require any user input. It automatically calculates and displays the high and low levels for the past 5 trading days.
**Visual Elements:**
- **Lines:** Solid lines in different colors (red, green, teal, purple, orange) represent the high and low levels.
- **Labels:** Text labels at the right end of each line indicate the day and whether it is a high or low level (e.g., "MON HI", "TUE LO").
This indicator provides a clear visual representation of significant price levels from the recent trading history, aiding traders in their technical analysis and decision-making process.
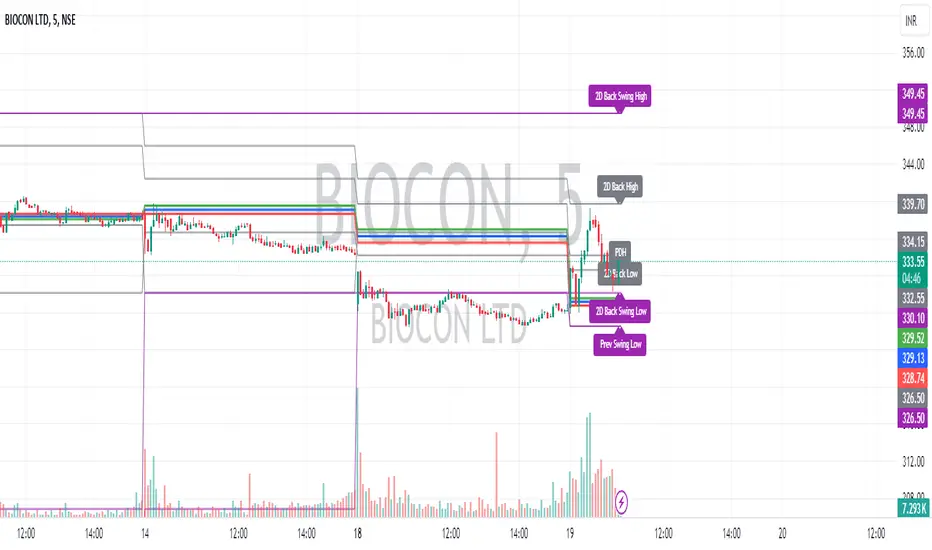
Intraday CPR with Previous Highs and Lows and Swing Highs/LowsThis Pine Script indicator plots the Central Pivot Range (CPR) for the current trading day along with previous day's high (PDH), low (PDL), and swing high/low (Swing H/L) values. It also includes the high, low, and swing high/low values from two days back for reference.
Key Features:
Central Pivot Range (CPR):
Pivot Point (PP): The central pivot point.
Bottom Central Pivot (BC): The lower boundary of the CPR.
Top Central Pivot (TC): The upper boundary of the CPR.
The area between the BC and TC is shaded for better visualization.
Previous Day and Two Days Back Values:
Previous Day High (PDH) and Low (PDL): Plots the high and low of the previous trading day.
Two Days Back High and Low: Plots the high and low from two trading days ago.
Previous Day Swing High/Low: The highest high and lowest low from a specified period (swing period) of the previous trading day.
Two Days Back Swing High/Low: The highest high and lowest low from a specified period (swing period) of two trading days ago.
Highest High and lowest low - Sachin Wakpaijan
The "Highest High and Lowest Low" indicator, created by Sachin Wakpaijan, is a powerful tool designed to identify the highest high and lowest low in a trading instrument's price history. This indicator can be used on TradingView to gain insights into significant price levels and potential trend reversals.
Inputs:
Display Emoji: This input parameter enables or disables the display of emoji symbols on the chart.
Functionality:
The indicator calculates the highest high and lowest low based on the price history. It performs the following steps:
Highest High Calculation: The indicator calculates the highest high by comparing the current high with the previously recorded highest high. If a new high is found, the highest high is updated. The lowest low is set to the highest high.
Lowest Low Calculation: The indicator calculates the lowest low based on the current low. If a new low is found, the lowest low is updated, and the highest after the low is set to the lowest low.
Checking for Highest After Low: If the current high exceeds the highest after the low, the highest after the low is updated.
Plotting: The indicator plots the highest high, highest after low, and lowest high on the chart. Additionally, it displays emoji symbols on the chart based on specific conditions, such as the highest high and the relationship between the high and the open/close prices.
Usage:
The "Highest High and Lowest Low" indicator can be applied to any trading instrument and time frame. It helps traders identify significant price levels, potential trend reversal points, and gauge the strength of price movements. The indicator's customizable input parameter allows users to adjust the visual appearance according to their preferences.
Note:
This indicator is provided for informational purposes only and should not be considered as financial advice. Traders should conduct thorough analysis and use additional indicators or techniques to validate their trading decisions.
Author:
This indicator was created by Sachin Wakpaijan. You can find more of their work on TradingView.
Disclaimer:
Trading involves risks, and it is essential to understand and acknowledge the risks associated with trading before making any investment decisions. The author do not assume any responsibility for any trading losses incurred as a result of using this indicator.

Take Session High/Low Alert [MsF]Japanese below / 日本語説明は英文の後にあります。
-------------------------
This indicator that displays High/Low lines for each session. The Key Levels of each session can be visually recognized, which is useful for PD Array analysis. You can display the last 3 days. Based on trinity by ICT.
The biggest feature is that the color shape of the line changes when reaching High/Low. Of course, you can also set alerts.
Unreached High/Low lines can be extended to the right. hides all timeframes over 1 hour. (alert is alive)
You can choose 4 sessions. If you only want to use 3 sessions, you can do that by setting the same session time for 2 of the 4 session settings.
About Parameter Settings
Session Time: Please set it to be a 24-hour cycle. You can also specify the time zone. The default is NY time.
Basis/Other color: The first time specified in "Session Time" in this indicator's parameter is the "Basis color". "Other color" is a line other than that.
Enable Time Lines: You can turn on/off the display of vertical lines.
High/Low color: High/Low line setting that has not been reached.
Taken color: High/Low line setting that has already been reached.
Extend Lines: Allows unreached High/Low lines to be extended to the right in the chart.
-------------------------
セッションごとのHigh/Lowをライン表示するインジケーターです。
過去約3日分を表示することができます。
最大の特徴はHigh/Low到達時にラインの色形が変わることです。もちろんアラート設定も可能です。
未到達のHigh/Lowラインは右側に延長することができます。
チャート表示がビジーとなる為、1時間を超える時間足ではすべて非表示とする仕様です。(アラートは生きてます)
セッションは4つ指定できます。
もしセッションを3つのみ使用したい場合は、4つのセッション設定の内2つに同じセッション時間を設定することで実現可能です。
■パラメータ設定
Session Time:24時間周期となるように設定してください。またタイムゾーンが指定できます。デフォルトはNY timeです。
Basis/Other color:パラメータの"Session Time"にて一番最初に指定した時間が基準=Basisとなります。Otherはそれ以外のラインとなります。
Enable Time Lines:垂直ラインの表示ON/OFFが可能です。
High/Low color:未到達のHigh/Lowライン設定となります。
Taken color:到達済みのHigh/Lowライン設定となります。
Extend Lines:未到達のHigh/Lowラインを右に延長できます。

Higher Timeframe Candle LevelsThis is an indicator that shows higher time frame candle levels from various preset timeframes. These higher time frame candles act as support and resistance levels, so look for reversals and continuations off of these levels. When price exceeds the high or low of these levels, you should look for breakouts in the same direction and trade with the trend.
It includes candle levels for the following timeframes: 1 hour, 4 hour, 1 day, 1 week, 1 month, 1 quarter and 1 year. The indicator also includes a trend candle coloring feature, trend strength scoring table, stop loss feature, line identification labels, alerts for trend changes, alerts for level touches and full customization of all options.
How To Trade With This Indicator
These higher timeframe candle levels will act as support and resistance levels, so look for price to react at any of the levels you have turned on and then look for potential bounce or reversal signs at those levels so you can trade those direction changes. Price outside of the higher timeframe candle highs and low typically signals a breakout as well, so look for price to continue after passing the highs or lows.
You can use the direction of the higher timeframe candles as your trend as well. Try to only trade in the direction of the trend of the higher timeframes to increase the likelihood of your trade going in your favor.
The highs and lows of daily and up levels are excellent levels to find quick reversal off of. Watch for price action to struggle to break through these levels and then trade the reversal. If price breaks through these levels easily, watch for price to retest the level and then continue beyond that level. Trade the retest in the direction of the trend.
The open, close and midline levels are excellent for trading bounces. Watch for price to form wicks beyond these levels and close on the other side and use that as a sign that price may bounce there. Use that with price action to confirm your trade and then take trades off of those level bounces.
Use the alerts for daily and up timeframe level touches across all of your favorite markets so that way you are always notified in real time when price is at a level that could provide a potential trading opportunity.
Higher Time Frame Candle Levels
The indicator shows the current candle open, previous open, previous high, previous low, previous close and previous candle body midline levels of each candle for each time frame. This helps you easily see what is going on with the higher time frame candles and read the price action from your lower time frame charts.
Each candle level will paint red if it was a down candle or green if it was an up candle, except the midlines and current candle open lines, those are a different color for easy differentiation. The line colors can be customized to your preferences in the settings and you can also toggle the candle body coloring on or off, as well as change the color of the candle body background.
Each timeframe can be adjusted to your preferences, allowing you to turn all of the levels on or off. You can also adjust how many previous candles show up on your chart so you can backtest it and see for yourself how accurate these levels are.
When adjusting the number of candles, you will get a notification if you have more than 500 lines turned on, so just turn down the number of levels for whatever timeframe you can’t see on your chart to lower that number below 500. The notification will go away once you are under 500 lines again. Each candle has 6 lines if all levels are turned on for that timeframe: open, current candle open, close, high, low and midline. The default settings keep you under 500 lines total, so just be aware of that limitation when adjusting those numbers and adjust the number of levels down on the timeframes that are not useful on the current chart bar.
You can also extend the levels right on any time frame from the daily levels and above. This is useful when price is breaking above or below all levels and you need to know if there are any other previous candle levels in the way as price moves away from the most recent higher time frame candles.
To understand the intraday trend of each higher time frame, look to see where price is at according to each higher time frame candle. If the price is above the midline of the candle, it is bullish. If the price is above the candle body it is more bullish. If the price is above the high, it is very bullish. If the price is below the midline of the candle, it is bearish. If the price is below the candle body it is more bearish. If the price is below the low, it is very bearish. Make sure you backtest this yourself and go through lots of historical data to get a feel for how price reacts to these levels and establishes the trend. Then use that trend information to your advantage and trade in the direction of the trend.
Since users are limited to a certain amount of historical bars based on which Tradingview plan you have, some longer timeframe levels won’t show up because the start of that candle is too far back in history. You will get a notification at the top of that chart if that happens. It will tell you to lower the display timeframe for that timeframe until that notification goes away, which means it was able to plot the most recent candle for that timeframe on your chart.
Trend Candle Coloring
The indicator includes a feature that paints the candles based on whether the current time frame candles are above or below the most recent midline, candle body or high & low of a higher time frame candle of your choice. This helps you see the overall trend of the higher timeframe so you can trade with the trend.
The candle coloring will have an up color, down color and neutral color which can all be customized to suit your preferences. If the current time frame candle close is above the setting you choose, it will show the up color. If the current time frame candle close is below the setting you choose, it will show the down color. If the current time frame candle close is equal to or in the middle of the setting you chose, it will show the neutral color.
So, for example if you set it to candle body, then it will show the up color if the current candle is above the top of the candle body, down color if it is below the bottom of the candle body and neutral color if it is inside the candle body. This helps you wait for price action to move beyond the inside of the previous higher time frame candle before taking a position when price is breaking out of that previous candle so you can trade the momentum of that move. The candle coloring is fully customizable, but make sure to turn off your candle coloring on other indicators and your chart settings for it to show up properly.
Trend Strength Scoring Table
The trend strength scoring table displays a table at the bottom of the screen(table position is customizable), showing a score for the trend strength of each higher time frame. If the current candle close is above the midline, its strength is 1. If the current candle close is above the midline, but below the top of the candle body, its strength is 2. If the current candle close is above the high, its strength is 3. The same goes for below the midline, bottom of the candle body and below the low, but the scores would be negative 1, 2 or 3 instead.
This trend strength table allows you to quickly identify the trend on each higher time frame so you can wait until the trend is the same across all time frames before placing a trade in the direction of the trend. It also shows a total score on the far right side that adds all of the current trend scores together to give you a total strength score. Try to only trade when that number is very high compared to how many time frames you have turned on. Each time frame can have up to a maximum score of 3 if bullish and -3 if bearish. Each time frame in the table can be turned on or off to suit your preferences.
Stop Loss Feature
There is also a stop loss feature that you can set to whatever time frame you choose and whatever direction you chose, such as long or short. It will follow the most recent higher time frame candle’s trend using one of the following settings: candle body, high & low or midline. Once a new higher time frame candle is created, the stop loss will update to the most recent candle’s levels so you can use these levels as a trailing stop loss to maximize your wins.
If you have it set to use the candle body and it is set to long mode, then the stop loss will use the previous higher time frame candle’s lowest candle body level. So if it was an up candle previously, it will use the open. If it was a down candle previously, it will use the close. The opposite is true for short positions.
The stop loss will start working once you turn it on in the settings and will update automatically as new higher time frame candles are formed. It also shows a line of where the stop loss was previously since it was turned on.
I recommend using the high & low setting, especially when the market starts trending.
Candle Level Identification Labels
There are labels for each level starting with the 4 hour time frame and above so you can easily tell what level of each candle you are looking at, even if the rest of the candle is not showing within the chart pane. You can customize the label coloring for up candles and down candles and midlines as well as adjust the number of bars that the labels are offset from the current bar so they are visible on your chart without overlapping the current price action or other indicator labels. Labels for each time frame can be turned on or off as needed. The 1 hour labels were not included because it clogs up the chart, but it has labels for all time frames from the 4 hour candles and up.
Alerts
The indicator includes alerts for when the trend has changed to the opposite direction. The trend change alert is based on your settings for the Trend Candle Coloring. Whatever settings you have the trend candle coloring set to, will be used to set up your alerts. The Trend Candle Coloring setting must be turned on as well when creating your alerts for it to work properly. Make sure to backtest your settings and then create your alerts.
It also has alerts for when price is touching an open or close, high or low, midline or any of those levels for each timeframe. This allows you to be notified when price touches one of these levels so you can check the chart and look for potential trade opportunities if price wants to bounce off of that level. To make it easy for you to get alerts on many different tickers, just use the alert for any level touch on whatever timeframes you want.
Other Indicators To Pair This With
Use this in combination with our Trend Strength Indicator so you can visually see the historic and current trend for all of these levels. You should also use our Breakout Scanner to find other markets with strong trends so you always know which market is trending the strongest and can trade those. Trend Strength Indicator, Higher Timeframe Candle Levels and the Breakout Scanner all use the same levels and calculate the trend scores the same way so they are designed to work together to help you quickly be able to read a chart and find what direction to trade in.

Swing High/Low ExtensionsSwing High/Low — Extensions (2 Plots + Drawings + Touch Signal)
What it does
This indicator finds Swing Highs/Lows using a symmetric length (same bars left & right), then creates horizontal extension levels that run to the right and stop at the first price touch (“extend until future intersection”).
It outputs:
Two plots showing the most recent active High/Low extension (great for alerts & strategy logic).
Line drawings for every detected swing (historical levels stay on the chart and end at the touch bar).
A hidden TouchSignal used to color bars and trigger alerts without distorting the price scale.
The design mirrors Sierra Chart’s “Swing High and Low” with “Extend Swings Until Future Intersection”, but implemented natively in Pine.
How it determines swings
Uses ta.pivothigh() / ta.pivotlow() with length bars left and right.
A swing is confirmed only after there are length bars to the right of the center.
How extensions/lines end
High extensions end when High ≥ level.
Low extensions end when Low ≤ level.
The corresponding line drawing is frozen on the touch bar; the most recent active line continues to extend each new bar.
Inputs
Swing Strength (Bars Left = Right) – symmetric pivot length.
Offset as Percentage – 1 = +1%; positive values push levels outward (High up / Low down), negative pull them inward.
Draw “Extend…Until Future Intersection” Lines – toggle line drawings on/off.
Line Width (Plots + Drawings) – thickness for plots and drawings.
HighExt Color / LowExt Color – colors for the two plots and drawings.
Touch Color – color to paint bars on the touch bar (doesn’t affect scale).
HighExt/LowExt Line Style – choose line style (Solid/Dashed/Dotted) for drawings.
Color Bars on Touch? – enable/disable bar coloring.
Bar Color on High Touch / Low Touch – separate bar colors for each side.
Bar Color Transparency (0..100) – opacity for the bar painting.
Plots
HighExt – latest active high extension only.
LowExt – latest active low extension only.
(Internally there is also a hidden “TouchSignal” plot used for bar coloring & alerts; it’s not displayed to keep the chart scale clean.)
Alerts
Three built-in alertconditions:
Any Extension Touched — triggers when either side is hit.
High Extension Touched — only high level touch.
Low Extension Touched — only low level touch.
Create alerts from the indicator’s “More” (⋯) menu → Add alert → choose one of the conditions.
Styling
Drawings use your selected style (Solid/Dashed/Dotted), color, and width.
Existing historical lines adopt new styles when the script recalculates.
Bar coloring highlights the exact touch candle; disable it if you prefer clean candles.
Notes & tips
Scale-safe: the TouchSignal is hidden (display=none), so it won’t distort the Y-axis.
Performance: TradingView limits scripts to ~500 line objects; this script uses max_lines_count=500. If you hit the cap on long histories, either increase timeframe or disable drawings and rely on the two plots + alerts.
Works on any symbol/timeframe; levels are rounded to the instrument’s minimum tick.
Intended use
For discretionary levels, alerting, and rule-based entries that react to first touch of recent swing extensions. Not financial advice—use at your own risk.

Swing High/Low with Liquidity Sweeps🧠 Overview
This indicator identifies swing highs and swing lows based on user-defined candle lengths and checks for liquidity sweeps—situations where the price breaks a previous swing level but then closes back inside, indicating a potential false breakout or stop hunt. It also supports visual labeling and alerts for these events.
⚙️ Inputs
Swing Length (must be odd number ≥ 3):
Determines how many candles are used to identify swing highs/lows. The central candle must be higher or lower than all neighbors within the range.
Example: If swingLength = 5, the central candle must be higher/lower than the 2 candles on both sides.
Sweep Lookback (bars):
Defines how many bars to look back for possible liquidity sweeps.
Show Swing Labels (checkbox):
Optionally display labels on the chart when a swing high or low is detected.
Show Sweep Labels (checkbox):
Optionally display labels on the chart when a liquidity sweep occurs.
🕯️ Swing Detection Logic
A Swing High is detected when the high of the central candle is greater than the highs of all candles around it (as per the defined length).
A Swing Low is detected when the low of the central candle is lower than the lows of surrounding candles.
Swing labels are placed slightly above (for highs) or below (for lows) the candle.
💧 Liquidity Sweep Logic
A Sweep High is triggered if:
The current high breaks above a previously detected swing high,
And then the candle closes below that swing high,
Within the configured lookback window.
A Sweep Low is triggered if:
The current low breaks below a previous swing low,
And then closes above it,
Within the lookback window.
These are often seen as stop hunts or fake breakouts.
🔔 Alerts
Sweep High Alert: Triggered when a sweep above a swing high occurs.
Sweep Low Alert: Triggered when a sweep below a swing low occurs.
You can use these to set up TradingView alerts to notify you of potential liquidity grabs.
📊 Use Cases
Identifying market structure shifts.
Spotting fake breakouts and potential reversals.
Assisting in smart money concepts and liquidity-based trading.
Supporting entry timing in trend continuation or reversal strategies.

Custom EMA High/Low & SMA - [GSK-VIZAG-AP-INDIA] Custom EMA High/Low & SMA -
1. Overview
This indicator overlays a dynamic combination of Exponential Moving Averages (EMA) and Simple Moving Average (SMA) to identify momentum shifts and potential entry/exit zones. It highlights bullish or bearish conditions using color-coded SMA logic and provides visual Buy/Sell signals based on smart crossover and state-based logic.
2. Purpose / Use Case
Designed for traders who want to visually identify momentum breakouts, trend reversals, or pullback opportunities, this tool helps:
Spot high-probability buy/sell zones
Confirm price strength relative to volatility bands (EMA High/Low)
Time entries based on clean visual cues
It works well in trend-following strategies, particularly in intraday or swing setups across any liquid market (indices, stocks, crypto, etc.).
3. Key Features & Logic
✅ EMA High/Low Channel: Acts as dynamic support/resistance boundaries using 20-period EMAs on high and low prices.
✅ Timeframe-Specific SMA: A 33-period SMA calculated from a user-defined timeframe (default: 10-minute) for flexible multi-timeframe analysis.
✅ Signal Generation:
Buy: When SMA drops below EMA Low and close is above EMA High.
Sell: When SMA rises above EMA High and price closes below both EMAs.
Optionally, signals also fire based on SMA color changes (green = bullish, red = bearish).
✅ Strict or Loose Signal Logic: Choose between precise crossovers or broader state-based conditions.
✅ Debugging Tools: Optional markers for granular insight into condition logic.
4. User Inputs & Settings
Input Description
EMA High Length Period for EMA of high prices (default: 20)
EMA Low Length Period for EMA of low prices (default: 20)
SMA Length Period for Simple Moving Average (default: 33)
SMA Timeframe Timeframe for SMA (default: “10”)
Show Buy/Sell Arrows Enable visual arrow signals for Buy/Sell
Strict Signal Logic ON = crossover-based signals; OFF = state logic
Plot Signals on SMA Color Change Enable signals on SMA color shifts (Green/Red)
Show Debug Markers Plot small markers to debug condition logic
5. Visual Elements Explained
🔵 EMA High Line – Blue line marking dynamic resistance
🔴 EMA Low Line – Red line marking dynamic support
🟡 SMA Line – Color-coded based on position:
Green if SMA < EMA Low (Bullish)
Red if SMA > EMA High (Bearish)
Yellow otherwise (Neutral)
✅ BUY / SELL Labels – Displayed below or above candles on valid signals
🛠️ Debug Circles/Triangles – Help visually understand the signal logic when enabled
6. Usage Tips
Best used on 5–30 min timeframes for intraday setups or 1H+ for swing trades.
Confirm signals with volume, price action, or other confluences (like support/resistance).
Use strict mode for more accurate entries, and non-strict mode for broader trend views.
Ideal for identifying pullbacks into trend, or early reversals after volatility squeezes.
7. What Makes It Unique
Multi-timeframe SMA integrated with EMA High/Low bands
Dual signal logic (crossover + color shift)
Visually intuitive and beginner-friendly
Minimal clutter with dynamic signal labeling
Debug mode for transparency and learning
8. Alerts & Automation
The indicator includes built-in alert conditions for:
📈 Buy Alert: Triggered when a bullish condition is detected.
🔻 Sell Alert: Triggered when bearish confirmation is detected.
These alerts can be used with TradingView's alert system for real-time notifications or bot integrations.
9. Technical Concepts Used
EMA (Exponential Moving Average): Reacts faster to recent price, ideal for trend channels
SMA (Simple Moving Average): Smoother average for detecting general trend direction
Crossover Logic: Checks when SMA crosses over or under EMA levels
Color Coding: Visual signal enhancement based on relative positioning
Multi-Timeframe Analysis: SMA calculated on a custom timeframe, powerful for confirmation
10. Disclaimer
This script is for educational and informational purposes only. It is not financial advice. Always backtest thoroughly and validate on demo accounts before applying to live markets. Trading involves risk, and past performance does not guarantee future results.
11. Author Signature
📌 Indicator Name: Custom EMA High/Low & SMA -
👤 Author: GSK-VIZAG-AP-INDIA

Candle % High/Low Bar + HL Order + MA by Barty&PitPapcioWhat does the indicator show?
The "Candle % High/Low Bar + HL Order + MA by Barty&PitPapcio" indicator displays the percentage deviation of each candle’s high and low relative to its open price. The zero line represents the candle’s open — bars above zero show upward movement from the open (to high), bars below zero show downward movement (to low).
Additionally, the indicator plots a dot above or below each bar indicating which came first during the candle — the high or the low — based on data from a lower timeframe two steps below the current chart (for example, on a 1-hour chart it uses 15-minute data).
Finally, the indicator calculates and plots a user-selectable moving average (EMA, SMA, or WMA) of these "first high or low" signals, helping identify trends whether the first move is more often upwards or downwards.
Where do the data come from?
Percentage values are calculated directly from the current chart’s candles:
highPerc=(High−Open)/Open×100%,
lowPerc=(Low−Open)/Open×100%
The timing of the first high or low for each candle is retrieved from a lower timeframe, stepping down two levels from the current timeframe (e.g. from 1H to 15 min), providing better precision in detecting the order of highs and lows that may be blurred on higher timeframes.
Additional features:
Full customization of colors for bars, dots, zero line, grid, and thicknesses.
Background grid with adjustable scale and style.
Safety checks for missing lower timeframe data.
A moving average smoothing the sequence of first high/low signals to reveal directional tendencies.
Suggested strategy for technical analysis support
Identify dominant candle direction: If the dot often appears above the bar (first high), it indicates buying pressure; if below (first low), selling pressure dominates.
Use percentage deviations: Large percent bars indicate heightened volatility and potential reversal points.
Moving average on order signals: The EMA of high/low first signals smooths the noise, showing the dominant trend in the sequence of price moves, useful for filtering other signals.
Combine with other tools: This indicator can act as a directional filter on multiple timeframes, synergizing well with momentum indicators, RSI, or support/resistance levels to confirm move strength.
Lots of love, Bartosz

Gann Percentage of High & Low Prices for Options - Keanu_RiTzThis Indicator is based on the text from Chapter 4 "Percentage of High & Low Prices" page number "30" from the book "WD Gann 45 years in Wall Street".
This Indicator is to be used on Intraday Timeframes and only on Options Charts (CALL & PUT) and not on any other chart.
The following is the text from that page :-
One of the greatest discoveries I ever made was how to figure the percentage of high and low prices on the averages and individual stocks.
The percentages of extreme high and low levels indicate future resistance levels.
There is a relation between every low price to some future high price and a percentage of the low price indicates what levels to expect the next high price.
At this price you can sell out long stocks and sell short with a limited risk.
The extreme high price or any minor tops are related to future bottoms er low levels.
The percentage of the high price tells where to expect low prices in the future and gives you resistance levels where you can buy with a limited risk.
The most important resistance level is 50% of any high or low price.
Second in importance is 100% on the lowest selling price on the averages or individual stocks.
You must also use 200%, 300%, 400%, 500%, 600% or more, depending upon the price and the Time Periods from High and Low.
Third in importance is 25% of the Lowest price or the Highest price.
Fourth in importance is 121/2% of the extreme Low or extreme High price.
Fifth in importance is 61/4% of the Highest price, but this is only to be used when the averages or individual stocks are selling at very high levels.
Sixth in importance is 33 1/3 and 66 2/3%. These percentages should be calculated and watched for resistance next after 25% and after 50%.
You should always have percentage tables made up on the Industrial Averages and on the individual stocks you trade in in order to know where these important resistance levels are located.
Description :
It plots the Intraday % levels from the highest high and lowest low of that day.
The calculation of these levels is based on the text from Chapter 4 "Percentage of High & Low Prices" page number "30" from the book "WD Gann 45 years in Wall Street".
I developed this indicator to see if those percentages work on Options prices or not,
and from my observation I found that it works wonderfully in Options as well.
These % levels work like magic and act as great Dynamic Support and Resistance levels.
Don't trust my words blindly and see for yourself.
This indicator is for educational and research purpose only.
It does not provide any BUY/SELL signals.

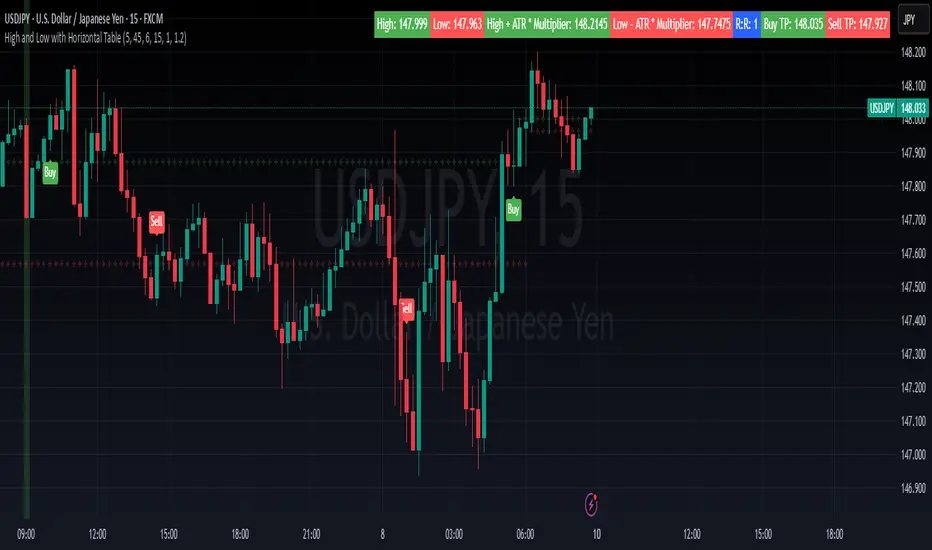
High and Low with Horizontal TableHigh and Low with Horizontal Table Indicator
Overview
The "High and Low with Horizontal Table" indicator is designed for traders who wish to monitor key levels based on specific candle times, along with dynamic risk-to-reward ratios and ATR-based values. This indicator features real-time calculations, visual cues, and a table for quick reference of the calculated values.
Key Features
Custom Time Inputs:
Users can define two specific time inputs to select the candles for the High and Low prices. These times can target the same or separate candles.
ATR-based Calculation:
The indicator allows users to apply an ATR Multiplier to adjust the calculation of key levels. By default, the ATR multiplier is set to 1.2, but users can adjust it to their preferred value (e.g., 1.5 or 2).
Risk-to-Reward (R:R) Calculation:
The Risk-to-Reward Ratio (R:R) is used to calculate potential Take Profit (TP) levels based on the high and low of the selected candle(s).
The default R:R ratio is 2.0, but it can be customized to suit the trader’s strategy.
Visual Markings:
The High and Low values are plotted with subtle markers on the chart (cross style) for easy identification. The display of these markers is subdued for minimal visual distraction.
Horizontal Table Display:
A horizontal table is generated in the top-right corner of the chart, providing a quick reference for the following values:
High and Low of the selected candle(s)
High + ATR Multiplier and Low - ATR Multiplier
R:R ratio
Buy TP and Sell TP levels
Each value is displayed with a reasonable number of decimal places (4 decimals) for major forex pairs, XAUUSD, and BTCUSD.
Input Parameters
Hour and Minute for High Candle: Select the time for the candle that will determine the High.
Hour and Minute for Low Candle: Select the time for the candle that will determine the Low.
ATR Multiplier: A customizable input for adjusting the ATR-based calculations (default is 1.2).
Risk-to-Reward (R:R): Set the ratio to determine the TP levels (default is 2.0).
How It Works
The user defines two distinct time inputs (one for the High and one for the Low).
At the specified times, the indicator captures the High and Low prices of the candles.
The ATR is calculated and adjusted by the user-defined ATR Multiplier to determine buffers above the High and below the Low.
The Risk-to-Reward ratio is applied to calculate the Take Profit levels.
All of these values are displayed on the chart and updated in real time. The horizontal table ensures quick reference to all the key levels without cluttering the main chart.
Use Cases
Trend Trading: Identify potential support and resistance levels based on specific timeframes and adjust TP targets using ATR.
Scalping: Use the ATR and R:R calculations to target precise entry and exit points.
Market Opens: Track key market opens (such as New York and London) with candle times that reflect your trading strategy.
Conclusion
The High and Low with Horizontal Table indicator is a powerful tool for traders looking to combine precise candle-based level tracking with ATR-based risk management. By displaying key levels and TP targets in a clear, tabular format, traders can quickly assess and act on key price levels throughout their trading sessions.
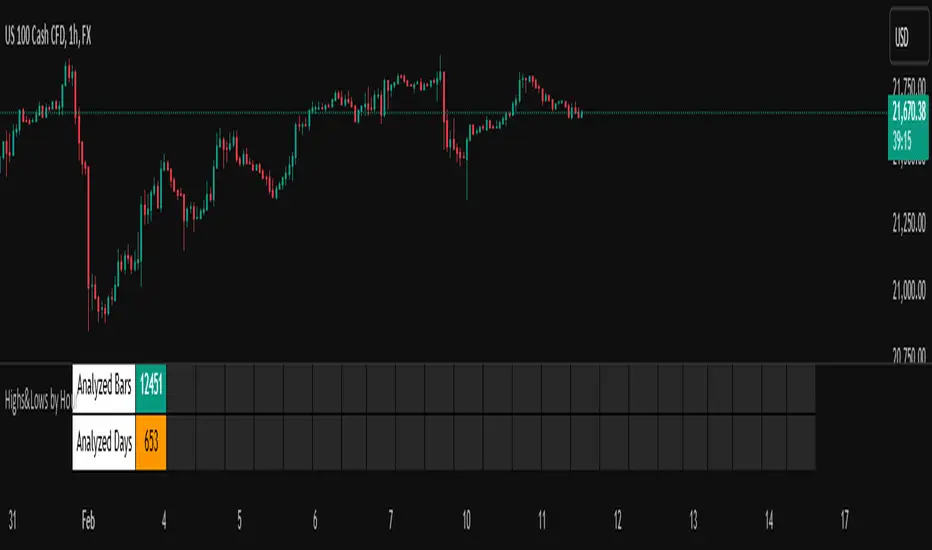
Highs&Lows by HourHighs & Lows by Hour
Description:
Highs & Lows by Hour is a TradingView indicator that helps traders identify the most frequent hours at which daily high and low price points occur. By analyzing historical price data directly from the TradingView chart, this tool provides valuable insights into market timing, allowing traders to optimize their strategies around key price movements.
This indicator is specifically designed for the one-hour (H1) timeframe . It does not display any data on other timeframes , as it relies on analyzing daily highs and lows within hourly periods.
This indicator processes the available data based on the number of historical bars loaded in the TradingView chart. The number of analyzed bars depends on the TradingView subscription plan , which determines how much historical data is accessible.
Key Features:
Works exclusively on the H1 timeframe , ensuring accurate analysis of daily highs and lows
Hourly highs and lows analysis to identify the most frequent hours when the market reaches its daily high and low
Sorted by frequency, displaying the most significant trading hours in descending order based on their recurrence
Customizable table and colors to fit the chart theme and trading style
Useful for scalpers, day traders, and swing traders to anticipate potential price reversals and breakouts
How It Works:
The indicator scans historical price data directly from the TradingView chart to detect the hour at which daily highs and daily lows occur.
It counts the frequency of highs and lows for each hour of the trading day based on the number of available bars in the TradingView chart.
The recorded data is displayed in a structured table, sorted by frequency from highest to lowest.
Users can customize colors to enhance readability and seamlessly integrate the indicator into their analysis.
Why Use This Indicator?
Identify key market patterns by recognizing the most critical hours when price extremes tend to form
Improve timing for trades by aligning entries and exits with high-probability time windows
Enhance market awareness by understanding when market volatility is likely to peak based on historical trends
Important Notes:
This indicator works only on the one-hour (H1) timeframe . It will not display any data on other timeframes
Works well on Forex, stocks, crypto, and futures , especially for intraday traders
The indicator analyzes only the historical bars available on the TradingView chart, which varies depending on the TradingView subscription plan (Free, Pro, Pro+, Premium)
This indicator does not generate buy or sell signals but serves as a data-driven tool for market analysis
How to Use:
Apply the Highs & Lows by Hour indicator to a one-hour (H1) chart on TradingView
Review the table displaying the most frequent hours for daily highs and lows
Adjust colors and settings for better visualization
Use the data to refine trading decisions and align strategy with historical price behavior
STRATEGY Fibonacci Levels with High/Low Criteria - AYNET
Here is an explanation of the Fibonacci Levels Strategy with High/Low Criteria script:
Overview
This strategy combines Fibonacci retracement levels with high/low criteria to generate buy and sell signals based on price crossing specific thresholds. It utilizes higher timeframe (HTF) candlesticks and user-defined lookback periods for high/low levels.
Key Features
Higher Timeframe Integration:
The script calculates the open, high, low, and close values of the higher timeframe (HTF) candlestick.
Users can choose to calculate levels based on the current or the last HTF candle.
Fibonacci Levels:
Fibonacci retracement levels are dynamically calculated based on the HTF candlestick's range (high - low).
Users can customize the levels (0.000, 0.236, 0.382, 0.500, 0.618, 0.786, 1.000).
High/Low Lookback Criteria:
The script evaluates the highest high and lowest low over user-defined lookback periods.
These levels are plotted on the chart for visual reference.
Trade Signals:
Long Signal: Triggered when the close price crosses above both:
The lowest price criteria (lookback period).
The Fibonacci level 3 (default: 0.5).
Short Signal: Triggered when the close price crosses below both:
The highest price criteria (lookback period).
The Fibonacci level 3 (default: 0.5).
Visualization:
Plots Fibonacci levels and high/low criteria on the chart for easy interpretation.
Inputs
Higher Timeframe:
Users can select the timeframe (default: Daily) for the HTF candlestick.
Option to calculate based on the current or last HTF candle.
Lookback Periods:
lowestLookback: Number of bars for the lowest low calculation (default: 20).
highestLookback: Number of bars for the highest high calculation (default: 10).
Fibonacci Levels:
Fully customizable Fibonacci levels ranging from 0.000 to 1.000.
Visualization
Fibonacci Levels:
Plots six customizable Fibonacci levels with distinct colors and transparency.
High/Low Criteria:
Plots the highest and lowest levels based on the lookback periods as reference lines.
Trading Logic
Long Condition:
Price must close above:
The lowest price criteria (lowcriteria).
The Fibonacci level 3 (50% retracement).
Short Condition:
Price must close below:
The highest price criteria (highcriteria).
The Fibonacci level 3 (50% retracement).
Use Case
Trend Reversal Strategy:
Combines Fibonacci retracement with recent high/low criteria to identify potential reversal or breakout points.
Custom Timeframe Analysis:
Incorporates higher timeframe data for multi-timeframe trading strategies.

Essa's Indicator 2.0Essa's Indicator V2: Beginner's Guide
This custom TradingView indicator has been designed to help you identify key trading opportunities based on session highs/lows, volatility, and moving averages. Below is a breakdown of the main features:
1. Exponential Moving Averages (EMAs)
Fast EMA (Blue Line): Tracks the short-term market trend (default: 9-period EMA).
Slow EMA (Red Line): Tracks the longer-term market trend (default: 21-period EMA).
You can turn on/off the EMAs using the "Show EMAs" option in the settings.
EMAs help smooth out price action and give a clearer picture of trends. A crossover of the fast EMA above the slow EMA can signal an upward trend, while the reverse may indicate a downward trend.
2. Session Highs and Lows
The indicator tracks price highs and lows for three major trading sessions:
London Session (Red): Highlighted in red. Active between 08:00 and 17:00 (LDN timezone) or 03:00 and 12:00 (NY timezone).
New York Session (Blue): Highlighted in blue. Active between 12:00 and 21:00 (LDN timezone) or 07:00 and 16:00 (NY timezone).
Asia Session (Yellow): Highlighted in yellow. Active between 22:00 and 08:00 (LDN timezone) or 18:00 and 03:00 (NY timezone).
Highs and lows for each session are plotted on the chart as lines. Breakouts from these levels can signal important trading opportunities:
London High/Low: Red lines.
New York High/Low: Blue lines.
Asia High/Low: Yellow lines.
The background color also changes depending on the active session:
London: Light red background.
New York: Light blue background.
Asia: Light yellow background.
3. Breakout Alerts
You can set alerts when the price breaks above or below session highs/lows:
Break Above London High: Alert triggered when the price crosses the London session high.
Break Below London Low: Alert triggered when the price falls below the London session low.
Similar alerts exist for the New York and Asia sessions as well.
4. Volatility-Adjusted EMA
The EMAs in this indicator are adjusted based on volatility (ATR - Average True Range). This allows the EMAs to respond to market conditions more dynamically, giving you more accurate trend readings in volatile markets.
5. ZigZag Feature (Optional)
You can enable the ZigZag feature to help visualize the price action's highs and lows:
ZigZag Lines: Highlight major peaks and troughs in price movements, helping you spot trends more easily.
This is helpful for identifying reversals or trend continuations.
6. Fractal Markers
This indicator uses fractals to mark potential turning points in the market:
Green Triangles (Above the Price): Indicate up fractals (potential reversal points where the price could move upwards).
Red Triangles (Below the Price): Indicate down fractals (potential reversal points where the price could move downwards).
Fractals can be a helpful confirmation tool when identifying entry and exit points.
7. Custom Timezone Options
You can choose between London (LDN) and New York (NY) timezones in the settings to adapt the session times to your trading location. This ensures the session high/low markers are displayed correctly for your trading region.
By default, the New York (NY) timezone is enabled for FXCM charts in the UK.
For BTC charts, you will need to switch to the appropriate time zone manually.
Thanks
Essa

[DarkTrader] Strong High LowThe Strong High Low indicator calculates strong high and low pivots based on price action and the Average True Range (ATR). The calculation for both the high and low pivots involves analyzing recent candle behavior to identify significant levels where price reversal is likely. Specifically, it looks for consecutive bearish or bullish candles to determine whether a strong high or low has been established.
Indicator In Use :
For strong highs, the indicator checks if three consecutive candles are bearish, meaning their closing price is lower than their opening price. It further examines prior candles to confirm that they followed a specific pattern where a reversal could occur. If one of these earlier candles closed higher than it opened, the indicator assumes that this was a strong high, and it records either the high of the second or third candle from the pattern, depending on their relationship to each other.
Similarly, for strong lows, the indicator searches for three consecutive bullish candles where the close is higher than the open. The algorithm then reviews prior candles in the sequence to ensure that the market condition supports a potential low pivot. If an earlier candle closes lower than it opens, it marks this as a strong low. The final low point for the pivot is chosen based on a comparison between the second and third candles of the pattern.
Once the high and low pivots are determined, the indicator adjusts these levels using the ATR value. The ATR is added to the strong high pivot and subtracted from the strong low pivot to create slightly modified levels. This helps accommodate market volatility by widening the range of the high and low pivots, making the levels more reliable in reflecting potential reversal zones.
Finally, the strong high and low pivot lines are drawn on the chart, extending both to the left and right of the current price, based on the user-defined offset values. These lines give a visual cue of where key resistance and support levels exist, with labels marking the exact pivot values for easy reference.

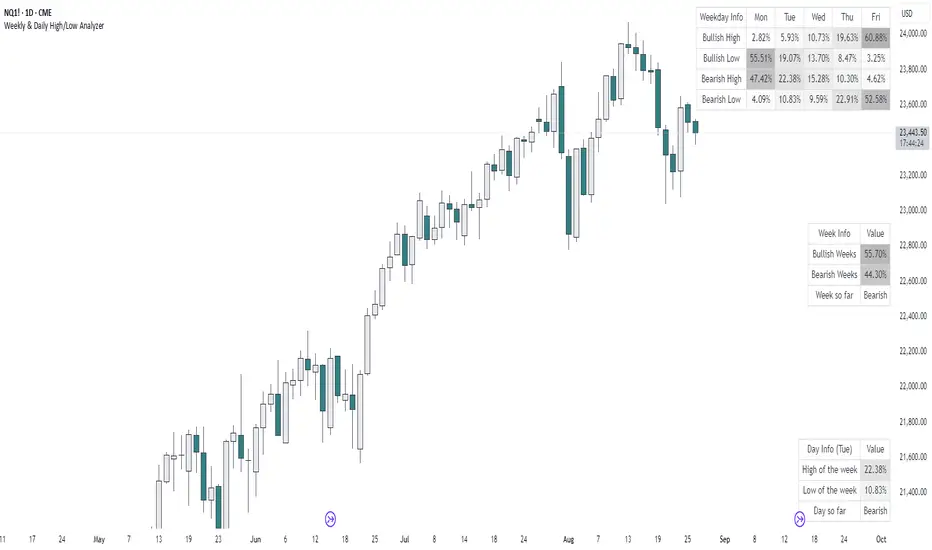
Weekly & Daily High/Low AnalyzerOverview
The Weekly & Daily High/Low Analyzer indicator is designed to analyze the likelihood of achieving the High or Low of the day or week based on user-specified parameters. This tool is ideal for traders who want to identify potential turning points in the market by examining historical data.
Features
Weekly High/Low Analysis: Available exclusively on the daily timeframe, this feature allows users to analyze past weeks to determine the probability of reaching the weekly high or low. Users can specify the number of weeks to analyze via the "Number of Weeks to Calculate" input field. Setting this field to 0 includes all available historical data. Note that the current week is excluded from the analysis as it is incomplete, and weekends (Saturdays and Sundays) are not analyzed.
Daily High/Low Analysis: Available exclusively on the 1-hour timeframe, this feature analyzes past days to determine the probability of reaching the daily high or low. Users can specify the number of days to analyze via the "Number of Days to Calculate" input field. Setting this field to 0 includes all available historical data. The current day is excluded from the analysis as it is incomplete, and weekends (Saturdays and Sundays) are not analyzed.
Visualization
A table is displayed in the top right corner of the chart, showing the results of the analysis. The table highlights the hours or days with the highest probabilities in darker colors for easy identification.
How It Works
Weekly Analysis: On the daily timeframe, the script analyzes each week's high and low points. It differentiates between bullish and bearish weeks and calculates the probability of reaching the high or low on each day of the week (Monday to Friday).
Daily Analysis: On the 1-hour timeframe, the script examines the high and low points of each trading day. It differentiates between bullish and bearish days and calculates the probability of reaching the high or low at each hour of the trading day.
Inputs
Number of Weeks to Calculate: An integer input that determines the number of past weeks to include in the analysis. Setting this to 0 includes all historical data.
Number of Days to Calculate: An integer input that determines the number of past days to include in the analysis. Setting this to 0 includes all historical data.
Calculation and Display
The indicator uses arrays to count the occurrences of highs and lows on bullish and bearish weeks and days.
Probabilities are calculated and displayed in a table, with each row representing a day (for weekly analysis) or an hour (for daily analysis).
Colors in the table indicate the strength of the probability, making it easy to identify significant patterns.
Implementation
The script includes detailed logic for resetting values at the start of a new week or day, capturing opening and closing prices, and counting occurrences of highs and lows. The table displays data in a user-friendly format, with gradient colors indicating the probability strength.
Example Usage
Swing Traders: Can use the weekly analysis to identify potential high or low points for the week, aiding in setting entry or exit points.
Day Traders: Can use the daily analysis to determine the most likely hours for reaching the high or low of the day, optimizing intraday trading strategies.
Additional Information
This indicator is inspired by the knowledge shared by Omor and aims to provide traders with a statistical edge in predicting market movements.
Equal Highs and LowsDescription:
The ‘Equal Highs and Lows’ indicator is a technical analysis tool that marks identical price levels on a trading chart using the current time-frame, assisting traders in identifying potential support and resistance zones or liquidity draws. It creates a horizontal line connecting points where the price has created equal highs and lows within a specified lookback period. Unique to this tool, it maintains a clean chart by removing the line once the price surpasses the equal highs or falls below the equal lows, ensuring only the currently relevant equal highs and lows are highlighted.
Features:
Customization Options: Users can adjust the appearance of the lines (color, width, and style) to match their chart setup or preferences. Users can also choose to extend the lines marking the equal highs/lows to the right of the chart making the equal high/low levels more easier to visualize.
User-Defined Lookback Length: The number of bars to look back for finding equal highs and lows can be set by the user, allowing for flexibility in different market conditions.
How It Works:
The indicator meticulously scans the chart over a user-specified lookback duration, identifying bars with matching high or low values that have not been mitigated on the current chat timeframe, thereby constructing an index of equal values. It subsequently connects these equal values on the chart with a line. While this intuitive indicator does not forecast future market trends, it emphasizes significant price levels derived from historical data.
Usage:
Identifying Support and Resistance: The lines drawn by the indicator can be used to identify potential support and resistance zones and/or draws of liquidity, which are crucial for making informed trading decisions.
Strategy Development: Traders can incorporate the visual cues provided by the indicator into their trading strategies, using them as one of the factors for entry or exit decisions.
Originality:
This indicator presents a distinctive method for pinpointing and illustrating equal highs and lows, granting traders a crucial insight into key price levels. It stands apart from conventional indicators by offering extensive personalization and employing a novel approach to augment chart analysis. Uniquely, it retains only unmitigated equal high/low levels on the chart, automatically discarding mitigated price levels once the price has reached that level.
Conclusion:
The "Equal Highs and Lows" indicator is a practical tool for traders looking to enhance their chart analysis with visual cues of significant price levels. Its customization options and innovative approach make it a valuable addition to the trading toolkit, suitable for various trading styles and strategies.
Technical Dashboard with High and Low Price Prediction Hello everyone!
I am releasing this indicator. It is called the Technical Dashboard and the name is pretty self explanatory! So let's get into it:
What it does:
The technical dashboard displays 4 commonly used technical indicators: Stochastics, RSI, Z-Score and MFI. It will display the current value of each of these technical indicators, as well as the highest and lowest value over a user defined period and the SMA.
The user can input the source and lookback period for each of the indicators individually. It is defaulted to 14, but I do recommend using a larger lookback time period as 14 tends to be a little too narrow.
The indicator will display a notice of whether the stock is trading in a max range, min range or neutral range based on its previous highest and lowest range. If the stock is trading between the highest and lowest range, it will display a neutral range reading.
In addition to displaying those 4 commonly used technical indicators, the indicator will also display the highest and lowest highs and lows of a ticker over a user defined period. You can opt for it to plot out the High and Low SMA and select your timeframe for these SMA plots.
The current value for the High and Low actually depicts a predicted High and Low based on the user defined lookback period. The Current Range column will show you when and if the predicted high or low is reached. The high and low defaults to the timeframe you are on. So if you are trading off the 5 minute chart, it will display the predicted high and low on the 5 minute time frame. The 1 hour, it will show the 1 hour, etc. It provides price prediction using a simple regression based analysis that pinescript provides.
Examples of its use:
In the image above, you can see how the indicator shows you when the stock is trading in some of its max ranges.
Note that just because a stock is trading in its max or min range does not necessarily mean that the stock is going to reverse in the opposite direction. While highest and lowest represent previous areas of reversal, it doesn't always mean that it will result in a reversal again. What it tells us more is whether momentum has picked up one way or the other, be it bearish or bullish momentum. This is useful information to help us decide whether a ticker has good momentum and whether a move is likely to have follow through. However, a stock trading in its high or low range can indeed signal a reversal. It is important to pay attention to the underlying price action and plan your trades accordingly.
Customizations
All of the indicators are individually customizable, from lookback length, SMA length and input source for RSI, Z-Score and MFI.
In addition to the lookback periods, you can also view highest and lowest ranges based on the SMA length. If you select "Show reversals based on SMA", the indicator will display the highest and lowest values of the SMA instead of the stock itself.
Gauging Strength:
You can use this indicator to gauge strength in many ways. First of all, your ability to see where a stock is trading relative to its historically high and low technical ranges helps you determine the overall momentum of the stock. However, you can have the indicator plot the predicted high and low ranges (see image below):
The green arrows are pointing to areas where the stock is breaking past its high levels. This shows that the over-arching sentiment is bullish. However, we can see when it starts to lose steam, it stops touching the high values and starts to touch and break below the low values (red arrows). This signals to us that the stock is losing the bullish momentum and we should be alert for a reversal to the downside or upside, depending on the setup.
There are many applications you can use it for and there is a lot of customizability. Play around with it and let me know what you think, how it helps you and any suggestions for its improvement.
As always, I have prepared a quick video tutorial on getting started with the setups on the indicator which is linked below:
Thank you all for checking this out and safe trades everyone!

Previous N Days/Weeks/Months High LowJapanese below / 日本語説明は下記
This indicator displays previous N days/weeks/months’ highs and lows simultaneously.
N is user input and users can separately input different N for highs and lows.
For instance, if you would like to show past 20days high and 10days low, you specify 20 for high and 10 for low.
Similar to highs and lows of yesterday, last week and last month which I previously developed a indicator for(see the link below), highs and lows of specific terms such as quarters are also respected as supports and resistances.
A legendary trader group, Turtles also uses 20days high/low break as one of their strategies.
Alerts can be set with the conditions below.
-Crossing over previous day’s high
-Crossing under previous day’s low
-Crossing over previous week’s high
-Crossing under previous week’s low
-Crossing over previous month’s high
-Crossing under previous month’s low
Please note that when we say past 2 days in this indicator, past 2days mean yesterday and day before yesterday, so “today” is not included as “today’s” high/low have yet to be fixed.
Related indicator: High/Low Yesterday&Last week&Last month&Last Year
By combining with this indicator, you can highlight important support and resistance.
—————————————————————
過去N日/N週間/Nヶ月の高値·安値を同時に表示することのできるインジケーターです。
Nはパラメーターとなっており、また高値と安値で異なる期間を指定することができます。
例えば、過去20日間の高値と過去10日間の安値という指定が可能です。
昨日、先週、先月の高値·安値と同様に、四半期などの過去一定期間の高値·安値はサポート·レジスタンスとして良く意識されます。
伝説のトレーダー集団タートルズも20日間の高値·安値のブレイクを取引ルールの一つとして使用していたことで有名です。
また、以下の条件でアラート設定が可能です。
-過去N日高値の上方ブレイク
-過去N日安値の下方ブレイク
-過去N週間高値の上方ブレイク
-過去N週間安値の下方ブレイク
-過去Nヶ月高値の上方ブレイク
-過去Nヶ月安値の下方ブレイク
このインジケーターで過去2日間の高値·安値といった場合、過去2日間とは昨日と一昨日の2日間を指します。まだ高値·安値の確定していない本日は含まないことに注意してください。
関連インジケーター: High/Low Yesterday&Last week&Last month&Last Year
当インジケーターと合わせて使用することで、主要なサポートレジスタンスを表示することができます。
