Trading Sessions [QuantAlgo]🟢 Overview
The Trading Sessions indicator tracks and displays the four major global trading sessions: Sydney, Tokyo, London, and New York. It provides session-based background highlighting, real-time price change tracking from session open, and a data table with session status. The script works across all markets (forex, equities, commodities, crypto) and helps traders identify when specific geographic markets are active, which directly correlates with changes in liquidity and volatility patterns. Default session times are set to major financial center hours in UTC but are fully adjustable to match your trading methodology.
🟢 Key Features
→ Session Background Color Coding
Each trading session gets a distinct background color on your chart:
1. Sydney Session - Default orange, 22:00-07:00 UTC
2. Tokyo Session - Default red, 00:00-09:00 UTC
3. London Session - Default green, 08:00-16:00 UTC
4. New York Session - Default blue, 13:00-22:00 UTC
When sessions overlap, the color priority is New York > London > Tokyo > Sydney. This means if London and New York are both active, the background shows New York's color. The priority matches typical liquidity and volatility patterns where later sessions generally show higher volume.
→ Color Customization
All session colors are configurable in the Color Settings panel:
1. Click any session color input to open the color picker
2. Select your preferred color for that session
3. Use the "Background Transparency" slider (0-100) to adjust opacity. Lower values = more visible, higher values = more subtle
4. Enable "Color Price Bars" to color candlesticks themselves according to the active session instead of just the background
The Color column in the info table shows a block (█) in each session's assigned color, matching what you see on the chart background.
→ Information Table Breakdown
→ Timeframe Warning
If you're viewing a timeframe of 12 hours or higher, a red warning label appears center-screen. Session boundaries don't render accurately on high timeframes because the time() function in Pine Script can't detect intra-bar session changes when each bar spans multiple sessions. The warning tells you to switch to sub-12H timeframes (e.g., 4H, 1H, 30m, 15m, etc.) for proper session detection. You can disable this warning in Color Settings if needed, but session highlighting can be unreliable on 12H+ charts regardless.
→ Time Range Configuration
Every session's time range is editable in Session Settings:
1. Click the time input field next to each session
2. Enter time as HHMM-HHMM in 24-hour format
3. All times are interpreted as UTC
4. Modify these to account for daylight saving shifts or to define custom session periods based on your backtested optimal trading windows
For example, if your strategy performs best during London/NY overlap specifically, you could set London to 08:00-17:00 and New York to 13:00-22:00 to ensure you see the full overlap highlighted.
→ Weekdays Filter
The "Weekdays Only (Mon-Fri)" toggle controls whether sessions display on weekends:
Enabled: Sessions only show Monday-Friday and hide on Saturday-Sunday. Use this for markets that close on weekends (most equities, forex).
Disabled: Sessions display 24/7 including weekends. Use this for markets that trade continuously (crypto).
→ Table Display Options
The info table has several configuration options in Table Settings:
Visibility: Toggle "Show Info Table" on/off to display or hide the entire table.
Position: Nine position options (Top/Middle/Bottom + Left/Center/Right) let you place the table wherever it doesn't block your price action or other indicators.
Text Size: Four size options (Tiny, Small, Normal, Large) to match your screen resolution and visual preferences.
→ Color Schemes:
Mono: Black background, gray header, white text
Light: White background, light gray header, black text
Blue: Dark blue background, medium blue header, white text
Custom: Manual selection of all five color components (table background, header background, header text, data text, borders)
→ Alert Functionality
The indicator includes ten alert conditions you can access via TradingView's alert system:
Session Opens:
1. Sydney Session Started
2. Tokyo Session Started
3. London Session Started
4. New York Session Started
5. Any Session Started
Session Closes:
6. Sydney Session Ended
7. Tokyo Session Ended
8. London Session Ended
9. New York Session Ended
10. Any Session Ended
These alerts fire when sessions transition based on your configured time ranges, letting you automate monitoring of session changes without watching the chart continuously. Useful for strategies that trade specific session opens/closes or need to adjust position sizing when volatility regime shifts between sessions.
In den Scripts nach "liquidity" suchen

Forex Session TrackerForex Session Tracker - Professional Trading Session Indicator
The Forex Session Tracker is a comprehensive and visually intuitive indicator designed specifically for forex traders who need precise tracking of major global trading sessions. This powerful tool helps traders identify active market sessions, monitor session-specific price ranges, and capitalize on volatility patterns unique to each trading period.
Understanding when major financial centers are active is crucial for forex trading success. This indicator provides real-time visualization of the Tokyo, London, New York, and Sydney trading sessions, allowing traders to align their strategies with peak liquidity periods and avoid low-volatility trading windows.
---
Key Features
📊 Four Major Global Trading Sessions
The indicator tracks all four primary forex trading sessions with precision:
- Tokyo Session (Asian Market) - Captures the Asian trading hours, ideal for JPY, AUD, and NZD pairs
- London Session (European Market) - Monitors the most liquid trading period, perfect for EUR, GBP pairs
- New York Session (American Market) - Tracks US market hours, essential for USD-based currency pairs
- Sydney Session (Pacific Market) - Identifies the opening of the trading week and AUD/NZD activity
Each session is fully customizable with individual color schemes, making it easy to distinguish between different market periods at a glance.
🎯 Session Range Visualization
For each active trading session, the indicator automatically:
- Draws rectangular boxes that highlight the session's time period
- Tracks and displays session HIGH and LOW price levels in real-time
- Creates horizontal lines at session extremes for easy reference
- Positions session labels at the center of each trading period
- Updates dynamically as new highs or lows are formed within the session
This visual approach helps traders quickly identify:
- Session breakout opportunities
- Support and resistance zones formed during specific sessions
- Range-bound vs. trending session behavior
- Key price levels that institutional traders are watching
📱 Live Information Dashboard
A sleek, professional information panel displays:
- Real-time session status - Instantly see which sessions are currently active
- Color-coded indicators - Green dots for active sessions, gray for closed sessions
- Timezone information - Confirms your current timezone settings
- Customizable positioning - Place the dashboard anywhere on your chart (Top Left, Top Right, Bottom Left, Bottom Right)
- Adjustable size - Choose from Tiny, Small, Normal, or Large text sizes for optimal visibility
The dashboard provides at-a-glance awareness of market conditions without cluttering your chart analysis.
⚙️ Extensive Customization Options
Every aspect of the indicator can be tailored to your trading preferences:
Session-Specific Controls:
- Enable/disable individual sessions
- Customize colors for each trading period
- Adjust session times to match your broker's server time
- Toggle background highlighting on/off
- Show/hide session high/low lines independently
General Settings:
- UTC Offset Control - Adjust timezone from UTC-12 to UTC+14
- Exchange Timezone Option - Automatically use your chart's exchange timezone
- Background Transparency - Fine-tune the opacity of session highlighting (0-100%)
- Session Labels - Show or hide session name labels
- Information Panel - Toggle the live status dashboard on/off
Style Settings:
- Turn session backgrounds ON/OFF directly from the Style tab
- Maintain clean charts while keeping all analytical features active
🔔 Built-in Alert System
Stay informed about session openings with customizable alerts:
- Tokyo Session Started
- London Session Started
- New York Session Started
- Sydney Session Started
Set up notifications to never miss important market opening periods, even when you're away from your charts.
---
How to Use This Indicator
For Day Traders:
1. Identify High-Volatility Periods - Focus your trading during London and New York session overlaps for maximum liquidity
2. Monitor Session Breakouts - Watch for price breaks above/below session highs and lows
3. Avoid Low-Volume Periods - Recognize when major sessions are closed to avoid false signals
For Swing Traders:
1. Mark Key Levels - Use session highs and lows as support/resistance zones
2. Track Multi-Session Patterns - Observe how price behaves across different trading sessions
3. Plan Entry/Exit Points - Time your trades around session openings for better execution
For Currency-Specific Traders:
1. JPY Pairs - Focus on Tokyo session movements
2. EUR/GBP Pairs - Monitor London session activity
3. USD Pairs - Track New York session volatility
4. AUD/NZD Pairs - Watch Sydney and Tokyo sessions
---
Technical Specifications
- Pine Script Version: 5
- Overlay Indicator: Yes (displays directly on price chart)
- Maximum Bars Back: 500
- Drawing Objects: Up to 500 lines, boxes, and labels
- Performance: Optimized for real-time data processing
- Compatibility: Works on all timeframes (recommended: 5m to 1H for session tracking)
---
Installation & Setup
1. Add to Chart - Click "Add to Chart" after copying the script to Pine Editor
2. Configure Timezone - Set your UTC offset or enable "Use Exchange Timezone"
3. Customize Colors - Choose your preferred color scheme for each session
4. Adjust Display - Enable/disable features based on your trading style
5. Set Alerts - Create alert notifications for session starts
---
Best Practices
✅ Combine with Price Action - Use session ranges alongside candlestick patterns for confirmation
✅ Watch Session Overlaps - The London-New York overlap (1300-1600 UTC) typically shows highest volatility
✅ Respect Session Highs/Lows - These levels often act as intraday support and resistance
✅ Adjust for Your Broker - Verify session times match your broker's server clock
✅ Use Multiple Timeframes - View sessions on both lower (15m) and higher (1H) timeframes for context
---
Why Choose Forex Session Tracker Pro?
✨ Professional Grade Tool - Built with clean, efficient code following TradingView best practices
✨ Beginner Friendly - Intuitive design with clear visual cues
✨ Highly Customizable - Adapt every feature to match your trading style
✨ Performance Optimized - Lightweight code that won't slow down your charts
✨ Actively Maintained - Regular updates and improvements
✨ No Repainting - All visual elements are fixed once the session completes
---
Support & Updates
This indicator is designed to provide reliable, accurate session tracking for forex traders of all experience levels. Whether you're a scalper looking for high-volatility windows or a position trader marking key institutional levels, the Forex Session Tracker Pro delivers the insights you need to make informed trading decisions.
Happy Trading! 📈
---
Disclaimer
This indicator is a tool for technical analysis and should be used as part of a comprehensive trading strategy. Past performance does not guarantee future results. Always practice proper risk management and never risk more than you can afford to lose. Trading forex carries a high level of risk and may not be suitable for all investors.

Golden BOS Strategy - ChecklistA clean, mechanical on-chart checklist designed for multi-timeframe traders using the Golden BOS / Institutional Retracement Framework.
This tool helps you stay disciplined by tracking each requirement of the strategy in real time:
Included Criteria
4H Bias: Bullish or bearish macro structure
1H Structure: Push/pull phase + golden zone retracement
5M Entry Model:
Break of Structure (BOS)
5M golden zone retracement
POI validation (OB/FVG/Breaker)
Final micro BOS or rejection confirmation
Risk Filters:
Session validity (London / NY)
Red news avoidance
Stop-loss placement check
Liquidity-based target confirmation
Purpose
This overlay ensures every trade meets strict criteria before execution, removing emotion and improvisation. Ideal for backtesting, forward testing, and staying consistent during live market conditions.
Golden BOS Strategy — Description
The Golden BOS Strategy is a structured, multi-timeframe trading system designed to capture high-probability continuation moves during London and New York sessions. The strategy combines institutional concepts with Fibonacci-based retracements to identify discounted entry zones aligned with higher-timeframe direction.
Using the 4H timeframe, traders establish the daily macro bias and identify the dominant trend. The 1H chart is then used to confirm the current phase of market structure, distinguishing between impulsive “push” moves and corrective “pullback” phases. A Fibonacci retracement is applied to the most recent 1H impulse leg to define a high-value discount or premium zone where entries become valid.
Execution takes place on the 5-minute chart. Once price reaches the 1H golden zone (61.8–78.6%), a Break of Structure (BOS) is required to confirm a shift in short-term momentum. A second Fibonacci retracement is then drawn on the 5M impulse leg that caused the BOS, and price must retrace back into the 5M golden zone. Traders refine their entry using a confluence point of interest (POI) such as a Fair Value Gap (FVG), Order Block, Breaker Block, or Inverse FVG, ideally accompanied by a final micro BOS or rejection candle.
Risk management is strict and rule-driven. Stop loss is placed beyond the extreme wick of the POI, while take-profit targets are set at logical liquidity pools in the direction of the higher-timeframe trend. The strategy avoids red-folder news and only allows trades during active sessions to ensure optimal volatility and reliability.
The Golden BOS Strategy is designed to impose discipline, reduce discretionary errors, and give traders a repeatable, mechanical framework for navigating trending markets with precision.

X HL Rangedynamically maps high-low range boxes for custom time-bucket intervals without relying on security() calls. Each defined timeframe (e.g., 15-minute, 60-minute, or any user-selected value) produces a visual “range block” that captures the extremes (H/L) of price activity for that session bucket.
This tool is engineered to be lightweight, precise, and session-aware, avoiding repaint characteristics that can occur when referencing higher-timeframe candles directly. It builds the range locally in real-time, ensuring that traders always see authentic structure as it developed on the chart — not delayed or back-filled values.
The indicator can display one or both timeframes independently, with configurable display depth, color logic, and visual emphasis through fill and border toggles.
🎯 Key Features
Feature Description
Multi-timeframe bucket logic Builds range blocks locally using time calculations, not security()
Directional coloring Automatically adjusts based on up/down close of the completed range
Independent display controls Turn TF buckets on/off without affecting the other
Visual style management Independent fill + border toggles and opacity-aware color output
Historical depth control Automatically prunes oldest blocks to maintain visual clarity
Non-repainting Values are locked at bucket close and never adjusted backward
💡 Primary Use Cases
1️⃣ Intraday Structure Mapping
Traders who value intrablock liquidity zones, swing sweeps, or stop hunt regions can instantly see where price respected — or violated — previous time-based range extremes.
2️⃣ Volatility & Regime Shift Detection
Rapid compression or expansion across sequential blocks can be used to identify:
Transition from balance → imbalance
Trend exhaustion and reversal
The start of new initiative moves
3️⃣ Confluence Layering with:
VWAP (session, anchored, rolling)
Market profile / volume nodes
Opening range breakout systems
Session order flow frameworks
Mean-reversion and ATR-based models
Stacking multiple intervals (e.g., 15-min micro-range + 60-min macro-range) can highlight nested liquidity pockets, similar to structural mapping seen in professional execution models.

Swing Wicks + Bodies; Stolen from LeviathanSwing Wicks + Bodies — Stolen from Leviathan
This indicator automatically detects swing highs and lows by separating wick swings from body swings, providing a precise view of liquidity zones on the chart.
It draws:
• wick-based swing levels
• body-based swing levels
• dynamic liquidity boxes showing unfilled price zones
• touch counters (T1, T2, T3…)
• optional HTF levels (H1/H4…) for multi-timeframe context
Included features:
• hide filled levels
• keep only the most recent unfilled levels
• full customization (colors, line styles, text size, minimum box height)
• optional “extend until filled” mode
• volume threshold filter
• lookback limitation (history in days)

Quantum Market Analyzer X7Quantum Market Analyzer X7 - Complete Study Guide
Table of Contents
1. Overview
2. Indicator Components
3. Signal Interpretation
4. Live Market Analysis Guide
5. Best Practices
6. Limitations and Considerations
7. Risk Disclaimer
________________________________________
Overview
The Quantum Market Analyzer X7 is a comprehensive multi-timeframe technical analysis indicator that combines traditional and modern analytical methods. It aggregates signals from multiple technical indicators across seven key analysis categories to provide traders with a consolidated view of market sentiment and potential trading opportunities.
Key Features:
• Multi-Indicator Analysis: Combines 20+ technical indicators
• Real-Time Dashboard: Professional interface with customizable display
• Signal Aggregation: Weighted scoring system for overall market sentiment
• Advanced Analytics: Includes Order Block detection, Supertrend, and Volume analysis
• Visual Progress Indicators: Easy-to-read progress bars for signal strength
________________________________________
Indicator Components
1. Oscillators Section
Purpose: Identifies overbought/oversold conditions and momentum changes
Included Indicators:
• RSI (14): Relative Strength Index - momentum oscillator
• Stochastic (14): Compares closing price to price range
• CCI (20): Commodity Channel Index - cycle identification
• Williams %R (14): Momentum indicator similar to Stochastic
• MACD (12,26,9): Moving Average Convergence Divergence
• Momentum (10): Rate of price change
• ROC (9): Rate of Change
• Bollinger Bands (20,2): Volatility-based indicator
Signal Interpretation:
• Strong Buy (6+ points): Multiple oscillators indicate oversold conditions
• Buy (2-5 points): Moderate bullish momentum
• Neutral (-1 to 1 points): Balanced conditions
• Sell (-2 to -5 points): Moderate bearish momentum
• Strong Sell (-6+ points): Multiple oscillators indicate overbought conditions
2. Moving Averages Section
Purpose: Determines trend direction and strength
Included Indicators:
• SMA: 10, 20, 50, 100, 200 periods
• EMA: 10, 20, 50 periods
Signal Logic:
• Price >2% above MA = Strong Buy (+2)
• Price above MA = Buy (+1)
• Price below MA = Sell (-1)
• Price >2% below MA = Strong Sell (-2)
Signal Interpretation:
• Strong Buy (6+ points): Price well above multiple MAs, strong uptrend
• Buy (2-5 points): Price above most MAs, bullish trend
• Neutral (-1 to 1 points): Mixed MA signals, consolidation
• Sell (-2 to -5 points): Price below most MAs, bearish trend
• Strong Sell (-6+ points): Price well below multiple MAs, strong downtrend
3. Order Block Analysis
Purpose: Identifies institutional support/resistance levels and breakouts
How It Works:
• Detects historical levels where large orders were placed
• Monitors price behavior around these levels
• Identifies breakouts from established order blocks
Signal Types:
• BULLISH BRK (+2): Breakout above resistance order block
• BEARISH BRK (-2): Breakdown below support order block
• ABOVE SUP (+1): Price holding above support
• BELOW RES (-1): Price rejected at resistance
• NEUTRAL (0): No significant order block interaction
4. Supertrend Analysis
Purpose: Trend following indicator based on Average True Range
Parameters:
• ATR Period: 10 (default)
• ATR Multiplier: 6.0 (default)
Signal Types:
• BULLISH (+2): Price above Supertrend line
• BEARISH (-2): Price below Supertrend line
• NEUTRAL (0): Transition period
5. Trendline/Channel Analysis
Purpose: Identifies trend channels and breakout patterns
Components:
• Dynamic trendline calculation using pivot points
• Channel width based on historical volatility
• Breakout detection algorithm
Signal Types:
• UPPER BRK (+2): Breakout above upper channel
• LOWER BRK (-2): Breakdown below lower channel
• ABOVE MID (+1): Price above channel midline
• BELOW MID (-1): Price below channel midline
6. Volume Analysis
Purpose: Confirms price movements with volume data
Components:
• Volume spikes detection
• On Balance Volume (OBV)
• Volume Price Trend (VPT)
• Money Flow Index (MFI)
• Accumulation/Distribution Line
Signal Calculation: Multiple volume indicators are combined to determine institutional activity and confirm price movements.
________________________________________
Signal Interpretation
Overall Summary Signals
The indicator aggregates all component signals into an overall market sentiment:
Signal Score Range Interpretation Action
STRONG BUY 10+ Overwhelming bullish consensus Consider long positions
BUY 4-9 Moderate to strong bullish bias Look for long opportunities
NEUTRAL -3 to 3 Mixed signals, consolidation Wait for clearer direction
SELL -4 to -9 Moderate to strong bearish bias Look for short opportunities
STRONG SELL -10+ Overwhelming bearish consensus Consider short positions
Progress Bar Interpretation
• Filled bars indicate signal strength
• Green bars: Bullish signals
• Red bars: Bearish signals
• More filled bars = stronger conviction
________________________________________
Live Market Analysis Guide
Step 1: Initial Assessment
1. Check Overall Summary: Start with the main signal
2. Verify with Component Analysis: Ensure signals align
3. Look for Divergences: Identify conflicting signals
Step 2: Timeframe Analysis
1. Set Appropriate Timeframe: Use 1H for intraday, 4H/1D for swing trading
2. Multi-Timeframe Confirmation: Check higher timeframes for trend context
3. Entry Timing: Use lower timeframes for precise entry points
Step 3: Signal Confirmation Process.
For Buy Signals:
1. Oscillators: Look for oversold conditions (RSI <30, Stoch <20)
2. Moving Averages: Price should be above key MAs
3. Order Blocks: Confirm bounce from support levels
4. Volume: Check for accumulation patterns
5. Supertrend: Ensure bullish trend alignment.
For Sell Signals:
1. Oscillators: Look for overbought conditions (RSI >70, Stoch >80)
2. Moving Averages: Price should be below key MAs
3. Order Blocks: Confirm rejection at resistance levels
4. Volume: Check for distribution patterns
5. Supertrend: Ensure bearish trend alignment.
Step 4: Risk Management Integration
1. Signal Strength Assessment: Stronger signals = larger position size
2. Stop Loss Placement: Use Order Block levels for stops
3. Take Profit Targets: Based on channel analysis and resistance levels
4. Position Sizing: Adjust based on signal confidence
________________________________________
Best Practices
Entry Strategies
1. High Conviction Entries: Wait for STRONG BUY/SELL signals
2. Confluence Trading: Look for multiple components aligning
3. Breakout Trading: Use Order Block and Trendline breakouts
4. Trend Following: Align with Supertrend direction.
Risk Management
1. Never Risk More Than 2% Per Trade: Regardless of signal strength
2. Use Stop Losses: Place at invalidation levels
3. Scale Positions: Stronger signals warrant larger (but still controlled) positions
4. Diversification: Don't rely solely on one indicator.
Market Conditions
1. Trending Markets: Focus on Supertrend and MA signals
2. Range-Bound Markets: Emphasize Oscillator and Order Block signals
3. High Volatility: Reduce position sizes, widen stops
4. Low Volume: Be cautious of breakout signals.
Common Mistakes to Avoid
1. Signal Chasing: Don't enter after signals have already moved significantly
2. Ignoring Context: Consider overall market conditions
3. Overtrading: Wait for high-quality setups
4. Poor Risk Management: Always use appropriate position sizing
________________________________________
Limitations and Considerations
Technical Limitations
1. Lagging Nature: All technical indicators are based on historical data
2. False Signals: No indicator is 100% accurate
3. Market Regime Changes: Indicators may perform differently in various market conditions
4. Whipsaws: Possible in choppy, sideways markets.
Optimal Use Cases
1. Trending Markets: Performs best in clear trending environments
2. Medium to High Volatility: Requires sufficient price movement for signals
3. Liquid Markets: Works best with adequate volume and tight spreads
4. Multiple Timeframe Analysis: Most effective when used across different timeframes.
When to Use Caution
1. Major News Events: Fundamental analysis may override technical signals
2. Market Opens/Closes: Higher volatility can create false signals
3. Low Volume Periods: Signals may be less reliable
4. Holiday Trading: Reduced participation affects signal quality
________________________________________
Risk Disclaimer
IMPORTANT LEGAL DISCLAIMER FROM aiTrendview
WARNING: TRADING INVOLVES SUBSTANTIAL RISK OF LOSS
This Quantum Market Analyzer X7 indicator ("the Indicator") is provided for educational and informational purposes only. By using this indicator, you acknowledge and agree to the following terms:
No Investment Advice
• The Indicator does NOT constitute investment advice, financial advice, or trading recommendations
• All signals generated are based on historical price data and mathematical calculations
• Past performance does not guarantee future results
• No representation is made that any account will achieve profits or losses similar to those shown.
Risk Acknowledgment
• TRADING CARRIES SUBSTANTIAL RISK: You may lose some or all of your invested capital
• LEVERAGE AMPLIFIES RISK: Margin trading can result in losses exceeding your initial investment
• MARKET VOLATILITY: Financial markets are inherently unpredictable and volatile
• TECHNICAL ANALYSIS LIMITATIONS: No technical indicator is infallible or guarantees profitable trades.
User Responsibility
• YOU ARE SOLELY RESPONSIBLE for all trading decisions and their consequences
• CONDUCT YOUR OWN RESEARCH: Always perform independent analysis before making trading decisions
• CONSULT PROFESSIONALS: Seek advice from qualified financial advisors
• RISK MANAGEMENT: Implement appropriate risk management strategies
No Warranties
• The Indicator is provided "AS IS" without warranties of any kind
• aiTrendview makes no representations about the accuracy, reliability, or suitability of the Indicator
• Technical glitches, data feed issues, or calculation errors may occur
• The Indicator may not work as expected in all market conditions.
Limitation of Liability
• aiTrendview SHALL NOT BE LIABLE for any direct, indirect, incidental, or consequential damages
• This includes but is not limited to: trading losses, missed opportunities, data inaccuracies, or system failures
• MAXIMUM LIABILITY is limited to the amount paid for the indicator (if any)
Code Usage and Distribution
• This indicator is published on TradingView in accordance with TradingView's house rules
• UNAUTHORIZED MODIFICATION or redistribution of this code is prohibited
• Users may not claim ownership of this intellectual property
• Commercial use requires explicit written permission from aiTrendview.
Compliance and Regulations
• VERIFY LOCAL REGULATIONS: Ensure compliance with your jurisdiction's trading laws
• Some trading strategies may not be suitable for all investors
• Tax implications of trading are your responsibility
• Report trading activities as required by law
Specific Risk Factors
1. False Signals: The Indicator may generate incorrect buy/sell signals
2. Market Gaps: Overnight gaps can invalidate technical analysis
3. Fundamental Events: News and economic data can override technical signals
4. Liquidity Risk: Some markets may have insufficient liquidity
5. Technology Risk: Platform failures or connectivity issues may prevent order execution.
Professional Trading Warning
• THIS IS NOT PROFESSIONAL TRADING SOFTWARE: Not intended for institutional or professional trading
• NO REGULATORY APPROVAL: This indicator has not been approved by any financial regulatory authority
• EDUCATIONAL PURPOSE: Designed primarily for learning technical analysis concepts
FINAL WARNING
NEVER INVEST MONEY YOU CANNOT AFFORD TO LOSE
Trading financial instruments involves significant risk. The majority of retail traders lose money. Before using this indicator in live trading:
1. Practice on paper/demo accounts extensively
2. Start with small position sizes
3. Develop a comprehensive trading plan
4. Implement strict risk management rules
5. Continuously educate yourself about market dynamics
By using the Quantum Market Analyzer X7, you acknowledge that you have read, understood, and agree to this disclaimer. You assume full responsibility for all trading decisions and their outcomes.
Contact: For questions about this disclaimer or the indicator, contact aiTrendview through official TradingView channels only.
________________________________________
This study guide and indicator are published on TradingView in compliance with TradingView's community guidelines and house rules. All users must adhere to TradingView's terms of service when using this indicator.
Document Version: 1.0
Publisher: aiTrendview
________________________________________
Disclaimer
The content provided in this blog post is for educational and training purposes only. It is not intended to be, and should not be construed as, financial, investment, or trading advice. All charting and technical analysis examples are for illustrative purposes. Trading and investing in financial markets involve substantial risk of loss and are not suitable for every individual. Before making any financial decisions, you should consult with a qualified financial professional to assess your personal financial situation.

SP500 Session Gap Fade StrategySummary in one paragraph
SPX Session Gap Fade is an intraday gap fade strategy for index futures, designed around regular cash sessions on five minute charts. It helps you participate only when there is a full overnight or pre session gap and a valid intraday session window, instead of trading every open. The original part is the gap distance engine which anchors both stop and optional target to the previous session reference close at a configurable flat time, so every trade’s risk scales with the actual gap size rather than a fixed tick stop.
Scope and intent
• Markets. Primarily index futures such as ES, NQ, YM, and liquid index CFDs that exhibit overnight gaps and regular cash hours.
• Timeframes. Intraday timeframes from one minute to fifteen minutes. Default usage is five minute bars.
• Default demo used in the publication. Symbol CME:ES1! on a five minute chart.
• Purpose. Provide a simple, transparent way to trade opening gaps with a session anchored risk model and forced flat exit so you are not holding into the last part of the session.
• Limits. This is a strategy. Orders are simulated on standard candles only.
Originality and usefulness
• Unique concept or fusion. The core novelty is the combination of a strict “full gap” entry condition with a session anchored reference close and a gap distance based TP and SL engine. The stop and optional target are symmetric multiples of the actual gap distance from the previous session’s flat close, rather than fixed ticks.
• Failure mode it addresses. Fixed sized stops do not scale when gaps are unusually small or unusually large, which can either under risk or over risk the account. The session flat logic also reduces the chance of holding residual positions into late session liquidity and news.
• Testability. All key pieces are explicit in the Inputs: session window, minutes before session end, whether to use gap exits, whether TP or SL are active, and whether to allow candle based closes and forced flat. You can toggle each component and see how it changes entries and exits.
• Portable yardstick. The main unit is the absolute price gap between the entry bar open and the previous session reference close. tp_mult and sl_mult are multiples of that gap, which makes the risk model portable across contracts and volatility regimes.
Method overview in plain language
The strategy first defines a trading session using exchange time, for example 08:30 to 15:30 for ES day hours. It also defines a “flat” time a fixed number of minutes before session end. At the flat bar, any open position is closed and the bar’s close price is stored as the reference close for the next session. Inside the session, the strategy looks for a full gap bar relative to the prior bar: a gap down where today’s high is below yesterday’s low, or a gap up where today’s low is above yesterday’s high. A full gap down generates a long entry; a full gap up generates a short entry. If the gap risk engine is enabled and a valid reference close exists, the strategy measures the distance between the entry bar open and that reference close. It then sets a stop and optional target as configurable multiples of that gap distance and manages them with strategy.exit. Additional exits can be triggered by a candle color flip or by the forced flat time.
Base measures
• Range basis. The main unit is the absolute difference between the current entry bar open and the stored reference close from the previous session flat bar. That value is used as a “gap unit” and scaled by tp_mult and sl_mult to build the target and stop.
Components
• Component one: Gap Direction. Detects full gap up or full gap down by comparing the current high and low to the previous bar’s high and low. Gap down signals a long fade, gap up signals a short fade. There is no smoothing; it is a strict structural condition.
• Component two: Session Window. Only allows entries when the current time is within the configured session window. It also defines a flat time before the session end where positions are forced flat and the reference close is updated.
• Component three: Gap Distance Risk Engine. Computes the absolute distance between the entry open and the stored reference close. The stop and optional target are placed as entry ± gap_distance × multiplier so that risk scales with gap size.
• Optional component: Candle Exit. If enabled, a bullish bar closes short positions and a bearish bar closes long positions, which can shorten holding time when price reverses quickly inside the session.
• Session windows. Session logic uses the exchange time of the chart symbol. When changing symbols or venues, verify that the session time string still matches the new instrument’s cash hours.
Fusion rule
All gates are hard conditions rather than weighted scores. A trade can only open if the session window is active and the full gap condition is true. The gap distance engine only activates if a valid reference close exists and use_gap_risk is on. TP and SL are controlled by separate booleans so you can use SL only, TP only, or both. Long and short are symmetric by construction: long trades fade full gap downs, short trades fade full gap ups with mirrored TP and SL logic.
Signal rule
• Long entry. Inside the active session, when the current bar shows a full gap down relative to the previous bar (current high below prior low), the strategy opens a long position. If the gap risk engine is active, it places a gap based stop below the entry and an optional target above it.
• Short entry. Inside the active session, when the current bar shows a full gap up relative to the previous bar (current low above prior high), the strategy opens a short position. If the gap risk engine is active, it places a gap based stop above the entry and an optional target below it.
• Forced flat. At the configured flat time before session end, any open position is closed and the close price of that bar becomes the new reference close for the following session.
• Candle based exit. If enabled, a bearish bar closes longs, and a bullish bar closes shorts, regardless of where TP or SL sit, as long as a position is open.
What you will see on the chart
• Markers on entry bars. Standard strategy entry markers labeled “long” and “short” on the gap bars where trades open.
• Exit markers. Standard exit markers on bars where either the gap stop or target are hit, or where a candle exit or forced flat close occurs. Exit IDs “long_gap” and “short_gap” label gap based exits.
• Reference levels. Horizontal lines for the current long TP, long SL, short TP, and short SL while a position is open and the gap engine is enabled. They update when a new trade opens and disappear when flat.
• Session background. This version does not add background shading for the session; session logic runs internally based on time.
• No on chart table. All decisions are visible through orders and exit levels. Use the Strategy Tester for performance metrics.
Inputs with guidance
Session Settings
• Trading session (sess). Session window in exchange time. Typical value uses the regular cash session for each contract, for example “0830-1530” for ES. Adjust if your broker or symbol uses different hours.
• Minutes before session end to force exit (flat_before_min). Minutes before the session end where positions are forced flat and the reference close is stored. Typical range is 15 to 120. Raising it closes trades earlier in the day; lowering it allows trades later in the session.
Gap Risk
• Enable gap based TP/SL (use_gap_risk). Master switch for the gap distance exit engine. Turning it off keeps entries and forced flat logic but removes automatic TP and SL placement.
• Use TP limit from gap (use_gap_tp). Enables gap based profit targets. Typical values are true for structured exits or false if you want to manage exits manually and only keep a stop.
• Use SL stop from gap (use_gap_sl). Enables gap based stop losses. This should normally remain true so that each trade has a defined initial risk in ticks.
• TP multiplier of gap distance (tp_mult). Multiplier applied to the gap distance for the target. Typical range is 0.5 to 2.0. Raising it places the target further away and reduces hit frequency.
• SL multiplier of gap distance (sl_mult). Multiplier applied to the gap distance for the stop. Typical range is 0.5 to 2.0. Raising it widens the stop and increases risk per trade; lowering it tightens the stop and may increase the number of small losses.
Exit Controls
• Exit with candle logic (use_candle_exit). If true, closes shorts on bullish candles and longs on bearish candles. Useful when you want to react to intraday reversal bars even if TP or SL have not been reached.
• Force flat before session end (use_forced_flat). If true, guarantees you are flat by the configured flat time and updates the reference close. Turn this off only if you understand the impact on overnight risk.
Filters
There is no separate trend or volatility filter in this version. All trades depend on the presence of a full gap bar inside the session. If you need extra filtering such as ATR, volume, or higher timeframe bias, they should be added explicitly and documented in your own fork.
Usage recipes
Intraday conservative gap fade
• Timeframe. Five minute chart on ES regular session.
• Gap risk. use_gap_risk = true, use_gap_tp = true, use_gap_sl = true.
• Multipliers. tp_mult around 0.7 to 1.0 and sl_mult around 1.0.
• Exits. use_candle_exit = false, use_forced_flat = true. Focus on the structured TP and SL around the gap.
Intraday aggressive gap fade
• Timeframe. Five minute chart.
• Gap risk. use_gap_risk = true, use_gap_tp = false, use_gap_sl = true.
• Multipliers. sl_mult around 0.7 to 1.0.
• Exits. use_candle_exit = true, use_forced_flat = true. Entries fade full gaps, stops are tight, and candle color flips flatten trades early.
Higher timeframe gap tests
• Timeframe. Fifteen minute or sixty minute charts on instruments with regular gaps.
• Gap risk. Keep use_gap_risk = true. Consider slightly higher sl_mult if gaps are structurally wider on the higher timeframe.
• Note. Expect fewer trades and be careful with sample size; multi year data is recommended.
Properties visible in this publication
• On average our risk for each position over the last 200 trades is 0.4% with a max intraday loss of 1.5% of the total equity in this case of 100k $ with 1 contract ES. For other assets, recalculations and customizations has to be applied.
• Initial capital. 100 000.
• Base currency. USD.
• Default order size method. Fixed with size 1 contract.
• Pyramiding. 0.
• Commission. Flat 2 USD per order in the Strategy Tester Properties. (2$ buying + 2$selling)
• Slippage. One tick in the Strategy Tester Properties.
• Process orders on close. ON.
Realism and responsible publication
• No performance claims are made. Past results do not guarantee future outcomes.
• Costs use a realistic flat commission and one tick of slippage per trade for ES class futures.
• Default sizing with one contract on a 100 000 reference account targets modest per trade risk. In practice, extreme slippage or gap through events can exceed this, so treat the one and a half percent risk target as a design goal, not a guarantee.
• All orders are simulated on standard candles. Shapes can move while a bar is forming and settle on bar close.
Honest limitations and failure modes
• Economic releases, thin liquidity, and limit conditions can break the assumptions behind the simple gap model and lead to slippage or skipped fills.
• Symbols with very frequent or very large gaps may require adjusted multipliers or alternative risk handling, especially in high volatility regimes.
• Very quiet periods without clean gaps will produce few or no trades. This is expected behavior, not a bug.
• Session windows follow the exchange time of the chart. Always confirm that the configured session matches the symbol.
• When both the stop and target lie inside the same bar’s range, the TradingView engine decides which is hit first based on its internal intrabar assumptions. Without bar magnifier, tie handling is approximate.
Legal
Education and research only. This strategy is not investment advice. You remain responsible for all trading decisions. Always test on historical data and in simulation with realistic costs before considering any live use.

Absorption DetectorAbsorption Detector is a clean and effective tool designed to identify institutional absorption at key turning points of the market.
It highlights candles where volume surges but the real body remains small, indicating potential absorption of liquidity before a reversal move.
Key Features
Volume Spike Detection – identifies abnormal increases in traded volume
Small Body Recognition – pinpoints candles with low real-body percentage
Delta Simulation (Fake Delta) – uses close–open behavior to approximate bullish/bearish delta
Bullish Absorption – highlights potential low-side absorption (green dots + green candles)
Bearish Absorption – highlights potential high-side absorption (red dots + red candles)
Background Highlighting – visual emphasis on absorption zones
Clean, lightweight and non-repainter
How It Helps
Absorption often occurs before strong moves:
Large players fill opposite orders
Stops are triggered and absorbed
Liquidity on one side dries up
Reversal or continuation moves follow
This indicator makes it easy to spot these moments in real time.

XAUUSD Pro Setup Suite manuel_lnt.fx is an advanced Pine Script v6 indicator designed exclusively for XAUUSD, built to automatically detect the 5 highest-probability setups in gold day trading.
It combines institutional price action, volatility patterns, mean reversion logic, and momentum confirmation to generate clean, filtered, and actionable signals.
The indicator automatically detects:
⸻
1️⃣ Break & Retest Premium (BR)
Identifies valid breaks of key levels and signals the retest with rejection wick, EMA20 trend confirmation, and neutral RSI.
→ Excellent for trend continuation.
⸻
2️⃣ Fakeout Liquidity Trap (FO)
Detects liquidity grabs above highs or below lows with an opposite close + engulfing candle confirmation.
→ The strongest setup for fast and explosive reversals on gold.
⸻
3️⃣ MACD Zero-Line Shift (MACD)
Signals when the MACD crosses the zero line while price breaks micro-structure.
→ Perfect for spotting the start of a new trend.
⸻
4️⃣ Bollinger Squeeze → Breakout (BB)
Recognizes volatility compression and signals when a breakout is likely to explode.
→ Ideal for clean breakout trades.
⸻
5️⃣ Mean Reversion on EMA50 (MR)
Highlights price extensions far away from the EMA50 with ATR confirmation and a reversal candle.
→ Great for pullbacks back toward the mean value.

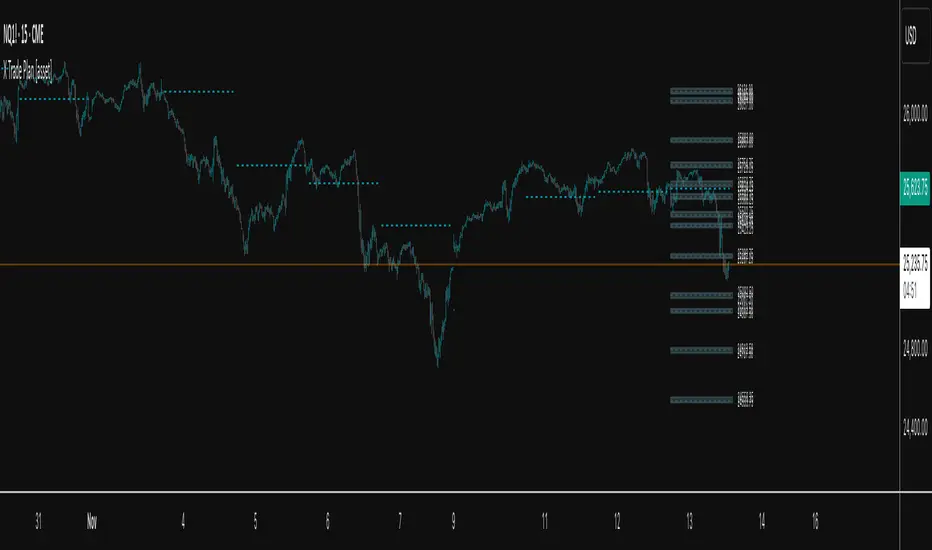
X Trade Plan [asset]A precision-structured execution framework designed to identify, map, and visualize targeted areas of interest derived from prior end-of-day AVWAP levels. These areas represent historically important zones where order flow has previously rotated, absorbed, or redistributed—making them highly relevant for future intraday decision-making.
This tool is intended to work in direct combination with the X Tail that Wags indicator, which calculates and projects the previous session’s ending AVWAP forward into the next trading day. The projected end-of-day AVWAP levels serve as a backbone for this Trade Plan: each level is wrapped, extended, and visually organized into a standardized zone structure that the trader can interpret quickly and consistently.
Purpose and Core Concept
Markets consistently respond to prior session value. The end-of-day AVWAP reflects the final consensus price where volume and time-weighted participation reached equilibrium before the session closed. When carried forward, these levels often act as real-world:
Reversion points
Liquidity pockets
Control centers
Continuation or rejection pivots
Absorption shelves and distribution tops
By framing these AVWAP-derived levels into controlled ranges—each with a slight configurable margin—the indicator transforms abstract numbers into objective, visually actionable trading zones.
How This Indicator Works
The user inputs up to fifteen prior AVWAP levels that came from X Tail that Wags’ “Previous End-of-Day AVWAP” readouts. For each active level, X Trade Plan automatically:
Builds a structured zone around the AVWAP using a user-defined ± margin
Draws a filled box from the anchor bar forward a customizable distance
Adds optional top/bottom price labels for precision
Optionally draws a mid-line representing the core of the zone
Displays custom text labels for classification, notes, or tiering
Refreshes anchor points at user-selected higher-timeframe boundaries (e.g., Daily) so zones “reset cleanly” at each new session
Everything is designed to ensure consistent, non-overlapping, visually efficient zones that maintain chart clarity even when multiple levels are active.
Intended Use in a Trade Plan
This indicator is not a signal generator.
It is a structural mapping tool designed for traders who build a daily plan around:
1. Prior Value → Future Reaction
Price commonly retests, respects, or rejects previous session AVWAP levels. These zones act as tactical reference points to evaluate:
Whether price is accepting value
Rejecting value
Targeting inefficiencies
Passing through low-resistance channels
2. Defining Areas of Interest (AOIs)
Each zone identifies where:
Positioning from previous sessions may still exist
Liquidity may sit
Algorithmic systems often pivot
High-volume traders previously accumulated or distributed
3. Enhancing Bias and Scenario Planning
When used with X Tail that Wags, traders can combine:
Current session AVWAP direction
Prior session ending AVWAP levels
The constructed Trade Plan zones
to produce:
Meaningful upside/downside targets
Control-center ranges
Lean / location for entries
Expected reaction points
This synergy turns raw historical AVWAP data into actionable structure.
Why These Levels Matter
End-of-day AVWAP levels are powerful because they encapsulate:
The final “fair value” of the prior session
Where the most volume-weighted agreement occurred
Where institutional inventory was likely set or hedged
The price many algos and funds benchmark against
When the next session opens, these prior value levels serve as magnets and decision boundaries, helping traders anticipate:
High-probability pullback zones
Reversals off previous value
Break-and-go continuation levels
Failure points where trapped participants are forced to exit
Summary
X Trade Plan
𝑎
𝑠
𝑠
𝑒
𝑡
asset transforms prior AVWAP levels—sourced from X Tail that Wags—into a structured visual map of the market’s most relevant historical value areas. These zones are used to shape a deliberate, rules-based Trade Plan that identifies where the market is likely to react, pause, rotate, or accelerate during the current session.
When paired with X Tail that Wags, this indicator provides a powerful, integrated workflow for traders who rely on value-based context, precise levels, and scenario-driven preparation.
SJ Fx Session RangeSJ Fx Session Range Indicator
A Professional Forex Session Tracking Tool with Opening Range Analysis
Overview
The SJ Fx Session Range indicator is a comprehensive tool designed to help forex traders visualize major trading sessions (Asia, Europe+London, and New York) along with their first 15-minute opening ranges. Built with Pine Script v5, this indicator provides clear session boundaries, high/low ranges, and customizable opening range analysis to enhance your trading decisions.
Key Features
1. Trading Session Boxes
- Three major forex sessions: Asia, Europe+London, and New York
- Color-coded session boxes with transparent backgrounds for easy visualization
- Automatic session high/low tracking
- Session labels displayed inside boxes for quick identification
- Displays up to 50 historical sessions for pattern analysis
2. Opening Range Analysis
- Tracks first 15-minute opening range for Europe, London, and NY sessions
- Plots high, low, and mid-range levels
- Customizable line colors for each session's opening range
- Background highlights during the first 15 minutes of each session
- Helps identify potential breakout or reversal zones
3. Daylight Saving Time Support
- Built-in DST toggle for easy seasonal adjustment
- Automatically adjusts all session timings by 1 hour when enabled
- Clear tooltip instructions for when to enable/disable DST
- Default timings configured for IST timezone (Asia/Kolkata)
4. User-Friendly Design
- Clean input interface organized by session categories
- Fixed optimal settings for boxes and lines (50-day history)
- All session times are easily customizable with helpful tooltips
- Warning tooltips to prevent accidental timing changes
Default Session Times (when DST is disabled)
- Asia Session: 04:00 - 12:30 IST
- Europe + London Session: 12:30 - 20:00 IST
- New York Session: 20:00 - 02:30 IST
How to Use
1. Add to Chart: Apply the indicator to any forex pair chart
2. Adjust DST: Enable the "Start Daylight Saving Time Change" checkbox on the second Sunday in March; disable on the first Sunday in November
3. Customize Sessions: Toggle individual sessions on/off based on your trading preference
4. Opening Range Colors: Customize the opening range line colors for better visibility
5. Session Times: Default times are optimized for IST; modify only if trading from a different timezone
Technical Specifications
- Version: Pine Script v5
- Overlay: Yes (draws directly on price chart)
- Maximum Objects: 500 boxes, 500 lines
- History: 50 days of session data
- Timezone: Asia/Kolkata (IST) - customizable in code
Use Cases
- Identify high-liquidity trading periods
- Track session volatility patterns
- Monitor opening range breakouts/breakdowns
- Analyze session-specific price action
- Plan entries around major session opens
- Avoid trading during low-liquidity periods
Performance
Optimized for efficient rendering with:
- Fixed 50-day history limit for optimal performance
- Automatic cleanup of old session boxes and lines
- Lightweight code structure for fast chart loading
Customization Options
Available Inputs:
- Enable/disable individual sessions
- Adjust session timings (with safety tooltips)
- Toggle DST on/off
- Show/hide opening range analysis
- Customize opening range line colors for each session
Fixed for Optimal Performance:
- Session box colors (Asia: Aqua, Europe: Green, NY: Red)
- 50-day historical display
- Line width and style
- Mid-range line always displayed
Educational Value
This indicator helps traders:
- Understand forex market structure and session overlaps
- Recognize high-probability trading times
- Develop session-based trading strategies
- Improve timing of trade entries and exits
Open Source License
This script is published under Mozilla Public License 2.0, allowing you to:
- Use freely for personal trading
- Modify and adapt to your needs
- Learn from the code structure
- Share improvements with the community
Credits
Developed by Shantanu Joshi
- Designed for forex traders focusing on session-based strategies
- Built with clean, well-documented Pine Script v5 code
- Regular updates and improvements based on user feedback
Support & Feedback
If you find this indicator useful:
- Give it a thumbs up
- Share your trading results in the comments
- Suggest improvements or new features
- Report any issues for quick resolution
Disclaimer
This indicator is for educational and informational purposes only. It does not constitute financial advice. Always conduct your own research and risk management before making trading decisions. Past performance does not guarantee future results.
Compatible with: CFDs of forex pairs, commodities, indices, and crypto.
Best used on: 5-minutes
Recommended chart type: Candlestick charts

Average Candle Body (24h Rolling)This indicator calculates the average size of candle bodies (|Close – Open|) over the last 24 hours, regardless of your current chart timeframe.
Unlike ATR or ADR, which measure total range (High – Low) or day-to-day volatility, this tool focuses purely on the real body size of candles — a more accurate representation of in-session price momentum and liquidity activity.
🔍 How it works
The script automatically determines how many candles represent the last 24 hours based on your current timeframe (e.g. 288 candles on a 5-minute chart).
It then computes a Simple Moving Average (SMA) of the absolute candle body size across that rolling 24-hour window.
Optionally, the script also plots the current candle body size as a grey histogram for quick comparison.
⚙️ Use cases
Gauge intraday volatility based on average body movement rather than wicks.
Build dynamic stop-loss models (e.g., Stop = 1.2 × AverageBodySize).
Detect periods of compression or expansion in price action.
Filter or confirm setups (e.g., only trade when candle bodies exceed their 24 h average).
📈 Displayed elements
Orange line: average candle body size (rolling 24 hours)
Grey histogram: current candle body size for each bar
Works automatically across all timeframes and assets (crypto, forex, indices, etc.)
💡 Pro tip
This indicator pairs exceptionally well with:
EMA-based momentum systems (e.g. EMA 8/21 crosses)
Session-based reversal or sweep strategies (Asia-London transitions)
VWAP or liquidity-based frameworks where candle compression matters
📘 How to Interpret
When the orange line (24h average candle body) is rising, it indicates that average body sizes are expanding — signaling increasing intraday momentum and participation. This often aligns with periods of higher volatility, stronger trends, or major session opens (London/New York).
When the orange line is falling, it shows contracting body sizes, meaning the market is entering consolidation, reduced volatility, or indecision. Such periods often precede major breakouts or reversals.
Use this reading to:
Avoid false breakouts during low-body periods.
Tighten or widen stops based on real-time market compression or expansion.
Confirm reversals: a shrinking average body after a strong impulse can signal momentum exhaustion.

Smart VWAP FVG SystemSmart VWAP FVG System - Professional Multi-Filter Trading Indicator
📊 OVERVIEW
The Smart VWAP FVG System is an advanced multi-layered trading indicator that combines institutional volume analysis, multi-timeframe VWAP trend confirmation, and Fair Value Gap detection to identify high-probability trade entries. This indicator uses a sophisticated filtering mechanism where signals appear only when multiple independent confirmation criteria align simultaneously.
Recommended Timeframe: 5-minute (M5) or higher. The indicator works best on M5, M15, and M30 charts for intraday trading.
🎯 ORIGINALITY & PURPOSE
This indicator is original because it combines three distinct analytical methods into a unified decision-making system:
Market Profile Volume Analysis - Identifies institutional accumulation/distribution zones
Dual VWAP Filtering - Confirms trend direction using two independent VWAP calculations
Fair Value Gap Detection - Validates institutional interest through price inefficiency zones
The key innovation is the directional filter system: the primary Market Profile generates BUY-ONLY or SELL-ONLY states based on higher timeframe value area reversals, which then controls which signals from the main system are displayed. This creates a multi-timeframe confluence that significantly reduces false signals.
Unlike simple indicator mashups, each component serves a specific purpose:
Market Profile → Direction bias (trend filter)
Primary VWAP (Session) → Short-term trend confirmation
Secondary VWAP (Week) → Medium-term trend confirmation
FVG Detection → Institutional activity validation
🔧 HOW IT WORKS
1. Primary Market Profile Filter (Higher Timeframe)
The indicator calculates Market Profile on a higher timeframe (default: 1 hour) to determine the overall market structure:
Value Area High (VAH): Top 70% of volume distribution
Value Area Low (VAL): Bottom 70% of volume distribution
Point of Control (POC): Price level with highest volume
When price reaches VAH and reverses down → SELL-ONLY mode activated
When price reaches VAL and reverses up → BUY-ONLY mode activated
This higher timeframe filter ensures you're trading in the direction of institutional flow.
2. Dual VWAP System
Two independent VWAP calculations provide multi-timeframe trend confirmation:
Primary VWAP (Session-based): Resets daily, tracks intraday momentum
Secondary VWAP (Week-based): Resets weekly, confirms longer-term trend
Filter Logic:
BUY signals require: Price > Primary VWAP AND Price > Secondary VWAP
SELL signals require: Price < Primary VWAP AND Price < Secondary VWAP
This dual confirmation prevents counter-trend trades during ranging conditions.
3. Fair Value Gap (FVG) Detection
FVG zones identify price inefficiencies where institutional orders were executed rapidly:
Bullish FVG: Gap between candle .high and candle .low (upward imbalance)
Bearish FVG: Gap between candle .high and candle .low (downward imbalance)
The indicator monitors recent FVG formation (lookback: 50 bars) and requires:
Bullish FVG present for BUY signals
Bearish FVG present for SELL signals
FVG zones are displayed as colored boxes and automatically marked as "mitigated" when price fills the gap.
4. Main Trading Signal Logic
The secondary Market Profile (default: 1 hour) generates the actual trading signals:
BUY Signal Conditions:
Price reaches Value Area Low
Reversal pattern confirmed (minimum 1 bar)
Price > Primary VWAP
Price > Secondary VWAP (if filter enabled)
Recent Bullish FVG detected (if filter enabled)
Primary MP Filter = BUY-ONLY or NEUTRAL
SELL Signal Conditions:
Price reaches Value Area High
Reversal pattern confirmed (minimum 1 bar)
Price < Primary VWAP
Price < Secondary VWAP (if filter enabled)
Recent Bearish FVG detected (if filter enabled)
Primary MP Filter = SELL-ONLY or NEUTRAL
All conditions must be TRUE simultaneously for a signal to appear.
📈 VISUAL ELEMENTS
On Chart:
🟢 Green Triangle (▲) = BUY Signal
🔴 Red Triangle (▼) = SELL Signal
🟦 Blue horizontal lines = Value Area zones
🟡 Yellow line = Point of Control (POC)
🟩 Green boxes = Bullish FVG zones
🟥 Red boxes = Bearish FVG zones
🔵 Blue line = Primary VWAP (Session)
⚪ White line = Secondary VWAP (Week)
Info Panel (Top Right):
Real-time status display showing:
Filter Direction (BUY ONLY / SELL ONLY / NEUTRAL)
Active timeframes for both MP filters
FVG filter status and count
VWAP positions (ABOVE/BELOW)
Signal enablement status
Alert status
⚙️ KEY SETTINGS
MP/TPO Filter Settings (Primary Indicator)
MP Filter Time Frame: 60 minutes (controls directional bias)
Filter Value Area %: 70% (standard Market Profile calculation)
Filter Alert Distance: 1 bar
Filter Min Bars for Reversal: 1 bar
Filter Alert Zone Margin: 0.01 (1%)
FVG Filter Settings
Use FVG Filter: Enabled (toggle on/off)
FVG Timeframe: 60 minutes (1 hour)
FVG Filter Mode: Both (require bullish FVG for BUY, bearish for SELL)
FVG Lookback Period: 50 bars (how far back to search)
Show FVG Formation Signals: Optional visual markers
Max FVG on Chart: 50 zones
Show Mitigated FVG: Display filled gaps
Market Profile Settings
Higher Time Frame: 60 minutes (for main signals)
Percent for Value Area: 70%
Show POC Line: Enabled
Keep Old MPs: Enabled (maintain historical profiles)
Primary VWAP Filter
Use Primary VWAP Filter: Enabled
Primary VWAP Anchor Period: Session (resets daily)
Primary VWAP Source: HLC3 (typical price)
Secondary VWAP Filter
Use Secondary VWAP Filter: Enabled
Secondary VWAP Anchor Period: Week (resets weekly)
Secondary VWAP Filter Mode: Both
Secondary VWAP Line Color: White
Trading Signals
Show Trading Signals on Chart: Enabled
Show SELL Signals: Enabled
Show BUY Signals: Enabled
Alert Distance: 1 bar
Min Bars for Reversal: 1 bar
Alert Zone Margin: 0.01 (1%)
Retest Search Period: 20 bars
Min Bars Between Retests: 5 bars
Show Only Retests: Disabled
Alert Settings
Enable Trading Notifications: Enabled
VAH Reversal Alert: Enabled (SELL signals)
VAL Reversal Alert: Enabled (BUY signals)
Time Filter Settings
Filter Alerts By Time: Optional (exclude specific hours)
⚠️ IMPORTANT WARNINGS & LIMITATIONS
1. Repainting Behavior
CRITICAL: This indicator uses lookahead=barmerge.lookahead_on to access higher timeframe data immediately for FVG detection. This is necessary to provide real-time FVG zone visualization but has the following implications:
FVG zones may shift slightly until the higher timeframe candle closes
FVG detection signals are preliminary until HTF bar confirmation
The main trading signals (triangles) appear on confirmed bars and do not repaint
Best Practice: Always wait for the current timeframe bar to close before acting on signals. The filter status and FVG zones are informational but may adjust as new data arrives.
2. Minimum Timeframe
Do NOT use on timeframes below 5 minutes (M5)
Recommended: M5, M15, M30 for intraday trading
Higher timeframes (H1, H4) can also be used but will generate fewer signals
3. Multiple Filters Can Block Signals
By design, this indicator is conservative. When all filters are enabled:
Signals appear ONLY when all conditions align
You may see extended periods with no signals
This is intentional to reduce false positives
If you see no signals:
Check the Info Panel to see which filters are failing
Consider adjusting FVG lookback period
Temporarily disable FVG filter to test
Verify VWAP filters match current market trend
4. Market Profile Limitations
Market Profile requires sufficient volume data
Low-volume instruments may produce unreliable profiles
Value Areas update only on higher timeframe bar close
Works best on liquid markets (major forex pairs, indices, crypto)
📖 HOW TO USE
Step 1: Add to Chart
Apply indicator to M5 or higher timeframe chart
Ensure chart shows volume data
Use standard candles (NOT Heikin Ashi, Renko, etc.)
Step 2: Configure Settings
Primary MP Filter TF: Set to 60 (1 hour) minimum, or 240 (4 hour) for swing trading
Main MP TF: Set to 60 (1 hour) for intraday signals
FVG Timeframe: Match or exceed main MP timeframe
Leave other settings at default initially
Step 3: Understand the Info Panel
Monitor the top-right panel:
FILTER STATUS: Shows current directional bias
NEUTRAL = Both signals allowed
BUY ONLY = Only green triangles will appear
SELL ONLY = Only red triangles will appear
FVG Filter: Shows if bullish/bearish gaps detected recently
VWAP positions: Confirms trend alignment
Step 4: Take Signals
For BUY Signal (Green Triangle ▲):
Wait for green triangle to appear
Check Info Panel shows ✓ for BUY signals
Confirm current bar has closed
Enter long position
Stop loss: Below recent VAL or swing low
Target: Previous Value Area High or 1.5-2× risk
For SELL Signal (Red Triangle ▼):
Wait for red triangle to appear
Check Info Panel shows ✓ for SELL signals
Confirm current bar has closed
Enter short position
Stop loss: Above recent VAH or swing high
Target: Previous Value Area Low or 1.5-2× risk
Step 5: Risk Management
Risk per trade: Maximum 1-2% of account equity
Position sizing: Adjust based on stop loss distance
Avoid trading: During major news events or time filter periods
Multiple confirmations: Look for confluence with price action (support/resistance, trendlines)
🎓 UNDERLYING CONCEPTS
Market Profile Theory
Developed by J. Peter Steidlmayer in the 1980s, Market Profile organizes price and volume data to identify:
Value Areas: Where 70% of trading activity occurred
POC: Price level with highest acceptance (most volume)
Imbalances: When price moves away from value quickly
This indicator uses TPO (Time Price Opportunity) calculation method to build the volume profile distribution.
VWAP (Volume Weighted Average Price)
VWAP represents the average price weighted by volume, showing where institutional traders are positioned:
Price above VWAP = Bullish (institutions accumulated lower)
Price below VWAP = Bearish (institutions distributed higher)
Using dual VWAP (Session + Week) creates multi-timeframe trend alignment.
Fair Value Gaps (FVG)
Also known as "imbalance" or "inefficiency," FVG occurs when:
Price moves so rapidly that a gap forms in the candlestick structure
Indicates institutional order flow (large market orders)
Price often returns to "fill" these gaps (rebalance)
The 3-candle FVG pattern (gap between candle and candle ) is widely used in ICT (Inner Circle Trader) methodology and Smart Money Concepts.
🔍 CREDITS & CODE ATTRIBUTION
This indicator builds upon established technical analysis concepts and combines multiple methodologies:
1. Market Profile / TPO Calculation
Concept Origin: J. Peter Steidlmayer (Chicago Board of Trade, 1980s)
Code Inspiration: TradingView's public domain Market Profile examples
Modifications: Custom filtering logic for directional bias, dual timeframe implementation
2. VWAP Calculation
Concept Origin: Standard financial instrument (widely used since 1980s)
Code Base: TradingView built-in ta.vwap() function (public domain)
Modifications: Dual VWAP system with independent anchor periods, custom filtering modes
3. Fair Value Gap Detection
Concept Origin: Inner Circle Trader (ICT) / Smart Money Concepts methodology
Code Implementation: Original implementation based on 3-candle gap pattern
Features: Multi-timeframe detection, automatic mitigation tracking, visual zone display
4. Pine Script Framework
Language: Pine Script v6 (TradingView)
Built-in Functions Used:
ta.vwap() - Volume weighted average price
request.security() - Higher timeframe data access
ta.change() - Period detection
ta.cum() - Cumulative volume
time() - Timestamp functions
Note: All code is original implementation. While concepts are based on established trading methodologies, the combination, filtering logic, and execution are unique to this indicator.
📊 RECOMMENDED INSTRUMENTS
Best Performance:
Major Forex Pairs (EURUSD, GBPUSD, USDJPY)
Stock Indices (ES, NQ, SPX, DAX)
Major Cryptocurrencies (BTCUSD, ETHUSD)
Liquid Stocks (high daily volume)
Avoid:
Low-volume altcoins
Illiquid stocks
Exotic forex pairs with wide spreads
⚡ PERFORMANCE TIPS
Start Conservative: Enable all filters initially
Reduce Filters Gradually: If too few signals, disable Secondary VWAP filter first
Match Timeframes: Keep MP Filter TF and FVG TF at same value
Backtest First: Review historical performance on your preferred instrument/timeframe
Combine with Price Action: Look for support/resistance confluence
Use Time Filter: Avoid low-liquidity hours (optional setting)
🚫 WHAT THIS INDICATOR DOES NOT DO
Does not guarantee profits - No trading system is 100% accurate
Does not predict the future - Based on historical patterns
Does not replace risk management - Always use stop losses
Does not work on all instruments - Requires volume data and liquidity
Does not provide exact entry/exit prices - Signals are zones, not precise levels
Does not account for fundamentals - Purely technical analysis
📜 DISCLAIMER
This indicator is provided for educational and informational purposes only. It is not financial advice, and past performance does not guarantee future results.
Trading Risk Warning:
All trading involves risk of loss
You can lose more than your initial investment (leverage products)
Only trade with capital you can afford to lose
Always use appropriate position sizing and risk management
Consider seeking advice from a licensed financial advisor
Technical Limitations:
Indicator may repaint FVG zones until HTF bar closes
Signals are based on historical patterns that may not repeat
Market conditions change and no system works in all environments
Volume data quality varies by exchange/broker
By using this indicator, you acknowledge these risks and agree that the author bears no responsibility for trading losses.
📞 SUPPORT & UPDATES
Questions? Comment on this publication
Issues? Describe the problem with chart screenshot
Feature Requests? Suggest improvements in comments
Updates: Will be published as new versions using TradingView's update feature
📝 VERSION HISTORY
Version 1.0 (Current)
Initial public release
Multi-filter system: MP + Dual VWAP + FVG
Directional bias filter
Real-time info panel
Comprehensive alert system
Time-based filtering
Thank you for using Smart VWAP FVG System!
Happy Trading! 📈

Delta ROC (acceleration) + GuideStan Druckenmiller often stresses that markets are driven not by absolute numbers but by their rate of change. He says the key is to “focus on the central banks and the movement of liquidity,” and notes that “because it used second-derivative rate of change, these things will often bottom a year to a year and a half before the fundamentals.” In essence, he looks for inflection points—moments when momentum itself begins to turn—well before the data or headlines confirm it.
The ΔROC (Delta Rate of Change) indicator applies that same philosophy. It measures both the first derivative of price (ROC: speed or momentum) and the second derivative (ΔROC: acceleration or deceleration of that momentum). Green bars signal that momentum is accelerating—buyers gaining control—while red bars show slowing momentum or exhaustion. Combine this with trend filters like the 30- and 50-day moving averages to spot early shifts in sentiment and liquidity—the kind of turning points Druckenmiller calls the “second-derivative moments” that often lead the real economy by months.

Pivots 15m en 1mThis script is designed for scalpers and day traders who base their entries on low timeframes (like 1m) but reference liquidity levels from higher timeframes (HTF), in this case, 15m.Key Features:HTF Pivots on LTF: It calculates swing highs and swing lows (pivots) from the 15m chart and projects them as horizontal rays onto your 1m chart.Real-Time Mitigation: The rays (representing pending liquidity) are automatically deleted on the 1m candle as soon as the price mitigates (touches or breaks) that level. This allows you to clearly see which levels have already been tested and which have not.Configurable Pivot Strength: Includes an input to define the "Pivot Strength," allowing you to adjust how many candles on each side are needed to confirm a swing point (e.g., a value of 1 creates 3-bar pivots, a value of 2 creates 5-bar pivots, etc.).Info Table: Displays a real-time table with vital information from the current 1m candle:Time remaining until the candle closes.Total range of the candle in ticks.How to Use:This indicator must be loaded exclusively on a 1-minute (1m) chart.Adjust the "Pivot Strength" in the settings according to your strategy (a value of 1 or 2 is recommended).

Stablecoin to BTC Market Cap RatioThis indicator calculates the ratio of the combined market capitalization of USDT and USDC stablecoins to the market capitalization of BTC. Data is updated daily from TradingView's CRYPTOCAP sources. It is displayed as a line in a separate panel, allowing analysis of stablecoin liquidity dynamics relative to BTC.
How to Use
Add the indicator to any asset chart in TradingView. It is useful for assessing the potential buying power of stablecoins in the cryptocurrency market. High ratio values may signal accumulation of liquidity in stablecoins, often preceding growth in BTC or altcoins (bullish signal). Low values indicate a decrease in the role of stablecoins, which may be bearish. It is recommended to combine with other indicators, such as RSI or volumes, to confirm trends.

Quantura - Average Intraday Candle VolumeIntroduction
“Quantura – Average Intraday Candle Volume” is a quantitative visualization tool that calculates and displays the average traded volume for each intraday time position based on a user-defined historical lookback period. It allows traders to analyze recurring intraday volume patterns, identify high-activity sessions, and detect liquidity shifts throughout the trading day.
Originality & Value
This indicator goes beyond standard volume averages by normalizing and aligning volume data according to the time of day. Instead of simply smoothing recent bars, it builds an intraday volume profile based on historical daily averages, enabling users to understand when during the day volume typically peaks or drops.
Its originality and usefulness come from:
Converting standard volume data into time-aligned intraday averages.
Visualization of historical intraday liquidity behavior, not just total daily volume.
Dynamic scaling using normalization and transparency to emphasize active and quiet periods.
Optional day-separator lines for precise intraday structure recognition.
Gradient-based coloring for better visual interpretation of volume intensity.
Functionality & Core Logic
The indicator divides each day into discrete intraday time positions (based on chart timeframe).
For each position, it stores and updates historical volume values across the selected number of days.
It calculates an average volume per time position by aggregating all stored values and dividing them by the number of valid days.
The result is plotted as a continuous histogram showing typical intraday volume distribution.
The bar colors and transparency dynamically reflect the relative intensity of volume at each point in the day.
Parameters & Customization
Number of Days for Averaging: Defines how many past days are included in the volume average calculation (default: 365).
UTC Offset: Allows synchronization of intraday cycles with local or exchange time zones.
Base Color: Sets the main color for plotted volume columns.
Color Mode: Choose between “Gradient” (transparency dynamically adjusts by intensity) or “Normal” (fixed opacity).
Day Line: Toggles dashed vertical lines marking the start of each trading day.
Visualization & Display
Volume is plotted as a series of histogram bars, each representing the average volume for a specific intraday time position.
A gradient color mode enhances readability by fading lower-intensity areas and highlighting high-volume regions.
Optional day-separator lines visually segment historical sessions for easy reference.
Works seamlessly across all chart timeframes that divide the 24-hour day into regular bar intervals.
Use Cases
Identify when trading activity typically peaks (e.g., session opens, news windows, or overlapping markets).
Compare current intraday volume to historical averages for early anomaly detection.
Enhance algorithmic or discretionary strategies that depend on volume-timing alignment.
Combine with volatility or price structure indicators to confirm market activity zones.
Evaluate session consistency across different time zones using the UTC offset parameter.
Limitations & Recommendations
The indicator requires intraday data (below 1D resolution) to function properly.
Volume behavior may vary across brokers and assets; adjust averaging period accordingly.
Does not predict price movement — it provides volume-based context for analysis.
Works best when combined with structure or momentum-based indicators.
Markets & Timeframes
Compatible with all intraday markets — including crypto, Forex, equities, and futures — and all intraday timeframes (from 1 minute to 4 hours). It is particularly valuable for analyzing assets with continuous 24-hour trading activity.
Author & Access
Developed 100% by Quantura. Published as a Open-source script indicator. Access is free.
Important
This description complies with TradingView’s Script Publishing and House Rules. It provides a clear explanation of the indicator’s originality, logic, and purpose, without any unrealistic performance or predictive claims.

MACD Remastered [CHE]MACD Remastered — Robust MACD with confirmed pivot-based divergence, optional signal bands, and ready-to-use alerts.
Summary
This indicator augments classic MACD with a robust, confirmed pivot-based divergence engine and an optional signal channel using Bollinger Bands. Divergence signals are only produced after a pivot is confirmed, which reduces noise from transient swings. A line-of-sight clearance check filters cases where the MACD histogram path contradicts the divergence, further cutting false flags. Histogram coloring clarifies momentum changes, while optional triangles project the same signals onto the main chart for quick context.
Motivation: Why this design?
Standard MACD divergence tools tend to fire early in volatile phases and flip during consolidation. The core idea here is to delay decision points until a pivot is confirmed and to validate the path between pivots. This addresses fake flips and improves signal credibility at the cost of some latency. Optional bands around the Signal line add context about compression and expansion without altering MACD’s core behavior.
What’s different vs. standard approaches?
Reference baseline: Classical MACD (fast and slow moving averages, Signal line, histogram) with simple divergence checks.
Architecture differences:
Confirmed pivot logic with left and right bars.
Line-of-sight clearance test across the histogram path between pivots.
Optional Signal-line Bollinger Bands with configurable length and width.
Composite “Any Divergence” alert plus separate regular and hidden alerts.
Optional main-chart triangles using forced overlay for at-a-glance context.
Practical effect: Fewer early or contradictory divergence signals, clearer momentum context via histogram colors and a visible Signal channel during compression and expansion.
How it works (technical)
The MACD line derives from a fast and a slow moving average on a chosen source. The Signal line smooths the MACD line using a selected moving average type and length. The histogram is the difference between MACD and Signal and is colored by direction and acceleration.
Divergence uses confirmed pivots: a pivot forms only after a set number of bars on the right side, so the event is locked in. The engine retrieves the last two relevant pivots and checks price movement versus the MACD histogram movement to classify regular or hidden divergence. A line-of-sight clearance routine traverses the histogram path between the two pivots and rejects the signal if the path invalidates the directional relationship. When enabled, Bollinger Bands are plotted around the Signal line; width scales with standard deviation. Programmatic alerts fire only on confirmed bars. No higher-timeframe requests are used.
Parameter Guide
Oscillator MA Type — Sets fast and slow MA family for MACD. Default: EMA. Tip: EMA is more responsive; SMA is steadier.
Fast Length — Fast MA period. Default: 12. Trade-off: Shorter is quicker but noisier.
Slow Length — Slow MA period. Default: 26. Trade-off: Longer reduces noise but adds lag.
Source — Price input. Default: Close. Tip: Use a stable source for consistency.
Signal MA Type — Moving average family for Signal. Default: EMA.
Signal Length — Smoothing of MACD into Signal. Default: 9. Trade-off: Longer smooths more, reacts slower.
Calculate Divergence — Enables divergence engine. Default: True.
Enable Bollinger Bands on Signal — Adds bands around Signal. Default: False.
BB Length — Sampling window for bands. Default: 20. Active: Only when bands are enabled.
BB StdDev — Band width in standard deviations. Default: 2.0. Bounds: between about zero point zero zero one and fifty.
Pivot Left / Pivot Right — Bars to the left and right that define a confirmed pivot. Default: five and five. Trade-off: Larger values mean stronger but slower pivots.
Min / Max Bars Between Pivots — Valid window between two pivots. Default: five and sixty. Tip: Increase minimum to reduce micro-divergences.
Detect Hidden — Include hidden divergence. Default: True.
Draw Lines — Draw connector lines on the MACD pane. Default: True.
Alerts: Enable / Regular / Hidden / Frequency / Prefix — Control alert emission, categories, cadence, and label. Defaults: Enabled, both categories on, once per bar close, prefix “MACD RM”.
Reading & Interpretation
Histogram: Columns above zero reflect positive momentum; below zero reflect negative momentum. Color shifts indicate momentum increasing or decreasing within each side.
MACD and Signal: Crosses and distance indicate momentum shifts and strength. When bands are enabled, touches and departures hint at compression and expansion around the Signal.
Divergence: Solid green lines and labels indicate regular bullish; solid red indicate regular bearish. Dashed teal and dashed orange denote hidden bullish and hidden bearish. Triangles on the main chart mirror these events for quicker visibility.
Practical Workflows & Combinations
Trend following: Use histogram color transitions with a structure filter such as higher highs and higher lows for long bias, or lower highs and lower lows for short bias. Divergence against the prevailing structure suggests caution or partial exits.
Exits and risk: In a long, regular bearish divergence near resistance can justify scaling out or tightening stops. Hidden divergence in the trend direction can support continuation but should not replace risk controls.
Multi-asset / Multi-timeframe: Works across liquid futures, forex, indices, and large-cap equities. Start with defaults on four-hour and daily; shorten lengths on intraday only when liquidity is strong.
Behavior, Constraints & Performance
Repaint and confirmation: Signals are anchored only after the right-side pivot bars complete; alerts trigger on confirmed bars. This intentionally adds latency to reduce noise.
No higher-timeframe requests: No `security` calls are used; repaint risk is primarily tied to live bars before confirmation.
Resources: Declared `max_bars_back` is five hundred. The divergence path check iterates between pivots, bounded by the maximum bars parameter. Line objects may accumulate; limits are set for lines and labels.
Known limits: Latency at sharp turns, potential misses during fast single-bar reversals, and sensitivity to extremely choppy sessions if minimum gap between pivots is set too low.
Sensible Defaults & Quick Tunin g
Starting point: EMA, twelve and twenty-six with Signal nine; pivots five and five; minimum five, maximum sixty; alerts on close; bands off.
Too many flips: Increase Signal length, raise pivot counts, and increase minimum bars between pivots. Consider disabling hidden divergence.
Too sluggish: Reduce pivot counts, lower Signal length, and enable bands to visualize early compression.
Cluttered chart: Keep lines off and rely on labels and main-chart triangles. Use the alert prefix to route events cleanly.
What this indicator is—and isn’t
This is a visualization and signal layer for MACD with confirmed, path-checked divergence and optional Signal bands. It is not a trading system, not predictive, and not a position management framework. Use it together with structure analysis, liquidity context, and explicit risk controls.
Disclaimer
The content provided, including all code and materials, is strictly for educational and informational purposes only. It is not intended as, and should not be interpreted as, financial advice, a recommendation to buy or sell any financial instrument, or an offer of any financial product or service. All strategies, tools, and examples discussed are provided for illustrative purposes to demonstrate coding techniques and the functionality of Pine Script within a trading context.
Any results from strategies or tools provided are hypothetical, and past performance is not indicative of future results. Trading and investing involve high risk, including the potential loss of principal, and may not be suitable for all individuals. Before making any trading decisions, please consult with a qualified financial professional to understand the risks involved.
By using this script, you acknowledge and agree that any trading decisions are made solely at your discretion and risk.
Do not use this indicator on Heikin-Ashi, Renko, Kagi, Point-and-Figure, or Range charts, as these chart types can produce unrealistic results for signal markers and alerts.
Best regards and happy trading
Chervolino

dO / wO / mO + MA 50/200 + PrevDay H/L Description
This indicator plots key reference levels used by professional traders:
Daily Open (dO)
Weekly Open (wO)
Monthly Open (mO)
Previous Day High (pdH) and Previous Day Low (pdL)
Moving Averages: 50 & 200 SMA
Each level is drawn as a clean dotted white line with a fixed label directly on the price chart.
All levels can be individually toggled on or off via checkboxes in the settings panel.
The pdH/pdL lines start exactly from the candles that created them, providing clear structure for breakout, retracement, and liquidity analysis.
The 50/200 SMA are included for long-term trend context.
This tool is designed for traders who rely on multi-timeframe structure and precision levels for both intraday and swing strategies.
Features
Toggle visibility for dO, wO, mO, pdH, and pdL
Accurate placement of previous day levels
Lightweight and responsive
Clean minimal visual design
Supports any symbol and timeframe
Usage Notes
Perfect for confluence-based trading:
Combine pdH/pdL with session opens to identify key liquidity zones
Use SMA 50/200 for directional bias
Works on crypto, forex, indices, and equities

Session ParmezanForex Session Range Boxes (Asia, Europe, US) — visual intraday session tracker for Forex and metals.
This indicator automatically marks the three major Forex trading sessions — Asian (Tokyo), European (London), and American (New York) — directly on your chart using dynamic colored boxes.
Each box represents the full price range (High–Low) formed during that session, helping traders visualize how volatility and liquidity evolve across the global trading day.
The script is built for intraday traders and session-based strategies, especially those who monitor breakouts from the Asian range or reactions during London–New York overlaps.
⚙️ Features
• Accurate session timing (UTC+3 / Moscow Time) — Asia: 03:00–12:00, Europe: 11:00–20:00, US: 16:00–01:00.
• Dynamic range boxes: each box expands in real time as new highs and lows are set during the session.
• Clear visual separation: each session is shown in its own color (blue for Asia, orange for Europe, green for US).
• Automatic daily reset — new boxes start every new session.
• Intraday focus only — visible up to the 1-hour timeframe (M1–H1) for clarity.
• Transparent design — semi-transparent fills keep candles readable even when sessions overlap.
• Lightweight performance — optimized use of box.new() and var variables avoids lag on lower timeframes.
🧭 Typical Use-Cases
• Identify Asian session ranges and watch for London breakouts or New York reversals.
• Visually align your intraday strategy with session volatility cycles.
• Combine with VWAP, liquidity zones, or market profile indicators for deeper confluence.
• Spot overlapping sessions — often the most active periods of the day.

DTC Killzones ICT🕐 DTC Killzones ICT — Visualize Market Sessions Like a Pro
The DTC Killzones ICT indicator is a clean and intuitive tool designed for traders who want to analyze and visualize institutional trading sessions directly on their charts.
Inspired by ICT’s Killzone concept , this script makes it easy to identify overlapping market sessions — such as London, New York, and Asian — and track how price behaves within each zone.
💡 What It Does
This indicator automatically highlights key market sessions (Killzones) on your chart with fully customizable colors, labels, and transparency.
Each zone dynamically updates to reflect real-time highs and lows, helping you identify:
Session ranges and liquidity zones
Volatility windows and breakout areas
Institutional footprints across sessions
Whether you trade Forex, Indices, or Crypto , this script gives you visual clarity on when and where smart money is likely to move.
⚙️ Main Features
✅ Up to four customizable sessions (New York, London, Asian, and London Close)
✅ Adjustable timeframes and timezone options — sync with your exchange or custom UTC offset
✅ Dynamic high/low range tracking for each session
✅ Toggle range outlines, session labels , and transparency levels
✅ Optional daily dividers and session transition markers
✅ Works on any timeframe and any symbol
🧠 How Traders Use It
ICT-based traders can easily mark Killzones to align with setups like FVGs, liquidity grabs, or Silver Bullet entries.
Intraday traders can visualize session volatility and overlap periods for potential entries.
Swing traders can identify daily structure shifts by tracking range-to-range behavior.
🛠️ Customization
You can fully rename, recolor, or disable each session block.
Adjust the range transparency for visual comfort, and toggle session or daily dividers to fit your workflow.
Everything is designed to be clean, light, and modular — no clutter, no confusion.
⚡ Recommended Settings
For ICT-style analysis:
London Session: 02:00–05:00
New York Session: 07:00–10:00
Asian Session: 19:30–24:00
London Close Session: 10:00–12:00
These time windows are fully editable to suit your timezone or strategy.
🧩 Compatibility
Works seamlessly with TradingView’s built-in timezone tools
Compatible with all instruments and timeframes
Designed to overlay directly on your price chart
🏁 Final Notes
The DTC Killzones ICT indicator focuses purely on market session visualization — no alerts, entries, or trading signals.
It’s designed to complement your existing strategies and enhance clarity when analyzing market behavior across global sessions.
📈 Built for traders who value precision, structure, and timing.

Prev 1-Min Volume • 5% Max Shares (TTP-ready)💡 Overview
This tool was built to help Trade The Pool (TTP) traders comply with the new “5% per minute volume” rule — without needing to calculate anything manually.
It automatically tracks the previous 1-minute volume, calculates 5% of it, and compares that to your planned order size.
If your planned size is within the limit, it shows green ✅.
If you’re above, it flashes red 🚫.
And when liquidity spikes allow for more size, you’ll see a green glow and 🔔 alert — so you can size up confidently without breaking the rule.
⚙️ Features
✅ Auto-calculates 5% volume cap from the previous 1-min candle
✅ Displays previous volume, max allowed shares, and your planned size
✅ TTP “different volume” scaling option (e.g. 0.69 for 45M vs 65M real volume)
✅ Per-bar slice suggestion for 10s scalpers
✅ Corner selector (top-left, top-right, bottom-left, bottom-right)
✅ Visual glow and 🔔 alert when liquidity window opens
✅ Compact and real-time responsive on 10s charts
Gold H1 Breakout Failure (V11.0)This strategy is designed for trading XAU/USD (Gold) on the 1-hour timeframe. It identifies and trades fake breakouts of the Asian session range.
The logic is simple yet effective:
The script first marks the Asian session high and low.
Once price breaks out of this range and closes outside, it waits for confirmation by watching for price to close back inside the range.
When this re-entry occurs, the strategy takes a position in the opposite direction of the initial breakout, anticipating a false breakout or liquidity trap setup.
By focusing on these fakeouts, the strategy aims to capture reversal momentum after liquidity sweeps, making it especially effective during sessions when volatility transitions from Asia to London or New York.
