Master Global Liquidity Shifted 75 DaysThe Global Liquidity Index is a Pine Script (version 5) technical indicator designed to measure and visualize global financial liquidity by aggregating data from various central bank balance sheets and money supply metrics. The indicator is plotted as an overlay on the price chart using the left scale, with the entire line shifted left by 75 days.
Key features:
Data Sources: Incorporates balance sheet data from major central banks including the Federal Reserve (FED), European Central Bank (ECB), People's Bank of China (PBC), Bank of Japan (BOJ), and other central banks, along with optional M2 money supply data from various countries.
Components: Includes options to toggle specific liquidity factors such as FED balance sheet, Treasury General Account (TGA), Reverse Repurchase Agreements (RRP), and regional M2 money supplies, all converted to USD.
75-Day Shift: The indicator's output is shifted left by 75 days on the chart, aligning historical liquidity data with earlier price action, with this shift period adjustable via the "Shift Days Left" input.
Calculations:
Computes a total liquidity value by summing enabled central bank and M2 data (adjusted for RRP and TGA as drains)
Scales the total by dividing by 1 trillion (10^12)
Applies a Simple Moving Average (SMA) and Rate of Change (ROC) with user-defined periods
Final output is either the SMA of ROC or SMA alone, depending on ROC length
Visualization: Plots the shifted result as a yellow line with a linewidth of 2.
In den Scripts nach "liquidity" suchen

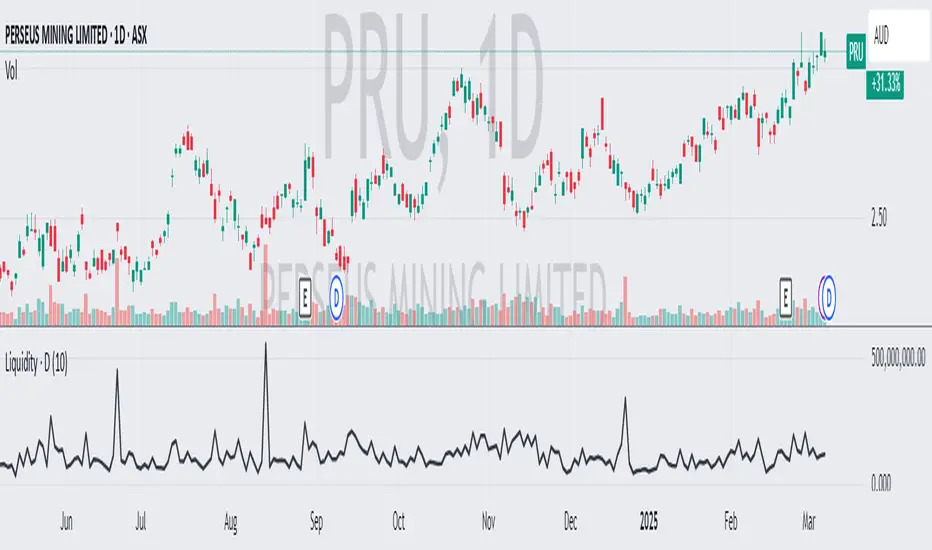
Average Daily LiquidityIt is important to ensure sufficient stock trading liquidity so that you have sufficient volume to enter the trade and most importantly sufficient liquidity to exit the trade. Because daily trading liquidity can jump around so much by price changes and volume changes, it is important to smooth out the liquidity by using a moving average. Some use a 5 days (trading week) moving average, others use 10 day (2 weeks), 20 day ("month") and some use 65 day (quarter). The default is 10 days based upon the work of Colin Nicholson (The Aggressive Investor and Building Wealth in the Stock Market). Liquidity line changes color dependent upon the chart background luminescence. The amount you are planning to invest in a stock should have a liquidity of 10 (default) times that amount.
1H/3m Concept [RunRox]🕘 1H/3m Concept is a versatile trading methodology based on liquidity sweeps from fractal points identified on higher timeframes, followed by price reversals at these key moments.
Below, I will explain this concept in detail and provide clear examples demonstrating its practical application.
⁉️ WHAT IS A FRACTALS?
In trading, a fractal is a technical analysis pattern composed of five consecutive candles, typically highlighting local market turning points. Specifically, a fractal high is formed when a candle’s high is higher than the highs of the two candles on either side, whereas a fractal low occurs when a candle’s low is lower than the lows of the two adjacent candles on both sides.
Traders use fractals as reference points for identifying significant support and resistance levels, potential reversal areas, and liquidity zones within price action analysis. Below is a screenshot illustrating clearly formed fractals on the chart.
📌 ABOUT THE CONCEPT
The 1H/3m Concept involves marking Higher Timeframe (HTF) fractals directly onto a Lower Timeframe (LTF) chart. When a liquidity sweep occurs at an HTF fractal level, we remain on the same LTF chart (since all HTF fractals are already plotted on this lower timeframe) and wait for a clear Market Structure Shift (MSS) to identify our potential entry point.
Below is a schematic illustration clearly demonstrating how this concept works in practice.
Below is another 💡 real-chart example , showing liquidity in the form of a 1H fractal, swept by a rapid impulse move. Immediately afterward, a clear Market Structure Shift (MSS) occurs, signaling a potential entry point into the trade.
Another example is shown below, where we see our hourly fractal, from which price clearly reacts, providing an opportunity to search for an entry point.
As illustrated on the chart, the fractal levels from the higher timeframe are clearly displayed, but we’re working directly on the 5-minute chart. This allows us to remain on one timeframe without needing to switch back and forth between charts to spot such trading setups.
🔍 MTF FRACTALS
This concept can be applied across various HTF-LTF timeframe combinations. Although our examples illustrate 1H fractals used on a 5-minute chart, you can effectively utilize many other timeframe combinations, such as:
30m HTF fractals on 1m chart
1H HTF fractals on 3m chart
4H HTF fractals on 15m chart
1D HTF fractals on 1H chart
The key idea behind this concept is always the same: identify liquidity at fractal levels on the higher timeframe (HTF), then wait for a clear Market Structure Shift (MSS) on the lower timeframe (LTF) to enter trades.
⚙️ SETTINGS
🔷 Trade Direction – Select the preferred trading direction (Long, Short, or Both).
🔷 HTF – Choose the higher timeframe from which fractals will be displayed on the current chart.
🔷 HTF Period – Number of candles required on both sides of a fractal candle (before and after) to confirm fractal formation on the HTF.
🔷 Current TF Period – Sensitivity to the impulse that sweeps liquidity, used for identifying and forming the MSS line.
🔷 Show HTF – Enable or disable displaying HTF fractal lines on your chart. You can also customize line style and color.
🔷 Max Age (Bars) – Number of recent bars within which fractals from the selected HTF will be displayed.
🔷 Show Entry – Enable or disable displaying the MSS line on the chart.
🔷 Enable Alert – Activates TradingView alerts whenever the MSS line is crossed.
You can also enable 🔔 alerts, which notify you whenever price crosses the MSS line. This significantly simplifies the process of identifying these setups on your charts. Simply configure your preferred timeframes and wait for notifications when the MSS line is crossed.
🔶 We greatly appreciate your feedback and suggestions for improving the indicator!

Uptrick: Portfolio Allocation DiversificationIntro
The Uptrick: Portfolio Allocation Diversification script is designed to help traders and investors manage multiple assets simultaneously. It generates signals based on various trading systems, allocates capital using different diversification methods, and displays real-time metrics and performance tables on the chart. The indicator compares active trading strategies with a separate long-term holding (HODL) simulation, allowing you to see how a systematic trading approach stacks up against a simple buy-and-hold strategy.
------------------------------------------------------------------------
Trading System Selection
1. No signals (none)
In this mode, the script does not produce bullish or bearish indicators; every asset stays in a neutral stance. This setup is useful if you prefer to observe how capital might be distributed based solely on the chosen diversification method, with no influence from directional signals.
2. rsi – neutral
This mode uses an index-based measure of whether an asset appears overbought or oversold. It generates a bearish signal if market conditions point to overbought territory, and a bullish signal if they indicate oversold territory. If neither extreme surfaces, it remains neutral. Some traders apply this in sideways or range-bound conditions, where overbought and oversold levels often hint at possible turning points. It does not specifically account for divergence patterns.
3. rsi – long only
In this setting, the system watches for instances where momentum readings strengthen even if the asset’s price is still under pressure or setting new lows. It also considers oversold levels as potential signals for a bullish setup. When such conditions emerge, the script flags a possible move to the upside, ignoring indications that might otherwise suggest a bearish trend. This approach is generally favored by those who want to concentrate exclusively on identifying price recoveries.
4. rsi – short only
Here, the script focuses on spotting signs of deteriorating momentum while an asset’s price remains relatively high or attempts further gains. It also checks whether the market is drifting into overbought territory, suggesting a potential decline. Under such conditions, it issues a bearish signal. It provides no bullish alerts, making it particularly suitable for traders who look to take advantage of overvalued scenarios or protect themselves against sudden downward moves.
5. Deviation from fair value
Under this system, the script judges how far the current price may have strayed from what is considered typical, taking into account normal fluctuations. If the asset appears to be trading at an unusually low level compared to that reference, it is flagged as bullish. If it seems abnormally high, a bearish signal is issued. This can be applied in various market environments to seek opportunities that arise from perceived mispricing.
6. Percentile channel valuation
In this mode, the script determines where an asset's price stands within a historical distribution, highlighting whether it has reached unusually high or low territory compared to its recent past. When the price reaches what is deemed an extreme reading, it may indicate that a reversal is more likely. This approach is often used by traders who watch for statistical outliers and potential reversion to a more typical trading range.
7. ATH valuation
This technique involves comparing an asset's current price with its previously recorded peak values. The script then interprets whether the price is positioned so far below the all-time high that it looks discounted, or so close to that high that it could be overextended. Such perspective is favored by market participants who want to see if an asset still has ample room to climb before matching historic extremes, or if it is nearing a possible ceiling.
8. Z-score system
Here, the script measures how far above or below a standard reference average an asset's price may be, translated into standardized units. Substantial negative readings can suggest a price that might be unusually weak, prompting a bullish indication, while large positive readings could signal overextension and lead to a bearish call. This method is useful for traders watching for abrupt deviations from a norm that often invite a reversion to more balanced levels.
RSI Divergence Period
This input is particularly relevant for the RSI - Long Only and RSI - Short Only modes. The period determines how many bars in the past you compare RSI values to detect any divergences.
------------------------------------------------------------------------
Diversification Method
Once the script has determined a bullish, bearish, or neutral stance for each asset, it then calculates how to distribute capital among all included assets. The diversification method sets the weighting logic.
1. None
Gives each asset an equal weight. For example, if you have five included assets, each might get 20 percent. This is a simple baseline.
2. Risk-Adjusted Expected Return Using Volatility Clustering
Emphasizes each asset’s average returns relative to its observed risk or volatility tendencies. Assets that exhibit good risk-adjusted returns combined with moderate or lower volatility may receive higher weights than more volatile or less appealing assets. This helps steer capital toward assets that have historically provided a better ratio of return to risk.
3. Relative Strength
Allocates more capital to assets that show stronger price strength compared to a reference (for example, price above a long-term moving average plus a higher RSI). Assets in clear uptrends may be given higher allocations.
4. Trend-Following Indicators
Examines trend-based signals, like positive momentum measurements or upward-trending strength indicators, to assign more weight to assets demonstrating strong directional moves. This suits those who prefer to latch onto trending markets.
5. Volatility-Adjusted Momentum
Looks for assets that have strong price momentum but relatively subdued volatility. The script tends to reward assets that are trending well yet are not too volatile, aiming for stable upward performance rather than massive swings.
6. Correlation-Based Risk Parity
Attempts to weight assets in such a way that the overall portfolio risk is more balanced. Although it is not an advanced correlation matrix approach in a strict sense, it conceptually scales each asset’s weight so no single outlier heavily dominates.
7. Omega Ratio Maximization
Gives preference to assets with higher omega ratios. This ratio can be interpreted as the probability-weighted gains versus losses. Assets with a favorable skew are given more capital.
8. Liquidity-Weighted Valuation
Considers each asset’s average trading liquidity, such as the combination of volume and price. More liquid assets typically receive a higher allocation because they can be entered or exited with lower slippage. If the trading system signals bullishness, that can further boost the allocation, and if it signals bearishness, the allocation might be set to zero or reduced drastically.
9. Drawdown-Controlled Allocation (DCA)
Examines each asset’s maximum drawdown over a recent window. Assets experiencing lighter drawdowns (thus indicating somewhat less downside volatility) receive higher allocations, aiming for a smoother overall equity curve.
------------------------------------------------------------------------
Portfolio and Allocation Settings
Portfolio Value
Defines how much total capital is available for the strategy-based investment portion. For example, if set to 10,000, then each asset’s monetary allocation is determined by the percentage weighting times 10,000.
Use Fixed Allocation
When enabled, the script calculates the initial allocation percentages after 50 bars of data have passed. It then locks those percentages for the remainder of the backtest or real-time session. This feature allows traders to test a static weighting scenario to see how it differs from recalculating weights at each bar.
------------------------------------------------------------------------
HODL Simulator
The script has a separate simulation that accumulates positions in an asset whenever it appears to be recovering from an undervalued state. This parallel tracking is intended to contrast a simple buy-and-hold approach with the more adaptive allocation methods used elsewhere in the script.
HODL Buy Quantity
Each time an asset transitions from an undervalued state to a recovery phase, the simulator executes a purchase of a predefined quantity. For example, if set to 0.5 units, the system will accumulate this amount whenever conditions indicate a shift away from undervaluation.
HODL Buy Threshold
This parameter determines the level at which the simulation identifies an asset as transitioning out of an undervalued state. When the asset moves above this threshold after previously being classified as undervalued, a buy order is triggered. Over time, the performance of these accumulated positions is tracked, allowing for a comparison between this passive accumulation method and the more dynamic allocation strategy.
------------------------------------------------------------------------
Asset Table and Display Settings
The script displays data in multiple tables directly on your chart. You can toggle these tables on or off and position them in various corners of your TradingView screen.
Asset Info Table Position
This table provides key details for each included asset, displaying:
Symbol – Identifies the trading pair being monitored. This helps users keep track of which assets are included in the portfolio allocation process.
Current Trading Signal – Indicates whether the asset is in a bullish, bearish, or neutral state based on the selected trading system. This assists in quickly identifying which assets are showing potential trade opportunities.
Volatility Approximation – Represents the asset’s historical price fluctuations. Higher volatility suggests greater price swings, which can impact risk management and position sizing.
Liquidity Estimate – Reflects the asset’s market liquidity, often based on trading volume and price activity. More liquid assets tend to have lower transaction costs and reduced slippage, making them more favorable for active strategies.
Risk-Adjusted Return Value – Measures the asset’s returns relative to its risk level. This helps in determining whether an asset is generating efficient returns for the level of volatility it experiences, which is useful when making allocation decisions.
2. Strategy Allocation Table Position
Displays how your selected diversification method converts each asset into an allocation percentage. It also shows how much capital is being invested per asset, the cumulative return, standard performance metrics (for example, Sharpe ratio), and the separate HODL return percentage.
Symbol – Displays the asset being analyzed, ensuring clarity in allocation distribution.
Allocation Percentage – Represents the proportion of total capital assigned to each asset. This value is determined by the selected diversification method and helps traders understand how funds are distributed within the portfolio.
Investment Amount – Converts the allocation percentage into a dollar value based on the total portfolio size. This shows the exact amount being invested in each asset.
Cumulative Return – Tracks the total return of each asset over time, reflecting how well it has performed since the strategy began.
Sharpe Ratio – Evaluates the asset’s return in relation to its risk by comparing excess returns to volatility. A higher Sharpe ratio suggests a more favorable risk-adjusted performance.
Sortino Ratio – Similar to the Sharpe ratio, but focuses only on downside risk, making it more relevant for traders who prioritize minimizing losses.
Omega Ratio – Compares the probability of achieving gains versus losses, helping to assess whether an asset provides an attractive risk-reward balance.
Maximum Drawdown – Measures the largest percentage decline from an asset’s peak value to its lowest point. This metric helps traders understand the worst-case loss scenario.
HODL Return Percentage – Displays the hypothetical return if the asset had been bought and held instead of traded actively, offering a direct comparison between passive accumulation and the active strategy.
3. Profit Table
If the Profit Table is activated, it provides a summary of the actual dollar-based gains or losses for each asset and calculates the overall profit of the system. This table includes separate columns for profit excluding HODL and the combined total when HODL gains are included. As seen in the image below, this allows users to compare the performance of the active strategy against a passive buy-and-hold approach. The HODL profit percentage is derived from the Portfolio Value input, ensuring a clear comparison of accumulated returns.
4. Best Performing Asset Table
Focuses on the single highest-returning or highest-profit asset at that moment. It highlights the symbol, the asset’s cumulative returns, risk metrics, and other relevant stats. This helps identify which asset is currently outperforming the rest.
5. Most Profitable Asset
A simpler table that underscores the asset producing the highest absolute dollar profit across the portfolio.
------------------------------------------------------------------------
Multi Asset Selection
You can include up to ten different assets (such as BTCUSDT, ETHUSDT, ADAUSDT, and so on) in this script. Each asset has two inputs: one to enable or disable its inclusion, and another to select its trading pair symbol. Once you enable an asset, the script requests the relevant market data from TradingView.
------------------------------------------------------------------------
Uniqness and Features
1. Multiple Data Fetches
Each asset is pulled from the chart’s timeframe, along with various metrics such as RSI, volatility approximations, and trend indicators.
2. Various Risk and Performance Metrics
The script internally keeps track of different measures, like Sharpe ratio (a measure of average return adjusted for risk), Sortino ratio (which focuses on downside volatility), Omega ratio, and maximum drawdown. These metrics feed into the strategy allocation table, helping you quickly assess the risk-and-return profile of each asset.
3. Real-Time Tables
Instead of having to set up complex spreadsheets or external dashboards, the script updates all tables on every new bar. The color schemes in these tables are designed to draw attention to bullish or bearish signals, positive or negative returns, and so forth.
4. HODL Comparison
You can visually compare the active strategy’s results to a separate continuous buy-on-dips accumulation strategy. This allows for insight into whether your dynamic approach truly beats a simpler, more patient method.
5. Locking Allocations
The Use Fixed Allocation input is convenient for those who want to see how holding a fixed distribution of capital performs over time. It helps in distinguishing between constant rebalancing vs a fixed, set-and-forget style.
------------------------------------------------------------------------
How to use
1. Add the Script to Your Chart
Once added, open the settings panel to configure your asset list, choose a trading system, and select the diversification approach.
2. Select Assets
Pick up to ten symbols to monitor. Disable any you do not want included. Each included asset is then handled for signals, diversification, and performance metrics.
3. Choose Trading System
Decide if you prefer RSI-based signals, a fair-value approach, or a percentile-based method, among others. The script will then flag assets as bullish, bearish, or neutral according to that selection.
4. Pick a Diversification Method
For example, you might choose Trend-Following Indicators if you believe momentum stocks or cryptocurrencies will continue their trends. Or you could use the Omega Ratio approach if you want to reward assets that have had a favorable upside probability.
5. Set Portfolio Value and HODL Parameters
Enter how much capital you want to allocate in total (for the dynamic strategy) and adjust HODL buy quantities and thresholds as desired. (HODL Profit % is calculated from the Portfolio Value)
6. Inspect the Tables
On the chart, the script can display multiple tables showing your allocations, returns, risk metrics, and which assets are leading or lagging. Monitor these to make decisions about capital distribution or see how the strategy evolves.
------------------------------------------------------------------------
Additional Remarks
This script aims to simplify multi-asset portfolio management in a single tool. It emphasizes user-friendliness by color-coding the data in tables, so you do not need extra spreadsheets. The script is also flexible in letting you lock allocations or compare dynamic updates.
Always remember that no script can guarantee profitable outcomes. Real markets involve unpredictability, and real trading includes fees, slippage, and liquidity constraints not fully accounted for here. The script uses real-time and historical data for demonstration and educational purposes, providing a testing environment for various systematic strategies.
Performance Considerations
Due to the complexity of this script, users may experience longer loading times, especially when handling multiple assets or using advanced allocation methods. In some cases, calculations may time out if too many settings are adjusted simultaneously. If this occurs, removing and reapplying the indicator to the chart can help reset the process. Additionally, it is recommended to configure inputs gradually instead of adjusting all parameters at once, as excessive changes can extend the script’s loading duration beyond TradingView’s processing limits.
------------------------------------------------------------------------
Originality
This script stands out by integrating multiple asset management techniques within a single indicator, eliminating the need for multiple scripts or external portfolio tools. Unlike traditional single-asset strategies, it simultaneously evaluates multiple assets, applies systematic allocation logic, and tracks risk-adjusted performance in real time. The script is designed to function within TradingView’s script limitations while still allowing for complex portfolio simulations, making it an efficient tool for traders managing diverse holdings. Additionally, its combination of systematic trading signals with allocation-based diversification provides a structured approach to balancing exposure across different market conditions. The dynamic interplay between adaptive trading strategies and passive accumulation further differentiates it from conventional strategy indicators that focus solely on directional signals without considering capital allocation.
Conclusion
Uptrick: Portfolio Allocation Diversification pulls multiple assets into one efficient workflow, where each asset’s signal, volatility, and performance is measured, then assigned a share of capital according to your selected diversification method. The script accommodates both dynamic rebalancing and a locked allocation style, plus an ongoing HODL simulation for passive accumulation comparison. It neatly visualizes the entire process through on-chart tables that are updated every bar.
Traders and investors looking for ways to manage multiple assets under one unified framework can explore the different modules within this script to find what suits their style. Users can quickly switch among trading systems, vary the allocation approach, or review side-by-side performance metrics to see which method aligns best with their risk tolerance and market perspective.

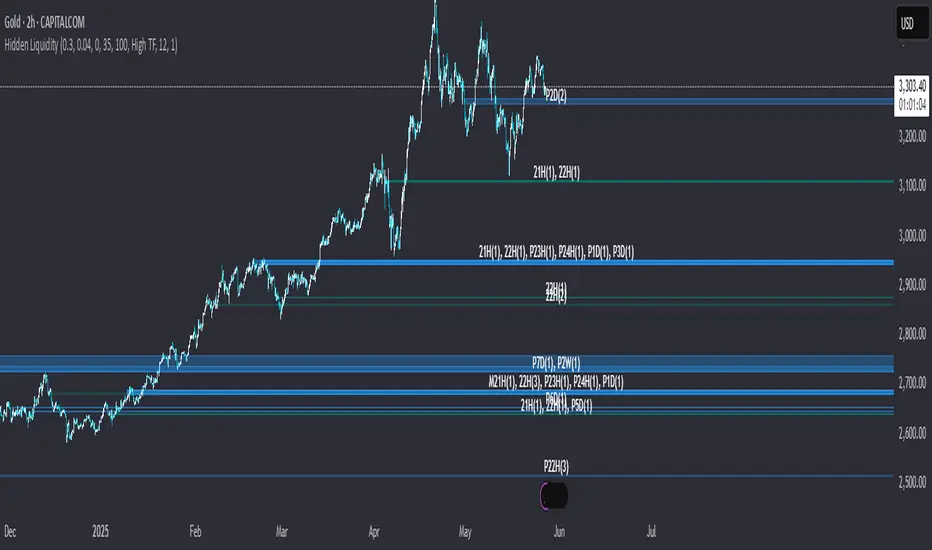
Hidden LiquidityHidden Liquidity Indicator: Detecting Breaker Blocks and Hidden Order Blocks (HOBs)
The Hidden Liquidity Indicator is a powerful tool designed to assist traders in identifying breaker blocks and hidden order blocks (HOBs). By analyzing untouched candle bodies within order blocks, it provides a systematic approach to evaluating fair value gaps (FVGs) and order blocks based on engulfing candles.
Features of the Hidden Liquidity Indicator
This indicator effectively differentiates between complete HOBs, partial HOBs and partially mitigated HOBs (PMHOBs), allowing traders to assess market structure with precision. The key classifications include:
HOB (Hidden Order Block): The candle body fully aligns within the FVGs without being touched by wicks, establishing a strong and reliable breaker block.
PMHOB (Partial Mitigated Hidden Order Block) : The candle body is mitigated by less than 50%, making it a weaker version of the Hidden OB.
PHOBs (Partial Hidden Orderblock) : The candle body fits at least by 50% in the FVG making it also weaker than a common HOB
For an HOB to be considered valid, its equilibrium must be crossed by the FVGs, ensuring a focused and high-quality analysis of market structure.
Visualization and Market Structure Analysis
The Hidden Liquidity Indicator utilizes distinct color codes to enhance readability and clarity:
Bullish HOBs – Green
Bearish HOBs – Red
PMHOBs – Orange
PHOBs - Blue
Multi-Timeframe Analysis (MTF)
The indicator is capable of identifying HOBs,PHOBS and PMHOBs across all timeframes. Traders can seamlessly integrate their preferred timeframes by configuring the settings in TradingView.
Settings
You can choose wether you want the indicator to show PHOBs and PMHOBs
Why Use the Hidden Liquidity Indicator?
This indicator provides a structured and precise methodology for analyzing order blocks and breaker blocks. By focusing on untouched candle bodies and equilibrium levels, it offers a unique perspective on market structure that is often overlooked by traditional order block indicators. Its multi-timeframe analysis capability makes it an indispensable tool for traders seeking to refine their market strategy and enhance decision-making.
This guide serves as a comprehensive reference for optimizing the Hidden Liquidity Indicator, enabling traders to leverage its full potential for effective market analys
Killzones & Previous High-Low Liquidity [odnac]This indicator is designed for use in intraday trading to visualize key "Killzones" (specific time windows during different global market sessions) and highlight liquidity levels based on previous highs and lows from the previous day and week.
It helps traders identify potential market entry and exit points based on time-based trading zones and price action levels.
Key Features:
Killzone (Market Session Timeframes):
Asia (2000-0000 UTC): Displays a shaded box over the Asia trading session.
Europe (0200-0500 UTC): Highlights the European trading session.
New York AM (0830-1100 UTC): Represents the morning session of the NY market.
New York PM (1330-1600 UTC): Represents the afternoon session of the NY market.
Each of these timeframes can be customized in terms of session start and end times, and the shaded areas will help identify high liquidity periods when the market tends to be more active.
Previous High-Low Liquidity Zones:
Previous Week's High/Low: Displays lines at the high and low of the previous week.
These are important liquidity levels that can influence price action.
Previous Day's High/Low: Shows the high and low from the previous trading day.
These are also significant levels to watch for potential support and resistance.
Filters and Customization:
Position Filtering: The indicator allows users to filter out previous highs or lows if the current price doesn't align with those levels.
For example, it can filter out previous week highs if the current price is lower than that level.
Vertical Lines: Optional vertical lines to highlight key time points such as the start and end of the previous week and day.
How It Works:
The indicator visually draws "killzones" as shaded regions on the chart, indicating periods of increased market activity.
This can help traders align their strategies with the most liquid periods of the day.
The previous high and low lines (both for the previous week and the previous day) are drawn as solid lines and can be toggled on/off in the settings.
Labels are added to indicate the specific levels and periods.
The indicator provides clear visual cues, helping traders assess if the price is near important liquidity levels and whether the current market conditions align with those levels.
Customizable Settings:
You can control whether each Killzone and liquidity level is shown on the chart.
Color customization for the various zones and lines is also available.
The indicator also lets you decide whether to hide weekend data, set time-frame limits, and choose whether or not to show vertical lines at the beginning and end of each trading session.
This indicator is aimed at traders who want to trade based on high-liquidity periods and understand where key support and resistance levels are likely to emerge based on previous price action.

True Liquidity BlocksSo basically I've been deep diving into liquidity trading concepts similar to ICT (Inner Circle Trader) and developed an indicator that breaks down market movement through a volume-centric lens.
Key Concept:
Markets move not just by price, but by resolving trapped positions
Volume segments, not time intervals, show true market dynamics
VWAP (Volume Weighted Average Price) becomes a key structural reference
What Makes This Different:
Tracks volume segments instead of fixed time frames
Identifies "trapped" trader positions
Measures liquidity level efficiency
Color-codes bars based on nearest liquidity zone
Indicator Features:
Cyan/Red liquidity levels showing buy/sell pressure
Efficiency tracking for each level
Dynamic volume-based segmentation
Bar coloring to show nearest liquidity zone
Theoretical Inspiration: Viewed markets as energy systems where:
Positions create potential energy
Price movement resolves this energy
Trends form through systematic position liquidation
VWAP Recalculation in Each Segment:
Segment Start:
VWAP resets when volume threshold User Inputtable (600,000) is reached
Uses the last 4 price values (High, Low, Close, Close) for calculation
Weighted by volume traded during that segment
Calculation Method:
pineCopy = ta.vwap(hlcc4, na(segment_start) ? true : na, 1)
hlcc4: Combines high, low, close prices
na(segment_start): Ensures reset at new segment
Weighted by volume, not equal time intervals
Key Points:
Dynamic recalculation each segment
Reflects most recent trading activity
Provides real-time fair price reference
Tracks positioning
Essentially, VWAP resets and recalculates with each new volume segment, creating a rolling, volume-weighted average price that maps trader positioning.
BSL (Buy Side Liquidity) and SSL (Sell Side Liquidity) Explained:
When a volume segment closes relative to VWAP, it creates natural positioning traps:
BSL (Cyan) - Created when price closes BELOW THAT SEGMENT'S VWAP:
Bulls are positioned BELOW VWAP (trapped)
Shorts are positioned ABOVE VWAP (In Profit)
SSL (Red) - Created when price closes ABOVE THAT SEGMENT"S VWAP:
Bulls are positioned ABOVE VWAP (trapped)
Shorts are positioned BELOW VWAP (trapped)
Core Mechanism:
VWAP acts as a reference point for trader positioning
Trapped positions create inherent market tension
Levels expand to show accumulating pressure
Color-coded for quick identification of potential move direction
The goal: Visualize where traders are likely "stuck" and must eventually resolve their positions or liquidate other's, driving market movement.
It was just a fun experiment but If ya'll have any thoughts on it or what I could do to improve it, I would appreciate it.
Just a little note, It's optimized for futures, but if u uncheck the "Rest at Futures Open ?" setting, it allow full reign of any asset with volume data.

Continuous Multi-Factor Trend Oscillator with Rolling Liquidity
// **Overview**
This script generates a *Continuous Multi-Factor Trend Oscillator* that integrates multiple market dynamics, including **long-term trends**, **short-term trends**, **volume adjustments**, **volatility factors**, **ADX trend strength**, and **rolling liquidity**. The result is a smooth, dynamic oscillator that reflects comprehensive market conditions.
### **Key Features**
1. **Long-Term Trend Score (LT Score)**: Measures the deviation of price from its EMA, normalized by standard deviation. Captures broad trend direction.
2. **Short-Term Trend Score (ST Score)**: Evaluates the slope of a short-period EMA, normalized by ATR, to reflect shorter-term momentum.
3. **Volume Adjustment**: Adjusts trend scores based on the relative volume compared to its moving average.
4. **Volatility Adjustment**: Incorporates ATR into the scoring system, penalizing or boosting scores based on current volatility compared to historical norms.
5. **ADX Trend Strength**: Uses ADX to identify trend strength, scaling scores positively or negatively depending on whether the market is trending or ranging.
6. **Rolling Liquidity**: Analyzes persistent buying or selling pressure by aggregating net buy/sell liquidity over a rolling lookback period.
### **Calculation Workflow**
- **Inputs**: Configurable parameters like long/short periods, ATR period, ADX smoothing, and volume lookback.
- **Trend Scores**: LT and ST scores are computed separately to capture trend dynamics across different timeframes.
- **Adjustments**: Volume, volatility, ADX, and rolling liquidity adjustments are calculated and scaled appropriately.
- **Final Oscillator**: Combines all scores into a single value and applies smoothing for clarity.
### **How It Works**
1. *Long-Term and Short-Term Trends*: Trend scores are calculated based on EMAs and normalized using standard deviation or ATR.
2. *Volume and Liquidity Factors*: Incorporates net up/down volume and liquidity to reflect market participation levels.
3. *ADX Strength*: Distinguishes trending vs. ranging markets, influencing the oscillator direction accordingly.
4. *Final Output*: All factors are combined into a single oscillator, smoothed using an EMA.
### **Visualization**
- The oscillator is plotted as a continuous line with dynamic scaling:
- **Above 75**: *Very Bullish*
- **Below -75**: *Very Bearish*
- **Threshold Levels (50/-50, 10/-10)**: Provide additional interpretative guidance.
- **Labels**: Displays sentiment at the last bar for quick reference (e.g., *Strongly Bullish*, *Neutral*).
### **Use Cases**
- Ideal for identifying market conditions (bullish, bearish, neutral) based on multiple factors.
- Can serve as a confirmation tool alongside price action or other indicators.
### **Customizable Parameters**
- All periods (e.g., long-term, short-term, ATR, ADX) and lookbacks are adjustable, allowing fine-tuning based on market behavior and trading preferences.
How to use:

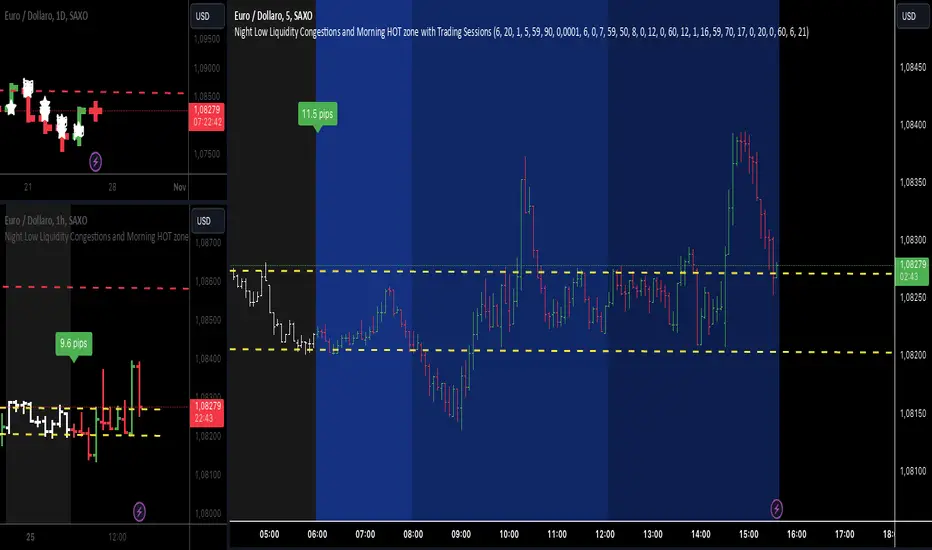
Night Low Liquidity Congestions with 4 Trading SessionsThis indicator is designed to help traders visualize and analyze key market periods of low liquidity during the night and identify high-activity zones in the morning. It also includes customizable time sessions for major global markets, including the European and American sessions, as well as the London Close session.
T he main functionalities include:
- Night Low Liquidity Phase: This highlights periods with typically low market activity during the night (default: 20:01–5:59). It also displays the total range (in pips) during this phase, allowing traders to identify potential price consolidations.
- Morning Hot Zone: This focuses on high-activity periods in the early morning (default: 6:00–7:59), providing visual cues without altering bar colors.
- European Trading Session: Displays the European market’s open hours (default: 8:00–12:00), shaded in blue, to mark increased volatility typically seen during this period.
- American Trading Session: Marks the active hours of the U.S. market (default: 12:01–16:59), where market activity tends to peak.
- London Close Area: Highlights the closing hours of the London market (default: 17:00–20:00), allowing traders to track potential liquidity shifts.
Key Features:
1. Customizable Time Sessions:
- The indicator allows for full customization of the start and end times for each market session, making it adaptable to different instruments and trading style.
- Traders can choose their preferred color and opacity for each time zone to suit their charting preferences.
2. Night Low Liquidity Pip Range Calculation:
- Automatically calculates and displays the pip range for the Night Low Liquidity phase.
- The range is colored red if it exceeds the specified threshold and green if it remains below it.
3. Alarm System:
- Customizable alerts for H1, M15, and M5 timeframes.
- Traders can set alerts to trigger just before a bar closes during specific sessions (European, American, or London Close) and on selected days of the week (Monday–Friday).
- The alarm system allows for full customization of active hours and days, giving traders full control over their notifications.
4. Clear Visual Cues:
- The indicator uses transparent shading to differentiate market sessions, making it easy to spot different phases of the trading day.
- Each session is visually distinct and can be toggled on or off based on trader preferences.
Ideal For:
- Traders who focus on intraday strategies and want to understand how market sessions affect liquidity and volatility.
- Those looking to trade during specific time windows like the Night Low Liquidity or Morning Hot Zones.
- Traders who need to automate their alerts based on specific market hours and close events for major timeframes.
Global Liquidity Index and DEMA1001. Global Liquidity Index:
The code calculates global liquidity from economic data from multiple countries and regions. Specifically, it aggregates money supply data from major economies such as the United States, Europe, China, and Japan, and sums and adjusts them to get a global liquidity index.
This index is calculated by summing data from different sources and subtracting the impact of some financial instruments (such as reverse repurchase agreements, etc.), and then converting the result into a number in trillions. This can help analyze the liquidity conditions in global money markets.
2. ROC SMA (Simple Moving Average of Rate of Change):
The code calculates the rate of change (ROC) of the global liquidity index, which is a way to measure the speed of change of the index.
Then, a simple moving average (SMA) is applied to the rate of change, which helps smooth the data and identify trends.
The ROC SMA curve is displayed in yellow to help users observe the trend of liquidity changes.
3. DEMA (Double Exponential Moving Average):
DEMA is a more complex moving average that attempts to reduce the lag of the moving average and provide a more sensitive trend response.
The calculation method is to first calculate a standard exponential moving average (EMA), then calculate the EMA of this EMA, and use these two results to calculate DEMA.
The code allows users to set the period length of DEMA (default is 100), which can adjust the speed of DEMA's response to price changes.
The DEMA curve is displayed in blue, helping users to more accurately capture the trends and changes of global liquidity indicators.

Global Net Liquidity (TG fork)Worldwide net liquidity, with trend coloring.
Global Net Liquidity attempts to represent worldwide net liquidity, and is defined as: Fed + Japan + China + UK + ECB - RRP - TGA , Where the first five components are central bank assets.
On TradingView, the indicator can be reproduced with the following equations: Global Net Liquidity = FRED:WALCL + FRED:JPNASSETS * FX_IDC:JPYUSD + CNCBBS * FX_IDC:CNYUSD + GBCBBS * FX:GBPUSD + ECBASSETSW * FX:EURUSD + RRPONTSYD + WTREGEN
However, this indicator adds a moving average cloud, and margin coloring, which eases historical trend assessment at a glance.
This indicator can be seen as an alternative representation of the accumulation/distribution indicator (and hence the same terms can be used in this description).
The Moving Average Cloud is simply the filling between the moving average (by default an EMA) and the current value. This feature was inspired by D7R ACC/DIST closed-source indicator, kudos to D7R for making such neat visual indicators.
Usage instructions:
Blue is more likely a phase of accumulation because the current value is above its historical price as defined by the moving average,
red is when this is more likely a phase of distribution.
Yellow is when the difference is below the margin, so we consider it is insignificant and that the trend is undecided. This can be disabled by setting the margin to 0.
While the color indicates if it's more likely an accumulation (blue) or distribution (red) phase or undecided (yellow), the cloud's vertical size allows to assess the strength of this tendency and the horizontal size the momentum, so that the bigger the cloud, the stronger the accumulation (if cloud is blue) or distribution (if cloud is red).
Why is that so? This is because the cloud represents the difference between the current tendency and the moving averaged past one, so a bigger cloud represents a bigger departure from recently observed tendencies. In practice, when there is accumulation, a pump in price can be expected soon, or if it already happened then it means it is indeed supported by volume, whereas if distribution, either a dump is to be expected soon, or if it already happened it means it's supported by volume.
Or maybe not necessarily a dump, but if there is a move upward in price, but the indicator indicates a strong distribution, then it means that the price movement is not supported and may not be sustainable (reversal may happen at anytime), whereas if price is going upward AND there is an accumulation (blue coloring) then it is more sustainable. This can be used to adapt strategies accordingly (risk on/risk off depending on whether there is concordance of both price and accumulation/distribution).
This indicator also includes sentiment signals that can be used to trigger alarms.
This indicator is a remix of Dharmatech's, who authored the first this Global Net Liquidity equation, kudos to them! Please show them some love if you like this indicator!

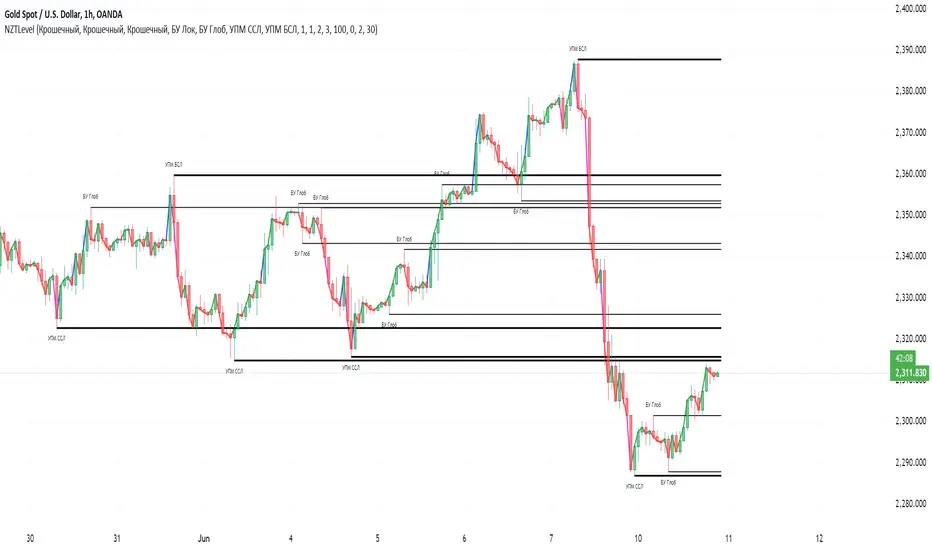
NZTLevelDESCRIPTION IN ENGLISH
🔶 INTRODUCTION
NZTLevel is an advanced indicator for TradingView, inspired by mentor Almaz , and designed to provide traders with in-depth analysis of market liquidity and the movements of key players.
🔶 CONTENT
Based on an analysis based on liquidity and tracking a key player , the indicator identifies Breaker levels and UPM (MarketMaker Position Level in RU), which help determine potential pivot points and market direction (trend) , and also shows a direction line , giving information about the state in which each candle is located on the chart (effort, consolidation or normal trend movement without effort), as well as the transparency of the candles , made specifically so that the direction line is clearly and clearly visible.
🔶 LOGIC
🔹Breaker Levels (Local and Global)
Breaker levels , divided into local and global , are identified through a detailed algorithm that takes into account the penetration of levels with high liquidity and the expected subsequent reaction of the market. These levels are visualized on the chart as lines, the color and thickness of which are customizable by the user, providing a clear understanding of the current market situation. Breaker levels allow us to determine the direction of the market , these are the levels from which we can expect a reaction, and after breaking through this level we receive valuable information
🔹UPM (Sell Stop and Buy Stop)
UPM monitors the activity of market makers and helps predict significant market movements . For example, if the last UPM indicates a buy stop, this signals the possibility of long positions, which is extremely valuable for traders looking to optimize their entries and manage risk.
🔹Directional line (Линия направленности)
The Indicator also includes a directional line that changes color depending on the strength and direction of the current movement , providing a visual representation of market trends and consolidation.
🔶 SETTINGS
🔹Text (Текст)
Allows you to configure or turn off/on the display of level text, specifying their type with text at the beginning of the level drawing (labels), as well as its size, the color of the level text at the top or bottom separately.
🔹Levels (Уровни)
Allows you to configure or turn off/on the display of the levels themselves, their color, thickness. As well as the number of penetrations of the level to remove it, as well as the number of candles for consideration and analysis by the indicator on the chart.
🔹Directional Line (Линия направленности)
Allows you to adjust the thickness of this line; you can disable it in the style tab.
🔹Graph and Candle Settings (Настройки графика и свечей)
Allows you to configure how many candles to extend the level to the right, the transparency of candles (can be disabled in styles), default colors of candles (for setting transparency)
🔶 RECOMMENDATIONS FOR USE
Customize the visual display of the indicator through the built-in settings, including the colors of the liquidity lines and their thickness.
NZTLevel surpasses basic indicators such as moving averages, Bollinger Bands, RSI, and others with a unique approach to analyzing liquidity and positioning of major players, providing traders with a comprehensive tool for making informed decisions in the market.
The indicator was developed by Temirlan Tolegenov for NZT Trader Community , March 2024, Prague, Czech Republic
ОПИСАНИЕ НА РУССКОМ ЯЗЫКЕ
🔶 ВСТУПЛЕНИЕ
NZTLevel — это продвинутый индикатор для TradingView, вдохновленный ментором Алмазом , и разработанный с целью предоставить трейдерам глубокий анализ рыночной ликвидности и движения крупных игроков.
🔶 СОДЕРЖАНИЕ
На основе анализа, основанном на ликвидности и отслеживании крупного игрока , индикатор выявляет Брейкер уровни и УПМ (Уровень Позиции МаркетМейкера) , которые помогают определить потенциальные точки разворота и направленность рынка , а так же показывает линию направленности , дающую информацию о состоянии в которой находится каждая свеча на графике (усилие, консолидация или обычное трендовое движения без усилия), а так же прозрачность свечей , сделанная специально для того, чтобы линия направленности была ясно и четко видима.
🔶 ЛОГИКА
🔹Брейкер Уровни (Локальные, Глобальные)
Брейкер уровни , подразделяются на локальные и глобальные , идентифицируются через детализированный алгоритм, учитывающий пробитие уровней с высокой ликвидностью и ожидаемую последующую реакцию рынка. Эти уровни визуализируются на графике в виде линий, цвет и толщина которых настраиваются пользователем, предоставляя четкое понимание текущей рыночной ситуации . Брейкер уровни позволяют нам определить настроение и направлениедвижения рынка , это уровни, от которых мы можем ожидать реакции, и после пробития которых мы получаем ценную информацию .
🔹УПМ (Бай стоп, Селл стоп)
УПМ отслеживает активность МаркетМейкеров и помогает проанализировать значительные рыночные движения . К примеру если последний УПМ указывает на бай стоп, это сигнализирует о возможности длинных позиций, что чрезвычайно ценно для трейдеров, стремящихся к оптимизации своих входов и управлению рисками.
🔹Линия направленности
Так же Индикатор включает линию направленности , которая изменяет цвет в зависимости от силы и направления текущего движения , предоставляя наглядное представление о трендах и консолидации рынка.
🔶 НАСТРОЙКИ
🔹Текст
Позволяет настроить или выключить/включить отображение текста уровней, уточняющий их тип текстом у начала отрисовки уровня (labels), так же его размер, цвет текста уровня сверху, или снизу отдельно.
🔹Уровни
Позволяет настроить или выключить/включить отображение самих уровней, их цвет, толщину. А так же количество пробитий уровня для его удаления, как и количество свеч для рассмотрения и анализа индикатором на графике.
🔹Линия направленности
Позволяет настроить толщину этой линии, отключить ее можно во вкладке style (стиль)
🔹Настройки графика и свечей
Позволяют настроить то, на сколько свеч протягивать уровень направо, прозрачность свечей (можно отключить в стилях (style)), цвета свечей по умолчанию (для настройки прозрачности)
🔶 РЕКОМЕНДАЦИИ К ИСПОЛЬЗОВАНИЮ
Настроить визуальное отображение индикатора через встроенные настройки, включая цвета линий ликвидности и их толщину.
NZTLevel превосходит базовые индикаторы, такие как скользящие средние, Bollinger Bands, RSI, и другие, благодаря уникальному подходу к анализу ликвидности и позиционирования крупных игроков, предоставляя трейдерам комплексный инструмент для принятия обоснованных решений на рынке.
Индикатор разработан Темирланом Толегеновым для международного сообщества NZT Trader , Март 2024, Прага, Чешская Республика
The indicator is published in accordance and respect to all House Rules of the TradingView platform.
Индикатор опубликован в соответствии и уважением ко всем внутренним правилами платформы TradingView.
STIC bullish and bearish hunter with FVGSmart Trading and Investment Companion (STIC) is a sophisticated tool designed to identify and visualize inducement, market structure, market trends, track liquidity, and project and forecast price action for all applicable assets. it has been tested to work on all timeframes and has been traded on stock, forex, and crypto assets.
This script is an upgraded version of previous STIC indicator, which you can use in addition to it or separately as you deem fit
Traders/ investor that are familiar with market structure, inducement, candlestick psychology, trend-following indicatorsand Fair Value Gap FVG will find it easy to adopt this trading and investment companion. As stated below, this is how it works.
Features and how to use
1st of all, after adding the indicator to yoursuperchart, you want to endusre to set your to so as to enable you see the text labeling clearly. to do that, after adding the indicator to your chart, right click it on the list, you will se the Visual order option.
Special Extreme Alert!
By analyzing the trends and dimensions, we are able to predict market extremes conditions, especially in pump and dump scenarios. (the bullish or bearish P/D extreme alerts).
Market flip arrow
The arrows trigger to indicate when the market flips to bullish (green) or bearish (red) conditions. note that this arrow is just a market flip confirmation and it it triggered by market trends, it does not come one time and sometimes later after market trigger conditions had been met.
circled in white.
Buy or sell potential {The tiny yelow(sell) and blue(buy) triangle}
By analyzing market extreme conditions, market sentiment, and liquidity, the buy/sell potential alert trigger is able to determine the state of the market, This can and should be used in combination with the market flip line (MFL) [the yellow line from , market flip trigger (MFT) (purple line), and market support/resistance line (MSR)(blue line) .
Market flip Line (Blue line) (MFL): the MFL is useful to also understand the market phase; a candle close above the MFL is bullish, while a candle close Below, the MFL is bearish. You are, however, expected to experience market retests and rejections coupled with support and resistance to follow through with the predicted direction. Patience is a valuable virtue in trading.
Extended sell or buy hunt (Red and Green Triangle)
this is real-time triangles indicator just like every other indicator on theis chart that indicates the market direction labeled with buy and sell. Note that the market-extended extreme can occur multiple times in the same direction. Hence, we'll advise having multiple trade entries.
The flip support line
Market Flip Trigger Line (MFTL) (Magenta): When the market crosses and closes below or above the Market Flip Trigger Line, you should wait for a confirmation. a confirmation is usually a retest or rejection of the line. A candle close and reject indicates the market as flip direction and it is going for a correction or major reversal. it is applicable on all timeframe.
As mentioned earlier, if you understand market structure and sentiment, using the uFVG, iFVG, upLQTY, downLQTY and BOS will be easy. however, this is how it works, you may need tohave and expanded readbout market structure for additional knowledge.
upLQTY (Bullish liquidity inducement)
The indicator appear at the close and confirmation on the 3rd candle and it is extended to only appear on 200 bars applicable on all timeframes.
This is a bullish sentiment and liquidty inducement order block that occurs, leading to the break of trend structure and change of character. Meaning the market sentiment as change which is backed up by liquidity in that region, which mostly gets filled, especially on lower timeframes before the price action continues. If price revese breaks and hold above this region, it invalidates the order block. This will always appear when there is a confirmed change of character CHoCH to the bullish side.
downLQTY (Bearish liquidity inducement) The indicator appear at the close and confirmation on the 3rd candle and it is extended to only appear on 200 bars applicable on all timeframes. It is and inverse of the upLQTY.
like order block, these are supply and demand zones that has the potential to change the direction of a trade. This is a bearish order block that occurs, leading to the break of structure and change of character. Meaning there is bearish liquidity yet to be accounted for in the region, which mostly gets filled, especially on lower timeframes before the price action continues. If broken, it invalidates the order block. This will always appear when there is a confirmed change of character from CHoCH to the bearish side.
Fair Value Gap
From general knowledge, FVG also know as Fair value gaps are inbalnace created by a 3 candlestick pattern where the top of the bottom candles doesn't cross the bottom of the top candle. like order block, these are supply and demand zones that has the potential to change the direction of a trade. This mostly indicate the presense of big plays in the market. for STIC indicator, FVG are labeled as listed below;
UFVG, also FVGup, {Colour green box} = bullish imbalance fair value gap
IFVG, aka FVGdown, {Red box} = bearish imbalance fair value gap
OIFVG, {Yellow box, no label} = other imbalances fair value gab
You should not that FG has upper, lower and middle band, any of the this area can be induced and filled by price.
Alert Conditions!
Buy alert conditions
- Any bullish buy alert
- Bullish hunt
- Re-entry Buy
- Sharp Market Sell rejection
- Buy potential
- upLQTY
Long position Exit conditions
- ExtremeB
- Profit
- Sell hunt
The Entry, exit and trail profit alert trigger should be used as position exit conditions either for a Long (Buy) or Short (Sell) situation and should be set as OPB (Once Per Bar). Using it as entry for exit or vice versa as shown not to be very profitable. hence the need to combine with other order entry alerts like the Any bullish or Bearish alerts
Sell alert conditions ( NOTE: All Sell alert are not yet included in this current version as this is targeted towards bullrun.)
- Sell potential
- Sell triangle (Sell hunt)
- downLQTY
and any trail profit alert, this alert put into consideration all the conditions required to trail profit.
Risk management advice
Patience and a good risk management strategy are required to be profitable trader using this tool. You need to ensure not to overleverage, and you should have multiple entries in case the buy coditions/alert shows again below the previous buy alert before a sell condition/alert occurs.

Market Structure with Inducements & Sweeps [LuxAlgo]The Market Structure with Inducements & Sweeps indicator is a unique take on Smart Money Concepts related market structure labels that aims to give traders a more precise interpretation considering various factors.
Compared to traditional market structure scripts that include Change of Character (CHoCH) & Break of Structures (BOS) -- this script also includes the detection of Inducements (IDM) & Sweeps which are major components of determining other structures labeled on the chart.
SMC & price action traders have historically considered this a more accurate representation of market structure by including these components.
🔶 USAGE
Below we can see a diagram for how market structure is displayed within the Market Structure with Inducements & Liquidity indicator.
Change of Characters (CHoCH) are based on swing points detection, while Break of Structures (BOS) are based on trailing maximum & minimums from the detected Change of Characters. We do this for a more dynamic & timely display of market structure.
🔹 Inducements (IDM)
Traders that consider inducements as a part of their analysis of Change of Characters & Break of Structures can more easily avoid fakeouts within trends as shown below.
In this script IDM's are always required between each market structures.
🔹 Sweeps of Liquidity (x)
SMC traders looking to properly analyze market structure need to look for sweeps of liquidity to ensure levels that are wicked are noted as sweeps, while levels that are fully closed above / below are labeled as confirmed market structures.
In the chart below we can see a Sweep of Liquidity which typically can occur on the longer term price action and indicate a potential reversal.
Notably, since labels such as CHoCH or BOS's can occur at the same level as a Sweep of liquidity, we have allowed the indicator to display the market structure label at the current bar in the event this happens.
The Sweeps of Liquidity are also based on trailing maximum / minimum, which allows for a continuous evaluation of areas for liquidity sweeps to occur.
This can be helpful for traders looking for longer term & shorter term sweeps.
🔶 SETTINGS
CHoCH Detection Period: Detection period for CHoCH's, higher values will return longer term CHoCH's.
IDM Detection Period: Detection period for IDM's, higher values will return longer term IDM's.
Thank you all for 500k followers on TradingView! Enjoy!

BigBeluga - Smart Money ConceptsSmart Money Concepts (SMC) is a comprehensive toolkit built around the around the principles of "smart money" behavior, which refers to the actions and strategies of institutional investors.
SMC transcends traditional technical analysis by delving deeper into this framework. This approach allows users to decipher the actions of these influential players, anticipate their potential impact on market dynamics, and gain insights beyond just price movements.
This all-in-one toolkit provide the user with a unique experience by automating most of the basic and advanced concepts on the chart, saving them time and improving their trading ideas.
🔹Real-time market structure analysis simplifies complex trends by pinpointing key support, resistance, and breakout levels.
🔹Advanced order block analysis leverages detailed volume data to pinpoint high-demand zones, revealing internal market sentiment and predicting potential reversals. This analysis utilizes bid/ask zones to provide supply/demand insights, empowering informed trading decisions.
🔹Imbalance Concepts (FVG and Breakers) allows traders to identify potential market weaknesses and areas where price might be attracted to fill the gap, creating opportunities for entry and exit
🔹Swing failure patterns help traders identify potential entry points and rejection zones based on price swings
🔹Liquidity Concepts, our advanced liquidity algorithm, pinpoints high-impact events, allowing you to predict market shifts, strong price reactions, and potential stop-loss hunting zones. This gives traders an edger to make informed trading decisions based on multi-timeframe liquidity dynamics
🔶 FEATURES
The indicator has quite a lot of features that are provided below:
Swing market structure
Internal market structure
Mapping structure
Discount/Premium zone
Adjustable market structure
Strong/Weak H&L
Sweep
Volumetric Order block / Breakers
Fair Value Gaps / Breakers (multi-timeframe)
Swing Failure Patterns (multi-timeframe)
Deviation area
Equal H&L
Liquidity Prints
Buyside & Sellside
Sweep Area
Highs and Lows (multi-timeframe)
🔶 BASIC DEMONSTRATION
The preceding image illustrates the market structure functionality within the Smart Money Concepts indicator.
Solid lines: These represent the core indicator's internal structure, forming the foundation for most other components. They visually depict the overall market direction and identify major reversal points marked by significant price movements (denoted as 'x').
Dotted lines: These represent an alternative internal structure with the potential to drive more rapid market shifts. This is particularly relevant when a significant gap exists in the established swing structure, specifically between the Break of Structure (BOS) and the most recent Change of High/Low (CHoCH). Identifying these formations can offer opportunities for quicker entries and potential short-term reversals.
Sweeps (x): These signify potential turning points in the market where liquidity is removed from the structure. This suggests a possible trend reversal and presents crucial entry opportunities. Sweeps are identified within both swing and internal structures, providing valuable insights for informed trading decisions.
🔶 USAGE & EXAMPLES
The image above showcases a detailed example of several features from our toolkit that can be used in conjunction for a comprehensive analysis.
Price rejecting from the bullish order block (POC), while printing inside a bullish SFP and internal structure turning bullish (Internal CHoCH).
The image further demonstrates how two bearish order blocks could potentially act as resistance zones when prices approach those levels. These areas might also offer attractive locations to place take-profit orders.
The price has reached our first take-profit level, but is exhibiting some signs of weakness, suggesting a potential pullback which could put the trade at higher risk.
On the other hand, the price action currently exhibits strong bullish sentiment, suggesting favorable entry points and a potential upward trend.
The price has now fully reached our take-profit zone and is also exhibiting bearish confluence, indicating a potential price reversal or trend shift.
🔶 USING CONFLUENCE
The core principle behind the success of this toolkit lies in identifying "confluence." This refers to the convergence of multiple trading indicators all signaling the same information at a specific point or area. By seeking such alignment, traders can significantly enhance the likelihood of successful trades.
In the image above we can see a few examples of the indicator used in confluence with other metrics included in the toolkit.
Liquidity Prints within order blocks
SFP close to the POC
Sweep in liquidity close to a fair value gaps
These are just a few examples of what applying confluence can look like.
🔶 SETTINGS
Window: limit calculation period
Swing: limit drawing function
Internal: a period of the beginning of the internal structure
Mapping structure: show structural points
Algorithmic Logic: (Extreme-Adjusted) Use max high/low or pivot point calculation
Algorithmic loopback: pivot point look back
Premium / Discount: Lookback period of the pivot point calculation
Show Last: Amount of Order block to display
Hide Overlap: hide overlapping order blocks
Construction: Size of the order blocks
Fair value gaps: Choose between normal FVG or Breaker FVG
Mitigation: (close - wick- avg) point to mitigate the order block/imbalance
SFP lookback: find a higher / lower point to improve accuracy
Threshold: remove less relevant SFP
Equal h&L: (short-mid-long term) display longer term
Any Alert(): Trigger alerts based on the selected inputs
Bezahltes Script

Price Action Toolkit | Flux Charts💎 GENERAL OVERVIEW
Introducing our new Price Action Toolkit indicator! Price Action Toolkit integrates key level strategy , traditional supply-demand analysis , and market structures to help traders in their decisions. Now with features that are available to use in multiple timeframes!
Features of the new Price Action Toolkit indicator :
Volumized Fair Value Gaps (FVGs)
Volumized Order & Breaker Blocks
Identification of Market Structures
Equal Highs & Lows
Buyside & Sellside Liquidity
Premium & Discount Zones
MTF Highs & Lows (Daily, Weekly, Monthly, Pre-Market)
Customizable Settings
📌 HOW DOES IT WORK ?
We believe that the analytical elements that are within this indicator work best when they co-exist with each other on the chart. Trading often requires taking multiple elements into consideration for better accuracy on market analysis. Thus, we combined some of the useful strategies in one indicator for ease of use.
1. Volumized Fair Value Gaps
Fair value gaps often occur when there is an imbalance in the market, and can be spotted with a specific formation on the chart.
The volume when the FVG occurs plays an important role when determining the strength of it, so we've placed two bars on the FVG zone, indicating the high & low volumes of the FVG. The high volume is the total volume of the last two bars on a bullish FVG, while the low volume is - of the FVG. For a bearish FVG, the total volume of the last two bars is the low volume. The indicator can also detect FVGs that exist in other timeframes than the current chart.
2. Volumized Order Blocks
Order blocks occur when there is a high amount of market orders exist on a price range. It is possible to find order blocks using specific formations on the chart.
The high & low volume of order blocks should be taken into consideration while determining their strengths. The determination of the high & low volume of order blocks are similar to FVGs, in a bullish order block, the high volume is the last 2 bars' total volume, while the low volume is the oldest bar's volume. In a bearish order block scenerio, the low volume becomes the last 2 bars' total volume.
3. Volumized Breaker Blocks
Breaker blocks form when an order block fails, or "breaks". It is often associated with market going in the opposite direction of the broken order block, and they can be spotted by following order blocks and finding the point they get broken, ie. price goes below a bullish order block.
The volume of a breaker block is simply the total volume of the bar that the original order block is broken. Often the higher the breaking bar's volume, the stronger the breaker block is.
4. Market Structures
Sometimes specific market structures form and break as the market fills buy & sell orders. Formed Change of Character (CHoCH) and Break of Structure (BOS) often mean that market will change direction, and they can be spotted by inspecting low & high pivot points of the chart.
5. Equal Highs & Lows
Equal Highs & Lows occur when there is a significant amount of difference between a candle's close price and it's high / low value, and it happens again in a specific range. EQH and EQL usually mean there is a resistance that blocks the price from going further up / down.
6. Buyside & Sellside Liquidity
Buyside & Sellside Liquidity zones are where most traders place their take-profits and stop-losses in their long / short positions. They are spotted by using high & low pivot points on the chart.
7. Premium & Discount Zones
The premium zone is a zone that is over the fair value of the asset's price, and the discount zone is the opposite. They are formed by the latest high & low pivot points.
8. MTF Highs / Lows
MTF Highs / Lows are actually pretty self-explanatory, you can enable / disable Daily, Weekly, Monthly & Pre-Market Highs and Lows.
🚩UNIQUENESS
Our new indicator offers a comprehensive toolkit for traders, combining multiple analytical elements with customizable settings to aid in decision-making across different market conditions and timeframes. The volumetric information of both FVGs and Order & Breaker Blocks will be present in your chart to serve you greater detail about them. The indicator also efficiently identifies market structures, liquidity zones and premium & discount zones to give you an insight about the current state of the market. And finally with the use of multiple timeframes , you can easily take a look at the bigger picture. We recommend reading the "How Does It Work" section of the descripton to get a better understanding about how this indicator is unique to others.
⚙️SETTINGS
1. General Configuration
Show Historic Zones -> This will show historic Fair Value Gaps, Order & Breaker Blocks and Sellside & Buyside liquidities which are expired.
2. Fair Value Gaps
Enabled -> Enables / Disables Fair Value Gaps
Volumetric Info -> The volumetric information of the FVG Zones will be rendered if activated.
Zone Invalidation -> Select between Wick & Close price for FVG Zone Invalidation.
Zone Filtering -> With "Average Range" selected, algorithm will find FVG zones in comparison with average range of last bars in the chart. With the "Volume Threshold" option, you may select a Volume Threshold % to spot FVGs with a larger total volume than average.
FVG Detection -> With the "Same Type" option, all 3 bars that formed the FVG should be the same type. (Bullish / Bearish). If the "All" option is selected, bar types may vary between Bullish / Bearish.
Detection Sensitivity -> You may select between Low, Normal or High FVG detection sensitivity. This will essentially determine the size of the spotted FVGs, with lower sensitivies resulting in spotting bigger FVGs, and higher sensitivies resulting in spotting all sizes of FVGs.
3. Order Blocks
Enabled -> Enables / Disables Order Blocks
Volumetric Info -> The volumetric information of the Order Blocks will be rendered if activated.
Zone Invalidation -> Select between Wick & Close price for Order Block Invalidation.
Swing Length -> Swing length is used when finding order block formations. Smaller values will result in finding smaller order blocks.
4. Breaker Blocks
Enabled -> Enables / Disables Breaker Blocks
Volumetric Info -> The volumetric information of the Breaker Blocks will be rendered if activated.
Zone Invalidation -> Select between Wick & Close price for Breaker Block Invalidation.
5. Timeframes
You can set and enable / disable up to 3 timeframes. Note that only higher timeframes than the current chart will work.
6. Market Structures
Break Of Structure ( BOS ) -> If the current structure of the market is broken in a bullish or bearish direction, it will be displayed.
Change Of Character ( CHoCH ) -> If the market shifts into another direction, it will be displayed.
Change Of Character+ ( CHoCH+ ) -> This will display stronger Change Of Characters if enabled.
7. Equal Highs & Lows
EQH -> Enables / Disables Equal Highs.
EQL -> Enables / Disables Equal Lows.
ATR Multiplier (0.1 - 1.0) -> Determines the maximum difference between highs / lows to be considered as equal. Lower values will result in more accurate results.
8. Buyside & Sellside Liquidity
Zone Width -> Determines the width of the liquidity zones, 1 = 0.025%, 2 = 0.05%, 3 = 0.1%.
9. Premium & Discount Zones
Enabled -> Enables / Disables Premium & Discount Zones.
10. MTF Highs / Lows
You can enable / disable Daily, Weekly, Monthly & Pre-Market Highs and Lows using this setting. You can also switch their line shapes between solid, dashed and dotted.

Central Bank Liquidity YOY % ChangeThis shows the percent change from a year ago (YOY%) in Central Bank Liquidity
It's important to the study rate of change data in this liquidity metric and compare it to the nominal chart.
When this chart is accelerating, liquidity is being added, meaning it's a good time to be in assets.
When this chart is declining, liquidity is being removed, meaning it's a good time to be in cash.
Bottoms in markets coincide with the rate of change of liquidity going from negative (below the zero line) to positive (above zero)
Central Bank Liquidity = Total value of the assets of all Federal Reserve Banks - Overnight Reverse Repurchase Agreements (RRP) - The Treasury General Account (TGA)

Seek liquidityGuided by ICT tutoring, I create this versatile "Seek liquidity" indicator.
This indicator shows an easy way to view the Liquidity that has been Created - Eliminated - and what liquidity is left to eliminate.
Liquidity levels appear after the sessions are over, and the lines get stuck on the candle that eliminates them.
Timing session =
//---Asian
- 18:00-00:00
//---London
- 00:00-02:00
- 02:00-05:00
- 00:00-06:00
//---New York
- 06:00-12:00
- 09.30-12.00
//---Lunch
- 12:00-13:30
//---PM
- 1.30pm - 4.00pm
- 12:00-18:00
The user has the possibility to:
- Choose whether or not to view sessions
- Choose to show levels from previous sessions
- Choose to show today's session levels
- Choose whether to view the boxes
- Choose to view the division is open daily
The indicator should be used as ICT shows in its concepts, the indicator takes into consideration both the previous and today's Liquidity, and the session levels can be used for a reversal as in the example below:

Impulse-Correction MappingAbout
Impulse-Correction Mapper is an indicator of impulses and corrections (valid pullbacks).
Consecutive candlesticks moving in the same direction means an impulse, and a pullback below/above the previous candlestick means a correction.
This way you can identify IDM zones and find significant POIs on the chart.
Below, you can observe valid pullbacks :
And now, the invalid pullbacks :
The impulse and correction shows us the strength of the bulls or bears and also helps us to identify important liquidity areas, including IDMs.
Each high and low of the impulse-correction serves as liquidity for the institutional algorithmic bots.
The indicator can be a self-sufficient tool for market analysis and identification of liquidity swaps. If the price made a liquidity sweep - it can serve as a signal for a reversal to the nearest liquidity area.
When evaluating the daily movement, you can focus on the impulse-correction indicator: if there is a correction - it is very likely that the price will turn around and you can look for a confirmed entry point to the LTF.
The momentum-correction indicator is the basis of the entire Advanced SMC strategy - it is the foundation for determining the market structure.
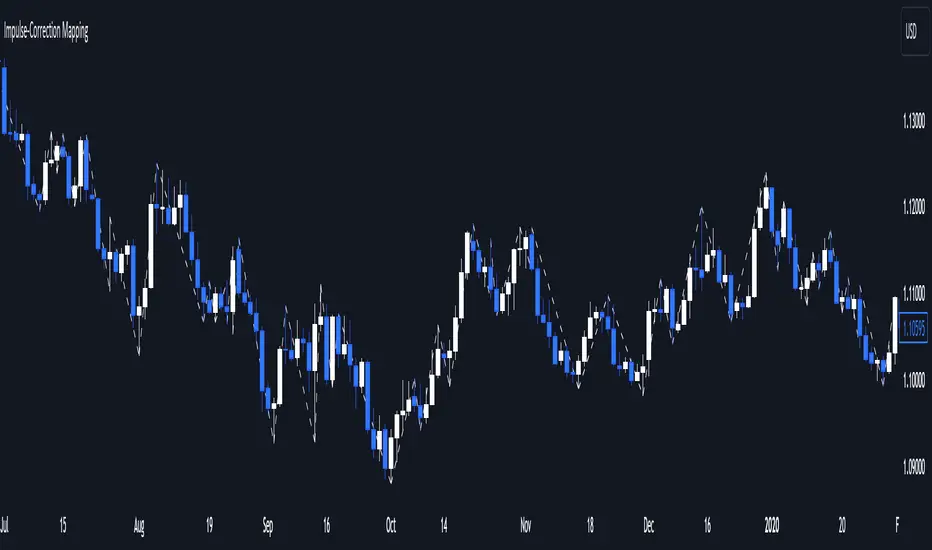
Master Pattern [LuxAlgo]The Master Pattern indicator is derived from the framework proposed by Wyckoff and automatically displays major/minor patterns and their associated expansion lines on the chart.
Liquidity levels are also included and can be used as targets/stops. Note that the Liquidity levels are plotted retrospectively as they are based on pivots.
🔶 USAGE
The Master Pattern indicator detects contraction phases in the markets (characterized by a lower high and higher low). The resulting average from the latest swing high/low is used as expansion line. Price breaking the contraction range upwards highlights a bullish master pattern, while a break downward highlights a bearish master pattern.
During the expansion phase price can tend to be stationary around the expansion level. This phase is then often followed by the price significantly deviating from the expansion line, highlighting a markup phase.
Expansion lines can also be used as support/resistance levels.
🔹 Major/Minor Patterns
The script can classify patterns as major or minor patterns.
Major patterns occur when price breaks both the upper and lower extremity of a contraction range, with their contraction area highlighted with a border, while minor patterns have only a single extremity broken.
🔶 SETTINGS
Contraction Detection Lookback: Lookback used to detect the swing points used to detect the contraction range.
Liquidity Levels: Lookback for the swing points detection used as liquidity levels. Higher values return longer term liquidity levels.
Show Major Pattern: Display major patterns.
Show Minor Pattern: Display minor patterns.

Global LiquidityThe "Global Liquidity" script is an indicator that calculates and displays the global liquidity value using a formula that takes into account the money supply of several major economies. The script utilizes data from various sources, such as the Federal Reserve Economic Data (FRED), Economics, and FX_IDC.
The indicator plots the global liquidity value as a candlestick chart and breaks it down into two categories: the Euro-Atlantic region (West) and the rest of the world (East). The values are denominated both in inflation-adjusted dollars and in trillions of dollars. The script also calculates the spread between the Euro-Atlantic region and the rest of the world.
Traders and investors can use this indicator to gauge the overall liquidity of the global economy and to identify potential investment opportunities or risks. By breaking down the liquidity value into different regions, traders can also gain insights into regional economic trends and dynamics.
Note that this script is subject to the terms of the Mozilla Public License 2.0 and was created by rodopacapital.
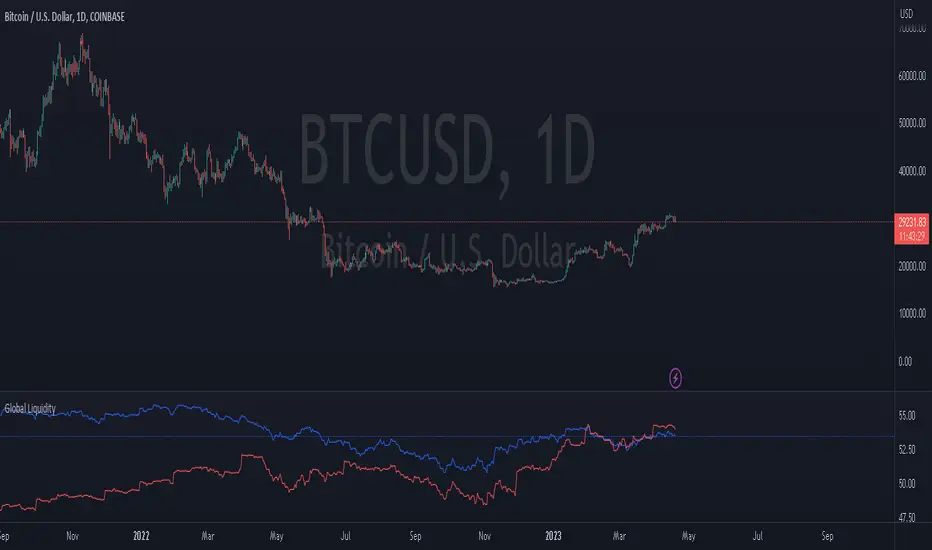
USD Liquidity IndexThis USD Liquidity Index composed of 2 parts, total assets and major liabilities of the Federal Reserve .
There is a certain positive correlation between USD liquidity and risk asset price changes in history.
Suggested that USD Liquidity is mostly determined by the Federal Reserve balance (without leveraged), this index deducts three major liabilities from the total assets (in green color line) of the Federal Reserve . They are the currency in circulation (WCURCIR) in gold color, the Treasury General Account (WTREGEN) in blue color, the Reverse Repo (RRPONTSYD) in red color.
The grey line is the calculation result of the USD Liquidity Index. With it goes up, liquidity increases, vice versa.

Liquidation Levels v2 [LG]The main premise of this indicator is to identify when large cryptocurrency futures positions are opened, and then plot the liquidation levels of those positions. Market makers know this data and tend to push price towards these levels, as there is guaranteed liquidity at or approaching those levels.
Remember, we want to buy when others are forced to sell, not when they want to sell, and vice versa. Whales want to position, but need to do so in areas of larger liquidity, as they want to minimize slippage and detection as much as possible.
This indicator is very useful during times of chop, when the market is taking liquidity anywhere it exists as whales are forcing retail players out of their positions.
This indicator will also plot where positions with a total value in excess of the user-defined threshold are opened or closed, so you are able to better gauge how market participants are reacting to price levels.
Commonly used leverage levels are 100x, 50x, and 25x, but can be adjusted by the user depending on what they are noticing is attracting price levels.
This indicator is recommended for use on the 1 minute chart of the Binance BTCUSD perpetual contract pair. This will allow for as much precision as possible for the majority of users. Note: The only supported coin at this point is BTC - other coins to follow soon.
SUMMARY
1) View liquidation levels of large positions opened
2) View exact moments where large positions are opened or closed
3) Gauge available liquidity to upside or downside to better assist in determining longer term reversal points
COMING SOON
1) Additional coins
2) VPVR inspired vertical histogram or other visualization tool summarizing total available liquidity at specific price level
3) Total delta of available long and short liquidity
4) Push notifications when price takes liquidity
5) Requests as outlined in the comments
This indicator was inspired by the Hyblock Capital liquidation levels and offers an improvement upon the popular existing Liquidation Levels indicator by mlapplications.
