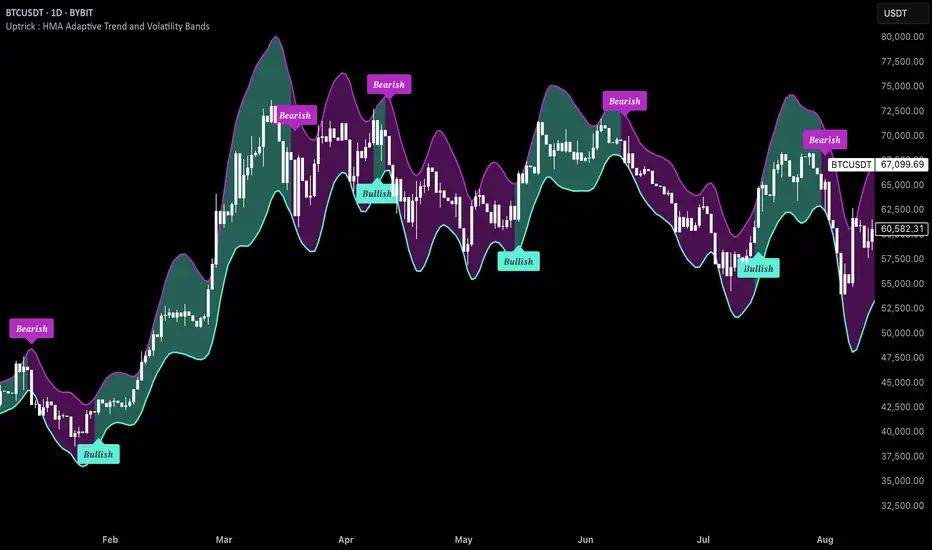
Uptrick : HMA Adaptive Trend and Volatility BandsThis proprietary trading indicator, named "Uptrick: HMA Adaptive Trend and Volatility Bands," offers a sophisticated blend of trend detection and volatility measurement for financial markets. Designed to overlay directly on the price chart, it leverages a variety of technical analysis tools to provide clear visual signals and comprehensive market insights.
Key Features:
Hull Moving Average (HMA) with Volatility Bands:
HMA Calculation: Utilizes the Hull Moving Average (HMA) for smooth trend identification, applied to the average price of high and low (hl2).
Adaptive Volatility Bands: Incorporates bands around the HMA based on a responsive standard deviation adjusted by an Exponential Moving Average (EMA). These bands dynamically expand and contract with market volatility.
Parameters:
Length: Configurable period for the HMA and standard deviation (default 14).
Multiplier: Determines the width of the bands (default 2.0).
MACD (Moving Average Convergence Divergence):
MACD Calculation: Includes fast and slow EMA periods with a signal line to detect trend direction and strength.
Histogram: Difference between MACD line and signal line to visualize momentum.
Parameters:
Fast Length: Short-term EMA period (default 6).
Slow Length: Long-term EMA period (default 13).
Signal Length: Signal line EMA period (default 5).
Relative Strength Index (RSI):
RSI Calculation: Measures the speed and change of price movements to identify overbought or oversold conditions.
Parameter:
RSI Length: Period for RSI calculation (default 10).
Average True Range (ATR):
ATR Calculation: Evaluates market volatility by considering the true range over a specified period.
Parameter:
ATR Length: Period for ATR calculation (default 7).
Volume and Liquidity Analysis:
Volume: Directly incorporated into the indicator to gauge market activity.
Liquidity: Assessed using the HMA of volume to determine the ease of trade execution.
Parameter:
Liquidity Length: Period for HMA of volume calculation (default 14).
Trend Identification:
Uptrend Conditions: A combination of positive MACD histogram, RSI above 50, ATR above its HMA, and volume exceeding liquidity.
Downtrend Conditions: Negative MACD histogram, RSI below 50, ATR above its HMA, and volume exceeding liquidity.
Visual Cues: Color-coded background (green for uptrend, red for downtrend) with corresponding labels on the price chart to indicate trend shifts.
Additional Moving Averages and Bollinger Bands:
SMA (Simple Moving Average): Includes 50 and 200-period SMAs for long-term trend analysis.
EMA (Exponential Moving Average): Includes a 20-period EMA for short-term trend analysis.
Bollinger Bands: Standard deviation bands around a 20-period SMA to measure market volatility and identify potential breakout points.
Information Table:
Real-Time Data Display: An optional table that provides current values for key metrics such as price, volume, liquidity, ATR, RSI, MACD histogram, SMAs, EMA, Buy+Sell Pressure, ATH, Global liquidity, Distance from ATH and Bollinger Bands, offering traders a comprehensive snapshot of market conditions.
Visualization:
Upper and Lower Bands: Clearly plotted with distinct colors (blue for upper, red for lower) to highlight volatility boundaries.
Trend Labels: Automatic annotations on the chart to signal uptrend and downtrend conditions.
Background Highlighting: Subtle shading to visually emphasize prevailing trend conditions.
This indicator is designed for traders seeking an advanced tool to detect trends, measure volatility, and make informed trading decisions based on comprehensive technical analysis. By integrating multiple technical indicators and providing clear visual signals, it aims to enhance trading accuracy and market insight.
In den Scripts nach "liquidity" suchen
FU Candle Indicator V3.2What the FU Candle Indicator does:
First we need to understand what FU candles are. There's bullish and bearish FU candles.
Bullish FU candles are candles that have a long wick that takes out the previous candles low, then turns around and closes above the high of the previous candle.
Bearish FU candles are candles that have a long wick that takes out the previous candles high, then turns around and closes below the low of the previous candle.
Then there's so called attempted FU candles (ATT FU)
The difference between normal FU candles and ATT FU candles is, that the ATT FU candle doesn't close above/below the high/low of the previous candle but only above the previous candle's body close.
Bullish ATT FU Candle:
Bearish ATT FU Candle:
Detection of Bullish FU Candles:
Bullish FU Candles are detected by measuring the distance between the low of the previous candle and the low of the current candle.
Then the distance between the previous candles high and the current candles close price are measured.
If current candle low < previous candle low and current candle close > previous candle high = Bullish FU Candle.
Detection of Bullish ATT FU Candles:
Bullish ATT FU Candles are detected by measuring the distance between the low of the previous candle and the low of the current candle.
Then the distance between the previous candles close or open price and the current candles close price are measured. If the previous candle closed bearish, the open price is used for comparison, if the previous candle closed bullish, the close price is used for comparison.
If current candle low < previous candle low and current candle close > previous candle open or close = Bullish ATT FU Candle.
Detection of Bearish FU Candles:
Bearish FU Candles are detected by measuring the distance between the high of the previous candle and the high of the current candle.
Then the distance between the previous candles low, AND the current candles close price are measured.
If current candle high > previous candle high, AND current candle close < previous candle low = Bearish FU Candle.
Detection of Bearish ATT FU Candles:
Bearish ATT FU Candles are detected by measuring the distance between the high of the previous candle and the high of the current candle.
Then the distance between the previous candles close or open price and the current candles close price are measured. If the previous candle closed bearish, the open price is used for comparison, if the previous candle closed bullish, the close price is used for comparison.
If current candle high > previous candle high and current candle close < previous candle open or close = Bearish ATT FU Candle.
What makes this script unique?
It shows and liquidity grab and a break of structure on a lower timeframe in one candle.
It allows to adjust the settings for the asset and timeframe you're using
The built in filters (Fractal Filter and EMA Filter) are both optional but allow to filter out certain candles and most importantly it leaves room for experimentation and optimisation to your trading style.
Input Settings and how to use them:
Bullish FU Candle Color --> This setting is to set the color for bullish FU candles.
Bearish FU Candle Color --> This setting is to set the color for bearish FU candles.
Chart --> This setting enables you to display FU's on different timeframes instead of only the current time. It's set to current timeframe by default.
Liq. Grab in Points --> This is the strength of the liquidity grab. By how many points has the current candle taken out the low/ high of the previous candle. It's set to 20 by default but it has to be adjusted to the timeframe and asset you're using.
Engulfing in Points --> This the strength of the engulfing of the previous candle. It measures the distance of the current close price to the open, close, high or low of the previous candle. It depends if the current candle is bullish or bearish and if the previous candle was bullish or bearish and if ATT FUs are enabled but this setting applies to all methods. It's set to 20 by default but you have to adjust it to the asset and timeframe you're using.
Min. Size in Points --> This setting is to filter out tiny candles. It measures the overall size of the FU candle from low to high. It's set to 20 by default but you have to adjust it to the asset and timeframe you are using.
Min. Body Size in Points --> This setting is to filter out FU candles that have a tiny body. It measures the size of the body from open to close. It's set to 20 by default but you have to adjust it to the asset and timeframe you are using.
Max. Body Size in Points --> This setting is to filter out FU candles that have a huge body. It measures the size of the body from open to close. It's set to 10000 by default but you have to adjust it to the asset and timeframe you are using.
Show ATT FU Candles --> ATT FU Candles are FU's where the body only engulfs the previous candles body but not the wick. This type of FU candles is just as valid as the strong FU's where the Body and the wick of the previous Candle is engulfed. The setting is enabled by default.
Rejection Filter --> This setting is used filter out FU candles where the opposite side rejection is stronger than the body direction of the FU. This filters out a lot of traps. It's disabled by default.
Fractal Filter --> FU's are only valid if they broke a fractal of the past x candles. This filters out some of the FU candles that are inside a range and therefore invalid. This is an optional filter and disabled by default.
EMA Filter --> FU's are only if they are above/ below the EMA. This is to filter out most of the FU candles that are inside ranges. The EMA period can be set too. This is an optional filter and enabled and EMA length set to 7 by default. You can enable it and/ or change the length of the EMA to fit your trading style.
Show Entry Lines --> The entry line setting has been changed in terms of styling. The upper and lower line has been removed. Now only the 50% retracement line of the candle body is displayed and the line type, color, strength and length can be set to keep charts as clean as possible.
Alert Timeframes --> You can select the timeframes for which you want to receive an alert if you set and alert for the FU Candle indicator. If you set an alert for the FU Candle Indicator it will send an alert for every FU candle on every selected timeframe.
TF1-TF8 --> This setting is to enable or disable alerts for timeframe 1 - timeframe 8. By default all alerts are disabled, I recommend only enabling the ones that you actually use.
Recommended use:
A bullish FU candle doesn't necessarily mean it's a long and vice versa a bearish FU candle doesn't necessarily mean it's a short. In fact, most FU candles are traps. Often times you'll see a bullish FU candle starting a bearish reversal.
Whenever you see an FU Candle check the following:
Did the FU candle take relevant liquidity?
Is the FU Candle in line with the overall bias or does it go against the bias?
Where did the FU react? Example: A bearish FU candle that reacts in a bullish FVG is a perfect long entry and vice versa.
A bullish FU candle that takes out a relevant swing high can often be a fake-out and price can immediately reverse as the next candle opens.
Timing is also very important. Usually the valid FU candles happen after a strong move to one direction during high volume times and right before or right after a new candle opens on a higher timeframe.
Examples of valid setups:
Nr. 1) Mitigation Setup
Overall bullish on the higher time frame, liquidity grab to the downside, shift in momentum, strong move to the upside left a FVG. later price comes back into the FVG and forms a FU candle --> perfect long trade targeting the opposite side of the range.
Entry either at close of the FU or at the 50% retracement.
Nr. 2) Trap Setup
Clear bullish trend respecting the trend line, bearish FU candle forms but it didn't take any relevant liquidity to the upside. Only internal range liquidity. Perfect long entry using a buy limit below the lower wick of the FU candle with the SL below the nearest low.
Nr. 3) Liquidity Grab Setup
Bearish trend, price comes up aggressively and takes out a high and forms an FU Candle. Market entry short at close of the FU candle or at the 50% retracement of the FU candle or by putting a limit order right above the wick of the candle that follows the FU candle, targeting the opposite side of the range.
Nr. 4) Fake Breakout Setup
Price takes out a significant HTF low, then makes at least 2 BOS on the LTF and forms an Order Block or leaves an FVG. Price forms a bearish U that fails to close below the FVG or Orderblock.
Market entry long at the close of the bearish FU targeting the opposite side of the range. Vice versa for shorts. In simple terms: Bullish FUs at the top of the range and bearish FUs at the bottom of the range are usually always traps.
Sometimes price takes out the high/low of a trap FU before reversing aggressively so you can also have a limit order below the low of the bearish FU or above the high of a bullish FU in this case. But you risk missing the trade.
Entry Methods:
Entry Type 1) Market Entry at the close of the FU candle. --> Never miss a trade, not the best RRR.
Entry Type 2 Limit Entry at the 50% retracement of the body of the FU candle. --> Miss some of the trades but better RRR.
Entry Type 3 Limit order below the wick of the candle that follows the FU candle. --> Miss quite a lot of trades but by far best RRR.
Why this is a closed source script:
The source code of this script is not open because I have spent several years of my life developing it and I use it in all my trading bots.
Also I'm open for feedback and will modify/ update the script for free if I get input that can make it better.
For questions, please reach out via DM or check out my youtube channel. I have several videos explaining in detail how I use these candles, which are valid and which aren't.

Smart Money Setup 06 [TradingFinder] Liquidity Sweeps + OB Swing🔵 Introduction
Smart Money, managed by large investors, injects significant capital into financial markets by entering real capital markets.
Capital entering the market by this group of individuals is called smart money. Traders can profit from financial markets by following such individuals.
Therefore, smart money can be considered one of the effective methods for analyzing financial markets.
Sometimes, before a market movement, fluctuation movements that create price movement cause many traders' "Stop Loss" to be triggered. These movements are created in various patterns.
One of these patterns is similar to an "Expanding Triangle", which touches the stop loss of individuals who have placed their stop loss in the cash area in the form of 5 consecutive openings.
To better understand this setup, pay attention to the images below.
Bullish Setup Details :
Bearish Setup Details :
🔵 How to Use
After adding the indicator to the chart, wait for trading opportunities to appear. By changing the "Time Frame" and "Pivot Period", you can see different trading positions.
In general, the smaller the "Time Frame" and "Pivot Period", the more likely trading opportunities will appear.
Bullish Setup Details on Chart :
Bearish Setup Details on Chart :
🔵 Settings
You have access to "Pivot Period", "Order Block Refine", and "Refine Mode" through settings.
By changing the "Pivot Period", you can change the range of zigzag that identifies the setup.
Through "Order Block Refine", you can specify whether you want to refine the width of the order blocks or not. It is set to "On" by default.
Through "Refine Mode", you can specify how to improve order blocks.
If you are "risk-averse", you should set it to "Defensive" mode because in this mode, the width of the order blocks decreases, the number of your trades decreases, and the "reward-to-risk ratio "increases.
If you are on the opposite side and are "risk-taker", you can set it to "Aggressive" mode. In this mode, the width of the order blocks increases, and the likelihood of losing positions decreases.

Opening Range Breakout with Multi-Timeframe Liquidity]═══════════════════════════════════════
OPENING RANGE BREAKOUT WITH MULTI-TIMEFRAME LIQUIDITY
═══════════════════════════════════════
A professional Opening Range Breakout (ORB) indicator enhanced with multi-timeframe liquidity detection, trading session visualization, volume analysis, and trend confirmation tools. Designed for intraday trading with comprehensive alert system.
───────────────────────────────────────
WHAT THIS INDICATOR DOES
───────────────────────────────────────
This indicator combines multiple trading concepts:
- Opening Range Breakout (ORB) - Customizable time period detection with automatic high/low identification
- Multi-Timeframe Liquidity - HTF (Higher Timeframe) and LTF (Lower Timeframe) key level detection
- Trading Sessions - Tokyo, London, New York, and Sydney session visualization
- Volume Analysis - Volume spike detection and strength measurement
- Multi-Timeframe Confirmation - Trend bias from higher timeframes
- EMA Integration - Trend filter and dynamic support/resistance
- Smart Alerts - Quality-filtered breakout notifications
───────────────────────────────────────
HOW IT WORKS
───────────────────────────────────────
OPENING RANGE BREAKOUT (ORB):
Concept:
The Opening Range is a period at the start of a trading session where price establishes an initial high and low. Breakouts beyond this range often indicate the direction of the day's trend.
Detection Method:
- Default: 15-minute opening range (configurable)
- Custom Range: Set specific session times with timezone support
- Automatically identifies ORH (Opening Range High) and ORL (Opening Range Low)
- Tracks ORB mid-point for reference
Range Establishment:
1. Session starts (or custom time begins)
2. Tracks highest high and lowest low during the period
3. Range confirmed at end of opening period
4. Levels extend throughout the session
Breakout Detection:
- Bullish Breakout: Close above ORH
- Bearish Breakout: Close below ORL
- Mid-point acts as bias indicator
Visual Display:
- Shaded box during range formation
- Horizontal lines for ORH, ORL, and mid-point
- Labels showing level values
- Color-coded fills based on selected method
Fill Color Methods:
1. Session Comparison:
- Green: Current OR mid > Previous OR mid
- Red: Current OR mid < Previous OR mid
- Gray: Equal or first session
- Shows day-over-day momentum
2. Breakout Direction (Recommended):
- Green: Price currently above ORH (bullish breakout)
- Red: Price currently below ORL (bearish breakout)
- Gray: Price inside range (no breakout)
- Real-time breakout status
MULTI-TIMEFRAME LIQUIDITY:
Two-Tier System for comprehensive level identification:
HTF (Higher Timeframe) Key Liquidity:
- Default: 4H timeframe (configurable to Daily, Weekly)
- Identifies major institutional levels
- Uses pivot detection with adjustable parameters
- Suitable for swing highs/lows where large orders rest
LTF (Lower Timeframe) Key Liquidity:
- Default: 1H timeframe (configurable)
- Provides precision entry/exit levels
- Finer granularity for intraday trading
- Captures minor swing points
Calculation Method:
- Pivot high/low detection algorithm
- Configurable left bars (lookback) and right bars (confirmation)
- Timeframe multiplier for accurate multi-timeframe detection
- Automatic level extension
Mitigation System:
- Tracks when levels are swept (broken)
- Configurable mitigation type: Wick or Close-based
- Option to remove or show mitigated levels
- Display limit prevents chart clutter
Asset-Specific Optimization:
The indicator includes quick reference settings for different assets:
- Major Forex (EUR/USD, GBP/USD): Default settings optimal
- Crypto (BTC/ETH): Left=12, Right=4, Display=7
- Gold: HTF=1D, Left=20
TRADING SESSIONS:
Four Major Sessions with Full Customization:
Tokyo Session:
- Default: 04:00-13:00 UTC+4
- Asian trading hours
- Often sets daily range
London Session:
- Default: 11:00-20:00 UTC+4
- Highest liquidity period
- Major institutional activity
New York Session:
- Default: 16:00-01:00 UTC+4
- US market hours
- High-impact news events
Sydney Session:
- Default: 01:00-10:00 UTC+4
- Earliest Asian activity
- Lower volatility
Session Features:
- Shaded background boxes
- Session name labels
- Optional open/close lines
- Session high/low tracking with colored lines
- Each session has independent color settings
- Fully customizable times and timezones
VOLUME ANALYSIS:
Volume-Based Trade Confirmation:
Volume MA:
- Configurable period (default: 20)
- Establishes average volume baseline
- Used for spike detection
Volume Spike Detection:
- Identifies when volume exceeds MA * multiplier
- Default: 1.5x average volume
- Confirms breakout strength
Volume Strength Measurement:
- Calculates current volume as percentage of average
- Shows relative volume intensity
- Used in alert quality filtering
High Volume Bars:
- Identifies bars above 50th percentile
- Additional confirmation layer
- Indicates institutional participation
MULTI-TIMEFRAME CONFIRMATION:
Trend Bias from Higher Timeframes:
HTF 1 (Trend):
- Default: 1H timeframe
- Uses EMA to determine intermediate trend
- Compares current timeframe EMA to HTF EMA
HTF 2 (Bias):
- Default: 4H timeframe
- Uses 50 EMA for longer-term bias
- Confirms overall market direction
Bias Classifications:
- Bullish Bias: HTF close > HTF 50 EMA AND Current EMA > HTF1 EMA
- Bearish Bias: HTF close < HTF 50 EMA AND Current EMA < HTF1 EMA
- Neutral Bias: Mixed signals between timeframes
EMA Stack Analysis:
- Compares EMA alignment across timeframes
- +1: Bullish stack (lower TF EMA > higher TF EMA)
- -1: Bearish stack (lower TF EMA < higher TF EMA)
- 0: Neutral/crossed
Usage:
- Filters false breakouts
- Confirms trend direction
- Improves trade quality
EMA INTEGRATION:
Dynamic EMA for Trend Reference:
Features:
- Configurable period (default: 20)
- Customizable color and width
- Acts as dynamic support/resistance
- Trend filter for ORB trades
Application:
- Above EMA: Favor long breakouts
- Below EMA: Favor short breakouts
- EMA cross: Potential trend change
- Distance from EMA: Momentum gauge
SMART ALERT SYSTEM:
Quality-Filtered Breakout Notifications:
Alert Types:
1. Standard ORB Breakout
2. High Quality ORB Breakout
Quality Criteria:
- Volume Confirmation: Volume > 1.2x average
- MTF Confirmation: Bias aligned with breakout direction
Standard Alert:
- Basic breakout detection
- Price crosses ORH or ORL
- Icon: 🚀 (bullish) or 🔻 (bearish)
High Quality Alert:
- Both volume AND MTF confirmed
- Stronger probability setup
- Icon: 🚀⭐ (bullish) or 🔻⭐ (bearish)
Alert Information Includes:
- Alert quality rating
- Breakout level and current price
- Volume strength percentage (if enabled)
- MTF bias status (if enabled)
- Recommended action
One Alert Per Bar:
- Prevents alert spam
- Uses flag system to track sent alerts
- Resets on new ORB session
───────────────────────────────────────
HOW TO USE
───────────────────────────────────────
OPENING RANGE SETUP:
Basic Configuration:
1. Select time period for opening range (default: 15 minutes)
2. Choose fill color method (Breakout Direction recommended)
3. Enable historical data display if needed
Custom Range (Advanced):
1. Enable Custom Range toggle
2. Set specific session time (e.g., 0930-0945)
3. Select appropriate timezone
4. Useful for specific market opens (NYSE, LSE, etc.)
LIQUIDITY LEVELS SETUP:
Quick Configuration by Asset:
- Forex: Use default settings (Left=15, Right=5)
- Crypto: Set Left=12, Right=4, Display=7
- Gold: Set HTF=1D, Left=20
HTF Liquidity:
- Purpose: Major support/resistance levels
- Recommended: 4H for day trading, 1D for swing trading
- Use as profit targets or reversal zones
LTF Liquidity:
- Purpose: Entry/exit refinement
- Recommended: 1H for day trading, 4H for swing trading
- Use for position management
Mitigation Settings:
- Wick-based: More sensitive (default)
- Close-based: More conservative
- Remove or Show mitigated levels based on preference
TRADING SESSIONS SETUP:
Enable/Disable Sessions:
- Master toggle for all sessions
- Individual session controls
- Show/hide session names
Session High/Low Lines:
- Enable to see session extremes
- Each session has custom colors
- Useful for range trading
Customization:
- Adjust session times for your broker
- Set timezone to match your location
- Customize colors for visibility
VOLUME ANALYSIS SETUP:
Enable Volume Analysis:
1. Toggle on Volume Analysis
2. Set MA length (20 recommended)
3. Adjust spike multiplier (1.5 typical)
Usage:
- Confirm breakouts with volume
- Identify climactic moves
- Filter false signals
MULTI-TIMEFRAME SETUP:
HTF Selection:
- HTF 1 (Trend): 1H for day trading, 4H for swing
- HTF 2 (Bias): 4H for day trading, 1D for swing
Interpretation:
- Trade only with bias alignment
- Neutral bias: Be cautious
- Bias changes: Potential reversals
EMA SETUP:
Configuration:
- Period: 20 for responsive, 50 for smoother
- Color: Choose contrasting color
- Width: 1-2 for visibility
Usage:
- Filter trades: Long above, Short below
- Dynamic support/resistance reference
- Trend confirmation
ALERT SETUP:
TradingView Alert Creation:
1. Enable alerts in indicator settings
2. Enable ORB Breakout Alerts
3. Right-click chart → Add Alert
4. Select this indicator
5. Choose "Any alert() function call"
6. Configure delivery method (mobile, email, webhook)
Alert Filtering:
- All alerts include quality rating
- High Quality alerts = Volume + MTF confirmed
- Standard alerts = Basic breakout only
───────────────────────────────────────
TRADING STRATEGIES
───────────────────────────────────────
CLASSIC ORB STRATEGY:
Setup:
1. Wait for opening range to complete
2. Price breaks and closes above ORH or below ORL
3. Volume > average (if enabled)
4. MTF bias aligned (if enabled)
Entry:
- Bullish: Buy on break above ORH
- Bearish: Sell on break below ORL
- Consider retest entries for better risk/reward
Stop Loss:
- Bullish: Below ORL or range mid-point
- Bearish: Above ORH or range mid-point
- Adjust based on volatility
Targets:
- Initial: Range width extension (ORH + range width)
- Secondary: HTF liquidity levels
- Final: Session high/low or major support/resistance
ORB + LIQUIDITY CONFLUENCE:
Enhanced Setup:
1. Opening range established
2. HTF liquidity level near or beyond ORH/ORL
3. Breakout occurs with volume
4. Price targets the liquidity level
Entry:
- Enter on ORB breakout
- Target the HTF liquidity level
- Use LTF liquidity for position management
Management:
- Partial profits at ORB + range width
- Move stop to breakeven at LTF liquidity
- Final exit at HTF liquidity sweep
ORB REJECTION STRATEGY (Counter-Trend):
Setup:
1. Price breaks above ORH or below ORL
2. Weak volume (below average)
3. MTF bias opposite to breakout
4. Price closes back inside range
Entry:
- Failed bullish break: Short below ORH
- Failed bearish break: Long above ORL
Stop Loss:
- Beyond the failed breakout level
- Or beyond session extreme
Target:
- Opposite end of opening range
- Range mid-point for partial profit
SESSION-BASED ORB TRADING:
Tokyo Session:
- Typically narrower ranges
- Good for range trading
- Wait for London open breakout
London Session:
- Highest volume and volatility
- Strong ORB setups
- Major liquidity sweeps common
New York Session:
- Strong trending moves
- News-driven volatility
- Good for momentum trades
Sydney Session:
- Quieter conditions
- Suitable for range strategies
- Sets up Tokyo session
EMA-FILTERED ORB:
Rules:
- Only take bullish breaks if price > EMA
- Only take bearish breaks if price < EMA
- Ignore counter-trend breaks
Benefits:
- Reduces false signals
- Aligns with larger trend
- Improves win rate
───────────────────────────────────────
CONFIGURATION GUIDE
───────────────────────────────────────
OPENING RANGE SETTINGS:
Time Period:
- 15 min: Standard for most markets
- 30 min: Wider range, fewer breakouts
- 60 min: For slower markets or swing trades
Custom Range:
- Use for specific market opens
- NYSE: 0930-1000 EST
- LSE: 0800-0830 GMT
- Set timezone to match exchange
Historical Display:
- Enable: See all previous session data
- Disable: Cleaner chart, current session only
LIQUIDITY SETTINGS:
Left Bars (5-30):
- Lower: More frequent, sensitive levels
- Higher: Fewer, more significant levels
- Recommended: 15 for most markets
Right Bars (1-25):
- Confirmation period
- Higher: More reliable, less frequent
- Recommended: 5 for balance
Display Limit (1-20):
- Number of active levels shown
- Higher: More context, busier chart
- Recommended: 7 for clarity
Extension Options:
- Short: Levels visible near formation
- Current: Extended to current bar (recommended)
- Max: Extended indefinitely
VOLUME SETTINGS:
MA Length (5-50):
- Shorter: More responsive to spikes
- Longer: Smoother baseline
- Recommended: 20 for balance
Spike Multiplier (1.0-3.0):
- Lower: More sensitive spike detection
- Higher: Only extreme spikes
- Recommended: 1.5 for day trading
MULTI-TIMEFRAME SETTINGS:
HTF 1 (Trend):
- 5m chart: Use 15m or 1H
- 15m chart: Use 1H or 4H
- 1H chart: Use 4H or 1D
HTF 2 (Bias):
- One level higher than HTF 1
- Provides longer-term context
- Don't use same as HTF 1
EMA SETTINGS:
Length:
- 20: Responsive, more signals
- 50: Smoother, stronger filter
- 200: Long-term trend only
Style:
- Choose contrasting color
- Width 1-2 for visibility
- Match your trading style
───────────────────────────────────────
BEST PRACTICES
───────────────────────────────────────
Chart Timeframe Selection:
- ORB Trading: Use 5m or 15m charts
- Session Review: Use 1H or 4H charts
- Swing Trading: Use 1H or 4H charts
Quality Over Quantity:
- Wait for high-quality alerts (volume + MTF)
- Avoid trading every breakout
- Focus on confluence setups
Risk Management:
- Position size based on range width
- Wider ranges = smaller positions
- Use stop losses always
- Take partial profits at targets
Market Conditions:
- Best results in trending markets
- Reduce position size in choppy conditions
- Consider session overlaps for volatility
- Avoid trading near major news if inexperienced
Continuous Improvement:
- Track win rate by session
- Note which confluence factors work best
- Adjust settings based on market volatility
- Review performance weekly
───────────────────────────────────────
PERFORMANCE OPTIMIZATION
───────────────────────────────────────
This indicator is optimized with:
- max_bars_back declarations for efficient processing
- Conditional calculations based on enabled features
- Proper memory management for drawing objects
- Minimal recalculation on each bar
Best Practices:
- Disable unused features (sessions, MTF, volume)
- Limit historical display to reduce rendering
- Use appropriate timeframe for your strategy
- Clear old drawing objects periodically
───────────────────────────────────────
EDUCATIONAL DISCLAIMER
───────────────────────────────────────
This indicator combines established trading concepts:
- Opening Range Breakout theory (price action)
- Liquidity level detection (pivot analysis)
- Session-based trading (time-of-day patterns)
- Volume analysis (confirmation technique)
- Multi-timeframe analysis (trend alignment)
All calculations use standard technical analysis methods:
- Pivot high/low detection algorithms
- Moving averages for trend and volume
- Session time filtering
- Timeframe security functions
The indicator identifies potential trading setups but does not predict future price movements. Success requires proper application within a complete trading strategy including risk management, position sizing, and market context.
───────────────────────────────────────
USAGE DISCLAIMER
───────────────────────────────────────
This tool is for educational and analytical purposes. Opening Range Breakout trading involves substantial risk. The alert system and quality filters are designed to identify potential setups but do not guarantee profitability. Always conduct independent analysis, use proper risk management, and never risk capital you cannot afford to lose. Past performance does not indicate future results. Trading intraday breakouts requires experience and discipline.
───────────────────────────────────────
CREDITS & ATTRIBUTION
───────────────────────────────────────
ORIGINAL SOURCE:
This indicator builds upon concepts from LuxAlgo's-ORB

XSN Liquidity & VoidsThis indicator is a powerful tool for traders using Smart Money Concepts (SMC). It automatically identifies and plots key areas of liquidity and price imbalances directly on your chart, helping you to visualize the market's structure with ease and precision.
Core Concept: The Liquidity-Imbalance Relationship
This tool is built on the SMC principle of the relationship between the engineering of liquidity and resulting market imbalances. The script visualizes this critical process by:
Plotting key liquidity pools (Major and Internal swing points) from user-defined timeframes.
Showing when this liquidity is 'swept' by price action.
Highlighting Fair Value Gaps (FVGs), or imbalances, that often form immediately after a liquidity sweep.
By combining liquidity lines and FVGs into a single tool, traders can more easily identify high-probability setups where a liquidity grab leads to a market reversal or continuation into an FVG.
Key Features
Multi-Timeframe Major & Internal Liquidity: Automatically plot significant swing highs and lows (pivots) from any timeframe you choose (e.g., 15m, 1H, 4H) onto your current chart.
Automatic Sweep Detection: Lines are automatically marked as 'swept' when price trades through them. Unswept lines extend to the right, while swept lines are fixed in time and change their style for a clean chart.
Recent Sweep Highlighting : The indicator keeps the last few major liquidity sweeps highlighted in their original bright color to help you focus on the most recent price action.
Historical Confluence Labels: Automatically adds labels (e.g., D-HIGH, W-LOW) to liquidity lines that align with previous Daily, Weekly, or 4-Hour highs and lows, signifying areas of major historical importance.
Liquidity Voids / FVGs (Current Timeframe): Instantly identifies and draws Fair Value Gaps (FVGs) on your current chart timeframe, highlighting areas where price may be drawn to.
How to Use This Indicator
Identify Targets: Watch for price to gravitate towards the red (major) and purple (internal) liquidity lines. These represent pools of buy-side and sell-side liquidity.
Confirm Sweeps: A 'sweep' occurs when price wicks through a line, which then changes its appearance. This often signals a reversal or continuation.
Find Confluence: Pay close attention to the historical labels (D-HIGH, W-LOW, etc.). Sweeps of these levels are often significant market events.
Analyze Voids: Use the FVG boxes to identify price imbalances. Price will often seek to fill these voids, making them excellent targets or areas of interest for entries.
An enhanced version of this tool with real-time alerts and auto multi-timeframe FVG analysis is also available.

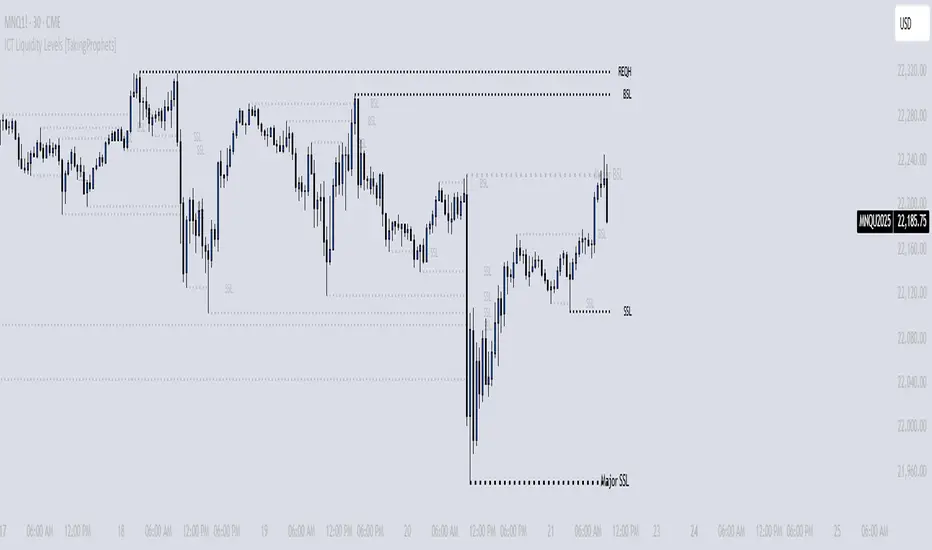
ICT Liquidity Levels [TakingProphets]Overview
This indicator is designed to dynamically identify and display key liquidity levels—areas where market participants are likely to engage. By analyzing price swing points, it highlights potential support and resistance zones that can signal reversals or breakouts. The script distinguishes between buyside and sellside liquidity levels, presenting them with customizable visual cues and labels for immediate clarity.
How It Works
Swing Point Detection:
The indicator uses a pivot-based method (with a configurable “Base Swing Strength”) to detect swing highs and lows. Each detected swing is evaluated for its “swing size” (percentage price movement), and if it exceeds a user-defined threshold, the level is classified as major.
Level Creation and Classification:
Overview
Built on core ICT principles, this indicator identifies key liquidity zones—areas where market imbalances can lead to liquidity sweeps. By dynamically analyzing swing points, it offers traders a real-time view of where liquidity is clustering, allowing for a deeper understanding of market structure. 🚀
How It Works
Swing Point Detection 🔍
• Uses a pivot-based method with a configurable “Base Swing Strength” to detect significant price swings.
• Calculates the swing size (percentage change) to flag zones that exceed the “Major Level Threshold” as major liquidity zones.
Level Creation & Classification 🛠️
• Buyside Liquidity Levels (BSL):
Identified from swing highs, marking zones where buying liquidity clusters.
• Sellside Liquidity Levels (SSL):
Identified from swing lows, highlighting zones of concentrated selling liquidity.
• Each zone is stored with its price, bar index, and classification (major or standard) before being drawn as a horizontal line on the chart.
Dynamic Level Management 🔄
• Extension: Liquidity lines automatically extend from their detection point to the current bar.
• Consolidation: When levels are close in price, the script merges them—updating labels (e.g., “REQH” or “REQL”) to denote unified liquidity zones.
• Traded-Through Detection: Adjusts or removes levels if the market moves beyond them, based on your settings.
• Age-Based Cleanup: Inactive zones are automatically removed after a set number of bars to maintain clarity.
Customization Options ⚙️
Visual Settings:
• Choose from solid, dashed, or dotted line styles and adjust line width.
• Option to display labels with customizable placement (left or right) for optimal clarity.
Color & Opacity:
• Set distinct colors for buyside and sellside liquidity zones.
• Configure opacity for zones that have been traded through, keeping them visible yet de-emphasized.
Detection & Cleanup Parameters:
• Adjust “Base Swing Strength” to control pivot detection sensitivity.
• Set the “Major Level Threshold %” to filter for significant liquidity zones.
• Decide whether to retain or remove zones once price moves through them.
• Define how many bars should pass before inactive zones are automatically deleted.
How to Use 🚀
Apply the Indicator:
Simply add the script to your chart—it automatically detects and marks key liquidity zones based on recent price action.
Adjust Inputs:
Fine-tune parameters like swing strength, threshold percentages, and visual settings to match the asset’s characteristics and your trading strategy.
Interpret the Visuals:
• Major Liquidity Zones:
Highlighted with thicker lines and distinct labels (e.g., “Major BSL/SSL”), indicating areas of heightened liquidity concentration.
• Consolidated Zones:
Merged labels (e.g., “REQH/REQL”) denote unified liquidity zones where clustering is significant.
• Traded-Through Zones:
Changes in opacity signal that the market has moved beyond a previously identified liquidity zone.
Underlying ICT Concepts 💡
Liquidity Pools & Sweeps:
Focused on identifying where liquidity is concentrated, the indicator aligns with ICT methodologies that highlight zones crucial for liquidity sweeps.
Pivot Analysis for Liquidity:
Enhances traditional pivot detection to spotlight liquidity clusters, providing a deeper insight into market structure.
Real-Time Adaptation:
With continuous updates and built-in cleanup, the indicator ensures that liquidity zones accurately reflect current market conditions.
Pure Price Action ICT Tools [LuxAlgo]The Pure Price Action ICT Tools indicator is designed for pure price action analysis, automatically identifying real-time market structures, liquidity levels, order & breaker blocks, and liquidity voids.
Its unique feature lies in its exclusive reliance on price patterns, without being constrained by any user-defined inputs, ensuring a robust and objective analysis of market dynamics.
🔶 MARKET STRUCTURES
A Market Structure Shift, also known as a Change of Character (CHoCH), is a pivotal event in price action analysis indicating a potential change in market sentiment or direction. An MSS occurs when the price reverses from an established trend, signaling that the prevailing trend may be losing momentum and a reversal might be underway. This shift is often identified by key technical patterns, such as a higher low in a downtrend or a lower high in an uptrend, which indicate a weakening of the current trend's strength.
A Break of Structure typically indicates the continuation of the current market trend. This event occurs when the price decisively moves beyond a previous swing high or low, confirming the strength of the prevailing trend. In an uptrend, a BOS is marked by the price breaking above a previous high, while in a downtrend, it is identified by the price breaking below a previous low.
While a Market Structure Shift (MSS) can indicate a potential trend reversal and a Break of Structure (BOS) often confirms trend continuation, they do not assure a complete reversal or continuation. MSS and BOS levels can also function as liquidity zones or areas of price consolidation rather than definitively signaling a change in market direction. Traders should approach these signals cautiously and validate them with additional factors before making trading decisions. For further details on other components of the tool, please refer to the following sections.
🔶 ORDER & BREAKER BLOCKS
Order and Breaker Blocks are key concepts in price action analysis that help traders identify significant levels in the market structure.
Order Blocks are specific price zones where significant buying or selling activity has occurred. These zones often represent the actions of large institutional traders or market makers, who execute substantial orders that impact the market.
Breaker Blocks are specific price zones where a strong reversal occurs, causing a break in the prevailing market structure. These blocks indicate areas where the price encountered significant resistance or support, leading to a reversal.
In summary, Order and Breaker Blocks are essential tools in price action analysis, providing insights into significant market levels influenced by institutional trading activities. These blocks help traders make informed decisions about potential support and resistance levels, trend reversals, and breakout confirmations.
🔶 BUYSIDE & SELLSIDE LIQUIDITY
Both buy-side and sell-side liquidity zones are critical for identifying potential turning points in the market. These zones are where significant buying or selling interest is concentrated, influencing future price movements.
In summary, buy-side and sell-side liquidity provide crucial insights into market demand and supply dynamics, helping traders make informed decisions based on the availability of orders at different price levels.
🔶 LIQUIDITY VOIDS
Liquidity voids are gaps or areas on a price chart where there is a lack of trading activity. These voids represent zones with minimal to no buy or sell orders, often resulting in sharp price movements when the market enters these areas.
In summary, liquidity voids are crucial areas on a price chart characterized by a lack of trading activity. These voids can lead to rapid price movements and increased volatility, making them essential considerations for traders in their analysis and decision-making processes.
🔶 SWING POINTS
Reversal price points are commonly referred to as swing points. Traders often analyze historical swing points to discern market trends and pinpoint potential trade entry and exit points.
Do note that in this script these are subject to backpainting, that is they are not located where they are detected.
The detection of swing points and the unique feature of this script rely exclusively on price action, eliminating the need for numerical user-defined settings. The process begins with detecting short-term swing points:
Short-Term Swing High (STH): Identified as a price peak surrounded by lower highs on both sides.
Short-Term Swing Low (STL): Recognized as a price trough surrounded by higher lows on both sides.
Intermediate-term and long-term swing points are detected using the same approach but with a slight modification. Instead of directly analyzing price candles, previously detected short-term swing points are utilized. For intermediate-term swing points, short-term swing points are analyzed, while for long-term swing points, intermediate-term ones are used.
This method ensures a robust and objective analysis of market dynamics, offering traders reliable insights into market structures. Detected swing points serve as the foundation for identifying market structures, buy-side/sell-side liquidity levels, and order and breaker blocks presented with this tool.
In summary, swing points are essential elements in technical analysis, helping traders identify trends, support, and resistance levels, and optimal entry and exit points. Understanding swing points allows traders to make informed decisions based on the natural price movements in the market.
🔶 SETTINGS
🔹 Market Structures
Market Structures: Toggles the visibility of the market structures, both shifts and breaks.
Detection: An option that allows users to detect market structures based on the significance of swing levels, including short-term, intermediate-term, and long-term.
Market Structure Labels: Controls the visibility of labels that highlight the type of market structure.
Line Style: Customizes the style of the lines representing the market structure.
🔹 Order & Breaker Blocks
Order & Breaker Blocks: Toggles the visibility of the order & breaker blocks.
Detection: An option that allows users to detect order & breaker blocks based on the significance of swing levels, including short-term, intermediate-term, and long-term.
Last Bullish Blocks: Number of the most recent bullish order/breaker blocks to display on the chart.
Last Bearish Blocks: Number of the most recent bearish order/breaker blocks to display on the chart.
Use Candle Body: Allows users to use candle bodies as order block areas instead of the full candle range.
🔹 Buyside & Sellside Liquidity
Buyside & Sellside Liquidity: Toggles the visibility of the buyside & sellside liquidity levels.
Detection: An option that allows users to detect buy-side & sell-side liquidity based on the significance of swing levels, including short-term, intermediate-term, and long-term.
Margin: Sets margin/sensitivity for a liquidity level detection.
Visible Levels: Controls the amount of the liquidity levels/zones to be visualized.
🔹 Liquidity Voids
Liquidity Voids: Enable display of both bullish and bearish liquidity voids.
Threshold Multiplier: Defines the multiplier for the threshold, which is hard-coded to the 200-period ATR range.
Mode: Controls the lookback length for detection and visualization. Present considers the last X bars specified in the option, while Historical includes all available data.
Label: Enable display of a label indicating liquidity voids.
🔹 Swing Highs/Lows
Swing Highs/Lows: Toggles the visibility of the swing levels.
Detection: An option that allows users to detect swing levels based on the significance of swing levels, including short-term, intermediate-term, and long-term.
Label Size: Control the size of swing level labels.
🔶 RELATED SCRIPTS
Pure-Price-Action-Structures.
Market-Structures-(Intrabar).
Buyside-Sellside-Liquidity.
Order-Breaker-Blocks.

Adaptive Normalized Global Liquidity OscillatorAdaptive Normalized Global Liquidity Oscillator
A dynamic, non-repainting oscillator built on real central bank balance sheet data. This tool visualizes global liquidity shifts by aggregating monetary asset flows from the world’s most influential central banks.
🔍 What This Script Does:
Aggregates Global Liquidity:
Includes Federal Reserve (FED) assets and subtracts liabilities like the Treasury General Account (TGA) and Reverse Repo Facility (RRP), combined with asset positions from the ECB, BOJ, PBC, BOE, and over 10 other central banks. All data is normalized into USD using FX rates.
Adaptive Normalization:
Optimizes the lookback period dynamically based on rate-of-change stability—no fixed lengths, enabling adaptation across macro conditions.
Self-Optimizing Weighting:
Applies inverse standard deviation to balance raw liquidity, smoothed momentum (HMA), and standardized deviation from the mean.
Percentile-Ranked Highlights:
Liquidity readings are ranked relative to history—extremes are visually emphasized using gradient color and adaptive transparency.
Non-Repainting Design:
Data is anchored with bar index awareness and offset techniques, ensuring no forward-looking bias. What you see is what was known at that time.
⚠️ Important Interpretation Note:
This is not a zero-centered oscillator like RSI or MACD. The signal line does not represent neutrality at zero.
Instead, a dynamic baseline is calculated using a rolling mean of scaled liquidity.
0 is irrelevant on its own—true directional signals come from crosses above or below this adaptive baseline.
Even negative values may signal strength if they are rising above the moving average of past liquidity conditions.
✅ What to Watch For:
Crossover Above Dynamic Baseline:
Indicates liquidity is expanding relative to recent conditions—supports a risk-on interpretation.
Crossover Below Dynamic Baseline:
Suggests deteriorating liquidity conditions—may align with risk-off shifts.
Percentile Extremes:
Readings near the top or bottom historical percentiles can act as contrarian or confirmation signals, depending on momentum.
⚙️ How It Works:
Bounded Normalization:
The final oscillator is passed through a tanh function, keeping values within and reducing distortion.
Adaptive Transparency:
The strength of deviations dynamically adjusts plot intensity—visually highlighting stronger liquidity shifts.
Fully Customizable:
Toggle which banks are included, adjust dynamic optimization ranges, and control visual display options for plot and background layers.
🧠 How to Use:
Trend Confirmation:
Sustained rises in the oscillator above baseline suggest underlying monetary support for asset prices.
Macro Turning Points:
Reversals or divergences, especially near OB/OS zones, can foreshadow broader risk regime changes.
Visual Context:
Use the dynamic baseline to see if liquidity is supportive or suppressive relative to its own adaptive history.
📌 Disclaimer:
This indicator is for educational and informational purposes only. It does not constitute financial advice. Past performance is not indicative of future results. Always consult a qualified financial advisor before making trading or investment decisions.

Swing Trade IndicatorThis is a Swing Trade Indicator that combines several technical indicators to analyze market conditions and generate trade signals. I've included two tables that provide real-time information to help you analyze the market and track trades: the Market Status Table and the Trade Tracking Table. These tables are overlaid on the TradingView chart and are customizable in terms of position and visibility.
Simple Moving Averages (SMAs):
Determines trend direction (e.g., bullish if fastMA > slowMA).
Calculates the average closing price over a set period:
fastMA: 21-period SMA (short-term trend).
slowMA: 50-period SMA (medium-term trend).
ultraSlowMA: 200-period SMA (long-term trend).
How:
ta.sma(close, fastLength) computes the SMA of the closing price over fastLength bars (similarly for slowLength and ultraSlowLength).
Volume Analysis:
Identifies potential liquidity spikes.
Measures trading volume to detect high activity.
Average volume over liquidityPeriod (20 bars).
Standard deviation of volume to set a dynamic threshold.
How:
avgVolume = ta.sma(volume, liquidityPeriod): Average volume.
volumeStdDev = ta.stdev(volume, liquidityPeriod): Volatility of volume.
highVolume = volume > avgVolume + volumeStdDev * volumeThresholdMultiplier: Flags high volume if it exceeds the average plus a multiplier (default 1.0) times the standard deviation.
Relative Strength Index (RSI):
Filters entries to avoid overextended markets.
Measures momentum and overbought/oversold conditions.
14-period RSI with thresholds at 60 (overbought) and 40 (oversold).
How:
rsiValue = ta.rsi(close, rsiLength) calculates RSI based on price changes over 14 bars.
Average Directional Index (ADX):
Gauges whether the trend is strong enough to trade.
Assesses trend strength.
14-period ADX.
How:
Calculates True Range (tr), Plus Directional Movement (plusDM), and Minus Directional Movement (minusDM).
Smooths these with ta.rma (Running Moving Average) over adxLength (14).
Computes plusDI and minusDI (directional indicators), then dx (difference), and finally adxValue = ta.rma(dx, adxLength) for trend strength.
Classifies as "Strong" (≥40), "Moderate" (≥20), or "Weak" (<20).
Moving Average Convergence Divergence (MACD) (Optional):
Optional filter for entry conditions if useMacdFilter is enabled.
Tracks momentum and trend changes.
Fast EMA (12), Slow EMA (26), Signal Line (9).
How:
= ta.macd(close, macdFastLength, macdSlowLength, macdSignalLength) computes the MACD components.
macdBullish = macdLine > signalLine: Bullish signal.
macdBearish = macdLine < signalLine: Bearish signal.
Liquidity Zones:
Confirms entries near key levels and suggests next trade setups.
Identifies support and resistance levels based on recent price extremes.
Dynamic levels over 20 bars (if useDynamicLevels is true).
How:
highLiquidityLevel1 = ta.highest(high, 20): Highest high in last 20 bars.
highLiquidityLevel2 = ta.highest(high , 20): Highest high from 20 to 40 bars ago.
highLiquidityLevel3 = ta.lowest(low, 20): Lowest low in last 20 bars.
highLiquidityLevel4 = ta.lowest(low , 20): Lowest low from 20 to 40 bars ago.
Upper and lower zones are derived (upperLevel, lowerLevel), with a midpoint between them.
How It Calculates Entries and Exits
Long Entry:
Basic Conditions (longEntry):
close > fastMA: Price is above the 21-period SMA.
fastMA > slowMA: Short-term trend is above medium-term trend (bullish).
rsiValue < rsiOverbought: RSI below 60 (not overbought).
(not useMacdFilter or macdBullish): If MACD filter is off, ignore it; if on, MACD must be bullish.
Confirmed Entry (confirmedLongEntry):
longEntry is true.
close >= highLiquidityLevel3 * 0.95 and close <= highLiquidityLevel3 * 1.05: Price is within 5% of the lower liquidity level (support).
Action: Sets currentPosition = 'long', records entry price and bar, plots a green triangle below the bar.
Short Entry:
Basic Conditions (shortEntry):
close < fastMA: Price is below the 21-period SMA.
fastMA < slowMA: Short-term trend is below medium-term trend (bearish).
rsiValue > rsiOversold: RSI above 40 (not oversold).
(not useMacdFilter or macdBearish): If MACD filter is off, ignore it; if on, MACD must be bearish.
Confirmed Entry (confirmedShortEntry):
shortEntry is true.
close <= highLiquidityLevel1 * 1.05 and close >= highLiquidityLevel1 * 0.95: Price is within 5% of the upper liquidity level (resistance).
Action: Sets currentPosition = 'short', records entry price and bar, plots a red triangle above the bar.
Exit Conditions
Note: The exit logic is defined but commented out in the script (//longExit and //shortExit), meaning it doesn’t automatically exit positions. It calculates stop-loss and take-profit levels for manual use:
Long Exit (if uncommented):
close < stopLossLevelLong: Price falls below stop-loss (entry price × (1 - 1.5%)).
close > takeProfitLevelLong: Price exceeds take-profit (entry price × (1 + 1.5% × 2.0)).
Short Exit (if uncommented):
close > stopLossLevelShort: Price rises above stop-loss (entry price × (1 + 1.5%)).
close < takeProfitLevelShort: Price falls below take-profit (entry price × (1 - 1.5% × 2.0)).
Suggested Levels: The script provides suggestedLongSL, suggestedLongTP, suggestedShortSL, and suggestedShortTP in the Market Status Table, based on liquidity levels rather than entry price, for manual exits.
Users Can Edit Settings:
Market Status Table Position: Dropdown (e.g., "top_right" to "bottom_left").
Trade Tracking Table Position: Dropdown (e.g., "bottom_right" to "middle_center").
Visibility Toggles (checkboxes):
Show Tables: Enable/disable tables (default: true).
Show Liquidity Zones: Not plotted but affects logic (default: true).
Show Entry Points: Show/hide entry triangles (default: true).
Use Dynamic Levels: Enable/disable liquidity zones (default: true).
Use MACD for Entry Filter: Add MACD to entry conditions (default: false).
Show MACD on Chart: Not implemented but reserved (default: false).
Indicator Periods:
Fast MA Length: Integer (default: 21, e.g., change to 10).
Slow MA Length: Integer (default: 50, e.g., change to 30).
Ultra Slow MA Length: Integer (default: 200, e.g., change to 100).
Liquidity Detection Period: Integer (default: 20, e.g., change to 10).
RSI Length: Integer (default: 14, e.g., change to 7).
ADX Length: Integer (default: 14, e.g., change to 20).
MACD Fast/Slow/Signal Length: Integers (default: 12/26/9, e.g., 9/21/5).
Thresholds:
Volume Threshold Multiplier: Float (default: 1.0, e.g., 1.5 for stricter high volume).
RSI Overbought: Integer (default: 60, e.g., 70).
RSI Oversold: Integer (default: 40, e.g., 30).
Stop Loss %: Float (default: 1.5, e.g., 2.0, range 0.1-10).
Take Profit Ratio: Float (default: 2.0, e.g., 3.0, range 1.0-5.0).
Liquidity Threshold (%): Float (default: 2.0, e.g., 1.5, range 0.5-5.0).

Candlestick Absorption (Pure Price+Volume)📘 Candlestick Absorption (Pure Price + Volume)
An original approach to detecting hidden institutional absorption using nothing but candle structure and relative volume.
🧠 Concept
Every candle tells a story — not just in its color, but in the battle between aggressive orders and passive liquidity.
This indicator isolates those moments where one side of the market absorbs the other’s aggression — when a candle shows excess wicks on high volume but fails to extend in that direction.
Unlike traditional volume indicators or oscillators, this script focuses solely on the interaction between wick length, body size, and relative volume , giving a pure price–volume perspective of absorption and exhaustion.
⚙️ How It Works
1. Relative Volume Detection
• Compares each candle’s volume to a configurable moving average (default SMA 20).
• Marks only candles with significantly above-average activity (e.g. 1.5× SMA) as eligible for absorption.
2. Wick–Body Anatomy Analysis
• Measures the proportion of each candle’s wicks and body within its total range.
• Focuses on long wicks with small bodies , representing strong push-and-absorb behavior.
• The close must remain off the extreme by a user-defined percentage to confirm that the move was rejected.
3. Absorption Logic
• Bullish Absorption (⬆) → long lower wick, high volume, small body, close away from the low → demand absorbed selling pressure.
• Bearish Absorption (⬇) → long upper wick, high volume, small body, close away from the high → supply absorbed buying pressure.
4. Cooldown & Clarity
• A built-in cooldown prevents repetitive signals in congestion zones.
• Optional translucent absorption zones (boxes) extend forward, helping you visualize where future retests may react.
🎯 How to Use It
• Watch for Absorb ⬆ or Absorb ⬇ markers near swing highs/lows, session extremes, or fair-value gaps — these often highlight zones of institutional absorption or stop-runs.
• Combine with market structure or order-flow context rather than standalone entries.
• Use zones as potential re-entry or rejection levels when price revisits them.
• For intraday use, increase High-Volume Factor to 1.8–2.2 to filter noise.
• For higher timeframes, relax wick/body thresholds slightly to capture broader absorption events.
⸻
🔍 What Makes It Original
• Pure Price + Volume logic — no MAs, RSI, VWAP, or momentum filters.
• Uses dynamic wick-to-range ratios and relative-volume qualification instead of arbitrary thresholds.
• Adaptive visual design: the plotted boxes fade as they age, making absorption footprints visually intuitive.
• Works across any market (stocks, crypto, indices, futures) and timeframe without recalibration.
• Zero repainting. All signals are based on completed bars only.
🧩 Inputs Summary
Volume Filter : Volume SMA Length, High-Volume Factor
Defines how much higher a candle’s volume must be compared to its average
Candle Anatomy : Min Wick % of Range, Max Body % of Range, Close Off Edge %
Controls candle geometry for valid absorption
Signal Logic [/b : Cooldown Bars, color filters
Reduces clutter and false clustering
Zones : Draw Zones, Zone Forward Bars, Opacity Levels
Paints temporary liquidity footprints
Visuals : Background Tint
Highlights active absorption bars
⚠️ Important Notes
• Absorption ≠ instant reversal — it’s often a precursor to exhaustion or liquidity shift.
• Always confirm with structure, trend context, or additional confluence.
• Use at your own discretion; the script makes no performance claims.
💡 Suggested Use Cases
• Identifying trap candles at swing highs/lows.
• Spotting hidden institutional participation before reversals.
• Filtering false breakouts in tight ranges.
• Defining retest zones for Smart-Money or volume-profile strategies.

Leveraged Liquidation ZonesOVERVIEW
This indicator estimates potential liquidation zones based on leveraged positions (25x, 50x, 75x, 100x). It visually displays upper and lower bounds for each leverage tier, allowing traders to infer areas where the market might be seeking liquidity.
CONCEPTS
In leveraged markets, especially crypto derivatives, price often moves towards zones of high liquidation potential — areas where traders using high leverage are likely to be stopped out. These zones represent concentrations of liquidity that can serve as targets for price movement.
This script models simplified liquidation areas by calculating the price range within which positions using specific leverage levels would be at risk, assuming no maintenance margin and using the previous candle close as a reference.
FEATURES
Visual zones for 25x, 50x, 75x, and 100x leverage levels.
Customizable visibility and colors for each leverage tier.
Real-time zone calculation based on the previous candle close.
Simple and clean design to overlay directly on price action.
USAGE
Use this tool to identify areas of liquidity accumulation or potential price magnet zones. High-leverage liquidations often lead to volatile movements when triggered, so tracking these zones can help anticipate breakout or reversal behavior.
You can toggle individual leverage levels via the settings panel, and adjust color transparency to suit your chart theme. This tool is most effective when combined with volume spikes, order book analysis, or high-frequency behavior.

SMC Fake Zones + InsideBarThis indicator is useful for whom trade with "Smart Money Concept (SMC)" strategy.
It helps SMD traders to identify fake or weak zones in the chart, So they can avoid taking position in this zones.
This indicator marks "Asia session" as well as "London and New York's Lunch Time (one hour before London and NY session starts)" zones.
It also marks Inside Bar candles which SMC trades consider as order flow. You can mark every Inside Bar or only those with opposite color via setting options.
*** As we know in SMC rules
1- Supply and Demand zones in "Asia session and Lunch Times" are fake zones for SMC trading and price will engulf them in most of times.
2- "Asia session high and low" has huge liquidity and usually price sweep that in London session.
This indicator will helps traders to visually identify those Fake zones and Asia session liquidity.
* You can change session times based on your time zone in settings.
* You can set options to show all Inside Bars or only with Opposite color in settings.

Scalping Dashboard - Volume Candles + Liquidity ZonesScalping Dashboard - Volume Candles + Liquidity Zones
📊 Overview
A comprehensive scalping indicator designed for high-frequency traders on 1-5 minute timeframes. This all-in-one dashboard combines volume analysis, order flow metrics, technical indicators, and institutional liquidity zones to identify high-probability scalping opportunities.
🎯 Key Features
✅ Multi-Timeframe Analysis
Fast MACD (5/13/5) for momentum
Quick EMAs (9/20/50) for trend direction
Rapid Stochastic (5/3/3) for oversold/overbought conditions
Fast RSI (7) for extreme readings
✅ Advanced Order Flow Metrics
CVD (Cumulative Volume Delta): Tracks buy vs sell pressure over time
Delta Momentum: Measures acceleration in buying/selling
Buy/Sell Pressure Ratio: Real-time balance of market forces
Order Flow Imbalance: Detects aggressive buying or selling
Tape Speed: Measures how fast volume is hitting the market
✅ Institutional Liquidity Zones
Buy-Side Liquidity: Areas above price where short stop losses cluster
Sell-Side Liquidity: Areas below price where long stop losses cluster
Liquidity Sweeps: Detects "stop hunts" by institutions before reversals
✅ Volume-Based Candle Coloring
Visual representation of volume intensity
Extreme, High, Normal, and Low volume categories
Fully customizable color schemes
✅ Dynamic Support/Resistance
Volume-weighted price levels
Automatically updates every 3 bars
Shows distance to key levels
📈 Dashboard Indicators Explained
The bottom-left dashboard displays 14 real-time metrics:
▸ MACD (●)
Green = Bullish momentum
Red = Bearish momentum
Gray = Neutral
▸ Supp (Price)
Support level
Green highlight = at support (good for long entry)
▸ Res (Price)
Resistance level
Orange highlight = at resistance (good for short entry)
▸ EMA (●)
Green = Price above EMAs (bullish)
Red = Price below EMAs (bearish)
▸ Stoch (●)
Green = Oversold (<20)
Red = Overbought (>80)
Gray = Neutral
▸ RSI (●)
Green = Oversold (<30)
Red = Overbought (>70)
Gray = Neutral
▸ CVD (●)
Green = Cumulative buying pressure
Red = Cumulative selling pressure
▸ ΔCVD (●)
Green = Increasing buy pressure
Red = Increasing sell pressure
▸ Imbal (●)
Green = Buy imbalance (>2:1 ratio)
Red = Sell imbalance
▸ Vol (●)
Green/Yellow background = Volume surge (>2x average)
▸ Tape (●)
Green/Yellow background = Fast tape (>1.5x speed)
▸ Liq (↑↓●)
↑ = Bullish sweep or near sell-side liquidity
↓ = Bearish sweep or near buy-side liquidity
● = Neutral
▸ Score (#L or #S)
Quality score (0-8) for Long or Short setups
Higher numbers = Better quality trade
▸ SCALP (LONG/SHORT/WAIT)
Primary signal
Bright color = High quality (score ≥5)
Dim color = Decent quality (score =4)
Gray = Wait for better setup
🎨 Candle Color System
Volume-Based Colors
Bright Green/Red: Extreme volume (>2.5x average) - Major moves
Medium Green/Red: High volume (>1.5x average) - Strong activity
Dull Green/Red: Normal volume - Standard market activity
Gray: Low volume (<0.5x average) - Avoid trading
Signal-Based Colors
Lime: Strong Long signal (score ≥5)
Green: Decent Long signal (score =4)
Orange: Strong Short signal (score ≥5)
Red: Decent Short signal (score =4)
Candle Color Modes (adjustable in settings):
Volume Only: Pure volume intensity
Volume + Signals: Signals override volume when present (default)
Signals Only: Only shows entry signals
🔵 Chart Indicators
Support & Resistance Lines
Green Line: Volume-weighted support level
Red Line: Volume-weighted resistance level
Lines update dynamically based on 100-bar volume profile
Liquidity Zones
Cyan Circles/Dashed Lines: Buy-side liquidity (above price)
Where short stop losses cluster
Potential targets for bullish moves
Institutions may push price here before reversing down
Magenta Circles/Dashed Lines: Sell-side liquidity (below price)
Where long stop losses cluster
Potential targets for bearish moves
Institutions may push price here before reversing up
Entry Markers
Large Green Triangle (▲): High quality long entry (score ≥5)
Small Green Triangle (▲): Decent long entry (score =4)
Large Orange Triangle (▼): High quality short entry (score ≥5)
Small Red Triangle (▼): Decent short entry (score =4)
Liquidity Sweep Markers
Cyan X-Cross (below bar): Bullish liquidity sweep - "LIQ↑"
Price swept sell-side liquidity and reversed up
Strong buy signal
Magenta X-Cross (above bar): Bearish liquidity sweep - "LIQ↓"
Price swept buy-side liquidity and reversed down
Strong sell signal
🎯 How to Use This Indicator
For Long Scalps (Buy):
Wait for Dashboard Signal: SCALP = "LONG" with score ≥5
Confirm Multiple Green Dots: Look for EMA, CVD, ΔCVD, Imbal all green
Check Volume: Vol or Tape should show yellow background (surge)
Look for Confluence:
Price at or near Support level (green highlight)
Price near Sell-Side Liquidity (magenta line below)
RSI oversold (green dot)
Large green triangle appears on chart
Best Entry: On a bullish liquidity sweep (cyan X-cross)
For Short Scalps (Sell):
Wait for Dashboard Signal: SCALP = "SHORT" with score ≥5
Confirm Multiple Red Dots: Look for EMA, CVD, ΔCVD, Imbal all red
Check Volume: Vol or Tape should show yellow background (surge)
Look for Confluence:
Price at or near Resistance level (orange highlight)
Price near Buy-Side Liquidity (cyan line above)
RSI overbought (red dot)
Large orange triangle appears on chart
Best Entry: On a bearish liquidity sweep (magenta X-cross)
Three Types of Scalping Setups:
1. Quick Scalp (Fastest - 1-5 minute holds)
MACD or Stochastic crossover + Volume surge
At Support/Resistance level
Score ≥4
2. Momentum Scalp (Ride the wave - 5-15 minute holds)
Strong EMA alignment + CVD slope positive
Order flow imbalance + Fast tape
Volume surge with price structure
Score ≥5
3. Reversal Scalp (Fade extremes - 3-10 minute holds)
Stochastic + RSI extreme readings
At Support/Resistance OR liquidity sweep
CVD momentum reversal
Score ≥6
⚙️ Recommended Settings
Timeframes
Primary: 1-minute, 2-minute, 5-minute
Confirmation: Use 15-minute chart for overall trend direction
Asset Types
Forex pairs (high liquidity)
Crypto (BTC, ETH with high volume)
Futures (ES, NQ)
Major stocks during market hours
Risk Management
Target: 1-3 times your stop loss
Stop Loss: Below nearest liquidity zone for longs, above for shorts
Position Size: Never risk more than 1% per trade
Score ≥5: Take full position size
Score =4: Take half position size or skip
🔧 Customization Options
Input Groups
MACD Settings
Fast Length: 5 (scalping optimized)
Slow Length: 13
Signal Length: 5
EMA Settings
EMA 9, 20, 50 (fast scalping EMAs)
Stochastic Settings
%K Length: 5
%D Smoothing: 3
Smooth: 3
CVD Settings
MA Length: 10 (for CVD smoothing)
RSI Settings
Length: 7 (fast RSI)
Overbought: 70
Oversold: 30
Volume Settings
MA Length: 10
Extreme Multiplier: 2.5x
High Multiplier: 1.5x
Low Multiplier: 0.5x
Liquidity Zone Settings
Lookback Periods: 20
Swing Strength: 3
Show Liquidity Zones: On/Off
Show Liquidity Sweeps: On/Off
Support/Resistance Settings
Volume Lookback: 100 bars (~2 hours on 1-min chart)
Order Flow Settings
Imbalance Threshold: 2.0 (2:1 ratio)
Color Customization
All volume colors customizable
All signal colors customizable
All liquidity colors customizable
📊 Volume Legend (Top Right)
The small table in the top-right corner shows the volume intensity key:
Extreme: >2.5x average volume
High: >1.5x average volume
Normal: 0.5x to 1.5x average volume
Low: <0.5x average volume
🔔 Built-in Alerts
Set up these alerts to never miss a trade:
High Quality Long Scalp: Triggers when entry_long and score ≥5
High Quality Short Scalp: Triggers when entry_short and score ≥5
Bullish Liquidity Sweep: Triggers when sell-side liquidity is swept
Bearish Liquidity Sweep: Triggers when buy-side liquidity is swept
To set up: Right-click chart → Add Alert → Select condition → Create
💡 Pro Tips
Understanding Liquidity Zones
Buy-Side Liquidity = Where shorts have their stops = Price tends to wick up here
Sell-Side Liquidity = Where longs have their stops = Price tends to wick down here
Liquidity Sweep = Institution triggers stops, absorbs liquidity, then reverses
Best trades = Enter AFTER the sweep when price reverses back
Reading the Dashboard
All Green Dots + Yellow Volume = Strong Long Setup
All Red Dots + Yellow Volume = Strong Short Setup
Mixed Colors = Choppy/Neutral = Wait
Score 6+ = Highest probability trades
Score 3 or less = Avoid
Confluence is Key
Never trade on a single indicator. Wait for:
Dashboard score ≥5
Volume surge (yellow background)
At support/resistance OR liquidity zone
CVD and momentum aligned
Price structure confirmation (triangle marker)
Avoid These Situations
❌ Low volume periods (gray candles)
❌ Dashboard shows "WAIT"
❌ Score below 4
❌ No volume surge during entry
❌ Trading against higher timeframe trend
Best Trading Sessions
Forex: London open (3-5 AM EST), NY open (8-10 AM EST)
Crypto: Works 24/7, best during high volume periods
Stocks: First hour (9:30-10:30 AM EST), last hour (3-4 PM EST)
Futures: US session open (9:30 AM EST)
🎓 Understanding the Scoring System
The indicator calculates a quality score (0-8) for both long and short setups:
+1 point for each:
EMA bias aligned (price above/below EMA structure)
CVD momentum bias aligned (buying/selling pressure)
Buy/Sell pressure ratio aligned (>1.5x or <0.67x)
Volume strength (surge detected)
Order flow imbalance (>2:1 ratio)
Tape speed (>1.3x average)
Price structure (higher highs or lower lows)
Liquidity bias (sweep detected)
Score Interpretation:
7-8: Extremely high probability (rare, take immediately)
6: Very high probability (excellent trade)
5: High probability (good trade)
4: Decent probability (acceptable with tight stop)
3 or less: Low probability (wait for better setup)
📋 Quick Reference Card
Entry Checklist
Dashboard shows LONG or SHORT
Score is ≥5
Multiple indicators aligned (green or red dots)
Volume surge present (yellow background)
At support/resistance or liquidity zone
Triangle marker appeared on chart
Risk:Reward ratio is at least 1:2
Exit Strategy
Take Profit: At opposite liquidity zone or resistance/support
Stop Loss: Below sell-side liquidity (longs) or above buy-side liquidity (shorts)
Trail Stop: Move to breakeven after 1:1 risk:reward achieved
⚠️ Important Notes
This is NOT a holy grail: No indicator is 100% accurate. Always use proper risk management.
Backtest first: Paper trade or backtest on your specific instrument before using real money.
Market conditions matter: This indicator works best in trending or volatile markets, not in tight consolidation.
Combine with price action: Use the indicator as confluence with your own price action reading.
Adjust for your instrument: Different assets may require tweaking the sensitivity settings.
Lower timeframes = More noise: 1-minute charts have more false signals than 5-minute charts.
🔄 Version History
v1.0 - Initial release
Multi-indicator dashboard
Volume-based candle coloring
Support/Resistance detection
Entry signal generation
v2.0 - Current version
Added liquidity zone detection
Added liquidity sweep identification
Enhanced scoring system (now 0-8)
Added liquidity bias to entries
New alerts for liquidity sweeps
Improved dashboard with Liq indicator
📞 Support & Feedback
If you find this indicator helpful, please:
⭐ Give it a boost
💬 Share your results in the comments
🐛 Report any bugs or issues
💡 Suggest improvements
Disclaimer: This indicator is for educational purposes only. Trading involves significant risk. Past performance does not guarantee future results. Always trade responsibly and never risk more than you can afford to lose.
🏆 Credits
Created for serious scalpers who want institutional-level insights on retail charts. Combines order flow analysis, volume profiling, and liquidity mapping into one comprehensive tool.
Happy Scalping! 🚀📈
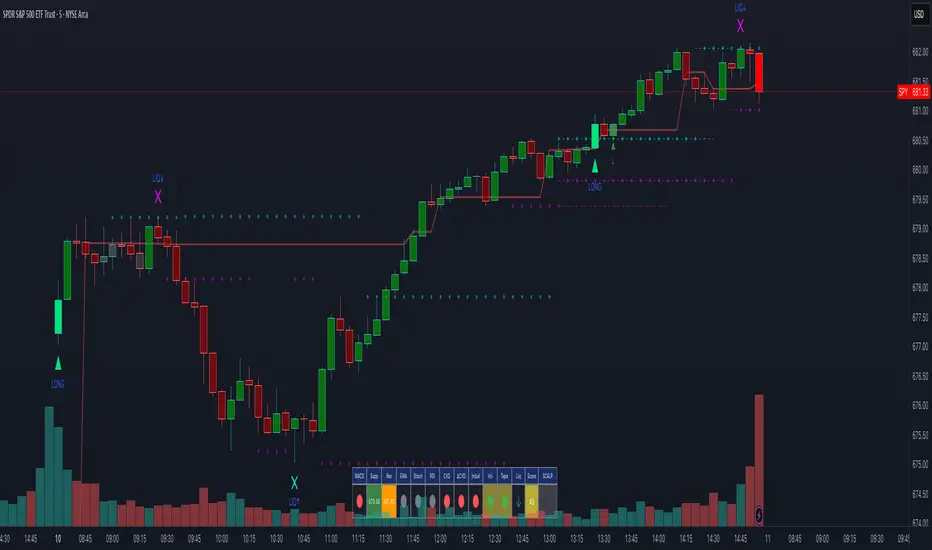
OrderFlow [Probabilities] | FractalystWhat's the indicator's purpose and functionality?
The indicator is designed to incorporate probabilities with buyside and sellside liquidity, as well as premium and discount ranges within the market. It also provides traders with a multi-timeframe functionality for observing liquidity levels and probabilities across two timeframes without the need to manually switch between them.
These levels are often used in smart money trading concepts for identifying key areas of interest, such as potential reversal points, areas of accumulation or distribution, and zones of high liquidity.
----
What's the purpose of these levels? What are the underlying calculations?
1. Understanding Swing highs and Swing Lows
Swing High: A Swing High is formed when there is a high with 2 lower highs to the left and right.
Swing Low: A Swing Low is formed when there is a low with 2 higher lows to the left and right.
2. Understanding the purpose and the underlying calculations behind Buyside , Sellside and Equilibrium levels.
3. Identifying Discount and Premium Zones.
4. Importance of Risk-Reward in Premium and Discount Ranges
----
How does the script calculate probabilities?
The script calculates the probability of each liquidity level individually. Here's the breakdown:
1. Upon the formation of a new range, the script waits for the price to reach and tap into equilibrium or the 50% level. Status: "⏸" - Inactive
2. Once equilibrium is tapped into, the equilibrium status becomes activated and it waits for either liquidity side to be hit. Status: "▶" - Active
3. If the buyside liquidity is hit, the script adds to the count of successful buyside liquidity occurrences. Similarly, if the sellside is tapped, it records successful sellside liquidity occurrences.
5. Finally, the number of successful occurrences for each side is divided by the overall count individually to calculate the range probabilities.
Note: The calculations are performed independently for each directional range. A range is considered bearish if the previous breakout was through a sellside liquidity. Conversely, a range is considered bullish if the most recent breakout was through a buyside liquidity.
----
What does the multi-timeframe functionality offer?
Enabling and selecting a higher timeframe in the indicator's user-input settings allows you to access not only the current range information but also the liquidity sides, status, price levels, and probabilities of a higher timeframe without needing to switch between timeframes and mark up the levels manually.
----
What are the multi-timeframe underlying calculations?
The script uses the same calculations (mentioned above) and requests the data such as price levels, bar time, probabilities and booleans from the user-input timeframe.
Non-repainting Security Function with Lookahead ON
//Function to fetch data for a given timeframe
getHTFData(timeframe_,exp_) =>
request.security(syminfo.tickerid, timeframe_,exp_ ,lookahead = barmerge.lookahead_on)
----
How to use the indicator?
1. Add the indicator to your TradingView chart.
2. Choose the pair you want to analyze/trade.
3. Enable the HTF in user-input settings and choose a timeframe as for your higher timeframe bias.
4. (Important) : Ensure that the probabilities on both timeframes are aligned in one direction. If not, switch between timeframes until you find a pair of timeframes that are in line with each other and have higher probabilities on one liquidity side.
For Swing traders:
Use Hourly timeframes (1H/2H/4H/8H/12H) as your current timeframe and 1D/3D/1W/2W for your higher timeframe (HTF).
Entry: Hourly Equilibrium level. (Limit order)
Stoploss: Place it on the side where the probability is lower than 50%.
Break-even level/TP1: Hourly breakout of the liquidity.
TP2: Target the Higher Timeframe (HTF) liquidity level where the probability is higher than 50%.
2H/1D COINBASE:BTCUSD
For Day traders:
Use minutely timeframes (5m/15m/30m) as your current timeframe and 1H/2H/4H/8H/12H for your higher timeframe (HTF).
Entry: Minutely Equilibrium level. (Limit order)
Stoploss: Place it on the side where the probability is lower than 50%.
Break-even level/TP1: Minutely breakout of the liquidity.
TP2: Target the Higher Timeframe (HTF) liquidity level where the probability is higher than 50%.
1H/5m COINBASE:BTCUSD
----
User-input settings and customizations
----
What makes this indicator original?
1. Real-time calculation of probabilities directly on your charts.
2. Multi-timeframe functionality, enabling effortless observation of liquidity levels and probabilities across two timeframes.
3. Status label for clear identification of whether price has reached equilibrium.
4. All levels are updated only upon candle closure above or below liquidity levels, ensuring it remains a non-repainting indicator.
----
Terms and Conditions | Disclaimer
Our charting tools are provided for informational and educational purposes only and should not be construed as financial, investment, or trading advice. They are not intended to forecast market movements or offer specific recommendations. Users should understand that past performance does not guarantee future results and should not base financial decisions solely on historical data.
By continuing to use our charting tools, the user acknowledges and accepts the Terms and Conditions outlined in this legal disclaimer.

ICSM (Impulse-Correction & SCOB Mapper) [WinWorld]DESCRIPTION
ICSM (Impulse-Correction SCOB Mapper) is the indicator that analyzes the price movement and identifies valid impulses, corrections and SCOBs. It is a powerful tool that can be used with any type of technical analysis because it's flexible, informative, easy to use and it does substantially improve trader's awareness of the most liquid zones of interest.
SETTINGS
General | Visuals
Colour theme — defines the colour theme of the ICSM.
SCOB | Visuals
Show SCOB — enables/disables SCOB;
Mark SCOB with — represents a list of style options for SCOB representation;
SCOB colour — defines the colour of the SCOB;
ICM | Visuals
Show ICM lines — enables/disables ICM (Impulse-Correction Mapper) lines;
Show IC trend — enables/disables visualization of impulse-correction trend via coloured divider at the bottom of the chart;
Line colour — defines the colour of the ICM lines;
Line style — defines the style of the ICM lines;
Alerts
ICM — enables/disables alert for breaking ICM lines;
SCOB — enables/disables alert for SCOB creation;
ICM+SCOB — enables/disables alert for SCOB occurance at the end of the single impulse/correction, which grabs ICM line's liquidity.
ICM+SCOB (same candle) — enables/disables alert for SCOB occurance at the candle, which grabs ICM line's liquidity.
IMPORTANT CONCEPTS
In order to fully understand what ICSM can do, let's do a quick overview of the most important concepts that this indicator is built on.
By ICM we mean the liquidity grabbing of Impulse-Correction Mapper's lines (ICM lines; represented as dashed horizontal lines on the chart ). Saying shortly, liquidity grabs of ICM lines posses great opportunities for finding great entries.
SCOB (Single Candle Order Block) builds up by 3 simple rules:
Previous candle's liquidity is grabbed;
Current candle closes inside previous candle;
Imbalance occurs on the next candle.
SCOB is a quite useful zone of interest, from which the price usually reverses. You can also use SCOB as POI* on HTF** or as entry zone on LTF***.
* POI — Point Of Interest
* HTF — Higher TimeFrame
* LTF — Lower TimeFrame
"ICM+SCOB" is a short name that we use for event, at which price first grabs the liquidity from ICM line and then creates a SCOB at the same impulse/correction movement ( on the same ICM line, that does the liquidity grab ). Usually the SCOB that occurs after this event represents a highly liquid zone of interest , which should be considered when choosing entry level.
"ICM+SCOB (same candle)" is basically the same as "ICM+SCOB" event but with one major difference — the candle, which grabs the liquidity of ICM line, is also the candle at which the SCOB occurs, making such SCOB an even better zone of interest than a regular SCOB from ICM+SCOB event.
BIGGEST ADVANTAGES
ICSM precisely identifies impulses and corrections. Huge load of indicators on the TradingView does only show the simplest zones of interests, while ICSM uses our team's signature algorithms to precisely identify true impulses and corrections in the market, allowing traders to see both local and global price direction better and at the same time providing traders with the most liquid zones of interest;
ICSM shows points of interest and liquidity. The indicator identifies the nearest points of interest and zones, where the liquidity is concentrated, allowing you to find great entry and exit points for your trades;
ICSM has SCOB (Single Candle Order Block) detection function. ICM is packed with the extremely useful in SMC trading SCOB detetction feature, which allows you find even more solid points of interest;
ICSM has super minimalistic design, which contains only the things you really need. Your chart will not be overloaded with unnecessary information. You will only see clear points of interest, liquidity and price movement.
WHY SHOULD YOU USE IT?
As was said above, ICSM allows you to see the most profitable points and zones of interest, which professional SMC traders consider as one of the best in the market, because they are historically the areas from which the price bounces the most, allowing the smartest traders to get quick an clean profits with low drawdown.
In the ICSM indicator these zones are SCOB and ICM line liquidity grabs. By using these zones of interest to find entry points, you increase the chance to open a trade at the most lucrative price and reduce trading risks.
Considering what was said above, this indicator can help traders reduce drawdown risks and increase potential profits simply by showing the most liquid zones of interest, which are perfect for opening a trading position.
Here are some of the examples of how you leverage ICSM in your trading process:
Example of the short trade:
Price shows overall short trend. Trend liquidity is being formed.
Price grabs liduiqity from three ICM lines in a row and then creates a long SCOB at the end of 3rd liquidity grab.
SCOB, which occured at the end of ICM line, represents much stronger zone of interest than a regular SCOB. In this case it represents a zone, which we will use to find an entry.
The entry for the trade will be SCOB candle's low, stop-loss target should be put above SCOB candle's high. Our take-profit target is trend liquidity. See the screenshot above for better understanding.
▼ Now let's see the long trade example. ▼
Example of the long trade:
Price creates trend liquidity by showing equal highs ( EQH ).
Price grabs liduiqity from four ICM lines in a row and then creates a long SCOB at the end of 4th liquidity grab.
Again: SCOB, which occured at the end of ICM line, represents much stronger zone of interest than a regular SCOB. In this case it represents a zone, which we will use to find an entry.
The entry for the trade will be SCOB candle's high, stop-loss target should be put below SCOB candle's low. Our take-profit target is EQH. See the screenshot above for better understanding.
ALERTS
ICSM provides simple and easy alert customization, allwoing to choose only the alerts you want to receive. You can choose from the following alert options:
ICM — impulse or correction liquidity grab;
SCOB — SCOB is formed, wether or not the liquidity is grabbed from the impulse or correction;
SCOB+ICM — SCOB is formed after grabbing the liquidity of the ICM line;
SCOB+ICM (same candle) — SCOB is formed in the liquidity area of the impulse or correction.
HOW CAN I GET THE MOST OUT OF IT?
ICSM displays only the first liquidity of an impulse or correction, which matches the IDM (Inducement) in the Advanced SMC strategy . This strategy is completely covered in the World Class SMC indicator and is available for free for PDF in three parts.
You can also ICSM with any other strategy, because ICSM is a very flexible indicator and will help anyone improve their trading by making one aware of the high-quality liquidity on the chart.
Let's see how you can leverage ICSM with our World Class SMC indicator and other different strategies:
Example of the long & short trades with World Class SMC.
Long (1-3):
Price reached previous OB-EXT . This is the first sign for the potential price reversal;
ICM+SCOB happened after price reached OB-EXT;
After that, you can need to look for an entry on LTF. If you don't know how to do it, you can refer to our education materials.
Short (4-6):
Price reached OB-IDM , which is also a great sign for a potential upcoming price reversal;
ICM+SCOB occured after liquidity grab of the previous SCOB. This fact does strengthen the probability of the potential upcoming price reversal;
Now you need to switch to LTF and find an entry there.
Example of the short trade with simple Fibonacci retracement strategy.
Price grabs the liquidity of the ICM lines three times in a row, forming SCOB after the 3rd grab;
Price performs correctional move down without testing the SCOB, leaving no entry opportunity by our initial strategy, so we can add another strategy — Fibonacci retracement from 0.618 level — to our analysis in order to find an entry ;
We use Fibonacci grid with our initial strategy to find the best POI, that will align with the trend direction and will eventually become our entry point.
SUMMARY
ICSM is a unique indicator that indentifies zones and points of interests with high-quiality liquidity and can be both a stand-alone tool and can be integrated into any other strategy to increase the efficiency of analysis, accuracy of trading entries and reduce trading risks.
If you want to learn the SMC strategies that our team uses in our products, you can refer to our educational materials.
We hope that you will find a great use of ICSM and it will help you improve your perfomance as a trader. Best of luck, traders!
— with love, WinWorld Team

Liquidation Volume (Zeiierman)█ Overview
The Liquidation Volume (Zeiierman) indicator highlights real-time long and short liquidations across all timeframes on TradingView. The indicator assists traders in identifying potential liquidation points in the market based on volume and price movements. Liquidation, in this context, refers to the forced closure of a trader's position due to insufficient margin in their account to support open positions, often occurring during significant price movements.
█ How It Works
The indicator operates primarily through the computation of a MomentumAdjustedPrice function, which is applied to volume-weighted prices (open, high, low, close) adjusted for volatility.
█ How to Use
Identifying Support and Resistance Levels: Liquidation data can provide valuable insights into key market levels where significant trading activities occur. These levels often act as support or resistance in the price chart. Support levels are typically where an asset's price finds a floor, as buying interest is significant enough to outweigh selling pressure. Conversely, resistance levels are where an asset's price may find a ceiling, with selling interest outweighing buying pressure. By analyzing liquidation data, traders can identify these critical points.
Start of a New Trend:
The initiation of a new trend can often be identified by a significant shift in liquidation volumes near breakout levels.
Trend Continuations:
Trend continuations are periods where the current trend is sustained and further confirmed by liquidation patterns. For example, in an uptrend, continuous short liquidations might occur, suggesting that the trend is strong and likely to persist as bearish traders keep getting squeezed out. In a downtrend, continuous long liquidations can serve as confirmation that the trend is still in place. Recognizing these patterns in liquidation data can help traders to stay aligned with the prevailing trend and avoid premature exits or entries against the trend.
Trend Reversals: Patterns in liquidations can be crucial in signaling potential trend reversals. A sudden and significant change in liquidation volumes—like a spike in long liquidations during a downtrend or short liquidations during an uptrend—can indicate that the current trend is losing steam and a reversal may be imminent. This information can be particularly useful for traders looking to anticipate market turns and adjust their strategies accordingly.
Spot Potential Liquidation Points: By observing the liquidation candles and their colors, traders can identify where large liquidations are likely occurring, signaling potential market turning points.
Understand Market Sentiment: Changes in liquidation volumes can provide insights into bullish or bearish sentiment, helping traders gauge the market mood. By observing liquidation patterns and clusters, traders can get insights into prevailing market sentiments and emerging trends.
█ Settings
Liquidation Source: Allows selection between 'Price' and 'Volume' for liquidation analysis.
Volume Period: Determines the period over which volume is averaged.
Volatility Period: Sets the length for calculating standard deviation, influencing the volatility measure.
Candle Display Toggle: Enables or disables the display of liquidation candles on the chart.
Threshold: Sets the level at which liquidation bars are triggered.
-----------------
Disclaimer
The information contained in my Scripts/Indicators/Ideas/Algos/Systems does not constitute financial advice or a solicitation to buy or sell any securities of any type. I will not accept liability for any loss or damage, including without limitation any loss of profit, which may arise directly or indirectly from the use of or reliance on such information.
All investments involve risk, and the past performance of a security, industry, sector, market, financial product, trading strategy, backtest, or individual's trading does not guarantee future results or returns. Investors are fully responsible for any investment decisions they make. Such decisions should be based solely on an evaluation of their financial circumstances, investment objectives, risk tolerance, and liquidity needs.
My Scripts/Indicators/Ideas/Algos/Systems are only for educational purposes!
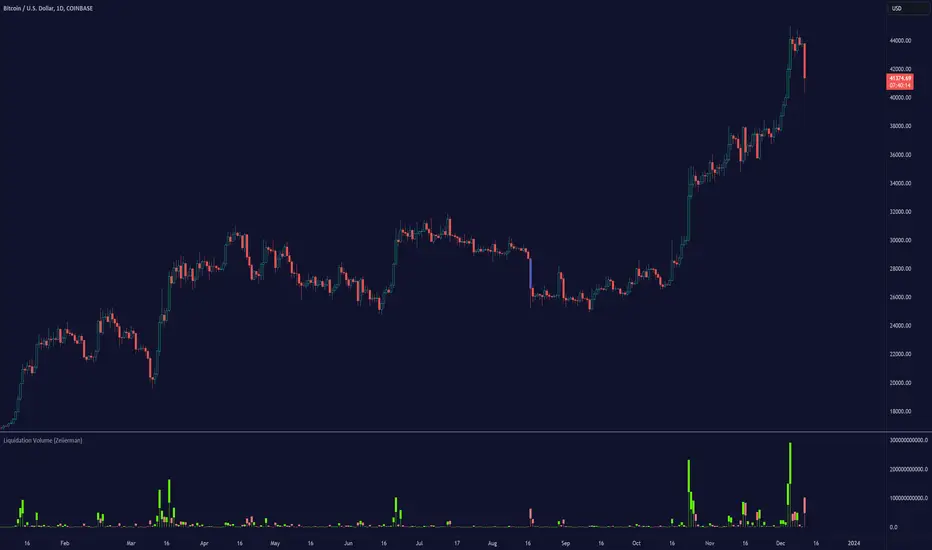
MR Liq lvlHi Guys!
- This script show you liquidations levels with leverage of 100X, 50X, 25X & 10X (shorts & longs).
- This indicator "only" works for XBT on Bitmex.
- Other indicators only show the liquidations up to 25X .
- The idea of this indicator is to help the user to determine those levels where Bitmex hunt liquidity.
Best Regards.
Mr.amin

Apex Liquidity & Trend Architect [Smart]Trading charts often suffer from two problems: Noise (too many false signals in chopping markets) and Clutter (too many old lines and zones obscuring price).
ALTA solves both. It is a streamlined, institutional-grade trend system that uses ADX filtering to silence weak signals and Time-Decay logic to automatically clean up old liquidity zones. It respects your screen real estate, showing you only what matters, right now.
1. The "Smart" Engine
Unlike standard trend indicators that repaint or clutter the screen, ALTA introduces three key innovations:
A. Hull Moving Average (HMA) Baseline
We have upgraded the core engine to use the Hull Moving Average. HMA is significantly faster and smoother than standard EMAs or SMAs, reducing lag on entry signals.
Note: You can switch back to WMA or SMA in the settings if you prefer a slower pace.
B. ADX Momentum Filtering
Quality over Quantity: The script monitors the ADX (Average Directional Index). If the trend flips, but the ADX is below 20 (weak trend), the signal is blocked.
This prevents you from getting chopped out during sideways accumulation phases. You only get a "BUY" or "SELL" label when there is actual momentum behind the move.
C. Adaptive Gradient Coloring
The candles do not just turn Green or Red. They change intensity based on trend strength.
Bright/Vivid Candles: Strong Momentum (High ADX).
Dark/Dull Candles: Weak Momentum (Low ADX).
Visual Cue: If the candles are fading into the background, stay out of the market.
2. Self-Cleaning Liquidity Zones
Most support/resistance indicators leave old boxes on the chart forever. ALTA uses a Decay Protocol.
Volume Validation: Supply/Demand zones are only drawn if the pivot point had volume significantly higher than average (configurable).
Mitigation: If price wicks through a zone, it is deleted instantly.
Time Decay (New): If a zone is not hit within a set number of bars (Default: 100), it automatically deletes itself. This keeps your chart focused on fresh levels only.
3. The Minimalist HUD
A simplified dashboard in the corner of your screen provides an instant health check of the market:
ALTA Label: System Status.
Trend: BULL / BEAR / WAIT (Squeeze).
Power: WEAK / SOLID / STRONG (Based on ADX).
4. How to Trade (The Strategy)
The High-Probability Buy
Trend: Ribbon is Green.
Candles: Candles are Bright Green (indicating High ADX Strength).
Signal: A "BUY" label appears (confirmed by ADX filter).
Liquidity: Price is bouncing off a valid Demand Zone.
The High-Probability Sell
Trend: Ribbon is Red.
Candles: Candles are Bright Red (indicating High ADX Strength).
Signal: A "SELL" label appears.
Liquidity: Price is rejecting off a valid Supply Zone.
When to STAY OUT
The Squeeze: If the ribbon turns Grey/White, volatility is compressing. Wait for the breakout.
The Fade: If the candles are dark/translucent, momentum is dying. Take profits or wait for a fresh impulse.
5. Settings & Customization
Basis Type: Switch between HMA (Fast), WMA (Standard), or SMA (Slow).
Signal Quality Filter: Toggle the ADX filter on/off.
Zone Life: How many bars should a Supply/Demand zone survive before decaying?
Tooltips: Every single setting in this script includes a descriptive tooltip. Hover over the "i" icon in the settings menu for detailed explanations of every feature.
Disclaimer
This indicator is for educational purposes only. Past performance (even with smart filtering) does not guarantee future results. Always manage your risk.

SMC Liquidity & Order Blocks🔹 1. Moving Averages for Trend Confirmation
Uses Exponential Moving Averages (EMA) to determine trend direction.
9-period EMA (blue) and 15-period EMA (red) are plotted.
🔹 2. Liquidity Zones (Swing Highs & Lows)
Identifies liquidity zones where price is likely to react.
Buy-Side Liquidity: Highest high over 20 periods (Green line).
Sell-Side Liquidity: Lowest low over 20 periods (Red line).
🔹 3. Order Block Detection
Detects bullish and bearish order blocks (key price zones of institutional activity).
Bullish Order Block (OB): Formed when the highest close over 5 bars exceeds the highest high.
Bearish Order Block (OB): Formed when the lowest close over 5 bars is lower than the lowest low.
Plotted using green (up-triangle) for bullish OB and red (down-triangle) for bearish OB.
🔹 4. Fair Value Gaps (FVG)
Detects price inefficiencies (gaps between candles).
FVG Up: When a candle's high is lower than a candle two bars ahead.
FVG Down: When a candle's low is higher than a candle two bars ahead.
Plotted using blue circles (FVG Up) and orange circles (FVG Down).

FxCanli RangeFxCanli Range is an indicator based on ICT Internal Range and External Range concept.
What is ICT Internal Range Liquidity?
The Fair Value Gap is marked as the ICT internal range liquidity.
ICT Fair Value Gap is marked as the liquidity because it is a formation of three candles leaving an area between high and low of 1st and 3rd candle where price do not overlap.
FxCanli Range Indicator draws all Internal Ranges above explaining the ICT internal range liquidity.
What is Imbalance (FVG)?
Fair Value Gaps are price jumps caused by imbalanced buying and selling pressures.
A bullish Fair Value Gap is created when there is a gap between the high of the first candle and the low of the third candle.
A bearish Fair Value Gap is created when there is a gap between the low of the first candle and the high of the third candle.
What is ICT External Range Liquidity?
The swing high and swing low of an ICT dealing range are termed as external range.
The high of an ICT dealing range is termed as “buy side liquidity” assuming the buy stops rest above the high of dealing range.
While the low of an ICT dealing range is known as “sell side liquidity” assuming the sell stops resting below the low of dealing range.
FxCanli Range Indicator draws all External Ranges above explaining the ICT external range liquidity
🔶 USAGE & EXAMPLES
As ICT said us, Price moves 2 side, Internal Liquidity or External Liquidity
External Range Liquidity to Internal Range Liquidity
When price reached to External Range, it will sweep the External Range Liquidity
at that time, we have to wait price to reverse and start to move to Internal range liquidity (FVG)
our strategy has to be like this; we have to open 2 time less lower time frame
if we are at 1 hour chart, we have to open 1Hour - 15 min - 5 min chart
and wait for Trend Reversal pattern at there
Internal Range Liquidity to External Range Liquidity
When price reached to Internal Range(FVG), it will fill the imbalance
at that time, we have to wait price to reverse and start to move to External Range Liquidity.
Again we have to decrease our time frame 2 times.
if we are at 1 hour chart, we have to open 1Hour -> 15 min -> 5 min chart
and wait for Trend Reversal pattern at there
🔶 SETTINGS
With the settings;
▪️ Fractal Properties;
it will show fractals or not, you will decide the period of fractals, Style, Color and also Size of the fractal
▪️ Trend Line Properties;
it will show trend or not, you will decide the color of the trend, line style, and line width.
▪️ External Range Properties;
it will show external range or not, Color of the level, line style, line witdh, show text of the external range, what will it write at the text, place/size/color of the text, show time frame, show price,
▪️ Internal Range Properties;
it will show internal range or not, Color of the level, line style, line witdh, show text of the external range, what will it write at the text, place/size/color of the text, show time frame, show price,
▪️ Alert Conditions
you will set alerts at this part
Alert or not, liquidity(External Range) alerts, FVG(Internal Range) alerts, FVG filled alert
Part 1
Part 2
Wish you great trades...
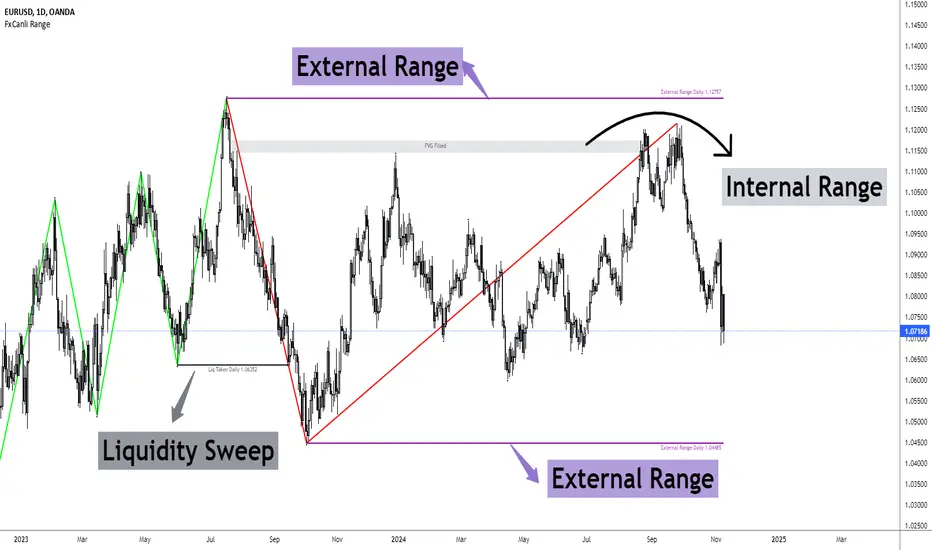
24h volume by 100eyesIntroducing the 24h volume indicator on Tradingview!
DM me (Trading-Guru) here on Tradingview to get access to this indicator.
100eyes asked me to create a new Tradingview indicator that estimates the 24h volume of a pair. Works for all BTC/USDT/USD/ETH crypto pairs. You can choose to display the 24h volume in BTC or USD(T).
This indicator allows you to:
Check the 24h volume of a pair without having to check the website of the exchange
Quickly compare 24h volumes across pairs, e.g. ADABTC to ADAUSDT
Quickly compare 24h volumes of pairs across different exchanges
Volume is an important factor in crypto trading to estimate liquidity. Use this indicator to adjust your position size according to the volume of a pair.
Even on the website of an exchange, it's difficult to compare volume since for example volumes of USDT pairs are expressed in USDT, and volumes of BTC pairs are expressed in BTC. This indicator solves that problem by expressing everything in the same currency, and also directly on Tradingview!
F.A.Q.
Q: How do I get access to the indicator?
A: DM Trading-Guru on Tradingview.
Q: Why are there different values for different timeframes?
A: That is due to Tradingview limitations. The smaller the timeframe, the more accurate the displayed value. The timeframe you're looking at equals the maximum amount of lag.
Q: I'm on the Tradingview mobile app, why is the value is not displayed next to the indicator's name?
A: Click somewhere inside the chart. Then the indicator value will appear.
Binary Options 1 Minute Signals [TradingFinder] 1 Min Strategy🔵 Introduction
At first sight, price movement in binary options appears random, but behind every move lies a clear logic of liquidity and market imbalance. The market is always driven by the hunt for liquidity and the continuous rebalancing that takes place around Fair Value Gaps (FVGs) and Order Blocks (OBs). These zones are where institutional activity is concentrated and where Smart Money creates the most significant reactions.
When price approaches a key liquidity zone, it often performs a Liquidity Sweep to capture orders resting around previous highs or lows. This move usually presents itself as a False Breakout. Price briefly breaks a level to trigger stop losses and collect liquidity, then quickly reverses direction. Understanding this false breakout behavior is essential for identifying high probability reversals in binary options trading.
After the liquidity sweep, price typically retraces into a Fair Value Gap or Order Block, where the market seeks balance and new orders are introduced. This interaction between liquidity, imbalance, and institutional order flow forms the core logic of every Smart Money trading model.
By focusing on Liquidity Sweeps, False Breakouts, and the structure of FVGs and OBs, traders can read the true intention behind price movements. What seems like random volatility becomes a structured cycle of liquidity collection and reaction, offering clear opportunities for precision-based binary entries.
Bullish Setup :
Bearish Setup :
🔵 How to Use
This indicator works within the Smart Money framework and focuses on the connection between Liquidity Sweep, False Breakout, Fair Value Gap (FVG) and Order Block (OB).
It is created to help traders identify the moment when the market finishes collecting liquidity and begins to show signs of reversal.
The indicator studies how price behaves around zones where liquidity is concentrated, such as previous highs and lows or areas with visible inefficiency. When a clear reaction forms and a valid candle pattern confirms the shift in direction, the indicator generates a signal that represents the activity of Smart Money.
This tool does not respond to random volatility or noise. It waits for structure, liquidity and confirmation to align together before providing an entry. As a result, every signal has a logical base related to institutional order flow rather than ordinary price fluctuations. This approach allows traders to focus only on the movements that reflect true liquidity behavior.
🟣 Long Setup
A bullish setup takes place when the market moves downward and reaches a sell-side liquidity zone located below previous swing lows. In this area, price performs a Liquidity Sweep by moving under key levels to trigger stop losses and capture liquidity from trapped sellers.
This movement usually appears as a False Breakout because the market breaks below a level for a short moment and then quickly moves back inside the range.
Around this zone, a bullish Order Block or Fair Value Gap (FVG) often exists, showing where institutional demand is active.
When the indicator detects the presence of liquidity collection together with a valid bullish confirmation candle near an OB or FVG, it creates a Call signal.
This marks the moment when Smart Money is shifting from selling pressure to accumulation, and a strong bullish move often follows. For binary entries, the best opportunity usually comes immediately after the confirmation candle closes.
The reaction tends to happen quickly because the liquidity grab has completed and new institutional buying pressure is entering the market. This type of setup often provides a clean and precise entry with a high probability of success.
🟣 Short Setup
A bearish setup happens when the market rises and enters a buy-side liquidity area above previous highs. Here, the market performs a Liquidity Sweep to trigger stop losses placed above those highs and to absorb liquidity from trapped buyers.
This pattern forms what traders recognize as a False Breakout because the price only breaks the level temporarily before reversing in the opposite direction. A bearish Order Block or Fair Value Gap (FVG) often appears around this zone, showing where institutional selling interest exists.
Once the liquidity sweep completes and a bearish confirmation candle closes, the indicator produces a Put signal that reflects the shift from buying to selling pressure by Smart Money.
This moment often leads to a fast downward reaction as the market rebalances and fills the nearby inefficiency.
The most effective entry for binary trading is right after the confirmation candle closes, when the false breakout and liquidity collection are both completed. The price usually reacts sharply as the market transitions from liquidity hunting to a new directional move. This setup represents a structured view of how liquidity drives market cycles and how Smart Money creates precise reversals through controlled imbalance and reaction.
🔵 Settings
Time Frame : Defines the timeframe used for analysis. If left blank, the indicator automatically uses the chart’s current timeframe.
Swing Period : Determines how many candles are used to identify structural turning points such as swing highs and swing lows. Higher values increase accuracy but reduce the number of signals.
Signal Type : Specifies the type of signal generated by the indicator. The option All shows every signal, Main Signal displays only the primary one, and Alternative Signal produces a secondary signal that appears one candle after the main signal for additional confirmation.
Candle Pattern : Enables candle pattern logic for reversal confirmation. When active, the indicator issues a signal only when a valid candle formation confirms the market reaction.
Candle LookBack Check : Verifies that the last few candles move in the opposite direction of the signal to be generated. This condition acts as a confirmation filter, ensuring that the signal appears only after a clear counter-move in price.
Last Candle Direction : Considers the direction of the most recent candle in the analysis. It helps determine whether the final candle moves with or against the current trend.
Last Candle Shadow Ratio : Sets the ratio between the last candle’s wick and body to refine confirmation accuracy. Higher values require longer wicks, indicating stronger rejection and a more reliable reversal pattern.
🔵 Conclusion
Trading with Smart Money logic means understanding how liquidity moves through the market.
Each Liquidity Sweep, False Breakout, Fair Value Gap (FVG) and Order Block (OB) reflects the process of collecting and redistributing orders.
This indicator captures that sequence and turns it into precise, structured signals for binary entries. When liquidity is absorbed and a candle confirmation appears, the market reveals its true direction.
At that moment, traders can act with confidence, following institutional flow instead of reacting to random price moves.
Success with this system comes from patience, confirmation, and a clear reading of liquidity behavior, the core principles behind every Smart Money reversal.

Turtle Soup ICT Strategy [TradingFinder] FVG + CHoCH/CSD🔵 Introduction
The ICT Turtle Soup trading setup, designed in the ICT style, operates by hunting or sweeping liquidity zones to exploit false breakouts and failed breakouts in key liquidity Zones, such as recent highs, lows, or major support and resistance levels.
This setup identifies moments when the price breaches these liquidity zones, triggering stop orders placed (Stop Hunt) by other traders, and then quickly reverses direction. These movements are often associated with liquidity sweeps that create temporary market imbalances.
The reversal is typically confirmed by one of three structural shifts : a Market Structure Shift (MSS), a Change of Character (CHoCH), or a break of the Change in State of Delivery (CISD). Each of these structural shifts provides a reliable signal to interpret market intent and align trading decisions with the expected price movement. After the structural shift, the price frequently pullback to a Fair Value Gap (FVG), offering a precise entry point for trades.
By integrating key concepts such as liquidity, liquidity sweeps, stop order activation, structural shifts (MSS, CHoCH, CISD), and price imbalances, the ICT Turtle Soup setup enables traders to identify reversal points and key entry zones with high accuracy.
This strategy is highly versatile, making it applicable across markets such as forex, stocks, cryptocurrencies, and futures. It offers traders a robust and systematic approach to understanding price movements and optimizing their trading strategies
🟣 Bullish and Bearish Setups
Bullish Setup : The price first sweeps below a Sell-Side Liquidity (SSL) zone, then reverses upward after forming an MSS or CHoCH, and finally pulls back to an FVG, creating a buying opportunity.
Bearish Setup : The price first sweeps above a Buy-Side Liquidity (BSL) zone, then reverses downward after forming an MSS or CHoCH, and finally pulls back to an FVG, creating a selling opportunity.
🔵 How to Use
To effectively utilize the ICT Turtle Soup trading setup, begin by identifying key liquidity zones, such as recent highs, lows, or support and resistance levels, in higher timeframes.
Then, monitor lower timeframes for a Liquidity Sweep and confirmation of a Market Structure Shift (MSS) or Change of Character (CHoCH).
After the structural shift, the price typically pulls back to an FVG, offering an optimal trade entry point. Below, the bullish and bearish setups are explained in detail.
🟣 Bullish Turtle Soup Setup
Identify Sell-Side Liquidity (SSL) : In a higher timeframe (e.g., 1-hour or 4-hour), identify recent price lows or support levels that serve as SSL zones, typically the location of stop-loss orders for traders.
Observe a Liquidity Sweep : On a lower timeframe (e.g., 15-minute or 30-minute), the price must move below one of these liquidity zones and then reverse. This movement indicates a liquidity sweep.
Confirm Market Structure Shift : After the price reversal, look for a structural shift (MSS or CHoCH) indicated by the formation of a Higher Low (HL) and Higher High (HH).
Enter the Trade : Once the structural shift is confirmed, the price typically pulls back to an FVG. Enter a buy trade in this zone, set a stop-loss slightly below the recent low, and target Buy-Side Liquidity (BSL) in the higher timeframe for profit.
🟣 Bearish Turtle Soup Setup
Identify Buy-Side Liquidity (BSL) : In a higher timeframe, identify recent price highs or resistance levels that serve as BSL zones, typically the location of stop-loss orders for traders.
Observe a Liquidity Sweep : On a lower timeframe, the price must move above one of these liquidity zones and then reverse. This movement indicates a liquidity sweep.
Confirm Market Structure Shift : After the price reversal, look for a structural shift (MSS or CHoCH) indicated by the formation of a Lower High (LH) and Lower Low (LL).
Enter the Trade : Once the structural shift is confirmed, the price typically pulls back to an FVG. Enter a sell trade in this zone, set a stop-loss slightly above the recent high, and target Sell-Side Liquidity (SSL) in the higher timeframe for profit.
🔵 Settings
Higher TimeFrame Levels : This setting allows you to specify the higher timeframe (e.g., 1-hour, 4-hour, or daily) for identifying key liquidity zones.
Swing period : You can set the swing detection period.
Max Swing Back Method : It is in two modes "All" and "Custom". If it is in "All" mode, it will check all swings, and if it is in "Custom" mode, it will check the swings to the extent you determine.
Max Swing Back : You can set the number of swings that will go back for checking.
FVG Length : Default is 120 Bar.
MSS Length : Default is 80 Bar.
FVG Filter : This refines the number of identified FVG areas based on a specified algorithm to focus on higher quality signals and reduce noise.
Types of FVG filter s:
Very Aggressive Filter: Adds a condition where, for an upward FVG, the last candle's highest price must exceed the middle candle's highest price, and for a downward FVG, the last candle's lowest price must be lower than the middle candle's lowest price. This minimally filters out FVGs.
Aggressive Filter: Builds on the Very Aggressive mode by ensuring the middle candle is not too small, filtering out more FVGs.
Defensive Filter: Adds criteria regarding the size and structure of the middle candle, requiring it to have a substantial body and specific polarity conditions, filtering out a significant number of FVGs.
Very Defensive Filter: Further refines filtering by ensuring the first and third candles are not small-bodied doji candles, retaining only the highest quality signals.
In the indicator settings, you can customize the visibility of various elements, including MSS, FVG, and HTF Levels. Additionally, the color of each element can be adjusted to match your preferences. This feature allows traders to tailor the chart display to their specific needs, enhancing focus on the key data relevant to their strategy.
🔵 Conclusion
The ICT Turtle Soup trading setup is a powerful tool in the ICT style, enabling traders to exploit false breakouts in key liquidity zones. By combining concepts of liquidity, liquidity sweeps, market structure shifts (MSS and CHoCH), and pullbacks to FVG, this setup helps traders identify precise reversal points and execute trades with reduced risk and increased accuracy.
With applications across various markets, including forex, stocks, crypto, and futures, and its customizable indicator settings, the ICT Turtle Soup setup is ideal for both beginner and advanced traders. By accurately identifying liquidity zones in higher timeframes and confirming structure shifts in lower timeframes, this setup provides a reliable strategy for navigating volatile market conditions.
Ultimately, success with this setup requires consistent practice, precise market analysis, and proper risk management, empowering traders to make smarter decisions and achieve their trading goals.
