Simple Perps Calculator## Simple Perps Calculator (Long & Short)
A lightweight on-chart trade calculator that visualizes **entry, take-profit, and liquidation levels** with leverage-adjusted returns — designed for fast planning and clean charts.
This indicator automatically detects **long or short positions** based on your target price and adjusts calculations accordingly. All key levels are displayed as **colored horizontal price lines** with matching labels positioned near the price scale for easy reference.
---
### Features
- Entry, Take-Profit, and Liquidation price levels
- Automatic **long / short detection**
- Leverage slider up to **1000×**
- Leveraged **percent gain** calculation
- Color-coded horizontal price lines:
- 🟡 Entry
- 🟢 Take-Profit
- 🔴 Liquidation
- Adjustable label positioning (left or right of chart)
- Horizontal offset control to move labels out of the way
- Clean, minimal, non-intrusive design
---
### How to Use
1. Set your **Entry Price**
2. Set your **Target Price**
3. Adjust **Leverage**
4. Move labels using the **horizontal offset** slider if needed
If the target price is above entry, the script assumes a **long** position. If below, it assumes a **short** position and places the liquidation level above entry automatically.
---
### Notes
- Liquidation price uses a simplified isolated-margin model
- Intended for **planning and visualization only**
- Actual exchange liquidation prices may vary due to fees and maintenance margin requirements
In den Scripts nach "key levels" suchen

Opening Path Selector (EMA200 Context Tool)📝 Description
Opening Path Selector is a context-based indicator designed to help traders quickly identify which asset may offer the cleanest directional path at the market open.
This tool does not generate entry or exit signals.
Its purpose is to reduce decision fatigue during the first minutes of the session by ranking a small set of high-liquidity assets based on higher-timeframe EMA200 structure.
🔍 What this indicator evaluates
The dashboard compares a predefined group of major symbols and ranks them according to:
• Proximity to the nearest EMA200
• Relative position versus higher-timeframe EMA200 levels
• Directional context inferred from EMA structure
The result is a priority-based list that highlights which asset may present:
• Less immediate EMA resistance
• Clearer directional context
• Lower probability of early-session chop
📊 How to read the dashboard
• Priority – Ranking based on opening context
• Symbol – Evaluated instrument
• Nearest EMA200 – Distance and side relative to price
• Possible Path – Direction with less immediate EMA resistance
• Bias – Strength of the higher-timeframe context
Colored markers are used to provide fast visual identification of the highest-priority assets.
⚠️ Important notes
• This is a context and selection tool, NOT a trading system
• No buy/sell signals, alerts, TP, or SL logic are included
• Designed to be used alongside your own execution methodology
🔧 Compatibility
Due to Pine Script multi-symbol and multi-timeframe constraints, this public version is intentionally limited to a small set of symbols.
TradingView Pro / Premium or higher is recommended for consistent performance.
🔗 Complementary tools
This indicator can be complemented with Multi-Tool VWAP + EMAs (Multi-Timeframe) + Key Levels , which provides detailed visibility of multiple EMA levels, VWAP structure, and higher-timeframe reference zones directly on the chart.
While Opening Path Selector helps decide which asset to focus on at the open, the complementary tool can assist with in-chart context and confirmation once an asset has been selected.
Both tools are designed to serve different stages of the decision process and can be used independently.

Impulsive Trend Detector [dtAlgo]This advanced Pine Script indicator identifies and tracks impulsive price movements based on Break of Structure (BOS) and Change of Character (CHoCH) concepts from Smart Money trading methodology.
The indicator automatically detects pivot highs and lows, then monitors when price breaks these key levels to signal potential impulsive moves. BOS indicates continuation in the current trend direction, while CHoCH signals potential trend reversals. Each detected move is measured from the break point to the next opposing pivot, providing accurate percentage calculations that match TradingView's measuring tool.
Impulsive moves are categorized into four levels based on magnitude (Level 1: 5-10%, Level 2: 10-15%, Level 3: 15-20%, Level 4: 20%+), with color-coded visual labels and connecting lines displayed directly on the chart.
Comprehensive Session Analysis:
Track moves across 11 distinct trading sessions in Eastern Time: Pre-London/NY, London/NY overlap, NY (with Power Hour and End subdivisions), Sydney, Asia, Sake Time, Asia/London overlap, London, Weekend, and No Session periods.
Three Dynamic Tables provide:
Real-time statistics (bullish/bearish, BOS/CHoCH, levels)
Session breakdown with move counts and average percentages
Event log showing last 10 moves with date, day, session, direction, type, level, percentage, duration, and bar count
Perfect for Smart Money traders seeking data-driven insights into market structure behavior across global trading sessions.

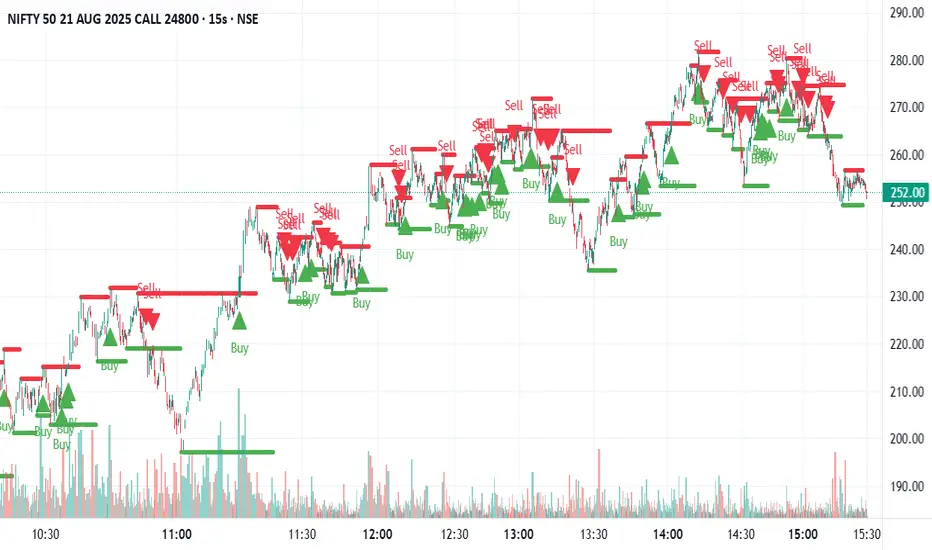
SB A / A++ ALERT ENGINE (Alerts Only)SB A / A++ Alert Engine
Session-Based Level Rejection Strategy (Automation-Ready)
Overview
The SB A / A++ Alert Engine is a rules-based TradingView indicator designed to identify high-probability institutional-style reversal trades using Stacey Burke–inspired concepts such as previous day levels, session structure, opening ranges, and round numbers.
This tool is alerts-only by design, making it ideal for:
TradingView alerts
Webhook automation
Telegram / Discord signal delivery
External trade execution systems
It does not repaint and evaluates signals on confirmed bar close only.
---
Core Trading Idea
Price frequently reacts at important reference levels during active trading sessions.
This script looks for rejection + confirmation at those levels and grades setups based on confluence and candle quality.
Only A-grade and A++-grade setups are alerted.
---
What the Script Detects
📌 Key Levels (Confluence Engine)
Previous Day High / Low
Initial Balance (Mon–Tue range, active Wed–Fri)
Session Opening Range (first hour of London / NY)
Round Numbers (configurable tick spacing)
Each level touched contributes to confluence — without double-counting the same zone.
---
🕒 Session Control
Signals are only allowed during:
London Session
New York Session
Includes:
Session resets
Max alerts per session
Cooldown between signals
---
🔎 Candle Confirmation
Valid signals require clear rejection behavior, such as:
Bullish / Bearish Engulfing candle
Strong Pin Bar (wick ≥ 2× body)
---
🧠 Trade Grades
A Trade
Valid session
ATR percentile filter passed
≥ 1 level of confluence
Directional rejection
A++ Trade
All A-Trade rules
Strong confirmation candle (engulf or pin)
≥ 2 independent confluence zones
Grades are displayed visually and included in alert payloads.
---
📊 Volatility Filter (ATR Percentile)
Instead of fixed ATR thresholds, the script uses an ATR percentile rank, ensuring trades only trigger when volatility is above normal for that market.
This adapts automatically across:
Forex
Indices
Futures
Crypto
---
Visual Output
▲ Green / Lime triangles → LONG (A / A++)
▼ Orange / Red triangles → SHORT (A / A++)
Color intensity reflects trade grade
Optional session shading (if enabled)
---
Alerts & Automation
All alerts are webhook-ready and structured for automation.
Each alert includes:
Symbol
Timeframe
Direction (LONG / SHORT)
Trade grade (A or A++)
Confluence count
Entry price (close of signal bar)
Designed to integrate with:
Telegram bots
Trade execution bridges
Risk management engines
---
What This Script Is (and Is Not)
✅ IS
A high-quality signal engine
Non-repainting
Automation-friendly
Institutional level-based logic
❌ IS NOT
A scalping indicator
A prediction tool
A “trade every candle” system
This tool favors patience, structure, and quality over frequency.
---
Recommended Usage
Timeframes: M5 – M15
Best markets: FX majors, indices, liquid crypto
Combine with your own execution, risk, and trade management rules
---
⚠️ Disclaimer
This script is for educational and informational purposes only. It does not constitute financial advice. Always test on demo or paper trading before using live capital.

Smart Money Concept Change of Character Break of StructureSMC Structure
Visualizes Change of Character (CHoCH) and Break of Structure (BoS) - two fundamental Smart Money Concepts for identifying trend reversals and continuations.
This is the 1st version of an implementation of this concept.
It is NOT supposed to be used as a signal but a confirmation. Best use during NYSE hours.
Full Description
Overview
This indicator automatically detects and displays two core Smart Money Concepts (SMC) directly on your chart:
CHoCH (Change of Character) – The first structural break against the prevailing trend, signaling a potential reversal
BoS (Break of Structure) – A structural break in the direction of the current trend, confirming continuation
These concepts are essential building blocks of SMC trading methodology, helping traders identify where institutional players may be entering or exiting positions.
How It Works
The indicator uses pivot-based swing detection to identify significant highs and lows. When price breaks through these levels, it classifies the move as either a CHoCH or BoS based on the current trend context.
CHoCH (Change of Character)
Occurs when price breaks structure AGAINST the current trend
First warning sign that the trend may be reversing
Displayed as a solid horizontal line with "CHoCH" label
Green = Bullish reversal | Red = Bearish reversal
BoS (Break of Structure)
Occurs when price breaks structure IN THE DIRECTION of the current trend
Confirms that the existing trend remains intact
Displayed as a dashed horizontal line with "BoS" label
Teal = Bullish continuation | Maroon = Bearish continuation
Visual Example
Uptrend with BoS (continuation):
HH ◄── BoS (trend continues)
/
HL
/
HH
/
HL
Uptrend → CHoCH → Downtrend (reversal):
HH
/ \
HL \
LL ◄── CHoCH (trend reversal!)
Settings
Pivot Settings
Pivot Lookback: Number of bars used to identify swing highs/lows (default: 5). Higher values = fewer but more significant structure points.
Display Options
Show CHoCH: Toggle CHoCH visualization
Show BoS: Toggle BoS visualization
Show Swing Points: Display SH/SL labels at detected pivots
Extend Lines to Right: Extend structure lines into future bars
Show Info Table: Display current trend and last swing levels
Show Trend Background: Color the chart background based on trend direction
Colors
Fully customizable colors for all elements
How to Use
Identify the trend: Look at the sequence of CHoCH and BoS signals to understand market structure
Watch for CHoCH: A CHoCH signals potential reversal – wait for confirmation before trading against the previous trend
Trade with BoS: BoS confirms trend continuation – look for entries on pullbacks in the direction of the trend
Combine with other SMC concepts: Works great alongside Order Blocks, Fair Value Gaps, and liquidity concepts
Tips
Use higher pivot lookback values on higher timeframes for cleaner signals
A CHoCH doesn't guarantee reversal – it's the first warning sign, not confirmation
Multiple BoS signals in a row indicate a strong, healthy trend
Look for CHoCH occurring at key levels (support/resistance, order blocks) for higher probability setups
Feedback Welcome!
This is an open-source indicator and I'd love to hear your thoughts!
Please comment below if you have:
Feature requests or ideas for improvements
Bug reports or issues
Suggestions for additional SMC concepts to add
Your feedback helps make this indicator better for everyone. Happy trading! 🚀

First presented FVG (w/stats) w/statistical hourly ranges & biasOverview
This indicator identifies the first Fair Value Gap (FVG) that forms during each hourly session and provides comprehensive statistical analysis based on 12 years of historical NASDAQ (NQ) data. It combines price action analysis with probability-based statistics to help traders make informed decisions.
⚠️ IMPORTANT - Compatibility
Market: This indicator is designed exclusively for NASDAQ futures (NQ/MNQ)
Timeframe: Statistical data is based on FVGs formed on the 5-minute timeframe
FVG Detection: Works on any timeframe, but use 5-minute for accuracy matching the statistical analysis
All hardcoded statistics are derived from 12 years of NQ historical data
What It Does
1. FVG Detection & Visualization
Automatically detects the first FVG (bullish or bearish) that forms each hour
Draws colored boxes around FVGs:
Blue boxes = Bullish FVG (gap up)
Red boxes = Bearish FVG (gap down)
FVG boxes extend to the end of the hour
Optional midpoint lines show the center of each FVG
Uses volume imbalance logic (outside prints) to refine FVG boundaries
2. Hourly Reference Lines
Vertical Delimiter: Marks the start of each hour
Hourly Open Line: Shows where the current hour opened
Expected Range Lines: Projects the anticipated high/low based on historical data
Choose between Mean (average) or Median (middle value) statistics
Upper range line (teal/green)
Lower range line (red)
All lines span exactly one hour from the moment it opens
Optional labels show price values at line ends
3. Real-Time Statistics Table
The table displays live data for the current hour only:
Hour: Current hour in 12-hour format (AM/PM)
FVG Status: Shows if a Bull FVG, Bear FVG, or no FVG has formed yet
Green background = Bullish FVG detected
Red background = Bearish FVG detected
1st 15min: Direction of the first 15 minutes (Bullish/Bearish/Neutral/Pending)
Continuation %: Historical probability that the hour continues in the first 15-minute direction
Color-coded: Green for bullish, red for bearish
Avg Range %: Expected percentage range for the current hour (based on 12-year mean)
FVG Effect %: Historical probability that FVG direction predicts hourly close direction
Shows BISI→Bull % for bullish FVGs
Shows SIBI→Bear % for bearish FVGs
Blank if no FVG has formed yet
Time Left: Countdown timer showing MM:SS remaining in the hour (updates in real-time)
Hourly Bias: Historical directional tendency (bullish % or bearish %)
H Open: Current hour's opening price
Exp Range: Projected price range (Low - High) based on historical average
Customization Options
Detection Settings:
Lower Timeframe Selection (15S, 1min, 5min) - controls FVG detection granularity
Display Settings:
FVG box colors (bullish/bearish)
Midpoint lines (show/hide, color, style)
Table Settings:
Position (9 locations: corners, edges, center)
Text size (Tiny, Small, Normal, Large)
Hourly Lines:
Toggle each line type on/off
Hour delimiter (color, width)
Open line (color, width, style)
Range lines (color, width, style)
Choose Mean or Median statistics for range calculation
Show/hide labels with customizable text size
How to Use
Apply to NQ futures chart (NQ1! or MNQ1!)
Set chart to 5-minute timeframe for optimal FVG detection matching the statistical data
Watch for the first FVG to form each hour
Reference the table for probability-based decision support:
High continuation % = strong directional bias
FVG Effect % shows reliability of the FVG signal
Time Left helps manage entries/exits within the hour
Use range lines as potential targets or reversal zones
Statistical Foundation
All statistics are derived from:
12 years of NASDAQ (NQ) historical data
Hourly analysis of FVG formation patterns
First 15-minute directional analysis
Mean and Median calculations for range expectations
Data encompasses 2,400+ samples per hour
Best Practices
✅ Use on NQ/MNQ futures only
✅ Best on 5-minute charts (matches statistical data)
✅ Combine FVG signals with continuation probabilities
✅ Use range lines as potential profit targets
✅ Watch the countdown timer for hour-end setups
❌ Do not use on other markets (statistics won't apply)
❌ Avoid using during low-liquidity hours (5PM ET has minimal data)
Technical Notes
Timezone: America/New_York (EST/EDT)
Weekend filtering: Automatically hides data during market closure
Updates in real-time on live bars
Maximum 500 boxes/lines for performance
FVG detection includes volume imbalance (body gap) refinement
Credits
Statistical analysis based on 12 years of NASDAQ historical data. FVG detection methodology follows ICT concepts with volume imbalance refinement.
Disclaimer: This indicator provides statistical analysis based on historical data. Past performance does not guarantee future results. Always use proper risk management.
Would you like me to adjust any section or add/remove anything?6-9 Session & Levels - Customizable Range Analysis Indicator
Description:
This indicator provides comprehensive session-based range analysis designed for intraday traders. It calculates and displays key levels based on a customizable session period (default 6:00-9:00 AM ET).
Core Features:
Sespastedthis is a summary for another indicator- i was hoping for something more like this in terms of content etc22:23Architected comprehensive indicator summary matching professional documentation style.The user wants me to rewrite the summary for their FVG indicator in a similar style to the example provided. The example is more structured, detailed, and professional. Let me create a comprehensive summary that follows that format:
Clear title
Description/Overview
Core Features (broken down into sections)
Input Settings Explained (detailed breakdown of all customization options)
How It Works section
Use Case
Note/Disclaimer
Let me make it thorough and match the style while being accurate to their indicator's functionality.Here's a detailed summary in that format:
Every Hour 1st FVG with Statistical Analysis - NASDAQ Hourly Trading Intelligence
Description:
This indicator identifies the first Fair Value Gap (FVG) that forms during each hourly session and provides comprehensive probability-based statistical analysis derived from 12 years of NASDAQ (NQ) historical data. It combines real-time FVG detection with hardcoded statistical probabilities to help intraday traders make informed decisions based on historical patterns and hourly price action dynamics.
IMPORTANT: This indicator is specifically calibrated for NASDAQ futures (NQ/MNQ) only. All statistical data is derived from 12 years of NQ historical analysis with FVGs detected on the 5-minute timeframe. Using this indicator on other markets will produce invalid statistical results.
Core Features:
FVG Detection & Visualization
Automatically detects and displays the first Fair Value Gap (bullish or bearish) that forms within each hourly session
Color-coded boxes mark FVG zones: Blue for bullish FVGs (gap up), Red for bearish FVGs (gap down)
FVG boxes extend precisely to the end of the hour boundary
Optional midpoint lines show the center point of each FVG
Uses volume imbalance logic (outside prints) to refine FVG boundaries beyond simple wick-to-wick gaps
Supports both chart timeframe detection and lower timeframe detection via request.security_lower_tf
Hourly Reference Lines
Vertical Hour Delimiter: Marks the exact start of each new hour with an extendable vertical line
Hourly Open Line: Displays the opening price of the current hour
Expected Range Lines: Projects anticipated high and low levels based on 12 years of statistical data
Choose between Mean (average) or Median (middle value) calculations
Upper range line shows expected high
Lower range line shows expected low
All lines span exactly one hour from open to close
Optional labels display exact price values at the end of each line
Real-Time Statistics Table
Displays comprehensive live data for the current hour only:
Hour: Current hour in 12-hour format (e.g., "9AM", "2PM")
FVG Status: Shows detection state with color coding
"None Yet" (white background) - No FVG detected
"Bull FVG" (green background) - Bullish FVG identified
"Bear FVG" (red background) - Bearish FVG identified
1st 15min: Direction of first 15 minutes (Bullish/Bearish/Neutral/Pending)
Continuation %: Historical probability that the hour closes in the direction of the first 15 minutes
Green background with up arrow (↑) for bullish continuation probability
Red background with down arrow (↓) for bearish continuation probability
Avg Range %: Expected percentage range for the current hour based on 12-year mean
FVG Effect %: Historical effectiveness of FVG directional prediction
Shows "BISI→Bull %" for bullish FVGs (gap up predicting bullish hourly close)
Shows "SIBI→Bear %" for bearish FVGs (gap down predicting bearish hourly close)
Displays blank if no FVG has formed yet
Time Left: Real-time countdown timer showing minutes and seconds remaining in the hour (MM:SS format)
Hourly Bias: Historical directional tendency showing bullish or bearish percentage bias
H Open: Current hour's opening price
Exp Range: Projected price range showing "Low - High" based on selected statistic (mean or median)
Input Settings Explained:
Detection Settings
Lower Timeframe: Select the base timeframe for FVG detection
Options: 15S (15 seconds), 1 (1 minute), 5 (5 minutes)
Recommendation: Use 5-minute to match the statistical data sample
The indicator uses this timeframe to scan for FVG patterns even when viewing higher timeframes
Display Settings
Bullish FVG Color: Set the color and transparency for bullish (upward) FVG boxes
Bearish FVG Color: Set the color and transparency for bearish (downward) FVG boxes
Show Midpoint Lines: Toggle horizontal lines at the center of each FVG box
Midpoint Line Color: Customize the midpoint line color
Midpoint Line Style: Choose between Solid, Dotted, or Dashed line styles
Table Settings
Table Position: Choose from 9 locations:
Top: Left, Center, Right
Middle: Left, Center, Right
Bottom: Left, Center, Right
Table Text Size: Select from Tiny, Small, Normal, or Large for readability on different screen sizes
Hourly Lines Settings
Show Hourly Lines: Master toggle for all hourly reference lines
Show Hour Delimiter: Toggle the vertical line marking each hour's start
Delimiter Color: Customize color and transparency
Delimiter Width: Set line thickness (1-5)
Show Hourly Open: Toggle the horizontal line at the hour's opening price
Open Line Color: Customize color
Open Line Width: Set thickness (1-5)
Open Line Style: Choose Solid, Dashed, or Dotted
Show Range Lines: Toggle the expected high/low projection lines
Range Statistic: Choose "Mean" (12-year average) or "Median" (12-year middle value)
Range High Color: Customize upper range line color and transparency
Range Low Color: Customize lower range line color and transparency
Range Line Width: Set thickness (1-5)
Range Line Style: Choose Solid, Dashed, or Dotted
Show Line Labels: Toggle price labels at the end of all horizontal lines
Label Text Size: Choose Tiny, Small, or Normal
How It Works:
FVG Detection Logic:
The indicator scans price action on the selected lower timeframe (default: 1-minute) looking for Fair Value Gaps using a 3-candle pattern:
Bullish FVG: Formed when candle 's high is below candle 's low, creating an upward gap
Bearish FVG: Formed when candle 's low is above candle 's high, creating a downward gap
The detection is refined using volume imbalance logic by checking for body gaps (outside prints) on both sides of the middle candle. This narrows the FVG zone to areas where bodies don't touch, indicating stronger imbalances.
Only the first FVG that forms during each hour is displayed. If a bullish FVG forms first, it takes priority. The FVG box is drawn from the formation time through to the end of the hour.
Statistical Analysis:
All probability statistics are hardcoded from 12 years (2,400+ samples per hour) of NASDAQ futures analysis:
First 15-Minute Direction: At 15 minutes into each hour, the indicator determines if price closed above, below, or equal to the hour's opening price
Continuation Probability: Historical analysis shows the likelihood that the hour closes in the same direction as the first 15 minutes
Example: If 9AM's first 15 minutes are bullish, there's a 60.1% chance the entire 9AM hour closes bullish (lowest continuation hour)
4PM shows the highest continuation at 86.1% for bullish first 15 minutes
FVG Effectiveness: Tracks how often the first FVG's direction correctly predicts the hourly close direction
BISI (Bullish Imbalance/Sell-side Inefficiency) → Bullish close probability
SIBI (Bearish Imbalance/Buy-side Inefficiency) → Bearish close probability
Range Expectations: Mean and median values represent typical price movement percentage for each hour
9AM and 10AM show the largest ranges (~0.6%)
5PM shows minimal range (~0.06%) due to low liquidity
Hourly Reference Lines:
When each new hour begins:
Vertical delimiter marks the hour's start
Hourly open line plots at the first bar's opening price
Range projection lines calculate expected high/low:
Upper Range = Hourly Open + (Range% / 100 × Hourly Open)
Lower Range = Hourly Open - (Range% / 100 × Hourly Open)
Lines extend exactly to the hour's end time
Labels appear at line endpoints showing exact prices
Real-Time Updates:
FVG Status: Updates immediately when the first FVG forms
First 15min Direction: Locked in at the 15-minute mark
Countdown Timer: Uses timenow to update every second
Table Statistics: Refresh on every bar close
Timezone Handling:
All times are in America/New_York (Eastern Time)
Automatically filters weekend periods (Saturday and Sunday before 6PM)
Hour detection accounts for daylight saving time changes
Use Cases:
Intraday Trading Strategy Development:
FVG Entry Signals: Use the first hourly FVG as a directional bias
Bullish FVG + High continuation % = Strong long setup
Bearish FVG + High continuation % = Strong short setup
First 15-Minute Breakout: Combine first 15-min direction with continuation probabilities
Wait for first 15 minutes to complete
If continuation % is above 70%, trade in that direction
Example: 4PM bullish first 15 min = 86.1% chance hour closes bullish
Range Targeting: Use expected high/low lines as profit targets or reversal zones
Price approaching mean high = potential resistance
Price approaching mean low = potential support
Compare mean vs median for different risk tolerance (median is more conservative)
Hour Selection: Focus trading on hours with:
High FVG effectiveness (11AM: 81.5% BISI→Bull)
High continuation rates (4PM: 86.1% bull continuation)
Avoid low-continuation hours like 9AM (60.1%)
Time Management: Use the countdown timer to:
Enter early in the hour when FVG forms
Exit before hour-end if no follow-through
Avoid late-hour entries with <15 minutes remaining
Statistical Edge Identification:
Compare current hour's FVG against historical effectiveness
Identify when first 15-min direction contradicts FVG direction (conflict = caution)
Use hourly bias to confirm or contradict FVG signals
Monitor if price stays within expected range or breaks out (outlier moves)
Risk Management:
Expected range lines provide logical stop-loss placement
FVG Effect % helps size positions (higher % = larger position)
Time Left countdown aids in time-based stop management
Avoid trading hours with neutral bias or low continuation rates
Statistical Foundation:
All embedded statistics are derived from:
12 years of NASDAQ futures (NQ) continuous contract data
5-minute timeframe FVG detection methodology
24 hours per day analysis (excluding weekends)
2,400+ samples per hour for robust statistical validity
America/New_York timezone for session alignment
Data includes:
Hourly range analysis (mean, median, standard deviation)
First 15-minute directional analysis
FVG formation frequency and effectiveness
Continuation probability matrices
Bullish/bearish bias percentages
Best Practices:
✅ Do:
Use exclusively on NASDAQ futures (NQ1! or MNQ1!)
Apply on 5-minute charts for optimal FVG detection matching statistical samples
Wait for first 15 minutes to complete before acting on continuation probabilities
Combine FVG signals with continuation % and FVG Effect % for confluence
Use expected range lines as initial profit targets
Monitor the countdown timer for time-based trade management
Focus on hours with high statistical edges (4PM, 11AM, 10AM)
❌ Don't:
Use on other markets (ES, RTY, YM, stocks, forex, crypto) - statistics will be invalid
Rely solely on FVG without confirming with continuation probabilities
Trade during low-liquidity hours (5PM shows only 0.06% average range)
Ignore the first 15-minute direction when it conflicts with FVG direction
Apply to timeframes significantly different from 5-minute for FVG detection
Use median range expectations aggressively (they're conservative)
Technical Implementation Notes:
Timezone: Fixed to America/New_York with automatic DST adjustment
Weekend Filtering: Automatically hides data Saturday and Sunday before 6PM ET
Performance: Maximum 500 boxes and 500 lines for optimal chart rendering
Update Frequency: Table updates on every bar close; timer updates every second using timenow
FVG Priority: Bullish FVGs take precedence when both form simultaneously
Lower Timeframe Detection: Uses request.security_lower_tf for accurate sub-chart-timeframe FVG detection
Precision: All price labels use format.mintick for appropriate decimal precision
Big thanks to @Trades-Dont-Lie for the FPFVG code in his excellent indicator that I've used here

OFM Key LevelsDaily and Weekly Levels Only
Daily Levels Calculated from RTH Sessions
Weekly Levels Calculated ETH

SYMBOL NOTES - UNCORRELATED TRADING GROUPSWrite symbol-specific notes that only appear on that chart. Organized into 6 uncorrelated groups for safe multi-pair trading.
📝 SYMBOL NOTES - UNCORRELATED TRADING GROUPS
This indicator solves two problems every serious trader faces:
1. Keeping Track of Your Analysis
Write notes for each trading pair and they'll only appear when you view that specific chart. No more forgetting your key levels, trade ideas, or analysis!
2. Avoiding Correlated Risk
The symbols are organized into 6 groups where ALL pairs within each group are completely UNCORRELATED. Trade any combination from the same group without worrying about double exposure.
━━━━━━━━━━━━━━━━━━━━━━━━━━━━━━━━━━━━━━━━━━━━━
🎯 THE PROBLEM THIS SOLVES
Have you ever:
- Opened XAUUSD and EURUSD at the same time, then Fed news hit and BOTH positions went against you?
- Traded GBPUSD and GBPJPY together, then BOE announcement stopped out both trades?
- Forgotten what levels you were watching on a pair?
This indicator helps you avoid these costly mistakes!
━━━━━━━━━━━━━━━━━━━━━━━━━━━━━━━━━━━━━━━━━━━━━
📁 THE 6 UNCORRELATED GROUPS
Each group contains pairs that share NO common currency:
```
GRUP 1: XAUUSD • EURGBP • NZDJPY • AUDCHF • NATGAS
GRUP 2: EURUSD • GBPJPY • AUDNZD • CADCHF
GRUP 3: GBPUSD • EURJPY • AUDCAD • NZDCHF
GRUP 4: USDJPY • EURCHF • GBPAUD • NZDCAD
GRUP 5: USDCAD • EURAUD • GBPCHF
GRUP 6: NAS100 • DAX40 • UK100 • JPN225
```
**Example - GRUP 1:**
- XAUUSD → Uses USD + Gold
- EURGBP → Uses EUR + GBP
- NZDJPY → Uses NZD + JPY
- AUDCHF → Uses AUD + CHF
- NATGAS → Commodity (independent)
= 7 different currencies, ZERO overlap!
━━━━━━━━━━━━━━━━━━━━━━━━━━━━━━━━━━━━━━━━━━━━━
**✅ HOW TO USE**
1. Add indicator to any chart
2. Open Settings (gear icon ⚙️)
3. Find your symbol's group and input field
4. Write your note (support levels, trade ideas, etc.)
5. Switch charts - your note appears only on that symbol!
━━━━━━━━━━━━━━━━━━━━━━━━━━━━━━━━━━━━━━━━━━━━━
⚙️ SETTINGS
- Note Position: Choose where the note box appears (6 positions)
- Text Size: Tiny, Small, Normal, or Large
- Show Group Name: Display which correlation group
- Show Symbol Name: Display current symbol
- Colors: Customize background, text, group label, and border colors
━━━━━━━━━━━━━━━━━━━━━━━━━━━━━━━━━━━━━━━━━━━━━
💡 TRADING STRATEGY TIPS
Safe Multi-Pair Trading:
1. Pick ONE group for the day
2. Look for setups on ANY symbol in that group
3. Open positions freely - they won't correlate!
4. Even if major news hits, only ONE position is affected
━━━━━━━━━━━━━━━━━━━━━━━━━━━━━━━━━━━━━━━━━━━━━
🔧 COMPATIBLE WITH
- All major forex brokers
- Prop firms (FTMO, Alpha Capital, etc.)
- Works on any timeframe
- Futures symbols supported (MGC, M6E, etc.)
━━━━━━━━━━━━━━━━━━━━━━━━━━━━━━━━━━━━━━━━━━━━━

Etwas31 Precision zones and trendTitle: Etwas31 Precision zones and trend
Overview: Get a complete market overview at a single glance. This script combines a comprehensive trend/volatility dashboard with automated, high-precision supply and demand zones. It filters out noise and highlights key market structures to improve your trading accuracy.
Key Features:
1. 📊 Advanced MTF Dashboard (5m - 1W)
Trend Monitor: Uses EMA 20 & 50 alignment to accurately detect Bullish, Bearish, or Neutral (Choppy) markets. No more guessing the trend.
Volatility Scanner: Utilizing ATR logic, it signals whether the market is active (High ⚡) or dormant (Low 💤) for each timeframe.
2. 🎯 Precision Support & Resistance Zones
Real Structure: Unlike simple lines, zones are drawn based on candle wicks (High to Body / Low to Body) to reflect the actual "thickness" of market interest.
Visual Hierarchy:
Weak Zones (15m, 30m): Displayed as Hollow/Dashed boxes. Ideal for scalping or short-term targets.
Strong Zones (1H, 4H, 1D, 1W): Displayed as Solid/Filled boxes. These are key levels for reversals and major trend continuation.
Auto-Extension: Zones automatically extend to the current price action for easy tracking.
3. ⚙️ Customizable & Clean
Fully customizable colors and visibility settings.
Optimized to prevent chart clutter while providing maximum information.
How to Use:
Use the Dashboard to align your trades with the higher timeframe trend (e.g., trade with the 4H trend).
Wait for Volatility (⚡) to confirm momentum.
Enter trades when price reacts at Solid Zones (Strong S/R) or use Hollow Zones for intraday scalp targets.

VWAP CATS background flipped 4.0VWAP CATS Background Flipped 4.0 is a sophisticated Pine Script v5 indicator for TradingView that combines a configurable moving average (MA) with dynamic Gann Square of 9 levels to create a multi-layered background shading system for price action analysis. It visualizes support/resistance zones around a central MA (often VWAP or RVWAP) using incremental offsets (either % or absolute points), generating symmetrical bands that resemble a "CATS" (Concentric Adaptive Tiered System) — hence the name.The background is "flipped" in the sense that shading intensity and structure emphasize higher-tier zones, and labels are placed to the right of the chart for future projection.Key FeaturesFeature
Description
Multi-MA Engine
Supports 20+ MA types: EMA, DEMA, TEMA, SMA, VWAP, RVWAP, HMA, ALMA, custom volume blends (CVB1–4)
RVWAP Mode
Rolling VWAP with adaptive or fixed time window (days/hours/minutes)
Gann Square of 9 Logic
Generates 80+ symmetric levels (0.25x to 17x increment) above/below the MA
Dual Increment Mode
Choose Percent or Points for spacing
Background Fills
Tiered transparency fills between Gann levels (darker = stronger zones)
Visual MA Offset
Shift MA line left/right without breaking fill alignment
Smart Labels
Projected labels on last bar: "FV", "normal", "high", "3/4" at key levels
Performance Optimized
Hidden plots + label cleanup to prevent lag
Primary Use Cases
1. Institutional VWAP Anchoring
Use RVWAP (1-day fixed) as maRaw
Set Increment = 0.5 points or 0.05%
Watch price interaction with "normal" (2x), "high" (4x), "3/4" (6x) zones
Ideal for intraday scalping on indices (ES, NQ) or forex
2. Swing Trading with Gann Projections
Use 400-period SMA/EMA on daily chart
Increment in Percent mode (~1.22%)
Identify confluence when price rejects at 2x, 4x, or 6x bands
Labels project future targets to the right
3. Volume-Weighted Mean Reversion
Select CVB1–CVB4 for heavy volume smoothing
Use Points mode for stocks with stable tick sizes (e.g. $0.50 increments)
Trade mean reversion between ±1x and ±2x bands
4. Risk Management & Stop Placement
Place stops beyond 2x or 4x bands
Take profits at next major tier (e.g. 4x → 6x)
Pro Tips
Enable "Use Fixed Time Period" for RVWAP to avoid session reset issues
Increase i_label_offset on lower timeframes to avoid overlap
Combine with volume profile or order flow for confluence
The "FV" label marks the Fair Value MA — core anchor
Summary"VWAP CATS Background Flipped 4.0" turns any moving average into a dynamic Gann-based pricing grid with intelligent background shading and forward-projected labels — perfect for institutional-style mean reversion, swing targeting, and risk-defined trading."

Fibo RSIThis is a customized Relative Strength Index (RSI) indicator designed to replicate TradingView’s default RSI while adding additional reference levels for deeper market analysis.
🔹 Features:
RSI length set to 8 by default (user adjustable).
Calculates RSI using the standard ta.rsi() function.
Plots the RSI line in a clean, separate panel.
Adds 7 key levels for analysis: 0, 20, 30, 50, 70, 80, 100.
Levels are drawn as thin, solid straight lines for a cleaner look (instead of default dashed).
🔹 Use cases:
Identify momentum shifts with enhanced precision.
Use intermediate levels (20, 30, 50, 70, 80) as potential support/resistance zones.
Ideal for traders who want a Fibonacci-like structure in RSI analysis.

Ranges by TraderHaroThis indicator highlights a custom price range for a selected date/time period on your chart. It draws key levels (0.00, 0.25, 0.50, 0.75, 1.00) within the range, visually marking the Premium Zone (upper range) and Discount Zone (lower range).
Features:
- Define a specific date/time range for the analysis.
- Optional fill between top and bottom levels with customizable color and transparency.
- Shows mid-levels (0.25, 0.50, 0.75) for additional guidance.
- Lines and fill can be extended to the right side of the chart.
- Labels for levels can be displayed or hidden.
Use Case:
Quickly identify where price is trading relative to a defined range, visualize potential zones of premium (resistance) and discount (support), and make better-informed trading decisions.

PDH/PDL (prev RTH) + Current ETH High/LowDescription:
This indicator automatically plots the key levels of PDH/PDL (Previous Day High/Low from regular trading hours – RTH) and ETH High/Low (Extended Hours: pre-market + after-hours) in real time.
• PDH/PDL: calculated at the close of RTH (09:30–16:00 NYSE) and anchored until the next day.
• ETH High/Low: updated live during extended hours (04:00–09:29 and 16:00–20:00 NYSE) and “frozen” at the RTH open for reference during the regular session.
• Customization options: colors, line styles (solid/dashed/dotted), thickness, labels, and the ability to extend lines to the right.
• Levels can also be displayed directly on the price scale.
This script is designed for traders who want a quick visualization of the most relevant levels from the previous day and extended hours, making it easier to identify supports, resistances, and potential reaction zones in price action.
By: Miguel Arenas

Smart Money SignalsSmart Money Signals – Market Flow & Structure Visualizer
Overview
Smart Money Signals is a precision trading tool designed for traders who want to see market structure and momentum flow in real time. By detecting pivots, momentum imbalances, and dynamic support/resistance levels, the indicator transforms raw price action into a clear visual narrative of where capital is entering and exiting the market.
Instead of lagging averages or cluttered signals, Smart Money Signals highlights the moments that matter most—where bullish and bearish flows are confirmed, where support or resistance breaks, and where momentum zones show the true battleground between buyers and sellers. Its adaptive design makes it equally effective for scalpers seeking sharp entries, swing traders tracking reversals, and longer-term traders looking for confirmation of bias.
How It Works
The engine behind Smart Money Signals relies on swing detection and a configurable sensitivity filter. By monitoring directional momentum across recent bars, the system identifies bullish pivots (where downside exhaustion flips into strength) and bearish pivots (where upward thrust collapses into weakness).
When price confirms a pivot, the indicator draws flow lines to mark the breakout and labels them as either continuation or reversal events, depending on existing market bias. Momentum zones are automatically plotted, highlighting the critical areas where buyers defended price or sellers pressed it lower.
Dynamic support and resistance levels extend forward in time, updating live as price develops. These zones change color when broken, visually signaling whether structure has held or failed. Gradient background shading further emphasizes moments of extreme momentum, such as overbought or oversold surges, so that traders instantly see when market pressure intensifies.
Signals and Market Flows
Smart Money Signals provides visual cues that are both intuitive and actionable:
📈 Bullish Flow Signals appear when price breaks above a confirmed pivot, signaling continuation or reversal into strength.
📉 Bearish Flow Signals appear when price breaks below a confirmed pivot, indicating continuation or reversal into weakness.
Momentum Zones highlight the defended areas between pivots, giving traders a visual map of where structure is strongest.
Dynamic Support & Resistance lines extend across the chart, shifting from defense to failure when broken, ensuring that the most relevant levels are always visible.
Break Signals mark the exact bar where key levels give way, confirming structural violations in real time.
By filtering out noise and focusing on meaningful flow events, the system helps traders avoid overreaction and focus only on high-probability structural shifts.
Strategy Integration
Smart Money Signals is versatile across trading styles:
Trend Continuation : Enter in the direction of flow signals, using dynamic zones as both confirmation and stop-loss placement.
Reversal Trading : Watch for pivots tagged as reversal points, where market bias flips and new structure is created.
Momentum Zone Entries : Use the automatically drawn zones to identify low-risk entries on pullbacks or retests.
Bias Alignment : The integrated dashboard reveals the current market bias—bullish, bearish, or neutral—helping traders stay aligned with the dominant flow.
Stop-losses can be positioned beyond the dynamic zone on the opposite side, while take-profits may be guided by the width of zones or momentum-driven extensions. On higher timeframes, the indicator provides context for macro structure, while lower timeframes allow for tactical entry refinement.
Advanced Techniques
Traders seeking deeper precision can combine Smart Money Signals with volume or order flow tools to validate pivots and zone defenses. Monitoring the sequence of bullish and bearish flows helps identify trend maturity, while analyzing the success rate of pivots in the analytics panel builds a data-driven approach to confidence in signals.
Adjusting swing period and sensitivity allows the indicator to adapt to different market conditions, from volatile crypto pairs to steady forex majors. The flexible visual themes—Cyber, Ocean, Sunset, Matrix—ensure readability across setups, while gradient shading keeps the chart intuitive even under fast-moving conditions.
Why Use Smart Money Signals
Markets are driven by liquidity, momentum, and structure. Smart Money Signals uncovers these forces by translating price action into a clear visual map of flow. It shows:
Where structure was built.
Where it was defended.
Where it was broken.
And where momentum is likely to carry next.
By combining flow detection, dynamic zones, and a live analytics dashboard, the indicator provides traders with a complete framework for reading price action in real time.
Whether you trade crypto, forex, or indices, Smart Money Signals adapts seamlessly to any asset class, giving you clarity, precision, and confidence to execute without second-guessing.

Swing Support and Resistance [Vijay]Swing-based support & resistance with breakout buy/sell signals and alerts.
Full Description:
The Swing Support and Resistance indicator is a simple yet effective tool to identify swing-based support and resistance levels using pivot points.
Pivot Length: Defines how many bars on each side are used to confirm a swing high (resistance) or swing low (support).
Support & Resistance: Plots the most recent pivot levels as visual markers (circles) on the chart.
Buy & Sell Signals:
A Buy Signal is triggered when price crosses above the last resistance.
A Sell Signal is triggered when price crosses below the last support.
Visual Cues: Arrows are plotted directly on the chart for easy signal recognition.
Alerts: Built-in alert conditions allow you to set TradingView alerts for breakout signals.
This script is useful for traders who rely on price action, breakout trading, and swing structure analysis. It helps quickly spot where price is breaking key levels and provides instant alerts for trade opportunities.
Piman2077: Previous Day Volume Profile levelsPrevious Day Volume Profile Indicator
Description:
Previous Day Volume Profile Indicator plots the previous trading session’s Volume Profile key levels directly on your chart, providing clear reference points for intraday trading. This indicator calculates the Value Area High (VAH), Value Area Low (VAL), and Point of Control (POC) from the prior session and projects them across the current trading day, helping traders identify potential support, resistance, and high-volume zones.
Features:
Calculates previous day VAH, VAL, and POC based on a user-defined session (default 09:30–16:00).
Uses Volume Profile bins for precise distribution calculation.
Fully customizable line colors for VAH, VAL, and POC.
Lines extend across the current session for easy intraday reference.
Works on any timeframe, optimized for 1-minute charts for precision.
Optional toggles to show/hide VAH, VAL, and POC individually.
Inputs:
Session Time: Define the trading session for which the volume profile is calculated.
Profile Bins: Number of price intervals used to divide the session range.
Value Area %: Percentage of volume to include in the value area (default 68%).
Show POC / VAH & VAL: Toggle visibility of each level.
Line Colors: Customize VAH, VAL, and POC colors.
Use Cases:
Identify previous session support and resistance levels for intraday trading.
Gauge areas of high liquidity and potential market reaction zones.
Combine with other indicators or price action strategies for improved entries and exits.
Recommended Timeframe:
Works on all timeframes; best used on 1-minute or 5-minute charts for precise intraday analysis.

Pivot Points HL DetailedThis indicator marks important turning points in the market, showing you the most recent swing high and swing low as horizontal lines across the chart. Each pivot line has a price label where it formed and a small counter that updates whenever the market touches that level again. The line’s color reflects the prevailing trend, determined by an EMA filter, so you can quickly see if the level is likely acting as support or resistance in the current market environment.
It works by scanning recent bars for points where price made a local high higher than several bars to its left and right, or a local low lower than several bars to its left and right. These pivots are calculated directly from price action using the ta.pivothigh and ta.pivotlow functions. Once identified, the level is tracked in real time, counting every time price crosses it. The EMA provides context: if price is above the EMA, the market is considered in an uptrend and the pivots are colored to match; if price is below, they’re marked as part of a downtrend.
For traders, this offers a clean way to see where the market has turned before and whether those levels are still relevant. Strong levels often show multiple touches, which can be used for entries, exits, or risk management. The built-in alert system can notify you when price approaches either the most recent swing high or swing low, so you can react quickly.
This tool can be applied in almost any market — forex, stocks, indices, commodities, or crypto — because price tends to respect recent swing points regardless of the asset class. It tends to be most effective in liquid markets, where many traders see and react to the same key levels, and it’s valuable in both trending and ranging conditions, though the EMA trend filter adds extra clarity when the market is moving directionally.
SMC Structure IndicatorTitle: SMC Structures Indicator
Description:
The SMC Structures indicator is a powerful tool designed to identify and visualize key structural elements in price action, based on the principles of Smart Money Concepts (SMC). This indicator helps traders identify potential areas of support, resistance, and price reversals by highlighting significant market structures.
Key Features:
Structure Identification: The indicator automatically detects and marks important high and low structures in the market.
Break of Structure (BOS) Detection: It identifies and labels instances where previous structures are broken, indicating potential trend changes or continuations.
Change of Character (CHoCH) Detection: The indicator recognizes and marks Changes of Character, which are significant shifts in market behavior.
Customizable Visuals: Users can personalize the appearance of BOS and CHoCH markings, including colors, line styles, and widths.
Current Structure Display: The indicator can optionally show the current active structure, helping traders understand the immediate market context.
Historical Structure Tracking: Users can specify the number of historical structure breaks to display, allowing for a cleaner chart while maintaining relevant information.
Flexible Break Confirmation: The indicator offers the option to confirm structure breaks using either the candle body or wick, accommodating different trading styles.
Technical Details:
The indicator uses advanced algorithms to identify significant price structures based on local highs and lows.
It employs a lookback period of 10 bars for structure detection, ensuring relevance to current market conditions.
The code includes safeguards to handle different market phases and avoid false signals during ranging periods.
Customization Options:
Colors for Bullish and Bearish BOS and CHoCH markings
Line styles and widths for all structure markings
Number of historical breaks to display
Option to show or hide the current active structure
Choice between candle body or wick for structure break confirmation
Use Cases:
Trend Analysis: Identify the start of new trends or potential trend reversals.
Support and Resistance: Pinpoint key levels where price may react.
Trade Entry and Exit: Use structure breaks as potential entry or exit signals.
Market Context: Understand the broader market structure to make informed trading decisions.

Breakout + Retest StrategyThe Breakout + Retest Strategy is a proven price action approach used by professional traders to catch high-probability market moves after key levels are broken. This strategy aims to enter the market after confirmation — reducing false breakouts and improving entry accuracy.
🔍 Strategy Logic:
Identify a Key Support or Resistance Level
These could be recent swing highs/lows, consolidation zones, or session highs.
Wait for a Clean Breakout
Price must decisively break above resistance or below support with strong momentum.
Watch for the Retest
After the breakout, wait for the price to pull back to the broken level (now flipped support/resistance).
Enter on Retest Confirmation
Look for signs like rejection wicks, bullish/bearish engulfing candles, or strong volume on the retest.
Set Risk-Managed Stops and Targets
Stop loss goes below (for long) or above (for short) the retested level.
Target is usually set at a 1:2 or higher risk-to-reward ratio, or based on structure.
✅ Why It Works:
Filters out fake breakouts
Uses market structure and liquidity traps to your advantage
Combines both momentum and confirmation
⚙️ Best Timeframes:
15-minute to 1-hour for intraday setups
4-hour and daily for swing trades
📊 Ideal for:
Futures (NQ, ES, Gold)
Forex pairs
Crypto
Stocks near key earnings or breakout zones

NDX Levels Adjusted to Active TickerThis indicator allows you to plot custom NDX levels directly on the NQ1! (E-mini NASDAQ-100 Futures) chart, automatically adjusting for the spread between NDX and NQ1!. This is particularly useful for traders who perform technical analysis on NDX but execute trades on NQ1!.
Features:
Input up to three NDX key levels to track (e.g., 23000, 24000, 25000).
The script adjusts these levels in real-time based on the current spread between NDX and NQ1!
Displays the spread in the chart header for quick reference
Plots updated horizontal lines that move with the spread
Includes optional labels showing the spread periodically to reduce clutter
Supports Multiple Tickers: NQ1!, QQQ, NAS100 and NAS100USD.
Ideal for futures traders who want SPX context while trading NQ1!, QQQ, NAS100 or NAS100USD..

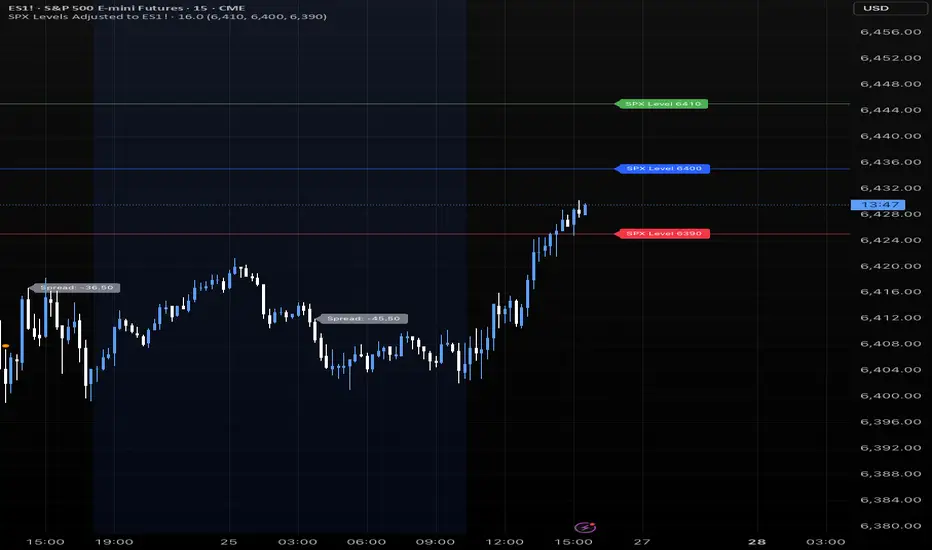
SPX Levels Adjusted to Active TickerThis indicator allows you to plot custom SPX levels directly on the ES1! (E-mini S&P 500 Futures) chart, automatically adjusting for the spread between SPX and ES1!. This is particularly useful for traders who perform technical analysis on SPX but execute trades on ES1!.
Features:
Input up to three SPX key levels to track (e.g., 5000, 4950, 4900)
The script adjusts these levels in real-time based on the current spread between SPX and ES1!
Displays the spread in the chart header for quick reference
Plots updated horizontal lines that move with the spread
Includes optional labels showing the spread periodically to reduce clutter
Supports Multiple Tickers, ES1!, SPY and SPX500USD.
Ideal for futures traders who want SPX context while trading ES1!.

SPX Levels Adjusted to ES1!This indicator allows you to plot custom SPX levels directly on the ES1! (E-mini S&P 500 Futures) chart, automatically adjusting for the spread between SPX and ES1!. This is particularly useful for traders who perform technical analysis on SPX but execute trades on ES1!.
Features:
Input up to three SPX key levels to track (e.g., 5000, 4950, 4900)
The script adjusts these levels in real-time based on the current spread between SPX and ES1!
Displays the spread in the chart header for quick reference
Plots updated horizontal lines that move with the spread
Includes optional labels showing the spread periodically to reduce clutter
Ideal for futures traders who want SPX context while trading ES1!.
Make sure to apply this indicator on the ES1! chart, not SPX.
ICT Time CaptureICT 8am High/Low + 9am Capture (NY Time) — Fixed 1H
This indicator marks the High and Low of the 8am candle on the 1-hour timeframe fixed to New York time (America/New_York timezone). It also draws a line for the 9am candle open and indicates if the 9am candle “captured” (broke above or below) the 8am High or Low.
Key Features:
Always uses 1-hour data fixed on New York timezone, regardless of the chart’s current timeframe.
Draws horizontal lines for the 8am High and Low, with configurable colors, styles (solid/dashed), thickness, and extension length.
Draws a horizontal line for the 9am open price with customizable style.
Shows labels with price values explaining the lines.
Shows a capture label when the 9am candle breaks above the 8am high or below the 8am low.
Allows full customization of label text colors, line colors, line styles, thickness, and label distances from line start.
How to use:
Use this indicator to monitor key ICT timeframes (8am and 9am NY time) for intraday price action clues.
The capture labels help identify when price breaks key levels from the 8am candle during the 9am candle.
The configurable style options let you customize the indicator to your chart style.
