Order Blocks - VK TradingOrder Blocks - VK Trading
This script in Pine Script identifies and highlights Order Blocks, key tools in institutional trading. Designed for traders of all levels, it provides clear and customizable visualization, helping you anticipate market movements with greater accuracy.
Key Features:
Order Block Visualization: Highlights relevant bullish and bearish zones directly on the chart.
Customizable Settings: Adjust sensitivity, colors, and other parameters to suit your analysis needs.
Dual Block Detection: Uses two independent settings to cover different market perspectives.
Visual Alerts: Automatic line drawing for key levels.
Automatic Clearing: Dynamic clearing of already invalidated blocks.
User Benefits:
Clear Visual Analysis: Identifies key supply and demand points used by institutions.
Improved Trading Decisions: Anticipate entry and exit zones more accurately.
Time Saver: Automates level plotting, allowing you to focus on strategy and execution.
Strategy Adaptability: Compatible with Smart Money, Wyckoff, and Price Action approaches.
Disclaimer:
This script is an educational and analytical tool. It does not guarantee specific results or eliminate trading risk. Trading in the financial markets involves significant risks; use this script at your own risk.
In den Scripts nach "key levels" suchen

Average High-Low Multi Time Frame Lines SunilTitle: Multi-Timeframe Average High-Low Levels with Custom Timeframes
Description:
This indicator calculates the average of high and low prices across up to four customizable timeframes. By default, it includes 30 minutes, 1 hour, 3 hours, and 1 day, but you can modify these directly in the input settings to suit your trading strategy.
Features:
Plots average high-low levels for selected timeframes with distinct colors.
Highlights buy zones (green) when the price is above all levels and sell zones (red) when the price is below all levels.
Marks areas where all levels align with a subtle blue background.
Use this tool to identify key levels and potential trading opportunities across multiple timeframes at a glance!

First 15-Min Candle Detector [With Breakout Alerts]Indicator: First 15-Minute Candle Detector
Purpose
This indicator helps traders by identifying and marking the high, low, and mid-point of the first 15-minute candle of the market session. It also provides visual aids and alerts for price breakouts above or below these levels, making it ideal for intraday trading strategies.
This script is suitable for traders focusing on early session momentum or reversal strategies.
Key Features
Market Start Customization: Configure the market start time (hour and minute) to align with your trading session or exchange timezone.
Visual Aids:
Horizontal lines to mark the High , Low , and Mid-point of the first 15-minute candle.
Background highlighting to identify the first 15-minute candle.
Configurable colors and line widths for clear visuals.
Breakout Alerts:
Real-time alerts for breakouts above the high or below the low of the first 15-minute candle.
Customizable alert messages.
Alerts configured using alertcondition .
Dynamic Adjustments:
Adapts dynamically to timeframes of 15 minutes or lower.
Resets and recalculates at the start of each new session.
Inputs and Configurations
Market Settings:
Market Start Hour: Default is 9.
Market Start Minute: Default is 30.
Visual Settings:
Enable/disable background highlighting.
Set colors for the background, high line, low line, and mid-line.
Adjust line width (1 to 5).
Toggle the visibility of the mid-line.
Alert Settings:
Enable breakout alerts.
Set custom alert messages for high and low breakouts.
How It Works
// First 15-Minute Candle Detection
The indicator monitors the first 15-minute candle after the market opens based on the configured start time. It records the high , low , and calculates the mid-point of this candle.
// Visual Markings
Horizontal lines are drawn at the high, low, and mid-point of the first 15-minute candle, extending to the right for the rest of the session.
// Breakout Detection
The indicator checks for price breakouts above the high or below the low of the first 15-minute candle and triggers alerts if enabled.
// Dynamic Reset
The indicator resets values and deletes previous session lines at the start of each new session.
Conditions and Alerts
Breakout Conditions:
High Breakout: The closing price exceeds the high of the first 15-minute candle.
Low Breakout: The closing price falls below the low of the first 15-minute candle.
Alert Triggers: Configurable alerts notify you of breakouts in real-time.
Use Cases
Intraday Traders: Ideal for early-session momentum or reversal strategies.
Breakout Traders: Helps identify entry points when price breaks key levels.
Visual Clarity: Simplifies tracking important session levels.
Limitations
Works only on 15-minute or lower timeframes.
Requires accurate market start time configuration.

Trade Entry Detector, Wick to Body Ratio Trade Entry Detector: Wick-to-Body Ratio Strategy with Bollinger Bands
Overview
The Trade Entry Detector is a custom strategy for TradingView that leverages the Bollinger Bands and a unique wick-to-body ratio approach to capture precise entry opportunities. This indicator is designed for traders who want to pinpoint high-probability reversal points when price interacts with Bollinger Bands, all while offering flexible entry fill options.
The strategy performs primary analysis on the daily time frame, regardless of your current chart setting, allowing you to view daily Bollinger Band levels and entry signals even on lower time frames. This approach is suitable for swing traders and short-term traders looking to align intraday moves with higher time frame signals.
How the Strategy Works
1. Bollinger Band Analysis on the Daily Time Frame
Bollinger Bands are calculated using a 20-period simple moving average (SMA) and a standard deviation multiplier (default is 2). These bands dynamically expand and contract based on market volatility, making them ideal for identifying overbought and oversold conditions:
* Upper Band: Indicates potential overbought levels.
* Lower Band: Indicates potential oversold levels.
2. Wick-to-Body Ratio Condition
This strategy places significant emphasis on candle wicks relative to the candle body. Here’s why:
* A large upper wick relative to the body signals potential selling pressure after testing the upper Bollinger Band.
* A large lower wick relative to the body indicates buying support after testing the lower Bollinger Band.
* Ratio Threshold: You can set a minimum wick-to-body ratio (default is 1.0), meaning that the wick must be at least equal in size to the body. This ensures only candles with significant reversals are considered for entry.
3. Flexible Entry Timing
To adapt to various trading styles, the indicator allows you to choose the entry fill timing:
* Daily Close: Enter at the close of the daily candle.
* Daily Open: Enter at the open of the following daily candle.
* HOD (High of Day): Set entry at the daily high, for those who want confirmation of upward momentum.
* LOD (Low of Day): Set entry at the daily low, ideal for confirming downward movement.
4. Position Sizing and Risk Management
The strategy calculates position size based on a fixed risk percentage of your account balance (default is 1%). This approach dynamically adjusts position sizes based on stop-loss distance:
* Stop Loss: Placed at the nearest swing high (for shorts) or swing low (for longs).
* Take Profit: Exits are triggered when the price reaches the opposite Bollinger Band.
5. Order Expiration
Each pending order (long or short) expires after two days if unfilled, allowing for new setups on subsequent candles if conditions are met again.
Using the Trade Entry Detector
Step-by-Step Guide
1. Set the Primary Time Frame
The core calculations run on the daily time frame, but the strategy can be applied to intraday charts (e.g., 65-minute or 15-minute) for deeper insights.
2. Adjust Bollinger Band Settings
* Length: Default is 20, which determines the period for calculating the moving average.
* Standard Deviation Multiplier: Default is 2.0, which sets the width of the bands. Adjusting this can help you capture broader or tighter volatility ranges.
3. Define the Wick-to-Body Ratio
Set the minimum ratio between wick and body (default 1.0). Higher values filter out candles with less wick-to-body contrast, focusing on stronger rejection moves.
4. Choose Entry Fill Timing
Select your preferred fill condition:
* Daily Close: Confirms the trade at the end of the daily session.
* Daily Open: Executes the entry at the open of the next day.
* HOD/LOD: Uses the daily high or low as an additional confirmation for upward or downward moves.
5. Position Sizing and Risk Management
* Set your account balance and risk percentage. The strategy automatically calculates position sizes based on the stop distance to manage risk efficiently.
* Stop Loss and Take Profit points are automatically set based on swing highs/lows and opposing Bollinger Bands, respectively.
Practical Example
Let’s say SPY (S&P 500 ETF) tests the lower Bollinger Band on the daily time frame, with a lower wick that is twice the size of the body (meeting the 1.0 ratio threshold). Here’s how the strategy might proceed:
1. Signal: The lower wick on SPY suggests buying interest at the lower Bollinger Band.
2. Entry Fill Timing: If you’ve selected "Daily Open," the entry order will be placed at the next day's open price.
3. Stop Loss: Positioned at the nearest daily swing low to minimize risk.
4. Take Profit: If SPY price moves up and reaches the upper Bollinger Band, the position is automatically closed.
Indicator Features and Benefits
* Multi-Time Frame Compatibility: Perform daily analysis while tracking signals on any intraday chart.
* Automatic Position Sizing: Tailor risk per trade based on account balance and desired risk percentage.
* Flexible Entry Options: Choose from close, open, HOD, or LOD for optimal timing.
* Effective Trend Reversal Identification: Uses wick-to-body ratio and Bollinger Band interaction to pinpoint potential reversals.
* Dynamic Visualization: Bollinger Bands are displayed on your chosen time frame, allowing seamless intraday tracking.
Summary
The Trade Entry Detector provides a unique, data-driven way to spot reversal points with customizable entry options. By combining Bollinger Bands with wick-to-body ratio conditions, it identifies potential trade setups where price has tested extremes and shown reversal signals. With its flexible entry timing, risk management features, and multi-time frame compatibility, this indicator is ideal for traders looking to blend daily market context with shorter-term execution.
Tips for Usage:
* For swing trading, consider the Daily Open or Close entry options.
* For momentum entries, HOD or LOD may offer better alignment with the direction of the wick.
* Backtest on different assets to find optimal Bollinger Band and wick-to-body settings for your market.
Use this indicator to enhance your understanding of price behavior at key levels and improve the precision of your entry points. Happy trading!

First 5-Minute ORB Levels with Hour Offset### Indicator Overview: First 5-Minute ORB Levels with Hour Offset
This indicator is designed for traders who want to track the high and low of the first 5-minute candle of a trading session, specifically starting at 9:30 am EST (New York time) by default. The lines representing these levels, known as the "Opening Range Breakout" (ORB) levels, are extended across the trading session until the market close at 4:00 pm EST. The indicator provides the following features:
1. **Real-Time Updates**:
- As the first 5-minute candle of the session forms (from 9:30 am to 9:35 am EST), the indicator dynamically updates the high and low lines.
- After the candle completes, the lines are locked in place and extend horizontally across the chart until market close.
2. **Customizable Hour Offset**:
- Users can adjust the start time of the session by specifying an hour offset. This feature is particularly useful for traders operating in different time zones or those who want to analyze custom session times.
- For example, if you trade in a time zone where the session starts at 8:30 am local time instead of 9:30 am EST, you can set the hour offset to `-1` to adjust the start time accordingly.
3. **Visual Labels**:
- The indicator places labels at the end of the lines, clearly marking the "5m ORB High" and "5m ORB Low" levels. These labels are updated in real-time as the first 5-minute candle forms and are fixed in place once the candle closes.
### How to Adjust the Settings:
1. **Hour Offset**:
- **Description**: The hour offset allows you to shift the start time of the session. The default start time is 9:30 am EST, but you can change this using the hour offset.
- **How to Adjust**:
- Open the indicator settings.
- Locate the "Hour Offset" field.
- Enter a positive or negative integer value to shift the session start time.
- **Example**:
- `0` (default): Start at 9:30 am EST.
- `-1`: Start at 8:30 am EST.
- `+1`: Start at 10:30 am EST.
- The indicator will then track the first 5-minute candle starting at the adjusted time and plot the high and low accordingly.
2. **Line and Label Appearance**:
- The lines representing the ORB levels are green by default, and the labels are also green with white text for clear visibility on the chart. The labels are positioned to the right of the lines to avoid cluttering the chart.
### Use Cases:
- **Opening Range Breakout Strategy**: Traders often use the ORB strategy to identify potential breakout points during the trading day. By marking the high and low of the first 5-minute candle, this indicator helps traders quickly identify key levels where price might break out or reverse.
- **Custom Session Analysis**: If you trade in a different time zone or need to analyze a different session (e.g., pre-market or after-hours), the hour offset feature allows you to adapt the indicator to your needs.
This indicator is particularly valuable for intraday traders who rely on the initial volatility of the trading session to make informed decisions.

Amazing Oscillator (AO) [Algoalpha]Description:
Introducing the Amazing Oscillator indicator by Algoalpha, a versatile tool designed to help traders identify potential trend shifts and market turning points. This indicator combines the power of the Awesome Oscillator (AO) and the Relative Strength Index (RSI) to create a new indicator that provides valuable insights into market momentum and potential trade opportunities.
Key Features:
Customizable Parameters: The indicator allows you to customize the period of the RSI calculations to fine-tune the indicator's responsiveness.
Visual Clarity: The indicator uses user-defined colors to visually represent upward and downward movements. You can select your preferred colors for both bullish and bearish signals, making it easy to spot potential trade setups.
AO and RSI Integration: The script combines the AO and RSI indicators to provide a comprehensive view of market conditions. The RSI is applied to the AO, which results in a standardized as well as a less noisy version of the Awesome Oscillator. This makes the indicator capable of pointing out overbought or oversold conditions as well as giving fewer false signals
Signal Plots: The indicator plots key levels on the chart, including the RSI threshold(Shifted down by 50) at 30 and -30. These levels are often used by traders to identify potential trend reversal points.
Signal Alerts: For added convenience, the indicator includes "x" markers to signal potential buy (green "x") and sell (red "x") opportunities based on RSI crossovers with the -30 and 30 levels. These alerts can help traders quickly identify potential entry and exit points.

Crypto Uptrend Script + Pullback//Volume CandlesDescription: his is an adaption of my Pullback candle - This works on all timeframes and Markets (Forex//Stocks//)
Crypto Uptrend Script with Pullback Candle allows traders to get into a trend when the price is at end of a pullback and entering a balance phase in the market (works on all markets). The use of Moving averages to help identify a Trends and the use of Key levels to help traders be aware of where strong areas are in the market.
This script can work really well in Crypto Bull Runs when used on HTF and with confluences
The script has key support and resistance zones which are made up of quarterly data. Price reacts to these areas but patience is required as price will take time to come into these areas
I have updated the Pullback Candle with the use of Volume to filter out the weak Pullback Candles -
There are new candles to the script.
The First candle is the Bullish Volume Candle - This candle is set to a multiplier of 2x with a crossover of 50/100 on Volume - this then will paint a purple candle.
Uses of the Bullish Volume Candle:
Breakthrough of key areas // special chart patterns
Rejection of key areas
End of a impulse wave (Profit Takers)
The second candle is a Hammer - I prefer using the Hammers on Higher Timeframes however they do work on all timeframes. .
The third candle is a Exhaustion of impulse downward move.
Uses of this candle - can denote a new trend but has to be with confluence to a demand area // support area or with any use of technical analysis - using this alone is not advised
The fourth candle is a indecision candle in the shape of a Doji - this candle can help identify if the trend is in a continuation or a reversal
This script can work really well in Crypto Bull Runs
Disclaimer: There will be Pullbacks with High Volume (Breakouts) and not go the way as intended but this script is to allow traders to get into trends at good price levels. The script can paint signals in areas where price is too expensive so please do your own due diligence on the markets as this script is to help get into good areas of price
Please leave a thumbs up if you like this script and message me for information on how to use the script.

Volume Histogram [SpiritualHealer117]This indicator is a histogram produced with Pinescript's boxes and is helpful for spotting support, resistance, and key levels. The indicator shows the volume executed at each source price over a customizable time period. The "Key Level" in this indicator is the price at which the most volume was executed, and the "Major Levels" are levels where volume was over a percentile threshold, which you can customize in settings. Feel free to give any feedback on the indicator or make a copy for yourself!

BB Order BlocksUsing the Bollinger Band to mark areas of Support and Resistance
The scrip finds the highest and lowest levels of the bands to mark up futures areas of interest.
If the High/Lows are being broken on the Bollinger band, or if the look back range has expired without finding new levels, the script will stop plotting them until new levels are found
I have found many combinations which work well
Changing the band length to to levels 20,50,100 or 200 seem to give interesting results
Aswell as this changing the standard deviation to 3 instead of 2 marks up key levels.
The look back range seems to show better levels on 50,100 and 200
Let me know any changes or updates you think you could make an impact , this was just a quick basic script I wanted to share.

NSDT Pivot Points PlusThis script uses the Traditional Pivot Points but includes the price levels and the 50% line between levels. We added the ability to change the line color of the major levels and the minor levels independently, for better clarity. Added alerts - used code from QuantNomad.
Pivot Points description from TradingView default indicator:
Pivot Point analysis is a technique of determining key levels that price may react to. Pivot points tend to function as support or resistance and can be turning points. This technique is commonly used by day traders, though the concepts are valid on various timeframes. There are several methods of identifying the exact points. Common types of pivot points are Traditional, Fibonacci, Woodie, Classic, Camarilla and DM and each type has its own calculation method.
Most use a variation of significant prices such as established highs, lows, opening and closing prices and then apply a calculation to determine these points. They all calculate additional support and resistance levels alongside the pivot points. They can be used to determine when to enter or exit trades or to determine the range of a market. Conservative traders look for additional confirmation before entering a trade. Whether pivot points are used alone or in combination with other techniques, they are a useful tool in a technical trader's toolbox.
Pivot Points, by @juanmirocks# Advantages over TV's indicator "Pivot Points Standard"
1. Show pivot lines for all history, which lets you gauge trading strategies throughout time
2. More sensible Default/Auto time frame; e.g. on intradays only and always the market values of yesterday's Day are used
3. The halves between the key levels are also shown, which it's useful for some trading strategies
4. Arguably out-of-the-box nicer interface
Pivot Points as an indicator is a traditional strategy to draw resistance and support levels. It's best suited for intraday trading: the pivot points and resulting key levels are calculated from yesterday's market values (H, L, C). More details in the script's source.
Pivot Points trading is suitable for any market, and best for intraday (e.g. 3 min).

All-in-One CVD: Failed Auction + Trap + Flow Classifications All-in-One CVD : Failed Auction/Trap + Flow Classifications (Colored Bars)
Description:
This script provides an advanced order flow and delta-based trading visualization designed to highlight key market microstructure events in real time. It combines Cumulative Volume Delta (CVD), failed auction detection, absorption tracking, continuation signals, and trap identification into a single, coherent tool with colored bars and visual markers. Unlike standard volume or trend-following indicators, this script focuses on aggressive order flow and price acceptance/rejection events, making it particularly suitable for scalping, intraday momentum trading, and identifying high-probability short-term setups.
Originality and Purpose:
Many scripts either show CVD or detect failed auctions separately, but this script integrates multiple advanced flow concepts into one indicator.
By combining CVD, normalized delta, strong delta thresholds, failed auctions, absorption, traps, and continuation patterns, traders can identify where aggressive buying or selling is being absorbed, where price is likely to continue, and where traps are forming.
The mashup is intentional: each component validates the other. For example, a failed auction signal without absorption is less significant, while a failed auction coinciding with absorption signals a true high-probability trap or reversal.
Failed auctions typically align with "Failed 2" patterns from The Strat by Rob Smith, providing additional confirmation using a well-established price action methodology.
How It Works:
Volume and Delta Calculation:
Computes buying and selling pressure from volume and bar structure (high/low/close).
Supports UltraData mode for enhanced volume calculations using security data.
Options for Cumulative Mode: Total, Periodic, or EMA-based CVD.
Normalized Delta and Strong Delta Detection:
Calculates normalized delta (z-score) to standardize flow across different volatility regimes.
Flags strong buying or selling when delta exceeds user-defined thresholds.
Failed Auction Detection:
Highlights bars where price attempted to break previous highs/lows but failed to sustain, signaling trapped aggressive participants.
True failed auctions can coincide with absorption for higher-probability setups.
Absorption:
Detects situations where strong aggressive flow is absorbed at key levels, showing institutional participation or liquidity consumption.
Bullish absorption occurs when aggressive buying is absorbed at previous lows; bearish absorption occurs when aggressive selling is absorbed at previous highs.
Flow Classification:
Continuation: Aggressive flow accepted by the market — often the next candle continues in the direction of the delta.
Important: A single continuation signal does not guarantee follow-through. Traders should view it as an indicator that aggressive participants are in control for the current candle, and consider market context, trend, and support/resistance before assuming continuation. Multiple consecutive continuation signals or confirmation with absorption/strong delta increases reliability.
Trap: Aggressive flow trapped — the market reverses after failed auction.
Absorption: Aggressive orders absorbed — market shows hesitation at tested levels.
Colored CVD Bars and Visual Markers:
Bars colored green/red/gray based on delta direction.
Visual markers indicate flow state: circles for continuation, X-cross for traps, triangles for absorption.
Works in real time — live candles are updated with flow state markers.
Alerts:
Custom alert conditions for each flow type: continuation, trap, and absorption.
Alerts provide actionable signals for automated monitoring or manual trading.
Trading Applications:
Trap Trading: Identify aggressive buyers/sellers who fail to push price and get trapped. Use trap signals to fade reversals.
Continuation Trading: Detect market acceptance of aggressive flow for trend-following or breakout strategies. Use caution: a single continuation signal indicates probability, not certainty, and should be confirmed with structural context.
Absorption Analysis: Spot where institutional participants absorb liquidity before a potential directional move.
Intraday Scalping: Combines delta, volume, failed auction logic, and Strat alignment for high-frequency setups.
Key Notes:
True failed auctions with significant market impact require absorption — otherwise, a simple failed attempt may be a weak signal.
The script works across multiple markets (Forex, Crypto, Stock) and supports live bar updates.
Users can adjust strong delta thresholds, period lengths, and cumulative modes to fit their preferred trading style or volatility regime.
Conclusion:
This all-in-one script provides traders with a comprehensive, visually intuitive, and real-time method to detect aggressive flow, failed auctions, absorption, and continuation patterns. By linking failed auctions to The Strat’s failed 2 patterns, and clarifying the probabilistic nature of continuation signals, it merges advanced delta analytics with proven price action methodology, making it highly original, actionable, and educational for understanding market order flow dynamics.

BK AK-IED💥 Introducing BK AK-IED — Volatility Ignition / Expansion / Detonation 💥
A pressure-to-release weapon system for traders who want timing, not noise.
Markets don’t move clean because they “feel like it.” They load, they ignite, and then they detonate into expansion. BK AK-IED is built to expose that sequence in real time—so you stop trading randomness and start trading regime shifts.
⚔️ What BK AK-IED is
BK AK-IED is a 3-speed VWMA energy oscillator that blends price movement + volume into a single pressure readout:
Fast (5) = ignition energy (range-driven)
Medium (21) = core pressure engine
Slow (55) = structural volatility backdrop
It’s not a “direction oracle.” It’s an energy meter that tells you when the market is coiling, when it’s waking up, and when it’s breaking out with force.
🧠 Core Weapon Systems
✅ Dynamic Scaling
Keeps the oscillator readable across symbols (no ridiculous y-axis blowouts).
✅ Volatility State Bar (Bottom Strip) — Your War Room
🟨 CONTRACTION = VWMA convergence / coil / pressure loading
🟩 EXPANSION = energy spike begins
🟥 BREAKOUT = expansion without contraction (release phase)
⬜ NEUTRAL = dead zone, don’t force it
✅ Breakout Peak Icons (Crown markers)
Crowns print only when there’s true breakout energy and the move hits major peak territory versus recent extremes. Translation:
tighten risk, scale-out, stop getting greedy. These are exhaustion warnings—not automatic reversals.
Timeframe-adaptive peak filtering is built in:
< 1H: stricter peak requirement
≥ 1H: more realistic swing threshold
🧭 How to use it (execution, not opinions)
1) 🟨 Contraction = don’t bleed.
This is the chop factory. You wait. You map levels. You stalk.
2) 🟩 Expansion = prepare.
Start aligning with structure: trend framework, VWAP, key levels, HTF bias.
3) 🟥 Breakout = engage.
This is where moves pay. Trade the direction your structure supports and manage risk like a professional.
4) 👑 Peak during breakout = harvest / protect.
Scale. Tighten stops. Don’t turn winners into donations.
🧱 Inputs that matter (what you’re actually tuning)
Amplitude Multiplier = how aggressive the energy read is
VWMA Spread Contraction Threshold = how tight “coil” must be to count
Scale Lookback = how far back the dynamic scaling references
Peak Thresholds = how selective peaks are (auto-switches based on timeframe)
The “AK” in the name is an acknowledgment of my mentor A.K. His standards (patience, precision, clarity, and emotional control) are a major reason I build tools with structure instead of hype.
And above all: all praise to Gd — the true source of wisdom, restraint, and right timing.
👑 King Solomon Lens — ZENITH Discipline
Solomon didn’t build greatness by impulse. He built it by measure, order, and restraint.
When the Temple was built, the stones were prepared away from the site—so the structure went up with precision, not chaos. That is the market lesson: the decisive moment is loud, but the preparation is silent. If you only show up for the noise, you will always arrive late.
BK AK-IED is that Solomon blueprint on a chart:
🟨 Contraction is the quarry.
The market is cutting the stones in silence. This is where the undisciplined burn money “doing something.” The wise do the opposite: they reduce noise, define levels, and wait.
🟩 Expansion is the line being set.
Pressure starts to move. This is where you bring structure online—bias, levels, risk plan. Not excitement.
🟥 Breakout is the placement.
The stone drops into position. This is the only phase where aggression is righteous—because it’s backed by a real shift, not hope.
👑 Peak icons are ZENITH—crown-of-the-move logic.
Zenith is where force and momentum reach their highest point before decay begins. The crown is not “celebrate and add.” The crown is govern yourself: harvest, tighten, protect. Solomon’s edge wasn’t prediction—it was rule over the self. That’s what separates profit from punishment.
This is what wisdom looks like in trading: not guessing the future—governing your exposure when the present is telling you the truth. And may Gd bless your restraint as much as your entries, because restraint is where survival becomes power.
✅ Final
BK AK-IED is your volatility weapon for market warfare:
Load → Ignite → Detonate.
Use it with structure. Use it with discipline. And give praise to Gd for every protected loss, every clean entry, and every moment you didn’t force a trade. 🙏

Fibonacci Zones and RejectionsThis tool combines swing structure, Fibonacci retracements and candle-wick rejection logic to highlight high-probability reversal or continuation zones.
What it does
Tracks market structure automatically
Detects swing highs and swing lows based on a user-defined Structure Period.
Marks bullish shifts in structure and bearish shifts with CHoCH labels and Break of Structure (BoS) lines.
Optionally draws a dotted swing trend line between the active swing high and swing low and can show price labels at those swing points.
Draws dynamic Fibonacci retracements on the latest swing
Automatically anchors a Fibonacci retracement between the current swing high and swing low.
Lets you enable/disable individual Fibonacci levels and customize their values, colors and line width.
Can extend Fib levels forward to the latest bar and optionally keep previous Fib structures on the chart for context.
Optionally fills the “Golden Zone” (by default the first two levels, e.g. 0.50 and 0.618) so the core pullback area is visually obvious.
Defines an OTE / “Gold Zone” band from the active Fib levels
Uses the first two Fib lines (by default 0.50 and 0.618 or set another zone such as 61.8% to 78.6%) to form a live “Optimal Trade Entry” band.
Continuously updates this band as new structure forms and swings develop.
Detects rejection candles inside the Fib OTE band
Breaks each candle into upper wick, lower wick, body and total range.
A bullish rejection is a candle where:
Price trades into the OTE band,
The lower wick is a large portion of the bar’s range, and
The body is not tiny (minimum body-to-range ratio is configurable).
A bearish rejection is the mirror condition using the upper wick.
Only candles whose range overlaps the OTE band are considered; this filters for true reactions to the Fib zone.
Plots clear signals and alerts
Bullish OTE rejection is plotted as a large cross at the low of the candle.
Bearish OTE rejection is plotted as a large cross at the high of the candle.
Built-in alertcondition calls allow you to set alerts for:
Bullish OTE Rejection
Bearish OTE Rejection
Optional “debug” markers can show all raw rejection candles and all bars that sit inside the OTE band, to help you understand how the logic behaves.
Use cases
Identify pullback entries into the desired Fib zone after a clear structural move.
Confirm reversals or continuations using wick-based rejection inside a pre-defined Fib discount/premium zone.
Combine with your own higher-timeframe bias or ICT / SMC tools to refine entry timing around key levels.

MA % Deviation ChannelMA % Deviation Channel — an indicator for measuring price deviation from the moving average
MA % Deviation Channel (MA%DC) is a visual analysis tool that shows how far the current price deviates from a selected moving average, expressed in percentages. The indicator builds dynamic channels based on historical percentage deviations, helping traders identify statistical extremes and use them as potential reversal or continuation zones.
How the indicator works
MA%DC calculates the percentage deviation of High and Low from the chosen MA and stores these values in arrays. Based on the average deviation values, the script plots four key levels:
Avg. High Dev. — average deviation of highs from the MA
Avg. Low Dev. — average deviation of lows from the MA
Avg. Extreme High Dev. — extreme (above-average) deviations of highs
Avg. Extreme Low Dev. — extreme (below-average) deviations of lows
The width of the channel automatically adapts to the selected MA period — the longer the period, the deeper the historical analysis.
Purpose and use cases
MA % Deviation Channel helps:
Evaluate volatility relative to the moving average
Identify overbought and oversold zones based on real price behavior
Filter breakouts and false impulses
Build trend-following and counter-trend strategies using statistical deviations
Advantages
Based on percentage deviation rather than fixed distances
Adaptive to changing market conditions
Supports 5 popular types of moving averages
Settings
MA Source — data source for the moving average
MA Type — moving average type (SMA, EMA, WMA, VWMA, RMA)
MA Length — smoothing period
Visual elements
The moving average line
Average deviation channels
Extreme deviation channels
Color fills between levels for improved readability

TICK Indicator with Extreme AlertsOverview:
This indicator is designed to provide intraday traders (especially those trading SPX, ES, and NQ) with a clearer NYSE TICK analysis tool featuring visual alerts. Unlike traditional TICK line charts, this indicator utilizes OHLC Candlesticks to display data, allowing you to fully view the Open, High, Low, and Close within a specific timeframe, thereby capturing instantaneous liquidity sweeps.
Core Features & Logic:
Candlestick Visualization (OHLC Candles): Uses the USI:TICK.US data source by default. The candlestick patterns allow you to clearly see if the TICK pierced key levels intraday but retraced by the close—vital information that standard line charts often miss.
Dual Key Level System: The indicator is designed with two independent reference tiers for trend observation and reversal detection:
Reference Lines (+/- 800): Marked by gray dashed lines. These represent the standard bull/bear dividing zones. When TICK sustains above +800 or below -800, it typically indicates a strong trending market.
Extreme Alerts (+/- 1000): These thresholds are used to identify extreme market sentiment (overbought/oversold conditions).
Background Highlight Alerts (Visual Alerts): To reduce screen-watching fatigue, the indicator automatically highlights the candlestick background when extreme market sentiment occurs:
Green Background: Triggered when TICK High breaks above +1000. Represents extreme buying sentiment, potentially indicating exhaustion or a short squeeze.
Red Background: Triggered when TICK Low drops below -1000. Represents extreme panic selling (Washout), often serving as a potential signal for an intraday reversal or a short-term bottom.
Custom Settings:
All thresholds (800 reference lines, 1000 alert lines) are fully adjustable in the settings.
All colors (Candles, Reference Lines, Background Alert Colors) can be customized.
Use Cases: This tool is ideal for intraday counter-trend or trend-following trading when combined with Price Action analysis and key Support & Resistance levels.

TopBot [CHE] TopBot — Structure pivots with buffered acceptance and gradient trend visualization
Summary
TopBot detects swing structure from confirmed pivot highs and lows, derives support and resistance levels, and switches trend only after a buffered and accepted break. It renders labels for recent structure points, maintains dynamic support and resistance lines that freeze on contact, and colors candles using a gradient that reflects consecutive trend persistence. The gradient communicates strength without extra panels, while the buffered acceptance reduces fragile flips around key levels. Everything runs in the main chart for immediate context.
Motivation: Why this design?
Classical swing tools often flip on single-bar spikes and produce lines that extend forever without acknowledging when price invalidates them. This script addresses that by requiring a user-controlled buffer and a run of consecutive closes before changing trend, while also freezing lines once price interacts with them. The gradient color layer communicates regime persistence so users can quickly judge whether a move is maturing or just starting.
What’s different vs. standard approaches?
Baseline reference: Simple pivot labeling and unbuffered break-of-structure tools.
Architecture differences:
Buffered level testing using ticks, percent, or ATR.
Acceptance logic that requires multiple consecutive closes.
Synchronized structure labeling with a single Top and Bottom within the active set.
Progressive support and resistance management that freezes lines on first contact.
Gradient candle and wick coloring driven by consecutive trend counts with windowed normalization and gamma control.
Practical effect: Fewer whipsaw flips, clearer status of active levels, and visual feedback about trend persistence without a secondary pane.
How it works (technical)
The script confirms swing points using left and right bar pivots, then forms a current structure window to classify each pivot as higher high, lower high, higher low, or lower low. Recent labels are trimmed to a user cap, and a postprocess step ensures one highest and one lowest label while preserving side information for the others. Support updates on higher low events, resistance on lower high events. Trend flips only after the close has moved beyond the active level by a chosen buffer and this condition holds for a chosen number of consecutive bars. Lines for new levels extend to the right and freeze once price touches them. A running count of consecutive trend bars produces a strength score, which is normalized over a rolling window, shaped by gamma, and mapped to user-defined dark and neon colors for both up and down regimes. Wick coloring uses `plotcandle`; fallback bar coloring uses `barcolor`. No higher-timeframe data is requested. Signals confirm only after the right-bar lookback of the pivot function.
Parameter Guide
Left Bars / Right Bars (default five each): Pivot sensitivity. Larger values confirm later and reduce noise; smaller values respond faster with more noise.
Draw S/R Lines (default true): Enables support and resistance line creation and updates.
Support / Resistance Colors (lime, red): Line colors for each side.
Line Style (Solid, Dashed, Dotted; default Dotted) and Width (default three): Visual style of S/R lines.
Max Labels & Lines (default ten): Cap for objects to control clutter and resource usage.
Change Bar Color (default true), Up/Down colors (blue, black): Fallback bar coloring when gradients or wick coloring are disabled.
Show Neutral Candles (default false): Optional coloring when no trend is active.
Enable Gradient Bar Colors (default true): Turns on gradient body coloring from the strength score.
Enable Wick Coloring (default true): Colors wicks and borders using `plotcandle`.
Collection Period (default one hundred): Rolling window used to scale the strength score. Shorter windows react faster but vary more.
Gamma Bars / Gamma Plots (defaults zero point seven and zero point eight): Shapes perceived contrast of bar and wick gradients. Lower values brighten early; higher values compress until stronger runs appear.
Gradient Transparency / Wick Transparency (default zero): Visual transparency for bodies and wicks.
Up/Down Trend Dark and Neon Colors: Endpoints for gradient mapping in each regime.
Acceptance closes (n) (default two): Number of consecutive closes beyond a level required before trend flips. Larger values reduce false breaks but react later.
Break buffer (None, Ticks, Percent, ATR; default ATR) and Value (default zero point five) and ATR Len (default fourteen): Defines the safety margin beyond the level. ATR mode adapts to volatility; Percent and Ticks are static.
Reading & Interpretation
Labels: “Top” and “Bottom” mark the most extreme points in the active set; “LT” and “HB” indicate side labels for lower top and higher bottom.
Lines: New support or resistance is drawn when structure confirms. A line freezes once price touches it, signaling that the dynamic phase ended.
Trend: Internal state switches to up or down only after buffered acceptance.
Colors: Brighter neon tones indicate stronger and more persistent runs; darker tones suggest early or weakening runs. When gradients are off, fallback bar colors indicate trend sign.
Practical Workflows & Combinations
Trend following: Wait for a buffered and accepted break through the most recent level, then use gradient intensity to stage entries or scale-ins.
Structure-first filtering: Trade only in the direction of the last accepted trend while price remains above support or below resistance.
Exits and stops: Consider exiting on loss of gradient intensity combined with a return through the most recent structure level.
Multi-asset / Multi-timeframe: Works on liquid symbols across common timeframes. Use larger pivot bars and higher acceptance on lower timeframes. No built-in higher-timeframe aggregation is used.
Behavior, Constraints & Performance
Repaint/confirmation: Pivot confirmation waits for the right bar window; trend acceptance is based on closes and can change during a live bar. Final signals stabilize on bar close.
security/HTF: Not used. No cross-timeframe data.
Resources: Arrays and loops are used for labels, lines, and structure search up to a capped historical span. Object counts are clamped by user input and platform limits.
Known limits: Delayed confirmation at sharp turns due to pivot windows; rapid gaps can jump over buffers; gradient scaling depends on the chosen collection period.
Sensible Defaults & Quick Tuning
Start with the defaults: pivot windows at five, ATR buffer with value near one half, acceptance at two, collection period near one hundred, gamma near zero point seven to zero point eight.
Too many flips: increase acceptance, increase buffer value, or increase pivot windows.
Too sluggish: reduce acceptance, reduce buffer value, or reduce pivot windows.
Colors too flat: lower gamma or shorten the collection period.
Visual clutter: reduce the max labels and lines cap or disable wicks.
What this indicator is—and isn’t
This is a visualization and signal layer that encodes swing structure, level state, and regime persistence. It is not a complete trading system, not predictive, and does not manage orders. Use it with broader context such as higher timeframe structure, session behavior, and defined risk controls.
Disclaimer
The content provided, including all code and materials, is strictly for educational and informational purposes only. It is not intended as, and should not be interpreted as, financial advice, a recommendation to buy or sell any financial instrument, or an offer of any financial product or service. All strategies, tools, and examples discussed are provided for illustrative purposes to demonstrate coding techniques and the functionality of Pine Script within a trading context.
Any results from strategies or tools provided are hypothetical, and past performance is not indicative of future results. Trading and investing involve high risk, including the potential loss of principal, and may not be suitable for all individuals. Before making any trading decisions, please consult with a qualified financial professional to understand the risks involved.
By using this script, you acknowledge and agree that any trading decisions are made solely at your discretion and risk.
Do not use this indicator on Heikin-Ashi, Renko, Kagi, Point-and-Figure, or Range charts, as these chart types can produce unrealistic results for signal markers and alerts.
Best regards and happy trading
Chervolino
Acknowledgment
Thanks to LonesomeTheBlue for the fantastic and inspiring "Higher High Lower Low Strategy" .
Original script:
Credit for the original concept and implementation goes to the author; any adaptations or errors here are mine.

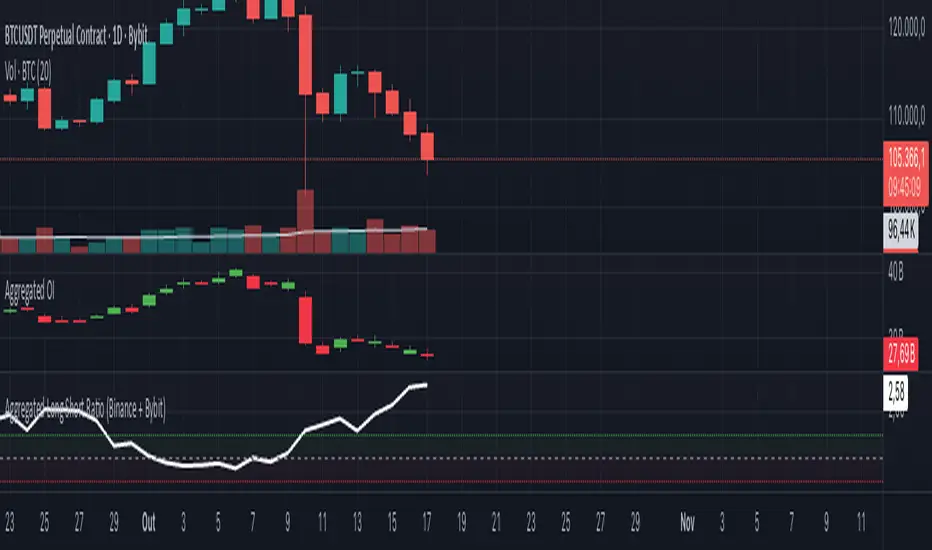
Aggregated Long Short Ratio (Binance + Bybit)This indicator displays the Long/Short Ratio (LSR) from Binance and Bybit exchanges, plus an aggregated average. LSR shows the ratio between traders holding long positions vs short positions.
Settings AvailableExchanges Group:
☑️Show Binance - Display Binance LSR line
☑️ Show Bybit - Display Bybit LSR line
☑️ Show Aggregated LSR - Display combined average
Timeframe - Choose data timeframe (leave empty for chart timeframe)
Visualization Group:
🎨 Binance Color - Default: Yellow
🎨 Bybit Color - Default: Orange
🎨 Aggregated Color - Default: White
📖 How to Read the Indicator
⚠️ CRITICAL: Always analyze LSR together with Open Interest (OI)
Key Levels:
LSR = 1.0 (gray dashed line) = Balance - Equal longs and shorts
LSR > 1.0 = More longs than shorts (bullish sentiment)
LSR < 1.0 = More shorts than longs (bearish sentiment)
Extreme Zones:
LSR > 1.5 (green zone) = Very bullish - Possible market top
LSR < 0.5 (red zone) = Very bearish - Possible market bottom
Why Open Interest Matters:
LSR alone doesn't tell the full story. You MUST check Open Interest:
Rising OI + High LSR (>1.5) = New longs opening → Strong momentum OR potential trap
Rising OI + Low LSR (<0.5) = New shorts opening → Strong momentum OR potential trap
Falling OI + Extreme LSR = Positions closing → Weak signal, avoid trading
Stable OI + Extreme LSR = No new positions → Less reliable signal
💡 Trading Interpretation
⚠️ ALWAYS combine LSR with Open Interest analysis!
Contrarian Strategy (High Leverage Zones):
High LSR (>1.5) + Rising OI → Many new longs → Potential short squeeze OR reversal down
Low LSR (<0.5) + Rising OI → Many new shorts → Potential long squeeze OR reversal up
Trend Confirmation:
Rising LSR + Rising price + Rising OI = Strong bullish trend with new positions
Falling LSR + Falling price + Rising OI = Strong bearish trend with new positions
Weak Signals (Avoid):
Extreme LSR + Falling OI = Positions closing → Low conviction
Extreme LSR + Stable OI = No new money → Wait for confirmation
Divergences:
Price higher highs but LSR falling + Rising OI = Bearish divergence (shorts accumulating)
Price lower lows but LSR rising + Rising OI = Bullish divergence (longs accumulating)
Best Setups:
Reversal: Extreme LSR (>1.5 or <0.5) + Rising OI + Price rejection
Trend: LSR trending with price + Steadily rising OI
Caution: Extreme LSR + Falling OI = Ignore signal
Built-in Alerts
The indicator includes 4 preset alerts:
LSR Crossed Above 1.0 - Market turned bullish
LSR Crossed Below 1.0 - Market turned bearish
LSR Very High - Above 1.5 (possible top)
LSR Very Low - Below 0.5 (possible bottom)
To Set Up Alerts:
Click the "..." on the indicator
Select "Add Alert"
Choose the condition you want
Configure notification method
Best Practices
MANDATORY: Always add Open Interest indicator to your chart alongside LSR
To add OI: Click Indicators → Search "Open Interest" → Add official TradingView OI
Use on perpetual futures charts (symbols ending in .P)
Works best on USDT pairs (BTCUSDT, ETHUSDT, etc.)
Combine LSR + OI + price action + support/resistance levels
Higher timeframes (4h, 1D) give more reliable signals
Don't trade LSR extremes without confirming OI direction
Golden Rule: Rising OI = Strong signal | Falling OI = Weak signal
⚠️ Important Notes
Indicator requires TradingView Premium or above (uses Request library)
Only works on crypto perpetual futures
Data availability depends on exchange API
NA values mean data is not available for that exchange/symbol
Never use LSR without Open Interest context
Volume Profile 3D (Zeiierman)█ Overview
Volume Profile 3D (Zeiierman) is a next-generation volume profile that renders market participation as a 3D-style profile directly on your chart. Instead of flat histograms, you get a depth-aware profile with parallax, gradient transparency, and bull/bear separation, so you can see where liquidity stacked up and how it shifted during the move.
Highlights:
3D visual effect with perspective and depth shading for clarity.
Bull/Bear separation to see whether up bars or down bars created the volume.
Flexible colors and gradients that highlight where the most significant trading activity took place.
This is a state-of-the-art volume profile — visually powerful, highly flexible, and unlike anything else available.
█ How It Works
⚪ Profile Construction
The price range (from highest to lowest) is divided into a number of levels (buckets). Each bar’s volume is added to the correct level, based on its average price. This builds a map of where trading volume was concentrated.
You can choose to:
Aggregate all volume at each level, or
Split bullish vs. bearish volume , slightly offset for clarity.
This creates a clear view of which price zones matter most to the market.
⚪ 3D Effect Creation
The unique part of this indicator is how the 3D projection is built. Each volume block’s width is scaled to its relative size, then tilted with a slope factor to create a depth effect.
maxVol = bins.bu.max() + bins.be.max()
width = math.max(1, math.floor(bucketVol / maxVol * ((bar_index - start) * mult)))
slope = -(step * dev) / ((bar_index - start) * (mult/2))
factor = math.pow(math.min(1.0, math.abs(slope) / step), .5)
width → determines how far the volume extends, based on relative strength.
slope → creates the angled projection for the 3D look.
factor → adjusts perspective to make deeper areas shrink naturally.
The result is a 3D-style volume profile where large areas pop forward and smaller areas fade back, giving you immediate visual context.
█ How to Use
⚪ Support & Resistance Zones (HVNs and Value Area)
Regions where a lot of volume traded tend to act like walls:
If price approaches a high-volume area from above, it may act as support.
From below, it may act as resistance.
Traders often enter or exit near these zones because they represent strong agreement among market participants.
⚪ POC Rejections & Mean Reversions
The Point of Control (POC) is the single price level with the highest volume in the profile.
When price returns to the POC and rejects it, that’s often a signal for reversal trades.
In ranging markets, price may bounce between edges of the Value Area and revert to POC.
⚪ Breakouts via Low-Volume Zones (LVNs)
Low volume areas (gaps in the profile) offer path of least resistance:
Price often moves quickly through these thin zones when momentum builds.
Use them to spot breakouts or continuation trades.
⚪ Directional Insight
Use the bull/bear separation to see whether buyers or sellers dominated at key levels.
█ Settings
Use Active Chart – Profile updates with visible candles.
Custom Period – Fixed number of bars.
Up/Down – Adjust tilt for the 3D angle.
Left/Right – Scale width of the profile.
Aggregated – Merge bull/bear volume.
Bull/Bear Shift – Separate bullish and bearish volume.
Buckets – Number of price levels.
Choose from templates or set custom colors.
POC Gradient option makes high volume bolder, low volume lighter.
-----------------
Disclaimer
The content provided in my scripts, indicators, ideas, algorithms, and systems is for educational and informational purposes only. It does not constitute financial advice, investment recommendations, or a solicitation to buy or sell any financial instruments. I will not accept liability for any loss or damage, including without limitation any loss of profit, which may arise directly or indirectly from the use of or reliance on such information.
All investments involve risk, and the past performance of a security, industry, sector, market, financial product, trading strategy, backtest, or individual's trading does not guarantee future results or returns. Investors are fully responsible for any investment decisions they make. Such decisions should be based solely on an evaluation of their financial circumstances, investment objectives, risk tolerance, and liquidity needs.

Oscillator Matrix [Alpha Extract]A comprehensive multi-oscillator system that combines volume-weighted money flow analysis with enhanced momentum detection, providing traders with a unified framework for identifying high-probability market opportunities across all timeframes. By integrating two powerful oscillators with advanced confluence analysis, this indicator delivers precise entry and exit signals while filtering out market noise through sophisticated threshold-based regime detection.
🔶 Volume-Weighted Money Flow Analysis
Utilizes an advanced money flow calculation that tracks volume-weighted price movements to identify institutional activity and smart money flow. This approach provides superior signal quality by emphasizing high-volume price movements while filtering out low-volume market noise.
// Volume-weighted flows
up_volume = price_up ? volume : 0
down_volume = price_down ? volume : 0
// Money Flow calculation
up_vol_sum = ta.sma(up_volume, mf_length)
down_vol_sum = ta.sma(down_volume, mf_length)
total_volume = up_vol_sum + down_vol_sum
money_flow_ratio = total_volume > 0 ? (up_vol_sum - down_vol_sum) / total_volume : 0
🔶 Enhanced Hyper Wave Oscillator
Features a sophisticated MACD-based momentum oscillator with advanced normalization techniques that adapt to different price ranges and market volatility. The system uses percentage-based calculations to ensure consistent performance across various instruments and timeframes.
// Enhanced MACD-based oscillator
fast_ma = ta.ema(src, hw_fast)
slow_ma = ta.ema(src, hw_slow)
macd_line = fast_ma - slow_ma
signal_line = ta.ema(macd_line, hw_signal)
// Proper normalization using percentage of price
price_base = ta.sma(close, 50)
macd_normalized = macd_line / price_base
hyper_wave = macd_range > 0 ? macd_normalized / macd_range : 0
🔶 Multi-Factor Confluence System
Implements an intelligent confluence scoring mechanism that combines signals from both oscillators to identify high-probability trading opportunities. The system assigns strength scores based on multiple confirmation factors, significantly reducing false signals.
🔶 Fixed Threshold Levels
Uses predefined threshold levels optimized for standard oscillator ranges to distinguish between normal market fluctuations and significant momentum shifts. The dual-threshold system provides clear visual cues for overbought/oversold conditions while maintaining consistent signal criteria across different market conditions.
🔶 Overflow Detection Technology
Advanced overflow indicators identify extreme market conditions that often precede major reversals or continuation patterns. These signals highlight moments when market momentum reaches critical levels, providing early warning for potential turning points.
🔶 Dual Oscillator Integration
The indicator simultaneously tracks volume-weighted money flow and momentum-based price action through two independent oscillators. This dual approach ensures comprehensive market analysis by capturing both institutional activity and technical momentum patterns.
// Multi-factor confluence scoring
confluence_bull = (mf_bullish ? 1 : 0) + (hw_bullish ? 1 : 0) +
(mf_overflow_bull ? 1 : 0) + (hw_overflow_bull ? 1 : 0)
confluence_bear = (mf_bearish ? 1 : 0) + (hw_bearish ? 1 : 0) +
(mf_overflow_bear ? 1 : 0) + (hw_overflow_bear ? 1 : 0)
confluence_strength = confluence_bull > confluence_bear ? confluence_bull / 4 : -confluence_bear / 4
🔶 Intelligent Signal Generation
The system generates two tiers of reversal signals: strong signals that require multiple confirmations across both oscillators, and weak signals that identify early momentum shifts. This hierarchical approach allows traders to adjust position sizing based on signal strength.
🔶 Visual Confluence Zones
Background coloring dynamically adjusts based on confluence strength, creating visual zones that immediately communicate market sentiment. The intensity of background shading corresponds to the strength of the confluent signals, making pattern recognition effortless.
🔶 Threshold Visualization
Color-coded threshold zones provide instant visual feedback about oscillator positions relative to key levels. The fill areas between thresholds create clear overbought and oversold regions with graduated color intensity.
🔶 Candle Color Integration
Optional candle coloring applies confluence-based color logic directly to price bars, creating a unified visual framework that helps traders correlate indicator signals with actual price movements for enhanced decision-making.
🔶 Overflow Alert System
Specialized circular markers highlight extreme overflow conditions on both oscillators, drawing attention to potential climax moves that often precede significant reversals or accelerated trend continuation.
🔶 Customizable Display Options
Comprehensive display controls allow traders to toggle individual components on or off, enabling focused analysis on specific aspects of the indicator. This modularity ensures the indicator adapts to different trading styles and analytical preferences.
1 Week
1 Day
15 Min
This indicator provides a complete analytical framework by combining volume analysis with momentum detection in a single, coherent system. By offering multiple confirmation layers and clear visual hierarchies, it empowers traders to identify high-probability opportunities while maintaining precise risk management across all market conditions and timeframes. The sophisticated confluence system ensures that signals are both timely and reliable, making it an essential tool for serious technical analysts.

Analítica Trading — Prev Day Levels🤖📊 Analítica Trading — Previous Day Levels
This indicator clearly and precisely displays the key levels from the previous day:
📈 Previous Day High (green line).
📉 Previous Day Low (red line).
The lines are fixed horizontals, updated automatically at the start of each new session, and remain visible throughout the entire day, providing a reliable reference for trading.
It also includes:
🔔 Configurable alerts when the price breaks any of the levels.
🏷️ Labels on the chart with the exact value of each level.
💡 Ideal for Support and Resistance, Breakout strategies, and Smart Money Concepts (SMC).

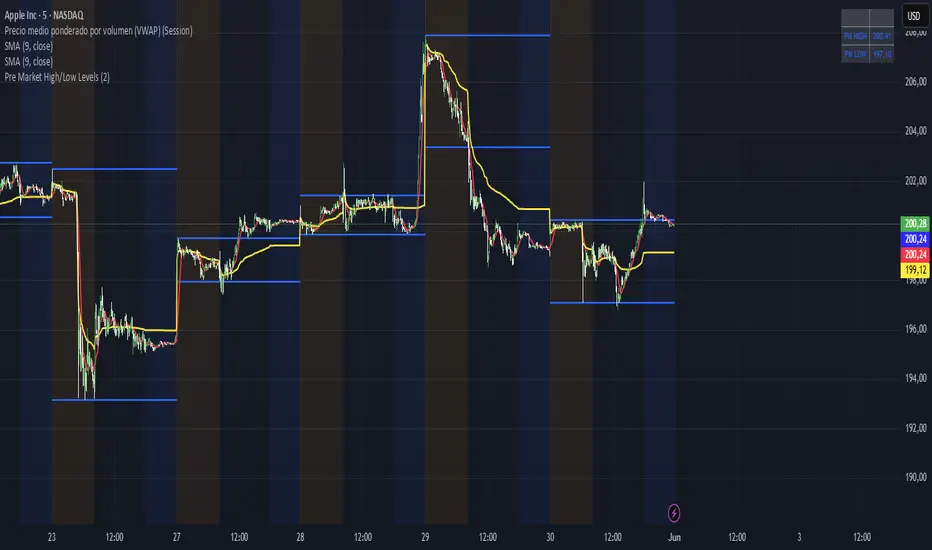
Pre Market High/Low LevelsPre Market High & Pre Market Low By Jadra
Pre Market High/Low Levels Indicator
This indicator automatically identifies pre-market high and low levels (4:00-9:30 AM ET) and marks them with blue horizontal lines that extend throughout the entire trading session. Perfect for NYSE and NASDAQ traders who use these key levels as support and resistance. Features color-coded backgrounds: yellow for pre-market, transparent for regular hours, and blue for post-market. Lines remain visible from pre-market through market close, providing constant visual references for making trading decisions based on these important psychological levels. Essential tool for day traders focusing on overnight price action and gap analysis in US equity markets.
Canuck Trading IndicatorOverview
The Canuck Trading Indicator is a versatile, overlay-based technical analysis tool designed to assist traders in identifying potential trading opportunities across various timeframes and market conditions. By combining multiple technical indicators—such as RSI, Bollinger Bands, EMAs, VWAP, MACD, Stochastic RSI, ADX, HMA, and candlestick patterns—the indicator provides clear visual signals for bullish and bearish entries, breakouts, long-term trends, and options strategies like cash-secured puts, straddles/strangles, iron condors, and short squeezes. It also incorporates 20-day and 200-day SMAs to detect Golden/Death Crosses and price positioning relative to these moving averages. A dynamic table displays key metrics, and customizable alerts help traders stay informed of market conditions.
Key Features
Multi-Timeframe Adaptability: Automatically adjusts parameters (e.g., ATR multiplier, ADX period, HMA length) based on the chart's timeframe (minute, hourly, daily, weekly, monthly) for optimal performance.
Comprehensive Signal Generation: Identifies short-term entries, breakouts, long-term bullish trends, and options strategies using a combination of momentum, trend, volatility, and candlestick patterns.
Candlestick Pattern Detection: Recognizes bullish/bearish engulfing, hammer, shooting star, doji, and strong candles for precise entry/exit signals.
Moving Average Analysis: Plots 20-day and 200-day SMAs, detects Golden/Death Crosses, and evaluates price position relative to these averages.
Dynamic Table: Displays real-time metrics, including zone status (bullish, bearish, neutral), RSI, MACD, Stochastic RSI, short/long-term trends, candlestick patterns, ADX, ROC, VWAP slope, and MA positioning.
Customizable Alerts: Over 20 alert conditions for entries, exits, overbought/oversold warnings, and MA crosses, with actionable messages including ticker, price, and suggested strategies.
Visual Clarity: Uses distinct shapes, colors, and sizes to plot signals (e.g., green triangles for bullish entries, red triangles for bearish entries) and overlays key levels like EMA, VWAP, Bollinger Bands, support/resistance, and HMA.
Options Strategy Signals: Suggests opportunities for selling cash-secured puts, straddles/strangles, iron condors, and capitalizing on short squeezes.
How to Use
Add to Chart: Apply the indicator to any TradingView chart by selecting "Canuck Trading Indicator" from the Pine Script library.
Interpret Signals:
Bullish Signals: Green triangles (short-term entry), lime diamonds (breakout), blue circles (long-term entry).
Bearish Signals: Red triangles (short-term entry), maroon diamonds (breakout).
Options Strategies: Purple squares (cash-secured puts), yellow circles (straddles/strangles), orange crosses (iron condors), white arrows (short squeezes).
Exits: X-cross shapes in corresponding colors indicate exit signals.
Monitor: Gray circles suggest holding cash or monitoring for setups.
Review Table: Check the top-right table for real-time metrics, including zone status, RSI, MACD, trends, and MA positioning.
Set Alerts: Configure alerts for specific signals (e.g., "Short-Term Bullish Entry" or "Golden Cross") to receive notifications via TradingView.
Adjust Inputs: Customize input parameters (e.g., RSI period, EMA length, ATR period) to suit your trading style or market conditions.
Input Parameters
The indicator offers a wide range of customizable inputs to fine-tune its behavior:
RSI Period (default: 14): Length for RSI calculation.
RSI Bullish Low/High (default: 35/70): RSI thresholds for bullish signals.
RSI Bearish High (default: 65): RSI threshold for bearish signals.
EMA Period (default: 15): Main EMA length (15 for day trading, 50 for swing).
Short/Long EMA Length (default: 3/20): For momentum oscillator.
T3 Smoothing Length (default: 5): Smooths momentum signals.
Long-Term EMA/RSI Length (default: 20/15): For long-term trend analysis.
Support/Resistance Lookback (default: 5): Periods for support/resistance levels.
MACD Fast/Slow/Signal (default: 12/26/9): MACD parameters.
Bollinger Bands Period/StdDev (default: 15/2): BB settings.
Stochastic RSI Period/Smoothing (default: 14/3/3): Stochastic RSI settings.
Uptrend/Short-Term/Long-Term Lookback (default: 2/2/5): Candles for trend detection.
ATR Period (default: 14): For volatility and price targets.
VWAP Sensitivity (default: 0.1%): Threshold for VWAP-based signals.
Volume Oscillator Period (default: 14): For volume surge detection.
Pattern Detection Threshold (default: 0.3%): Sensitivity for candlestick patterns.
ROC Period (default: 3): Rate of change for momentum.
VWAP Slope Period (default: 5): For VWAP trend analysis.
TradingView Publishing Compliance
Originality: The Canuck Trading Indicator is an original script, combining multiple technical indicators and custom logic to provide unique trading signals. It does not replicate existing public scripts.
No Guaranteed Profits: This indicator is a tool for technical analysis and does not guarantee profits. Trading involves risks, and users should conduct their own research and risk management.
Clear Instructions: The description and usage guide are detailed and accessible, ensuring users understand how to apply the indicator effectively.
No External Dependencies: The script uses only built-in Pine Script functions (e.g., ta.rsi, ta.ema, ta.vwap) and requires no external libraries or data sources.
Performance: The script is optimized for performance, using efficient calculations and adaptive parameters to minimize lag on various timeframes.
Visual Clarity: Signals are plotted with distinct shapes and colors, and the table provides a concise summary of market conditions, enhancing usability.
Limitations and Risks
Market Conditions: The indicator may generate false signals in choppy or low-liquidity markets. Always confirm signals with additional analysis.
Timeframe Sensitivity: Performance varies by timeframe; test settings on your preferred chart (e.g., 5-minute for day trading, daily for swing trading).
Risk Management: Use stop-losses and position sizing to manage risk, as suggested in alert messages (e.g., "Stop -20%").
Options Trading: Options strategies (e.g., straddles, iron condors) carry unique risks; consult a financial advisor before trading.
Feedback and Support
For questions, suggestions, or bug reports, please leave a comment on the TradingView script page or contact the author via TradingView. Your feedback helps improve the indicator for the community.
Disclaimer
The Canuck Trading Indicator is provided for educational and informational purposes only. It is not financial advice. Trading involves significant risks, and past performance is not indicative of future results. Always perform your own due diligence and consult a qualified financial advisor before making trading decisions.
