Smart Trader, Episode 02, by Ata Sabanci | Battle of Candles ⚠️ CRITICAL: READ BEFORE USING ⚠️
This indicator is 100% VOLUME-BASED and requires Lower Timeframe (LTF) intrabar data for accurate calculations. Please understand the following limitations before using:
📊 DATA ACCURACY LEVELS:
• 1T (Tick) — Most accurate, real volume distribution per tick
• 1S (1 Second) — Reasonably accurate approximation
• 15S (15 Seconds) — Good approximation, longer historical data available
• 1M (1 Minute) — Rough approximation, maximum historical data range
⚠️ BACKTEST & REPLAY LIMITATIONS:
• Replay mode results may differ from live trading due to data availability
• For longer back test periods, use higher LTF settings (15S or 1M)
• Not all symbols/exchanges support tick-level data
• Crypto and Forex typically have better LTF data availability than stocks
💡 A NOTE ON TOOLS:
Successful trading requires proper tools. Higher TradingView plans provide access to more historical intrabar data, which directly impacts the accuracy of volume-based calculations. More precise volume data leads to more reliable signals. Consider this when evaluating your trading infrastructure.
📌 OVERVIEW
Smart Trader Episode 02: Battle of Candles is an advanced educational indicator that combines multiple analysis engines to help traders identify market scenarios and understand market dynamics. This is NOT financial advice or a trading signal service — it's a learning tool designed to help you understand how institutional traders might interpret price action.
The indicator integrates 7 major analysis engines into a unified dashboard, providing real-time insights into volume flow, trend structure, market phases, and potential trade setups.
⚡ KEY FEATURES
🎯 16-Pattern Scenario Engine
Automatically detects and classifies market conditions into 16 distinct scenarios, from strong continuation moves to potential reversals and traps.
💰 Trade Advisor Panel
Aggregates all signals into actionable suggestions with confidence levels, suggested entry/SL/TP levels, and risk/reward calculations.
📊 Volume Engine
Splits volume into buy/sell components using either Geometry (candle shape) or Intrabar (LTF data) methods for precise delta analysis.
📈 CVD (Cumulative Volume Delta)
Tracks the running total of buying vs selling pressure to identify accumulation, distribution, and divergences.
🎯 Stop-Hunt Detection
Identifies potential stop-hunt patterns where price sweeps liquidity levels before reversing.
📐 Pure Structure Trend Engine
Zero-lag trend detection based on swing highs/lows (HH/HL/LH/LL) without any lagging indicators.
⚡ Effort vs Result Analysis
Measures energy spent (volume) versus ground taken (price movement) to detect stalls, breakthroughs, and exhaustion.
🎯 SCENARIO ENGINE — 16 Market Patterns
The Scenario Engine analyzes multiple factors (candle anatomy, volume, forces, CVD, wick analysis) to classify each candle into one of 16 scenarios:
Continuation Scenarios (1-3)
1. ⚔️ STRONG MOVE — Big body candle (>60%) with volume confirming direction. Indicates strong momentum continuation.
2. 🛡️ ABSORPTION — One side attacks but the other absorbs the pressure. Price holds despite volume. Continuation expected in the absorbing side's favor.
3. 📉 PULLBACK — Small move against the trend with low volume. Indicates a healthy retracement before trend continuation.
Reversal Scenarios (4-6, 13-16)
4. 💥 REJECTION — Big wick (>40%) with small body and high volume. Price was rejected
at a level, potential reversal.
5. 🪤 TRAP — Pin direction disagrees with delta. Extreme wick size. Looks bullish/bearish but the opposite may happen.
6. 😫 EXHAUSTION — High energy spent (volume) but low ground taken (price movement). Both sides active but momentum fading.
13. 🔄 CVD BULL DIV — Price falling but CVD rising. Hidden buying detected (accumulation). Potential bullish reversal.
14. 🔄 CVD BEAR DIV — Price rising but CVD falling. Hidden selling detected (distribution). Potential bearish reversal.
15. 🎯 STOP HUNT BULL — Shorts were liquidated below support. Price swept liquidity and reversed. Expect bullish move.
16. 🎯 STOP HUNT BEAR — Longs were liquidated above resistance. Price swept liquidity and reversed. Expect bearish move.
Range/Stalemate Scenarios (7-9)
7. ⚖️ DEADLOCK — Market in balance. Force ratio between 0.4-0.6. Low volume. No side winning.
8. 🔥 BATTLE — High volume fight in a range. Both sides attacking. Wicks on both ends of candle.
9. 🎯 WAITING — Building phase with quiet volume. Market is preparing but no trigger yet. Wait for breakout.
Pre-Breakout Scenarios (10-12)
10. 🚀 BULL SETUP — Buyers accumulating in a building phase. Positive delta building. Bullish pressure growing.
11. 💣 BEAR SETUP — Sellers distributing in a building phase. Negative delta building. Bearish pressure growing.
12. ⚡ BREAKOUT — Price at boundary with strong candle and volume supporting. Imminent breakout expected.
💰 TRADE ADVISOR ENGINE
The Trade Advisor aggregates all signals from the different engines into a single actionable output. It uses a weighted scoring system:
Scoring Weights:
• Scenario Signal: 30%
• Trend Alignment: 20%
• CVD Momentum: 15% + Divergence Bonus
• Pin Forces: 15%
• Liquidity Sweep: 12%
• Stop-Hunt Detection: 10%
• Effort vs Result: 10%
Possible Actions:
• ⏳ WAIT — Edge not strong enough (stay patient)
• 🟢 LONG ENTRY — Buyers have strong advantage + signals align
• 🔴 SHORT ENTRY — Sellers have strong advantage + signals align
• ⚠️ CLOSE LONG/SHORT — Position at risk (reversal/trend flip)
• 🛑 STOP LOSS — Price hit risk threshold
• 💰 TAKE PROFIT — Target threshold reached
📊 EXTENDED INFO PANEL (Detailed Explanations)
The Extended Info panel is hidden by default (toggle: Show Extended Info in settings). It provides detailed metrics that feed into the main engines:
CVD ANALYSIS
What is CVD?
Cumulative Volume Delta (CVD) is the running total of Buy Volume minus Sell Volume. It reveals the underlying buying/selling pressure that may not be visible in price alone.
CVD Value & Slope:
• ↗ Rising: CVD increasing = net buying pressure (bullish)
• ↘ Falling: CVD decreasing = net selling pressure (bearish)
• → Flat: No clear pressure direction
Accumulation vs Distribution:
• Accumulation %: Shows buying pressure strength (0-100). High accumulation with CVD rising = strong bullish bias.
• Distribution %: Shows selling pressure strength (0-100). High distribution with CVD falling = strong bearish bias.
Divergence Alerts:
• ⚠️ BULLISH DIVERGENCE: Price falling but CVD rising. Hidden buying = potential reversal UP.
• ⚠️ BEARISH DIVERGENCE: Price rising but CVD falling. Hidden selling = potential reversal DOWN.
WICK ANALYSIS
Wick Torque:
Torque measures the "rotational force" from wicks. It's calculated from wick length, volume, and body efficiency.
• Positive Torque (Bullish): Bottom wick power dominates. Buyers defended lower prices.
• Negative Torque (Bearish): Top wick power dominates. Sellers defended higher prices.
• ⚡ High Torque (>30): Strong signal, significant wick rejection occurred.
Stop-Hunt Detection:
The engine detects when price has likely swept stop-losses clustered at key levels:
• Stop Hunt Risk %: Likelihood score (0-100). Above 55% = confirmed hunt.
• "Shorts hunted": Price swept below support, liquidating shorts, expect bounce UP.
• "Longs hunted": Price swept above resistance, liquidating longs, expect drop DOWN.
LIQUIDITY SWEEPS
This section appears only when a liquidity sweep is detected. The engine monitors for price sweeping recent highs/lows and then reversing:
• 🎯 LIQUIDITY SWEPT ABOVE: Price broke recent highs but closed back below. Longs trapped, expect DOWN.
• 🎯 LIQUIDITY SWEPT BELOW: Price broke recent lows but closed back above. Shorts trapped, expect UP.
POWER BALANCE
The Power Balance meter shows the real-time strength comparison between buyers and sellers.
Force Ratio:
• 0% = Complete seller dominance
• 50% = Perfect balance
• 100% = Complete buyer dominance
Visual Bar:
• Left side (▓): Bear territory
• Right side (▓): Bull territory
• The bar is smoothed over recent history to reduce noise.
EFFORT vs RESULT
This section measures the efficiency of price movement relative to volume expended.
Energy:
How much volume was spent relative to the average. Energy > 1.0x means above-average volume activity.
Ground:
How much price movement occurred relative to average range. Ground > 1.0x means above-average price movement.
STALL Warning:
A STALL is detected when high energy is spent but low ground is taken (high effort, low result). This often indicates institutional battle, exhaustion, or imminent reversal.
MARKET PHASE
The Phase Engine classifies the current market regime:
RANGE : No clear trend. Price confined to middle of channel. Low ADX. Balanced forces. Trade breakouts with caution.
BUILDING : Compression/preparation phase. Channel tightening or boundary penetration without follow-through. Watch for breakout direction.
TRENDING : Active directional move. Clear slope, good efficiency, price on trending side of channel. Favor pullback entries.
Strength:
0-100% score combining slope, volume validity, and force/efficiency filters.
Bars: How many candles the current phase has persisted.
TRACK RECORD (Validation Panel)
Enable with Show Validation Panel in settings. This section tracks the historical accuracy of scenario predictions:
Accuracy: Percentage of validated predictions that were correct.
Best/Worst Scenario: Shows which scenarios have the highest and lowest accuracy on the current symbol.
Recent Signals: Last 5 predictions with their outcomes. ✓ = correct, ✗ = wrong, ⏳ = pending validation.
⚙️ SETTINGS GUIDE
📊 Volume Analysis
Volume Calculation: Choose Geometry (estimates from candle shape) or Intrabar (precise LTF data).
Intrabar Resolution: LTF for precise mode. Try 1S, 15S, or 1T. Must be lower than chart timeframe.
History Depth: Candles stored in memory (5-50). Higher = more context, slower.
Memory Lookback: Bars for moving averages and Z-scores (10-100).
🏷️ Market Phase
Range Zone Width: How much of channel center is considered "range" (0.1-0.8).
Trend Sensitivity: Minimum slope to detect trending. Lower = more sensitive.
Min Episode Length: Minimum bars before phase can change. Prevents flickering.
🎯 Scenarios
Min Confidence to Show: Only display scenarios above this confidence level (30-90).
Bars to Validate: How many bars to wait before checking if prediction was correct.
Success Move %: Minimum price movement to consider prediction successful.
💰 Trade Advisor
Min Confidence for Entry: Minimum confidence to suggest a trade entry (50-90).
Default Risk %: Stop loss distance as % of price (0.5-5.0).
Min Risk/Reward: Minimum acceptable R:R ratio (1.0-5.0).
🔔 ALERT CONDITIONS
The indicator provides the following alert conditions you can configure:
• 🟢 LONG Entry Signal
• 🔴 SHORT Entry Signal
• ⚠️ Close LONG Signal
• ⚠️ Close SHORT Signal
• 🛑 STOP LOSS Alert
• 💰 Take Profit Alert
• 🚨 High Urgency Signal
⚠️ IMPORTANT DISCLAIMER
EDUCATIONAL TOOL ONLY
This indicator is designed for educational purposes to help users identify different market scenarios and understand how various signals might be interpreted.
The Trade Advisor is NOT a recommendation to buy, sell, or invest.
• Past performance does not guarantee future results
• All trading involves risk of loss
• The creator is not a licensed financial advisor
• Always do your own research (DYOR)
• Consult a qualified financial advisor before making any investment decisions
By using this indicator, you acknowledge that you understand these risks and accept full responsibility for your trading decisions.
In den Scripts nach "key levels" suchen

4H & Daily Previous Candle + Fibonacci + OTE# Multi-Timeframe OTE & Fibonacci Indicator (4H & Daily)
This Pine Script v5 indicator is designed for traders who utilize **Optimal Trade Entry (OTE)** zones and **Fibonacci retracements** based on higher timeframe market structures. It automatically identifies and plots key levels from the previous 4-hour and Daily candles to help find high-probability reversal zones.
## Key Features
### 1. Dual Timeframe OTE Zones
- **4H OTE Zone**: Automatically calculates and shades the Optimal Trade Entry area (default 61.8% - 78.6%) based on the previous 4-hour candle's range.
- **Daily OTE Zone**: Plots a secondary OTE zone based on the previous Daily candle, allowing for multi-timeframe confluence analysis.
- **Dynamic Adaptation**: The zones automatically flip based on whether the previous candle was bullish or bearish, ensuring you are always looking at the correct retracement levels.
### 2. Automated Market Structure
- **High/Low Tracking**: Plots clear horizontal lines for the previous 4H and Daily Highs and Lows.
- **Visual Distinction**: Daily levels are highlighted with thicker lines to distinguish them from 4H levels.
- **Price Labels**: Displays real-time price labels for all structural levels for quick reference.
### 3. Customizable Fibonacci Retracements
- **4H Fibonacci Levels**: Plots standard retracement levels (23.6%, 38.2%, 50%, 61.8%, 78.6%) for the 4H timeframe.
- **Fully Adjustable**: Users can input custom Fibonacci levels via the settings menu.
### 4. Real-Time Information Dashboard
- **Range Summary**: A clean table in the top-right corner displays the total pip/point range for both the previous 4H and Daily candles.
- **Clean UI**: All visual elements (colors, line widths, labels) can be toggled or customized to fit any chart theme.
## How to Use
This indicator is ideal for "Smart Money" or "ICT" style trading. Look for **confluence** where the 4H OTE zone overlaps with the Daily OTE zone or other key structural levels to identify high-precision entry points.

Statistcal Daily Profile & Ranges# Statistical Daily Profile & Ranges - TradingView Publication Guide
## Overview
The **Statistical Daily Profile & Ranges** indicator is a comprehensive tool designed to analyze intraday session behavior and daily range characteristics. It combines Average Daily Range (ADR) projection levels with detailed session-by-session statistics and probability-based trading insights derived from historical price action patterns.
## What This Indicator Does
This indicator provides traders with three core analytical components:
1. **ADR Projection Levels** - Dynamic support/resistance levels based on historical daily ranges
2. **Session Range Analysis** - Visual boxes and statistical breakdowns for four key trading sessions
3. **Dynamic Probability Display** - Real-time probability statistics based on overnight session relationships
## How It Works
### Average Daily Range (ADR) Calculation
The indicator calculates the average daily range over a user-defined lookback period (default: 10 days) and projects this range from each day's opening price. This creates two key levels:
- **ADR High**: Opening price + average daily range
- **ADR Low**: Opening price - average daily range
- **ADR Median**: The opening price (middle of the projected range)
These levels are recalculated at the start of each trading day and extend forward, providing dynamic support and resistance zones based on recent volatility characteristics.
### Session Tracking & Statistics
The indicator monitors four distinct trading sessions (times in Eastern Time):
1. **Asia Session** (8:00 PM - 2:00 AM)
2. **London Session** (2:00 AM - 8:00 AM)
3. **NY Open** (8:00 AM - 9:00 AM)
4. **NY Initial Balance** (9:30 AM - 10:30 AM)
For each session, the indicator:
- Draws a colored box showing the session's high-to-low range
- Tracks the opening price, high, and low
- Stores historical data for statistical analysis
- Calculates average ranges by day of week (Monday through Friday)
The session statistics are displayed in a customizable table showing average point ranges for each session across different weekdays, helping traders identify which sessions and days typically produce the most movement.
### Dynamic Probability System
The indicator analyzes the relationship between the Asia and London sessions to determine the current market setup. After the London session closes, it automatically detects one of four possible conditions:
**1. London Engulfs Asia**
- London session breaks both above Asia's high AND below Asia's low
- This indicates strong momentum during the European session
- Most common occurrence pattern
**2. Asia Engulfs London**
- Asia session range completely contains the London session range
- Indicates consolidation during London hours
- Relatively rare pattern (occurs approximately 5.36% of the time)
**3. London Partially Engulfs Upwards**
- London breaks above Asia's high but stays above Asia's low
- Suggests bullish momentum continuation from Asia into London
**4. London Partially Engulfs Downwards**
- London breaks below Asia's low but stays below Asia's high
- Suggests bearish momentum continuation from Asia into London
Once a condition is detected, the indicator displays a probability table showing historically observed outcomes for that specific setup, including:
- Probability of NY session taking out key levels (Asia high/low, London high/low)
- Probability of NY session engulfing the entire overnight range
- Directional bias for NY Cash session (9:30 AM - 4:00 PM)
## How to Use This Indicator
### Initial Setup
1. Add the indicator to your chart (works on any intraday timeframe below Daily)
2. Adjust the **ADR Days** setting (default: 10) to control the lookback period for range calculation
3. Adjust the **Session Lookback Days** setting (default: 50) to determine how much historical data feeds the statistics tables
### Reading the ADR Levels
- Use the **ADR High** and **ADR Low** lines as potential profit targets or areas where price may encounter resistance
- The **ADR Median** line represents the opening price and can act as a pivot point for intraday directional bias
- If price reaches the ADR High early in the session, it suggests strong bullish momentum; conversely for ADR Low
- These levels adapt daily based on recent volatility, making them more responsive than static levels
### Interpreting Session Boxes
- **Session boxes** visually highlight when each trading session is active and its price range
- Larger boxes indicate higher volatility during that session
- Compare current session ranges to the statistical averages shown in the table
- Sessions that are unusually quiet or active relative to historical averages may signal compression or expansion
### Using the Session Statistics Table
- The table shows average point ranges for each session broken down by weekday
- Identify which sessions typically produce the most movement on specific days
- For example, if London on Thursdays averages 40 points while Mondays average 25 points, you can adjust position sizing or expectations accordingly
- The **Total** column shows the overall average across all days
- Sample sizes (shown in brackets if enabled) indicate data reliability
### Trading with the Probability Table
The probability table updates dynamically after the London session closes and shows statistically probable outcomes based on 12 years of NQ futures data.
**Important Limitations:**
- **These probabilities are derived from NQ (Nasdaq E-mini futures) data only**
- **Do NOT apply these probability statistics to other instruments** (ES, stocks, forex, etc.)
- The probabilities represent historical frequencies, not guarantees
- Always combine with your own analysis, risk management, and market context
**How to Apply the Probabilities:**
When **London Engulfs Asia**:
- Watch for NY session to take out London's extremes (72.33% probability for high, 71.12% for low)
- Slight bullish bias in NY Cash session (54.80% vs 45.20%)
- Lower probability of complete overnight engulfment (44.13%)
When **Asia Engulfs London** (rare - 5.36% occurrence):
- Higher probability NY takes Asia's high (75.86%)
- Moderately high probability NY takes Asia's low (65.52%)
- Slight increase in bullish bias (58.42% vs 41.58%)
- Recognize this as an unusual setup
When **London Partially Engulfs Upwards**:
- Very high probability NY takes London high (81.51%)
- Strong probability NY takes London low (64.45%)
- Moderate probability NY takes Asian low (53.16%)
- Slight bullish bias (55.52%)
When **London Partially Engulfs Downwards**:
- Very high probability NY takes London low (75.29%)
- Strong probability NY takes London high (68.80%)
- Moderate probability NY takes Asian high (56.44%)
- Slight bullish bias maintained (52.99%)
### Practical Trading Applications
**Scenario 1: Range Projection**
If the ADR is 500 points and the market opens at 25,000:
- ADR High: 25,500 (potential resistance/target)
- ADR Low: 24,500 (potential support/target)
- Monitor how price interacts with these levels throughout the day
**Scenario 2: Session-Based Trading**
Using the statistics table, you notice London on Wednesdays averages 35 points. During a Wednesday London session:
- If London has already moved 30 points, the session may be exhausting its typical range
- If London has only moved 15 points with an hour remaining, there may be expansion potential
- Adjust stop losses and targets based on typical session behavior
**Scenario 3: Probability-Based Setup**
It's 8:05 AM ET and the indicator shows "London Partially Engulfs Upwards":
- You now know there's an 81.51% historical probability NY will take out London's high
- There's a 53.16% probability NY will reach down to Asia's low
- The NY Cash session has a slight bullish bias (55.52%)
- Consider this alongside your technical analysis for directional bias and level targeting
## Customization Options
### Visual Settings
- **Line Width**: Adjust thickness of ADR levels
- **ADR Color/Style**: Customize appearance of ADR projection lines (solid, dashed, dotted)
- **Median Line**: Toggle visibility and customize appearance separately
- **Session Box Colors**: Customize each session's box color independently
- **Show Session Boxes**: Toggle session box visibility on/off
### Label Settings
- **ADR Labels**: Show/hide labels for ADR High and ADR Low, adjust size
- **Median Label**: Separate control for median line label
- **Session Labels**: Show/hide session name labels, adjust size
- **Label Colors**: Customize text colors for all labels
### Table Settings
- **Session Stats Table**: Position (9 locations available), size (Tiny to Huge), toggle on/off
- **Sample Sizes**: Show/hide the number of historical samples used for each calculation
- **Probabilities Table**: Separate position and size controls, toggle on/off
### Session Times
- Each session's time range can be customized to fit different markets or preferences
- All times are in Eastern Time (America/New_York timezone)
## Technical Notes
### Data Requirements
- The indicator requires sufficient historical data based on your lookback settings
- Minimum recommended: 50+ days of intraday data for reliable statistics
- Works on any timeframe below Daily (1-minute, 5-minute, 15-minute, etc.)
### Calculation Methodology
- **ADR Calculation**: Simple average of absolute daily high-low ranges
- **Session Statistics**: Mean average of ranges for each session filtered by day of week
- **Condition Detection**: Boolean logic comparing session high/low relationships
- All calculations update in real-time as new bars form
### Probability Data Source
The probability statistics displayed in the dynamic table are derived from:
- **Dataset**: 12 years of NQ (Nasdaq E-mini futures) historical data
- **Methodology**: Frequency analysis of outcomes following specific setup conditions
- **Time Period**: Multiple market cycles including various volatility regimes
**Critical Warning**: These probabilities are specific to NQ and reflect that instrument's behavior patterns. Market microstructure, participant behavior, and volatility characteristics differ significantly across instruments. Do not apply these NQ-derived probabilities to other markets (ES, RTY, YM, individual stocks, forex, commodities, etc.).
## Best Practices
1. **Combine with Other Analysis**: Use this indicator as one component of a complete trading methodology, not a standalone system
2. **Respect Risk Management**: Probabilities are not certainties; always use proper position sizing and stop losses
3. **Context Matters**: High-impact news events, holiday trading, and extreme volatility can invalidate typical patterns
4. **Verify Statistics**: Monitor your own results and compare to the displayed probabilities
5. **Adapt Session Times**: If trading instruments with different active hours, adjust session times accordingly
6. **Regular Calibration**: Periodically review if the session averages and probabilities remain relevant to current market conditions
## Understanding Originality
This indicator is original in its approach to combining three analytical frameworks into a single tool:
1. **Dynamic ADR Projection**: Unlike static pivot points, these levels adapt daily based on recent volatility
2. **Session-Specific Statistics**: Goes beyond simple volume profiles by quantifying average ranges for specific time windows across weekdays
3. **Conditional Probability Display**: Automatically detects overnight session relationships and displays relevant probability data rather than showing all scenarios simultaneously
The conditional logic system that determines which probability set to display is a key differentiator—traders only see the statistics relevant to the current market setup, reducing information overload and improving decision-making clarity.
## Summary
The **Statistical Daily Profile & Ranges** indicator provides traders with a comprehensive framework for understanding daily range potential, session-specific behavior patterns, and probability-based setup analysis. By combining ADR projection levels with detailed session statistics and dynamic probability displays, traders gain multiple perspectives on potential price movement within the trading day.
The indicator is most effective when used to:
- Set realistic profit targets based on average daily range
- Identify which sessions typically produce movement on specific weekdays
- Understand probability-weighted outcomes for different overnight setup conditions (NQ only)
- Visualize session ranges and compare them to historical averages
Remember that all statistical analysis reflects historical patterns, and market behavior can change. Always combine indicator signals with sound risk management, proper position sizing, and your own market analysis.

Plan Your Trade, Trade Your Plan. Levels. - by TenAMTrader📍 Plan Your Trade, Trade Your Plan. Levels. — by TenAMTrader
Successful trading is rarely about predicting — it’s about preparing.
"Plan Your Trade, Trade Your Plan. Levels" is designed to bridge the gap between analysis and execution by forcing clarity before the trade ever happens. Instead of reacting to price in real time, this tool encourages traders to define their plan, map their key levels, and then simply trade what they already decided.
🧠 Why Planning Matters
Most trading mistakes don’t come from bad analysis — they come from abandoning a plan mid-trade. Emotions take over when levels aren’t clearly defined ahead of time.
This indicator is built around a simple philosophy:
Make the plan first. Trade the plan second.
By writing your thesis directly into the indicator and visually anchoring it to price, you remove ambiguity and hesitation when the market starts moving.
📊 What This Indicator Does
Converts your written trade plan or market outlook into clearly plotted price levels
Automatically identifies:
Pivot level (key decision point)
Resistance levels (above pivot)
Support levels (below pivot)
Displays contextual notes directly on the chart so you always remember why a level matters
Keeps your focus on execution, not interpretation
✍️ How to Use It
Paste your daily or weekly plan into the Input your Plan/Levels box
Let the script extract and plot the levels automatically
Observe how price behaves around predefined zones
Execute only what aligns with your original plan
No guesswork. No moving targets.
🎯 Designed For
Traders who value structure and discipline
Futures, index, and equity traders who trade key levels
Traders focused on process over prediction
⚠️ Important Disclaimer
This indicator is provided for educational and informational purposes only and does not constitute financial advice, investment advice, or a recommendation to buy or sell any security, futures contract, or financial instrument.
Trading involves substantial risk and is not suitable for all investors. Past performance is not indicative of future results. All trading decisions, risk management, and position sizing are the sole responsibility of the user.
By using this indicator, you acknowledge that TenAMTrader assumes no liability for any losses, damages, or decisions made based on its use.
Trade prepared. Trade disciplined.
"Plan Your Trade, Trade Your Plan.
— TenAMTrader

Periodic Volume Time Velocity ProfileThis is the Periodic Volume Time Velocity Profile (PVTVP). It is an advanced professional profiling tool that goes beyond standard volume analysis by introducing Time and Velocity (Flow Rate) as profile dimensions.
By analyzing high-resolution intra-bar data, it builds
precise profiles for any custom period (Session, Day, Week, etc.),
helping you understand not just *where* the market traded,
but *how* it traded there.
## The 3 Dimensions of the Market
Unlike standard tools that only show Volume, PVTVP allows you
to switch between three critical metrics:
1. **VOLUME Profile (The "Where"):**
* Shows standard acceptance. High volume nodes (HVN)
are magnets for price.
2. **TIME Profile (The "How Long"):**
* Similar to TPO, it measures how long price spent at each
level.
* **High Time:** True acceptance and fair value.
* **Low Time:** Rejection or rapid movement.
3. **VELOCITY Profile (The "How Fast"):**
* Measures the **speed of trading** (Contracts per Second).
This reveals the hidden intent of market participants.
* **High Velocity (Fast Flow):** Aggression. Initiative
buyers/sellers are hitting market orders rapidly. Often
seen at breakouts or in liquidity vacuums.
* **Low Velocity (Slow Flow):** Absorption. Massive passive
limit orders are slowing price down despite high volume.
Often seen at major reversals ("hitting a brick wall").
## Key Features
1. **Statistical Volume Profile Engine:** For each bar in the selected
period, the indicator builds a complete volume profile on a lower
'Intra-Bar Timeframe'. Instead of simple tick counting, it uses
**statistical models ('PDF' allocation)** to distribute volume
across price levels and **advanced classifiers ('Dynamic' split)**
to determine the buy/sell pressure within that profile.
2. **Flexible Profile Display:** The **finalized profile** (plotted at
the end of each period) can be visualized in three distinct
ways: 'Up/Down' (buy vs. sell), 'Total' (combined volume),
and 'Delta' (net difference).
3. **Developing Key Levels:** The indicator also plots the developing
Point of Control (POC), Value Area (VA), VWAP, and Standard
Deviation bands in real-time as the period unfolds, providing
live insights into the emerging market structure.
4. **Dynamic Row Sizing:** Includes an option ('Rows per Percent')
to automatically adjust the number of profile rows (buckets)
based on the profile's price range, maintaining a consistent
visual density.
5. **Integrated Alerts:** Includes 12 alerts that trigger when the
main price crosses over or under the key developing levels:
POC, VWAP, Value Area High/Low, and the +/- Standard
Deviation bands.
**Caution: Real-Time Data Behavior (Intra-Bar Repainting)**
This indicator uses high-resolution intra-bar data. As a result, the
values on the **current, unclosed bar** (the real-time bar) will
update dynamically as new intra-bar data arrives. This behavior is
normal and necessary for this type of analysis. Signals should only
be considered final **after the main chart bar has closed.**
---
**DISCLAIMER**
1. **For Informational/Educational Use Only:** This indicator is
provided for informational and educational purposes only. It does
not constitute financial, investment, or trading advice, nor is
it a recommendation to buy or sell any asset.
2. **Use at Your Own Risk:** All trading decisions you make based on
the information or signals generated by this indicator are made
solely at your own risk.
3. **No Guarantee of Performance:** Past performance is not an
indicator of future results. The author makes no guarantee
regarding the accuracy of the signals or future profitability.
4. **No Liability:** The author shall not be held liable for any
financial losses or damages incurred directly or indirectly from
the use of this indicator.
5. **Signals Are Not Recommendations:** The alerts and visual signals
(e.g., crossovers) generated by this tool are not direct
recommendations to buy or sell. They are technical observations
for your own analysis and consideration.

Auto Fib Retracement-custom lines📈 Auto Fib Retracement (with Custom Line Thickness)
This indicator provides an automatic application of Fibonacci Retracement and Extension levels based on key Pivot points on the chart. It uses advanced logic to identify relevant momentum based on user-defined parameters, ensuring dynamic and accurate level drawing without the need for manual measurement.
Key Features of the Indicator ✨
Automatic Drawing: Fibonacci levels are automatically drawn based on the last significant Pivot swing detected by the indicator.
Fibonacci Retracement and Extension: Displays classic retracement levels (such as 0.382, 0.5, 0.618) and extensions (such as 1.272, 1.618, 2.618, etc.), with the option to individually toggle the visibility of each level.
Custom Line Width (New Feature): This is the key added functionality! For every Fibonacci level, an option has been included to individually adjust the line thickness (width). This allows traders to visually highlight (bold) critical support/resistance levels (like 0, 0.618, 1, etc.) to make them more noticeable on the chart.
Pivot Customization: Control the sensitivity of Pivot detection using the "Deviation" and "Depth" parameters.
Line Extension: Options to extend the Fibonacci lines to the left, right, or both sides.
Detail Display: Ability to show/hide Fibonacci values (levels) and prices on the labels.
⚙️ Input Parameters
This indicator offers complete control over how the Fibonacci levels are displayed:
Deviation: A multiplier that affects how much the price must deviate from the previous pivot for a new pivot to be formed. Increasing the value makes the indicator less sensitive; decreasing it makes it more sensitive.
Depth: The minimum number of bars considered when calculating the pivots.
Reverse: Option to reverse the drawing direction (from top to bottom or vice-versa).
Extend Left/Right: Controls the extension of the Fibonacci lines.
Level Settings (0, 0.236, 0.382, 0.5, 0.618, etc.):
Checkbox: Turn the display of each individual Fibonacci level on or off.
Value: Customize the Fibonacci value (e.g., you can change 0.618 to 0.65).
Color: Adjust the line color.
Line Width: Crucial option! Allows you to set the line thickness from 1 to 5. Use this to emphasize the most important levels.
Background Transparency: Adjust the transparency of the background fill between the Fibonacci levels.
How to Use It 💡
This tool is ideal for traders who use Fibonacci Retracement to determine potential areas of support and resistance, profit targets (extensions), and entry zones. Use the Custom Line Width option to visually set apart the key levels you believe have the most significant impact on the market (e.g., 0, 0.5, 0.618, and 1).

SRD
SRD v11 - Multi-Timeframe Volume Profile (POC, VAH, VAL)
Key Features
Dual Timeframe Analysis:
📈 Main Analysis (Daily): Calculates and displays the most significant levels based on a user-defined period of daily bars. This is ideal for identifying intraday and short-term trading opportunities.
📊 Strategic Analysis (Weekly): Plots key levels from a weekly perspective, giving you a broader, long-term view of market sentiment and structure. This can be toggled on or off.
Volume Profile Core Levels: The indicator automatically calculates and visualizes the three most important levels derived from volume analysis for both timeframes:
🎯 POC (Point of Control): The price level with the highest traded volume for the specified period. It acts as a powerful magnet for price and a key reference for market equilibrium.
🔴 VAH (Value Area High): The highest price level within the "Value Area" (where ~70% of the volume was traded). It often acts as a significant resistance zone.
🟢 VAL (Value Area Low): The lowest price level within the Value Area. It often serves as a strong support zone.
🟠 24-Hour High: An optional feature that plots the highest price reached in the last 24 hours, providing a crucial reference point for breakout and reversal traders.
Dynamic and Non-Repainting: The levels are calculated based on historical confirmed bars and update automatically as new periods (daily or weekly) close. The lines extend to the right, remaining relevant until a new calculation period begins.
Integrated Alert System: Never miss a key price interaction. The indicator includes a comprehensive alert system for:
Breakouts: Triggers when the price crosses above or below the POC, VAH, or VAL.
Touches: Triggers when the price touches one of these key levels without breaking through it (within a small tolerance).
Unified Alert: A single alert that notifies you of any of the above conditions.
Customization
The SRD v11 is fully customizable to fit your trading style. You can adjust:
Timeframes: Change the base timeframes for both the main (default Daily) and strategic (default Weekly) analysis.
Analysis Periods: Define the number of bars (days or weeks) to include in the Volume Profile calculation.
Visuals: Customize the color, width, and style (solid, dashed, dotted) of every line and label for clear and intuitive visualization.
Toggle Elements: Easily show or hide the strategic (weekly) analysis and the 24-hour high line.
How to Use It >
Identify Key Zones: Use the VAH (resistance) and VAL (support) lines to identify potential entry and exit zones. The area between VAH and VAL is the "Value Area," where the market has found acceptance.
Monitor the POC: The Point of Control is the ultimate level of equilibrium. Watch for price reactions around the POC. A sustained break above or below can signal a new trend.
Combine Timeframes: Use the strategic (weekly) levels as major, long-term points of interest and the main (daily) levels for your day-to-day trading setup. Confluence between levels from different timeframes can indicate extremely strong support or resistance.
Set Alerts: Configure alerts for breakouts or touches to be notified of critical market movements in real-time, even when you are away from the charts.

LevelsLevels is a powerful technical analysis tool that automatically identifies and displays key support and resistance levels on the chart. The indicator analyzes historical price data, detecting significant price levels where multiple reversals or price stops have occurred.
How the Indicator Works?
1. Identification of Reversal Points:
- The indicator tracks price extremes using an algorithm to identify local highs and lows
- A reversal point is recorded when:
- Uptrend: price reaches a new low for the last 10 bars
- Downtrend: price reaches a new high for the last 10 bars
2. Level Grouping:
- All found reversal points are analyzed and grouped into key levels
- Levels are combined if they fall within the specified percentage tolerance
3. Filtering Significant Levels:
- Only levels that have been tested the minimum number of times (set in settings) are preserved
- This ensures only statistically significant levels are displayed
How to Use the Indicator?
Trading Scenarios:
1. Bounce from Level:
- When price approaches an identified level, a bounce can be expected
- Opening positions on the bounce with protective stop-loss beyond the level
2. Level Breakout:
- Breaking through a key level may signal trend continuation
- Support level becomes resistance and vice versa
3. Consolidation near Level:
- Prolonged price presence near a level indicates its significance
- Strong movement can be expected after exiting consolidation
Advantages:
- Automatic level identification eliminates subjectivity
- Sensitivity customization for different timeframes and instruments
- Visual simplicity - only significant levels
Indicator Settings
Main Parameters:
- Show Key Levels - enable/disable level display
- Level Tolerance (%) - percentage tolerance for level grouping
- Smaller values: more levels, more precise
- Larger values: fewer levels, more significant
- Minimum Touches - minimum number of touches to form a level
Visual Settings:
- Level Color - level display color
- Level Style - line style (solid, dashed, dotted)
Limitations
- Levels are built only on available historical data
- Does not account for trading volumes
- Parameter adjustment may be required during high volatility periods
The indicator is particularly effective when combined with other analysis tools for signal confirmation.
Advanced Psychological Levels with Dynamic Spacing═══════════════════════════════════════
ADVANCED PSYCHOLOGICAL LEVELS WITH DYNAMIC SPACING
═══════════════════════════════════════
A comprehensive psychological price level indicator that automatically identifies and displays round number levels across multiple timeframes. Features dynamic ATR-based spacing, smart crypto detection, distance tracking, and customizable alert system.
───────────────────────────────────────
WHAT THIS INDICATOR DOES
───────────────────────────────────────
This indicator automatically draws psychological price levels (round numbers) that often act as support and resistance:
- Dynamic ATR-Based Spacing - Adapts level spacing to market volatility
- Multiple Level Types - Major (250 pip), Standard (100 pip), Mid, and Intraday levels
- Smart Asset Detection - Automatically adjusts for Forex, Crypto, Indices, and CFDs
- Crypto Price Adaptation - Intelligent level spacing based on cryptocurrency price magnitude
- Distance Information Table - Real-time percentage distance to nearest levels
- Combined Level Labels - Clear identification when multiple level types coincide
- Performance Optimized - Configurable visible range and label limits
- Comprehensive Alerts - Notifications when price crosses any level type
───────────────────────────────────────
HOW IT WORKS
───────────────────────────────────────
PSYCHOLOGICAL LEVELS CONCEPT:
Psychological levels are round numbers where traders tend to place orders, creating natural support and resistance zones. These include:
- Forex: 1.0000, 1.0100, 1.0050 (pips)
- Crypto: $100, $1,000, $10,000 (whole numbers)
- Indices: 10,000, 10,500, 11,000 (points)
Why They Matter:
- Traders naturally gravitate to round numbers
- Stop losses cluster at these levels
- Take profit orders concentrate here
- Institutional algorithmic trading often targets these levels
DYNAMIC ATR-BASED SPACING:
Traditional Method:
- Fixed spacing regardless of volatility
- May be too tight in volatile markets
- May be too wide in quiet markets
Dynamic Method (Recommended):
- Uses ATR (Average True Range) to measure volatility
- Automatically adjusts level spacing
- Tighter levels in low volatility
- Wider levels in high volatility
Calculation:
1. Calculate ATR over specified period (default: 14)
2. Multiply by ATR multiplier (default: 2.0)
3. Round to nearest psychological level
4. Generate levels at dynamic intervals
Benefits:
- Adapts to market conditions
- More relevant levels in all volatility regimes
- Reduces clutter in trending markets
- Provides more detail in ranging markets
LEVEL TYPES:
Major Levels (250 pip/point):
- Highest significance
- Primary support/resistance zones
- Color: Red (default)
- Style: Solid lines
- Spacing: 2.5x standard step
Standard Levels (100 pip/point):
- Secondary importance
- Common psychological barriers
- Color: Blue (default)
- Style: Dashed lines
- Spacing: Standard step
Mid Levels (50% between major):
- Optional intermediate levels
- Halfway between major levels
- Color: Gray (default)
- Style: Dotted lines
- Usage: Additional confluence points
Intraday Levels (sub-100 pip):
- For intraday traders
- Fine-grained precision
- Color: Yellow (default)
- Style: Dotted lines
- Only shown on intraday timeframes
SMART ASSET DETECTION:
Forex Pairs:
- Detects major currency pairs automatically
- Uses pip-based calculations
- Standard: 100 pips (0.0100)
- Major: 250 pips (0.0250)
- Intraday: 20, 50, 80 pip subdivisions
Cryptocurrencies:
- Automatic price magnitude detection
- Adaptive spacing based on price:
* Under $0.10: Levels at $0.01, $0.05
* $0.10-$1: Levels at $0.10, $0.50
* $1-$10: Levels at $1, $5
* $10-$100: Levels at $10, $50
* $100-$1,000: Levels at $100, $500
* $1,000-$10,000: Levels at $1,000, $5,000
* Over $10,000: Levels at $5,000, $10,000
Indices & CFDs:
- Fixed point-based system
- Major: 500 point intervals (with 250 sub-levels)
- Standard: 100 point intervals
- Suitable for stock indices like SPX, NASDAQ
COMBINED LEVEL LABELS:
When multiple level types coincide at the same price:
- Single line drawn (highest priority color)
- Combined label shows all types
- Priority: Major > Standard > Mid > Intraday
Example Label Formats:
- "1.1000 Major" - Major level only
- "1.1000 Std + Major" - Both standard and major
- "50000 Intra + Mid + Std" - Three levels coincide
Benefits:
- Cleaner chart appearance
- Clear identification of confluence
- Reduced visual clutter
- Easy to spot high-importance levels
DISTANCE INFORMATION TABLE:
Real-time tracking of nearest levels:
Table Contents:
- Nearest major level above (price and % distance)
- Nearest standard level above (price and % distance)
- Nearest standard level below (price and % distance)
Display:
- Top right corner (configurable)
- Color-coded by level type
- Real-time percentage calculations
- Helpful for position management
Usage:
- Identify proximity to key levels
- Set realistic profit targets
- Gauge potential move magnitude
- Monitor approaching resistance/support
ALERT SYSTEM:
Comprehensive crossing alerts:
Alert Types:
- Major Level Crosses
- Standard Level Crosses
- Intraday Level Crosses
Alert Modes:
- First Cross Only: Alert once when level is crossed
- All Crosses: Alert every time level is crossed
Alert Information:
- Level type crossed
- Specific price level
- Direction (above/below)
- One alert per bar to prevent spam
Configuration:
- Enable/disable by level type
- Choose alert frequency
- Customize for your trading style
───────────────────────────────────────
HOW TO USE
───────────────────────────────────────
INITIAL SETUP:
General Settings:
1. Enable "Use Dynamic ATR-Based Spacing" (recommended)
2. Set ATR Period (14 is standard)
3. Adjust ATR Multiplier (2.0 is balanced)
Visibility Settings:
1. Set Visible Range % (10% recommended for clarity)
2. Adjust Label Offset for readability
3. Configure performance limits if needed
Level Selection:
1. Enable/disable level types based on trading style
2. Adjust line counts for each type
3. Choose line styles and colors for visibility
TRADING STRATEGIES:
Breakout Trading:
1. Wait for price to approach major or standard level
2. Monitor for consolidation near level
3. Enter on confirmed break above/beyond level
4. Stop loss just beyond the broken level
5. Target: Next major or standard level
Rejection Trading:
1. Identify major psychological level
2. Wait for price to test the level
3. Look for rejection signals (wicks, bearish/bullish candles)
4. Enter in direction of rejection
5. Stop beyond the level
6. Target: Previous level or mid-level
Range Trading:
1. Identify range between two major levels
2. Buy at lower psychological level
3. Sell at upper psychological level
4. Use standard and mid-levels for position management
5. Exit if major level breaks with volume
Confluence Trading:
1. Look for combined levels (Std + Major)
2. These represent high-probability zones
3. Use as primary support/resistance
4. Increase position size at confluence
5. Expect stronger reactions at these levels
Session-Based Trading:
1. Note opening level at session start (Asian/London/NY)
2. Trade breakouts of major levels during high-volume sessions
3. London/NY sessions: More likely to break levels
4. Asian session: More likely to respect levels (range trading)
RISK MANAGEMENT WITH PSYCHOLOGICAL LEVELS:
Stop Loss Placement:
- Place stops just beyond psychological levels
- Add buffer (5-10 pips for forex)
- Avoid exact round numbers (stop hunting risk)
- Use previous major level as maximum stop
Take Profit Strategy:
- First target: Next standard level (partial profit)
- Second target: Next major level (remaining position)
- Trail stops to breakeven at first target
- Use distance table to calculate risk/reward
Position Sizing:
- Larger positions at major levels (higher probability)
- Smaller positions at intraday levels (lower probability)
- Scale in at standard levels between major levels
- Reduce size when multiple levels are close together
TIMEFRAME CONSIDERATIONS:
Higher Timeframes (4H, Daily, Weekly):
- Focus on Major and Standard levels only
- Disable Intraday and Mid levels
- Wider level spacing expected
- Use for swing trading and position trading
Lower Timeframes (5m, 15m, 1H):
- Enable all level types
- Use Intraday levels for precision
- Tighter level spacing acceptable
- Good for day trading and scalping
Multi-Timeframe Approach:
- Identify major levels on Daily/4H charts
- Refine entries using 15m/1H intraday levels
- Trade in direction of higher timeframe bias
- Use lower timeframe levels for position management
───────────────────────────────────────
CONFIGURATION GUIDE
───────────────────────────────────────
GENERAL SETTINGS:
Dynamic ATR-Based Spacing:
- Enabled: Recommended for most markets
- Disabled: Fixed psychological levels
- ATR Period: 14 (standard), 10 (responsive), 20 (smooth)
- ATR Multiplier: 1.0-5.0 (2.0 is balanced)
VISIBILITY SETTINGS:
Visible Range %:
- 5%: Very tight range, minimal clutter
- 10%: Balanced view (recommended)
- 20%: Wide range, more context
- 50%: Maximum range, all levels visible
Label Offset:
- 10-20 bars: Close to current price
- 30-50 bars: Moderate distance
- 50-100 bars: Far from price action
Performance Limits:
- Max Historical Bars: Reduce if indicator loads slowly
- Max Labels: Reduce for cleaner chart (20-30 recommended)
LEVEL CUSTOMIZATION:
Line Count:
- Lower (1-3): Cleaner chart, fewer levels
- Medium (4-6): Balanced view
- Higher (7-10): More context, busier chart
Line Styles:
- Solid: High importance, easy to see
- Dashed: Medium importance, clear but subtle
- Dotted: Low importance, minimal visual weight
Colors:
- Use contrasting colors for different level types
- Red/Blue/Yellow default works well
- Adjust based on chart background and personal preference
DISTANCE TABLE:
Position:
- Top Right: Doesn't interfere with price action
- Top Left: Good for right-side price scale
- Bottom positions: Less common but available
Colors:
- Default (white text, dark background) works for most charts
- Match your chart theme for consistency
- Ensure text is readable against background
ALERT CONFIGURATION:
Alert by Level Type:
- Major: Most important, fewer false signals
- Standard: Balance of frequency and importance
- Intraday: Many signals, best for active traders
Alert Frequency:
- First Cross Only: Cleaner, less noise (recommended for swing trading)
- All Crosses: Every touch, good for scalping
Alert Setup in TradingView:
1. Configure desired alert types in indicator settings
2. Right-click chart → Add Alert
3. Select this indicator
4. Choose "Any alert() function call"
5. Set delivery method (mobile, email, webhook)
───────────────────────────────────────
ASSET-SPECIFIC TIPS
───────────────────────────────────────
FOREX (EUR/USD, GBP/USD, etc.):
- Major levels at x.x000, x.x500
- Standard levels at x.xx00
- Intraday levels at 20/50/80 pips
- Most effective during London/NY sessions
- Watch for "figure" levels (1.0000, 1.1000)
CRYPTOCURRENCIES (BTC, ETH, etc.):
- Enable dynamic spacing for volatile markets
- Levels adjust automatically based on price
- Watch major $1,000 increments for BTC
- $100 levels important for ETH
- Smaller caps: Use standard levels
- High volatility: Increase ATR multiplier to 3.0
STOCK INDICES (SPX, NASDAQ, etc.):
- 100-point levels most important
- 500-point levels for major S/R
- 50-point mid-levels for refinement
- Watch end-of-day for level reactions
- Futures often lead spot on level breaks
GOLD/COMMODITIES:
- Major levels at $50 increments ($1,900, $1,950)
- Standard levels at $10 increments
- Very reactive to psychological levels
- Watch for false breaks during low volume
- Best reactions during active trading hours
───────────────────────────────────────
BEST PRACTICES
───────────────────────────────────────
Chart Setup:
- Use clean price action charts
- Avoid too many indicators
- Ensure psychological levels are clearly visible
- Match colors to your chart theme
Level Selection:
- Start with Major and Standard levels only
- Add Mid and Intraday as needed
- Less is more - avoid chart clutter
- Adjust based on timeframe
Combining with Other Tools:
- Volume profile for confluence
- Trendlines intersecting psychological levels
- Moving averages near round numbers
- Fibonacci levels coinciding with psychological levels
Common Mistakes to Avoid:
- Trading every level touch (be selective)
- Ignoring volume confirmation
- Setting stops exactly at levels (stop hunting)
- Forgetting to adjust for different assets
- Over-relying on levels without price action confirmation
Performance Optimization:
- Reduce visible range for faster loading
- Lower max historical bars on lower timeframes
- Limit labels to 30-50 for clarity
- Disable unused level types
───────────────────────────────────────
EDUCATIONAL DISCLAIMER
───────────────────────────────────────
This indicator identifies psychological price levels based on round numbers that tend to act as support and resistance. The methodology includes:
- Round number detection algorithms
- ATR-based dynamic spacing calculations
- Asset-specific level determination
- Distance percentage calculations
Psychological levels are a recognized concept in technical analysis, studied by traders and institutions. However, they do not guarantee price reactions and should be used as part of a comprehensive trading strategy including proper risk management, volume analysis, and price action confirmation.
───────────────────────────────────────
USAGE DISCLAIMER
───────────────────────────────────────
This tool is for educational and analytical purposes. Psychological levels can act as support or resistance but price reactions are not guaranteed. Dynamic spacing may generate different levels in different market conditions. Always conduct independent analysis, use proper risk management, and never risk capital you cannot afford to lose. Past performance does not indicate future results.
───────────────────────────────────────
CREDITS & ATTRIBUTION
───────────────────────────────────────
Original Concept: Sonar Lab

Combined Predictive Indicator### Combined Predictive Zones & Levels
This indicator is a powerful hybrid tool designed to provide a comprehensive map of potential future price action. It merges two distinct predictive models into a single, cohesive view, helping traders identify key levels of support, resistance, and areas of high confluence.
#### How It Works: Two Models in One
This script is built on two core components that you can use together or analyze separately:
**Part 1: Classic Range & Fibonacci Prediction**
This model uses classic technical analysis principles to project a potential range for the upcoming price action.
* **Highest High / Lowest Low:** It identifies the significant trading range over a user-defined lookback period.
* **Fibonacci Levels:** It automatically plots key Fibonacci retracement levels (e.g., 38.2% and 61.8%) within this range, which often act as critical support or resistance.
* **ATR & Average Range:** It calculates a "predicted" upper and lower boundary based on the average historical range and current volatility (ATR).
**Part 2: Advanced Predictive Ranges (Self-Adjusting Channels)**
This is a dynamic model that creates adaptive support and resistance zones based on a smoothed average price and volatility.
* **Dynamic Average:** It uses a unique moving average that only adjusts when the price moves significantly, creating a stable baseline.
* **ATR-Based Zones:** It projects multiple levels of support (S1, S2) and resistance (R1, R2) around this average, which widen and narrow based on market volatility. These zones often signal areas where price might stall or reverse.
#### Key Features:
* **Hybrid Model for Confluence:** The true power of this indicator lies in finding where the levels from both models overlap. A Fibonacci level aligning with a Predictive Range support zone is a much stronger signal.
* **Comprehensive Data Table:** A clean, on-chart table displays the precise values of all key predictive levels, allowing for quick reference and precise trade planning.
* **Multi-Timeframe (MTF) Capability:** The Advanced Predictive Ranges can be calculated on a higher timeframe, giving you a broader market context.
* **Fully Customizable:** All lengths, multipliers, and levels for both models are fully adjustable in the settings to fit any asset or trading style.
* **Clear Visuals:** All zones and levels are color-coded for intuitive and easy-to-read analysis.
#### How to Use:
1. Look for areas of **confluence** where multiple levels from both models cluster together. These are high-probability zones for price reactions.
2. Use the Predictive Range zones (S1/S2 and R1/R2) as potential targets for trades or as areas to watch for entries and exits.
3. Pay attention to the on-chart table for exact price levels to set limit orders or stop-losses.
**Disclaimer:** This script is an analytical tool for educational purposes and should not be considered financial advice. All trading involves risk. Past performance is not indicative of future results. Always use this indicator as part of a comprehensive trading strategy with proper risk management.
Feedback is welcome! If you find this tool useful, please leave a like.

Liquidity Break Probability [PhenLabs]📊 Liquidity Break Probability
Version: PineScript™ v6
The Liquidity Break Probability indicator revolutionizes how traders approach liquidity levels by providing real-time probability calculations for level breaks. This advanced indicator combines sophisticated market analysis with machine learning inspired probability models to predict the likelihood of high/low breaks before they happen.
Unlike traditional liquidity indicators that simply draw lines, LBP analyzes market structure, volume profiles, momentum, volatility, and sentiment to generate dynamic break probabilities ranging from 5% to 95%. This gives traders unprecedented insight into which levels are most likely to hold or break, enabling more confident trading decisions.
🚀 Points of Innovation
Advanced 6-factor probability model weighing market structure, volatility, volume, momentum, patterns, and sentiment
Real-time probability updates that adjust as market conditions change
Intelligent trading style presets (Scalping, Day Trading, Swing Trading) with optimized parameters
Dynamic color-coded probability labels showing break likelihood percentages
Professional tiered input system - from quick setup to expert-level customization
Smart volume filtering that only highlights levels with significant institutional interest
🔧 Core Components
Market Structure Analysis: Evaluates trend alignment, level strength, and momentum buildup using EMA crossovers and price action
Volatility Engine: Incorporates ATR expansion, Bollinger Band positioning, and price distance calculations
Volume Profile System: Analyzes current volume strength, smart money proxies, and level creation volume ratios
Momentum Calculator: Combines RSI positioning, MACD strength, and momentum divergence detection
Pattern Recognition: Identifies reversal patterns (doji, hammer, engulfing) near key levels
Sentiment Analysis: Processes fear/greed indicators and market breadth measurements
🔥 Key Features
Dynamic Probability Labels: Real-time percentage displays showing break probability with color coding (red >70%, orange >50%, white <50%)
Trading Style Optimization: One-click presets automatically configure sensitivity and parameters for your trading timeframe
Professional Dashboard: Live market state monitoring with nearest level tracking and active level counts
Smart Alert System: Customizable proximity alerts and high-probability break notifications
Advanced Level Management: Intelligent line cleanup and historical analysis options
Volume-Validated Levels: Only displays levels backed by significant volume for institutional-grade analysis
🎨 Visualization
Recent Low Lines: Red lines marking validated support levels with probability percentages
Recent High Lines: Blue lines showing resistance zones with break likelihood indicators
Probability Labels: Color-coded percentage labels that update in real-time
Professional Dashboard: Customizable panel showing market state, active levels, and current price
Clean Display Modes: Toggle between active-only view for clean charts or historical view for analysis
📖 Usage Guidelines
Quick Setup
Trading Style Preset
Default: Day Trading
Options: Scalping, Day Trading, Swing Trading, Custom
Description: Automatically optimizes all parameters for your preferred trading timeframe and style
Show Break Probability %
Default: True
Description: Displays percentage labels next to each level showing break probability
Line Display
Default: Active Only
Options: Active Only, All Levels
Description: Choose between clean active-only view or comprehensive historical analysis
Level Detection Settings
Level Sensitivity
Default: 5
Range: 1-20
Description: Lower values show more levels (sensitive), higher values show fewer levels (selective)
Volume Filter Strength
Default: 2.0
Range: 0.5-5.0
Description: Controls minimum volume threshold for level validation
Advanced Probability Model
Market Trend Influence
Default: 25%
Range: 0-50%
Description: Weight given to overall market trend in probability calculations
Volume Influence
Default: 20%
Range: 0-50%
Description: Impact of volume analysis on break probability
✅ Best Use Cases
Identifying high-probability breakout setups before they occur
Determining optimal entry and exit points near key levels
Risk management through probability-based position sizing
Confluence trading when multiple high-probability levels align
Scalping opportunities at levels with low break probability
Swing trading setups using high-probability level breaks
⚠️ Limitations
Probability calculations are estimations based on historical patterns and current market conditions
High-probability setups do not guarantee successful trades - risk management is essential
Performance may vary significantly across different market conditions and asset classes
Requires understanding of support/resistance concepts and probability-based trading
Best used in conjunction with other analysis methods and proper risk management
💡 What Makes This Unique
Probability-Based Approach: First indicator to provide quantitative break probabilities rather than simple S/R lines
Multi-Factor Analysis: Combines 6 different market factors into a comprehensive probability model
Adaptive Intelligence: Probabilities update in real-time as market conditions change
Professional Interface: Tiered input system from beginner-friendly to expert-level customization
Institutional-Grade Filtering: Volume validation ensures only significant levels are displayed
🔬 How It Works
1. Level Detection:
Identifies pivot highs and lows using configurable sensitivity settings
Validates levels with volume analysis to ensure institutional significance
2. Probability Calculation:
Analyzes 6 key market factors: structure, volatility, volume, momentum, patterns, sentiment
Applies weighted scoring system based on user-defined factor importance
Generates probability score from 5% to 95% for each level
3. Real-Time Updates:
Continuously monitors price action and market conditions
Updates probability calculations as new data becomes available
Adjusts for level touches and changing market dynamics
💡 Note: This indicator works best on timeframes from 1-minute to 4-hour charts. For optimal results, combine with proper risk management and consider multiple timeframe analysis. The probability calculations are most accurate in trending markets with normal to high volatility conditions.

CDP - Counter-Directional-Pivot🎯 CDP - Counter-Directional-Pivot
📊 Overview
The Counter-Directional-Pivot (CDP) indicator calculates five critical price levels based on the previous day's OHLC data, specifically designed for multi-timeframe analysis. Unlike standard pivot points, CDP levels are calculated using a unique formula that identifies potential reversal zones where price action often changes direction.
⚡ What Makes This Script Original
This implementation solves several technical challenges that existing pivot indicators face:
🔄 Multi-Timeframe Consistency: Values remain identical across all timeframes (1m, 5m, 1h, daily) - a common problem with many pivot implementations
🔒 Intraday Stability: Uses advanced value-locking technology to prevent the "stepping" effect that occurs when pivot lines shift during the trading session
💪 Robust Data Handling: Optimized for both liquid and illiquid stocks with enhanced data synchronization
🧮 CDP Calculation Formula
The indicator calculates five key levels using the previous day's High (H), Low (L), and Close (C):
CDP = (H + L + C) ÷ 3 (Central Decision Point)
AH = 2×CDP + H – 2×L (Anchor High - Strong Resistance)
NH = 2×CDP – L (Near High - Moderate Resistance)
AL = 2×CDP – 2×H + L (Anchor Low - Strong Support)
NL = 2×CDP – H (Near Low - Moderate Support)
✨ Key Features
🎨 Visual Elements
📈 Five Distinct Price Levels: Each with customizable colors and line styles
🏷️ Smart Label System: Shows exact price values for each level
📋 Optional Value Table: Displays all levels in an organized table format
🎯 Clean Chart Display: Minimal visual clutter while maximizing information
⚙️ Technical Advantages
🔐 Session-Locked Values: Prices are locked at market open, preventing intraday shifts
🔄 Multi-Timeframe Sync: Perfect consistency between daily and intraday charts
✅ Data Validation: Built-in checks ensure reliable calculations
🚀 Performance Optimized: Efficient code structure for fast loading
💼 Trading Applications
🔄 Reversal Zones: AH and AL often act as strong turning points
💥 Breakout Confirmation: Price movement beyond these levels signals trend continuation
🛡️ Risk Management: Use levels for stop-loss and take-profit placement
🏗️ Market Structure: Understand daily ranges and potential price targets
📚 How to Use
🚀 Basic Setup
Add the indicator to your chart (works on any timeframe)
Customize colors for easy identification of support/resistance zones
Enable the value table for quick reference of exact price levels
📈 Trading Strategy Examples
🟢 Long Bias: Look for bounces at NL or AL levels
🔴 Short Bias: Watch for rejections at NH or AH levels
💥 Breakout Trading: Enter positions when price decisively breaks through anchor levels
↔️ Range Trading: Use CDP as the central reference point for range-bound markets
🎯 Advanced Strategy Combinations
RSI Integration for Enhanced Signals: 📊
📉 Oversold Bounces: Combine RSI below 30 with price touching AL/NL levels for high-probability long entries
📈 Overbought Rejections: Look for RSI above 70 with price rejecting AH/NH levels for short opportunities
🔍 Divergence Confirmation: When RSI shows bullish divergence at support levels (AL/NL) or bearish divergence at resistance levels (AH/NH), it often signals stronger reversal potential
⚡ Momentum Confluence: RSI crossing 50 while price breaks through CDP can confirm trend direction changes
⚙️ Configuration Options
🎨 Line Customization: Adjust width, style (solid/dashed/dotted), and colors
👁️ Display Preferences: Toggle individual levels, labels, and value table
📍 Table Position: Place the value table anywhere on your chart
🔔 Alert System: Get notifications when price crosses key levels
🔧 Technical Implementation Details
🎯 Data Reliability
The script uses request.security() with lookahead settings to ensure historical accuracy while maintaining real-time functionality. The value-locking mechanism prevents the common issue where pivot levels shift during the trading day.
🔄 Multi-Timeframe Logic
⏰ Intraday Charts: Display previous day's calculated levels as stable horizontal lines
📅 Daily Charts: Show current day's levels based on yesterday's OHLC
🔍 Consistency Check: All timeframes reference the same source data
🤔 Why CDP vs Standard Pivots?
Counter-Directional Pivots often provide more accurate reversal points than traditional pivot calculations because they incorporate the relationship between high/low ranges and closing prices more effectively. The formula creates levels that better reflect market psychology and institutional trading behaviors.
💡 Best Practices
💧 Use on liquid markets for most reliable results
📊 RSI Combination: Add RSI indicator for overbought/oversold confirmation and divergence analysis
📊 Combine with volume analysis for confirmation
🔍 Consider multiple timeframe analysis (daily levels on hourly charts)
📝 Test thoroughly in paper trading before live implementation
💪 Example Market Applications
NASDAQ:AAPL AAPL - Tech stock breakouts through AH levels
$NYSE:SPY SPY - Index trading with CDP range analysis
NASDAQ:TSLA TSLA - Volatile stock reversals at AL/NL levels
⚠️ This indicator is designed for educational and analytical purposes. Always combine with proper risk management and additional technical analysis tools.

Adaptive Fibonacci Volatility Bands (AFVB)
**Adaptive Fibonacci Volatility Bands (AFVB)**
### **Overview**
The **Adaptive Fibonacci Volatility Bands (AFVB)** indicator enhances standard **Fibonacci retracement levels** by dynamically adjusting them based on market **volatility**. By incorporating **ATR (Average True Range) adjustments**, this indicator refines key **support and resistance zones**, helping traders identify **more reliable entry and exit points**.
**Key Features:**
- **ATR-based adaptive Fibonacci levels** that adjust to changing market volatility.
- **Buy and Sell signals** based on price interactions with dynamic support/resistance.
- **Toggleable confirmation filter** for refining trade signals.
- **Customizable color schemes** and alerts.
---
## **How This Indicator Works**
The **AFVB** operates in three main steps:
### **1️⃣ Detecting Key Fibonacci Levels**
The script calculates **swing highs and swing lows** using a user-defined lookback period. From this, it derives **Fibonacci retracement levels**:
- **0% (High)**
- **23.6%**
- **38.2%**
- **50% (Mid-Level)**
- **61.8%**
- **78.6%**
- **100% (Low)**
### **2️⃣ Adjusting for Market Volatility**
Instead of using **fixed retracement levels**, this indicator incorporates an **ATR-based adjustment**:
- **Resistance levels** shift **upward** based on ATR.
- **Support levels** shift **downward** based on ATR.
- This makes levels more **responsive** to price action.
### **3️⃣ Generating Buy & Sell Signals**
AFVB provides **two types of signals** based on price interactions with key levels:
✔ **Buy Signal**:
Occurs when price **dips below** a support level (78.6% or 100%) and **then closes back above it**.
- **Optionally**, a confirmation buffer can be enabled to require price to close **above an additional threshold** (based on ATR).
✔ **Sell Signal**:
Triggered when price **breaks above a resistance level** (0% or 23.6%) and **then closes below it**.
📌 **Important:**
- The **buy threshold setting** allows traders to **fine-tune** entry conditions.
- Turning this setting **off** generates **more frequent** buy signals.
- Keeping it **on** reduces false signals but may result in **fewer trade opportunities**.
---
## **How to Use This Indicator in Trading**
### 🔹 **Entry Strategy (Buying)**
1️⃣ Look for **buy signals** at the **78.6% or 100% Fibonacci levels**.
2️⃣ Ensure price **closes above** the support level before entering a long trade.
3️⃣ **Enable or disable** the buy threshold filter depending on desired trade strictness.
### 🔹 **Exit Strategy (Selling)**
1️⃣ Watch for **sell signals** at the **0% or 23.6% Fibonacci levels**.
2️⃣ If price **breaks above resistance and then closes below**, consider exiting long positions.
3️⃣ Can be used **alone** or **combined with trend confirmation tools** (e.g., moving averages, RSI).
### 🔹 **Using the Toggleable Buy Threshold**
- **ON**: Buy signal requires **extra confirmation** (reduces false signals but fewer trades).
- **OFF**: Buy triggers as soon as price **closes back above support** (more signals, but may include weaker setups).
---
## **User Inputs**
### **🔧 Customization Options**
- **ATR Length**: Defines the period for **ATR calculation**.
- **Swing Lookback**: Determines how far back to find **swing highs and lows**.
- **ATR Multiplier**: Adjusts the size of **volatility-based modifications**.
- **Buy/Sell Threshold Factor**: Fine-tunes the **entry signal strictness**.
- **Show Level Labels**: Enables/disables **Fibonacci level annotations**.
- **Color Settings**: Customize **support/resistance colors**.
### **📢 Alerts**
AFVB includes built-in **alert conditions** for:
- **Buy Signals** ("AFVB BUY SIGNAL - Possible reversal at support")
- **Sell Signals** ("AFVB SELL SIGNAL - Possible reversal at resistance")
- **Any Signal Triggered** (Useful for automated alerts)
---
## **Who Is This Indicator For?**
✅ **Scalpers & Day Traders** – Helps identify **short-term reversals**.
✅ **Swing Traders** – Useful for **buying dips** and **selling rallies**.
✅ **Trend Traders** – Can be combined with **momentum indicators** for confirmation.
**Best Timeframes:**
⏳ **15-minute, 1-hour, 4-hour, Daily charts** (works across multiple assets).
---
## **Limitations & Considerations**
🚨 **Important Notes**:
- **No indicator guarantees profits**. Always **combine** it with **risk management strategies**.
- Works best **in trending & mean-reverting markets**—may generate false signals in **choppy conditions**.
- Performance may vary across **different assets & timeframes**.
📢 **Backtesting is recommended** before using it for live trading.

Fibonacci Channel Standard Deviation levels based off 200MAThis script dynamically combines Fibonacci levels with the 200-period simple moving average (SMA), offering a powerful tool for identifying high-probability support and resistance zones. By adjusting to the changing 200 SMA, the script remains relevant across different market phases.
Key Features:
Dynamic Fibonacci Levels:
The script automatically calculates Fibonacci retracements and extensions relative to the 200 SMA.
These levels adapt to market trends, offering more relevant zones compared to static Fibonacci tools.
Support and Resistance Zones:
In uptrends, price often respects retracement levels above the 200 SMA (e.g., 38.2%, 50%, 61.8%).
In downtrends, price may interact with retracements and extensions below the 200 SMA (e.g., 23.6%, 1.618).
Customizable Confluence Zones:
Key levels such as the golden pocket (61.8%–65%) are highlighted as high-probability zones for reversals or continuations.
Extensions (e.g., 1.618) can serve as profit targets or bearish continuation points.
Practical Applications:
Identifying Reversal Zones:
Look for confluence between Fibonacci levels and the 200 SMA to identify potential reversal points.
Example: A pullback to the 61.8%–65% golden pocket near the 200 SMA often signals a bullish reversal.
Trend Confirmation:
In uptrends, price respecting Fibonacci retracements above the 200 SMA (e.g., 38.2%, 50%) confirms strength.
Use Fibonacci extensions (e.g., 1.618) as profit targets during strong trends.
Dynamic Risk Management:
Place stop-losses just below key Fibonacci retracement levels near the 200 SMA to minimize risk.
Bearish Scenarios:
Below the 200 SMA, Fibonacci retracements and extensions act as resistance levels and bearish targets.
How to Use:
Volume Confirmation: Watch for volume spikes near Fibonacci levels to confirm support or resistance.
Price Action: Combine with candlestick patterns (e.g., engulfing candles, pin bars) for precise entries.
Trend Indicators: Use in conjunction with shorter moving averages or RSI to confirm market direction.
Example Setup:
Scenario: Price retraces to the 61.8% Fibonacci level while holding above the 200 SMA.
Confirmation: Volume spikes, and a bullish engulfing candle forms.
Action: Enter long with a stop-loss just below the 200 SMA and target extensions like 1.618.
Key Takeaways:
The 200 SMA serves as a reliable long-term trend anchor.
Fibonacci retracements and extensions provide dynamic zones for trade entries, exits, and risk management.
Combining this tool with volume, price action, or other indicators enhances its effectiveness.
Enigma Endgame with Dynamic Trend-Based FibonacciThe Enigma Endgame script combines dynamic trend-based Fibonacci levels with the core principles of the ENIGMA strategy. It provides traders with actionable signals by identifying key levels of fractal support and resistance and highlighting opportunities to trade with market momentum. This tool is designed for multi-timeframe analysis and is especially effective during high-volatility sessions like London and New York.
Purpose and Usefulness
This script was developed to simplify complex market dynamics by integrating Fibonacci principles with ENIGMA's logic of fractal support and resistance. Traders can use it to:
- Identify key breakout and retracement levels dynamically.
- Understand the shift between support and resistance as price action evolves.
- Gain confidence in their entries with real-time signals derived from logical fractal behavior.
By merging Fibonacci levels with fractal-based trading insights, this script offers a unique and comprehensive approach to analyzing market structure.
How It Works
The script uses a dual approach to provide insights:
1. Dynamic Fibonacci Levels:
- Automatically plots Fibonacci retracement and extension levels based on recent high and low swings, adjusting dynamically to current market trends.
- Allows traders to visualize key levels where price might reverse or extend.
2. Fractal Support and Resistance Logic:
- The script identifies fractal support and resistance by analyzing candle formations.
- When a candle body closes below the low of a previous candle, the previous low, which was fractal support, now becomes fractal resistance. The script generates a bearish signal, encouraging traders to look for sell opportunities at or above the previous low.
- Conversely, when a candle body closes above the high of a previous candle, the previous high, which was fractal resistance, becomes fractal support. The script generates a bullish signal, encouraging traders to look for buy opportunities at or below the previous high.
Real-Time Signals
The script marks these transitions with arrows on the chart:
- Bearish arrows indicate broken fractal support turning into resistance.
- Bullish arrows** indicate broken fractal resistance turning into support.
These signals help traders stay aligned with the trend and trade with market momentum.
Key Features
1. Session-Based Analysis: Focuses on high-probability setups by allowing traders to customize session times, such as London or US sessions.
2. Multi-Timeframe Support: Works seamlessly across multiple timeframes for both scalpers and swing traders.
3. Real-Time Alerts: Sends customizable alerts when price interacts with critical Fibonacci levels or fractal support/resistance shifts.
How to Use the Script
1. Apply the script to a clean chart for clear visualization. Avoid combining it with other scripts unless necessary.
2. Use the arrows to identify shifts in fractal support and resistance and validate opportunities for buy/sell trades.
3. Monitor the dynamic Fibonacci levels to find confluence with key price areas.
4. Customize session times to focus on high-probability trading hours.
Key Notes for Traders
- This script provides insights based on logical market structure but should be used alongside proper risk management and trading plans.
- The fractal-based approach works well in conjunction with dynamic Fibonacci levels, helping traders build confidence in their strategy.
- Adapt the script settings to match your unique trading style and timeframe preferences.
By offering a seamless integration of fractal logic and Fibonacci principles, Enigma Endgame empowers traders with actionable insights to navigate markets effectively.
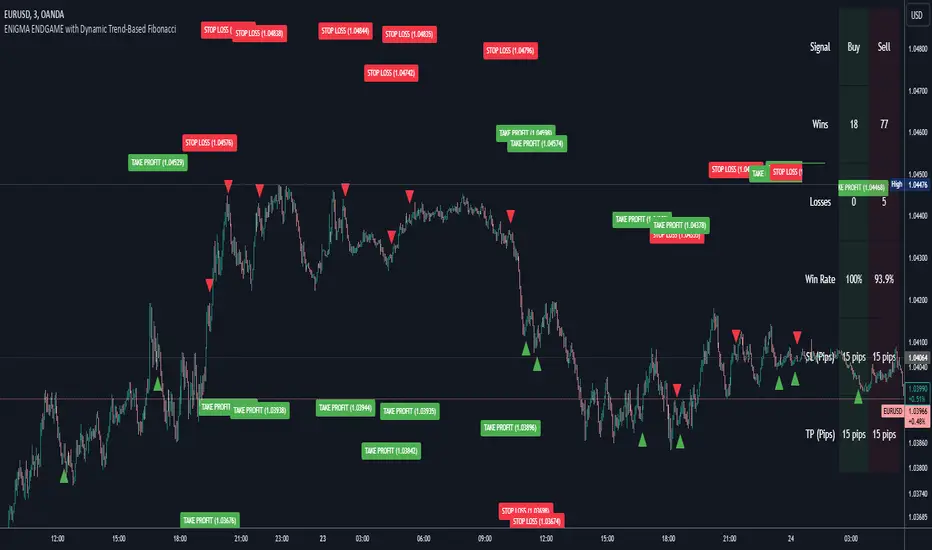
Dynamic TestingInput Parameters
`lookbackPeriod` : Number of candles to check for determining the highest high (resistance) and lowest low (support) levels.
`atrPeriod` : The period for calculating the Average True Range (ATR), a measure of market volatility.
`atrMultiplierSL` : Multiplier to calculate the stop-loss distance relative to the ATR.
`atrMultiplierTP1` and `atrMultiplierTP2` : Multipliers to calculate two take-profit levels relative to ATR.
`rewardToRisk` : The ratio between reward (profit) and risk (stop loss) for trade management.
---
Core Calculations
ATR (Average True Range)
atr = ta.atr(atrPeriod)
ATR is computed using the specified period to gauge price volatility.
Volume SMA
volumeSMA = ta.sma(volume, atrPeriod)
The script calculates the simple moving average of volume over the same period as ATR. This is used as a threshold for validating high-volume scenarios.
---
Support and Resistance Levels
`support` : Lowest price over the last `lookbackPeriod` candles.
`resistance` : Highest price over the same period.
`supportBuffer` and `resistanceBuffer` : These are "buffered" zones around support and resistance, calculated using half of the ATR to prevent false breakouts.
---
Entry Scenarios
Bullish Entry (`isBullishEntry`)
The close is above the buffered support level.
The low of the current candle touches or breaks below the support level.
The trading volume is greater than the `volumeSMA`.
Bearish Entry (`isBearishEntry`)
The close is below the buffered resistance level.
The high of the current candle touches or exceeds the resistance level.
The trading volume is greater than the `volumeSMA`.
---
Box Visualization
Bullish and Bearish Boxes
Bullish Box (`bullishBox`):
- A green, semi-transparent rectangle around the support level to highlight the bullish entry zone.
- Dynamically updates based on recent price action.
Bearish Box (`bearishBox`):
- A red, semi-transparent rectangle around the resistance level to highlight the bearish entry zone.
- Adjusts similarly as price evolves.
---
Stop Loss and Take Profit Calculations
Bullish Trades
Stop Loss (`bullishSL`): Calculated as support - atrMultiplierSL * ATR .
Take Profit 1 (`bullishTP1`): support + rewardToRisk * atrMultiplierTP1 * ATR .
Take Profit 2 (`bullishTP2`): support + rewardToRisk * atrMultiplierTP2 * ATR .
Bearish Trades
Stop Loss (`bearishSL`): resistance + atrMultiplierSL * ATR .
Take Profit 1 (`bearishTP1`): resistance - rewardToRisk * atrMultiplierTP1 * ATR .
Take Profit 2 (`bearishTP2`): resistance - rewardToRisk * atrMultiplierTP2 * ATR .
---
Visualization for Key Levels
Bullish Scenario
Green lines represent `bullishTP1` and `bullishTP2` for profit targets.
A red line indicates the `bullishSL` .
Labels like "TP1," "TP2," and "SL" dynamically appear at respective levels to make the targets and risk visually clear.
Bearish Scenario
Red lines represent `bearishTP1` and `bearishTP2` .
A green line marks the `bearishSL` .
Similar dynamic labeling for `TP1` , `TP2` , and `SL` at corresponding bearish levels.
---
Dynamic Updates
Both the entry boxes and key level visualizations (lines and labels) adjust dynamically based on real-time price and volume data.
---
Purpose
Identify high-probability bullish and bearish trade setups.
Define clear entry zones (using boxes) and exit levels (TP1, TP2, SL).
Incorporate volatility (via ATR) and volume into decision-making.
---
Technical Summary
Dynamically visualize support/resistance levels.
Set risk-managed trades using ATR-based stop-loss and profit levels.
Automate visual trade zones for enhanced chart clarity.
---

Tomorrow Floor Pivots with CPR By Nifty ZThe colors for resistance and support levels have been updated to gradient reds and greens for clearer distinction.
The CPR band uses light blue and purple to stand out more effectively.
Here's a detailed explanation of the user inputs and the typical use of **Floor Pivots for Tomorrow’s Market Range** in a trading context, focusing on support, resistance, and breakout scenarios:
The script allows traders to customize key parameters for their analysis:
1. Pivot Timeframe:
- Users can select different timeframes for calculating floor pivots, such as 1 hour, 4 hours, daily, weekly, monthly, etc.
- This is crucial because the timeframe selection influences the granularity of the support and resistance levels for the next trading day.
- For instance, selecting a **Daily** timeframe will calculate floor pivots for the next trading day, while selecting **Weekly** will give levels for the upcoming week.
2. Show Floor Pivots:
- Users can toggle the visibility of the calculated **Floor Pivots**, which include resistance levels (R1, R2, R3, R4) and support levels (S1, S2, S3, S4).
3. Show CPR (Central Pivot Range):
- CPR (Central Pivot Range) is a key area where the price tends to consolidate.
- The script allows users to enable or disable the visibility of CPR, which consists of the BC (Bottom Central Pivot) and TC (Top Central Pivot).
4. Show Labels:
- Users can choose whether or not to display labels indicating the **Pivot**, **Support**, and Resistance levels on the chart. This can be helpful for visual analysis when day trading.
Understanding Floor Pivots
The Floor Pivots (Pivot, Resistance, and Support levels) for tomorrow's market range are calculated based on today’s high, low, and close. These levels help traders anticipate how the market may behave in the upcoming session.
1. Pivot:
- The Pivot Point is a central level, calculated as the average of the high, low, and close. It’s considered a reference point that determines the market’s overall bias.
- If the price is trading **above the pivot**, it generally suggests a **bullish** sentiment for the day.
- If the price is trading **below the pivot**, it suggests a **bearish** sentiment.
2. Resistance Levels (R1, R2, R3, R4):
- R1 is often the first area where price may stall in an uptrend. It represents the first major resistance level.
- **R2**, **R3**, and **R4** mark additional levels of resistance, progressively further away from the current price. These are used to project potential upward targets.
- These resistance levels are areas where the price might encounter selling pressure, especially during day trading.
3. **Support Levels (S1, S2, S3, S4):**
- Similarly, **S1** is the first area where the price might find support in a downtrend.
- **S2**, **S3**, and **S4** provide deeper support levels where the price may bounce from.
- These support zones are used by day traders to anticipate where the price might reverse upward.
### **Role of Resistance and Support in Day Trading**
- **Resistance Levels (R1, R2, R3, R4)** indicate potential areas where price could **stall** during an uptrend. These levels are useful for **short-term traders** looking to set exit points or identify reversal zones.
- **Support Levels (S1, S2, S3, S4)** highlight areas where the price could **find support** and potentially **bounce** higher. These levels are particularly helpful for identifying buy zones in a downtrend.
- If a price **breaks out** above the resistance levels or **breaks down** below the support levels, it often signals a strong trend continuation.
### **Understanding the Central Pivot Range (CPR)**
The **CPR** is formed by two key levels:
- **BC (Bottom Central Pivot):** The midpoint of the day’s high and low.
- **TC (Top Central Pivot):** The difference between the pivot and BC.
The CPR acts as a region of **consolidation** or **indecision** where the market is likely to stay within a narrow range. The width of the CPR gives traders a sense of volatility:
- A **narrow CPR** often signals that a **breakout** is imminent.
- A **wider CPR** suggests that the market could remain range-bound.
### **Market Sentiment Based on Floor Pivots**
The relationship between **today’s** and **tomorrow’s pivots** is crucial in determining the market sentiment for the next day.
1. **Bullish Case (Higher Highs):**
- If **tomorrow's pivot** is higher than **today's pivot**, it indicates a **bullish sentiment**. This suggests that the market is likely to trend upward in the next session.
- In a **bullish overlapping pivot range**, if **Day 1 (today)** is higher than **Day 2 (tomorrow)**, traders expect continued upward momentum.
2. **Bearish Case (Lower Lows):**
- Conversely, if **tomorrow's pivot** is lower than **today's pivot**, it suggests a **bearish sentiment** and that the market could trend downward in the next session.
- In a **bearish overlapping pivot range**, if **Day 1 (today)** is lower than **Day 2 (tomorrow)**, traders expect continued downward pressure.
### **Breakout Scenarios**
A breakout occurs when the price **violates either the support or resistance levels** significantly, indicating that the price is moving in the direction of the breakout.
1. **Bullish Breakout:**
- If the price consistently stays **above the CPR** and **resistance levels (R1, R2)**, it indicates a strong **bullish breakout**.
- This is especially true when the **CPR is narrow** for both days, signaling a buildup in price action and a potential breakout to the upside.
2. **Bearish Breakout:**
- If the price breaks **below the CPR** and **support levels (S1, S2)**, it indicates a **bearish breakout**.
- A narrow CPR on **both days** suggests that a breakout to the downside could be imminent.
3. **Neutral or Ranging Days:**
- Sometimes, the CPR stays **unchanged** for 4-5 days, indicating a period of **consolidation** where the price is moving within a tight range. This often leads to a significant breakout once the consolidation ends.
Strategic Application of Floor Pivots for Tomorrow
Traders use floor pivots to plan their next-day trades by:
- **Aligning with Market Sentiment:** Based on whether tomorrow’s pivot is higher or lower than today’s, traders can align their trades in the direction of the market’s overall bias.
- **Identifying Entry and Exit Points:** Resistance and support levels provide well-defined areas to enter or exit trades, making pivots essential for day trading strategies.
- **Anticipating Breakouts:** Monitoring the width of the CPR and the relation between pivots helps traders anticipate potential breakouts, allowing them to react quickly to sudden price movements.
By effectively using these pivots and understanding their significance, traders can improve their decision-making for short-term trades in the stock or futures markets.
Brooks 18 Bars [KintsugiTrading]Brooks 18 Bars
Overview:
This indicator allows traders to specify a time frame within each trading day and plots lines at the highest and lowest prices recorded during that period. It is particularly useful for identifying key levels of support and resistance within a specified time range.
Features:
User-Defined Time Frame: Traders can input their desired start and end times in a 24-hour format, allowing flexibility to analyze different market sessions.
High and Low Price Levels: The indicator plots lines representing the highest and lowest prices observed within the specified time frame each day.
Clear Visual Representation: The high and low lines are color-coded for easy identification, with the high & low prices in Kintsugi Trading Gold.
How to Use:
Set the Time Frame:
Adjust the "Start Time Hour" and "Start Time Minute" to define the beginning of your desired time frame.
Adjust the "End Time Hour" and "End Time Minute" to define the end of your desired time frame.
Analyze Key Levels:
Al Brooks popularized the following idea and basis for creating this indicator:
On a 5-minute chart, Bar 1 has a 20-30% chance of being the High or Low of the day.
Bar 12 has a 50% chance.
Bar 18 has an 80-90% chance.
Use the plotted lines to identify significant support and resistance levels within your specified time frame. These levels can help inform your trading decisions, such as entry and exit points.
Good luck with your trading!

Hourly Trading System (Zeiierman)█ Overview
The Hourly Trading System (Zeiierman) is designed to enhance your trading by highlighting critical price levels and trends on an hourly basis. This indicator plots the open prices of hourly and 4-hour candles, visualizes retests, displays average price lines, and overlays higher timeframe candlesticks. It is particularly beneficial for intraday traders seeking to capitalize on short-term price movements and volume patterns.
█ How It Works
This indicator works by plotting significant price levels and zones based on hourly and 4-hour candle opens. It also includes functionalities for identifying retests of these levels, calculating and displaying average prices, and showing high and low labels for each hour.
█ Timeframe
The Hourly Trading System is designed to be used on the 1-minute or 5-minute timeframe. This system is tailored for intraday trading, allowing traders to find optimal entries around hourly opening levels and providing an easy method to identify the hourly trend. It works effectively on any market.
█ How to Use
Trend Analysis
Quickly gauge where the current price stands relative to key hourly and 4-hour levels. The plotted lines and zones serve as potential support and resistance areas, helping traders identify crucial points for entry or exit.
Utilize the 1-hour average and higher timeframe candles to understand the overall market trend. Aligning intraday strategies with larger trends can enhance trading decisions.
Use the bar coloring to quickly gauge the 1-hour trend on a lower timeframe. The bar colors indicate whether the hourly trend is bullish (green) or bearish (red), helping traders make quicker decisions in alignment with the overall trend.
Retest Identification
Enable retest signals to see where the price retested the hourly open levels. These retest points often signal strong price reactions, offering opportunities for trades based on support/resistance flips.
One effective strategy to incorporate is looking for price flips when a new hour starts. This approach involves monitoring price action at the beginning of each hour. If the price breaks and retests the hourly open level with strong momentum, it could indicate a potential trend reversal or continuation. This strategy is effective in volatile markets where price movements are significant at the start of each new hour.
Liquidity Sweep Strategy
Another common and effective strategy is the liquidity sweep. This involves identifying key levels where liquidity is likely to accumulate, such as previous hour highs and lows, and observing how the price interacts with these price levels. When the price sweeps through these levels, triggering stop-loss orders or pending orders, it often results in a sharp price movement followed by a reversal. Traders can capitalize on these movements by entering trades in the direction of the reversal once the liquidity sweep has occurred.
Equal Highs and Lows Strategy
The Equal Highs and Lows strategy leverages the concept of identifying levels where the price forms multiple highs or lows at the same level over different hourly periods. These equal highs and lows often indicate strong support or resistance levels where liquidity is accumulated. When the price approaches these levels, it is likely to trigger stop-loss orders and lead to significant price movements. Traders can look for breakouts or reversals around these levels to enter trades with higher probability setups.
█ Settings
Zone Width: Specifies the width of the zone around the 1-Hour Open as a percentage. Adjust this to widen or narrow the zone.
Show Retests: Enables or disables the display of retest markers. Retest markers show where the price has retested the 1-Hour Open line.
Number of Retests: Sets the number of retests to display. Adjust this to see more or fewer retest markers.
Volume Filter: Enables or disables the volume filter for retests. Use this to highlight retests with significant volume.
Volume Filter Length: Sets the length of the volume filter, smoothing the volume data to reduce noise.
1-Hour Average Line: Enables or disables the 1-hour average price line. This line shows the average price over the past hour.
Hourly High & Low Labels: Enables or disables the display of hourly high and low labels, marking the highest and lowest prices within each hour.
Candlesticks: Enables or disables the display of candlesticks on the chart, providing a detailed view of price action.
Bar Color: Enables or disables bar coloring based on price direction, with up bars in green and down bars in red.
Timeframe: Sets the timeframe for higher timeframe candles. Adjust this to match the period you want to analyze.
Number of Candles: Sets the number of higher timeframe candles to display. Increase this to see more candles on the chart.
Location: Sets the location for higher timeframe candles, allowing you to position them left or right on the chart.
-----------------
Disclaimer
The information contained in my Scripts/Indicators/Ideas/Algos/Systems does not constitute financial advice or a solicitation to buy or sell any securities of any type. I will not accept liability for any loss or damage, including without limitation any loss of profit, which may arise directly or indirectly from the use of or reliance on such information.
All investments involve risk, and the past performance of a security, industry, sector, market, financial product, trading strategy, backtest, or individual's trading does not guarantee future results or returns. Investors are fully responsible for any investment decisions they make. Such decisions should be based solely on an evaluation of their financial circumstances, investment objectives, risk tolerance, and liquidity needs.
My Scripts/Indicators/Ideas/Algos/Systems are only for educational purposes!
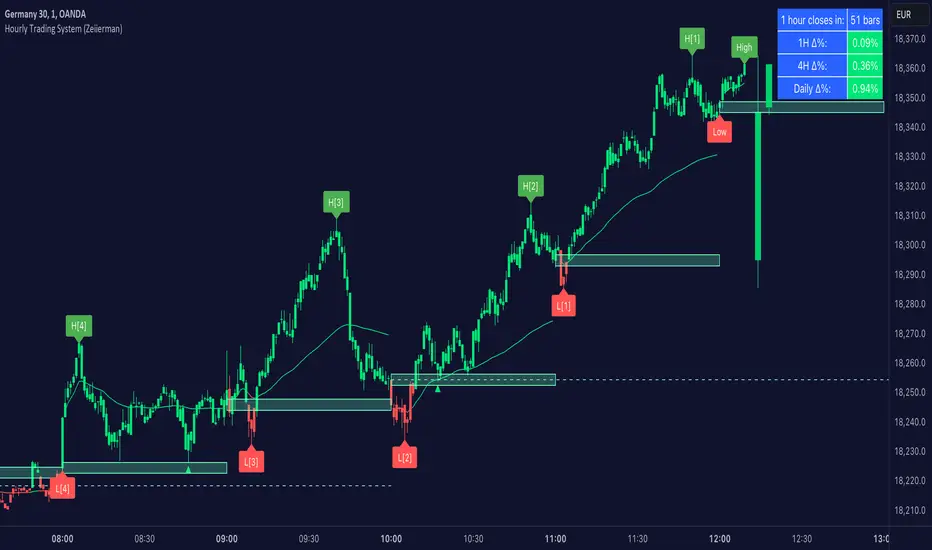
Double RSI 00 1.0This script creates a custom indicator, visualizes two RSI values (RSI1 and RSI2) on the chart and generates alerts based on different RSI-related conditions, which can be used for technical analysis and trading strategies. Users can customize the RSI parameters and alert levels according to their preferences.
It includes several input parameters that allow the user to customize the RSI calculations and overbought/oversold levels. These parameters include:
length_1: RSI1 Length (default: 7)
length_2: RSI2 Length (default: 12)
overbought_1: Overbought Signal level for RSI1 (default: 75)
oversold_1: Oversold Signal level for RSI1 (default: 25)
overbought_2: High Overbought Signal level for RSI1 (default: 85)
oversold_2: High Oversold Signal level for RSI1 (default: 15)
The script calculates two RSI values: rsi_1 and rsi_2, based on the high and low prices averaged (hl2) and the specified RSI lengths.
It plots these RSI values on the chart using different colors and line widths.
Several horizontal lines are drawn on the chart to represent key levels:
h0: 0 (Lower Band)
h1: 50 (Middle Band)
h2: 100 (Upper Band)
h3: The Oversold level (customizable)
h4: The Overbought level (customizable)
h5: The High Oversold level (customizable)
h6: The High Overbought level (customizable)
The script defines alert conditions for various signals, including overbought, oversold, high overbought, high oversold, long (crossover between RSI1 and RSI2), and short (crossunder between RSI1 and RSI2).
It sends alerts when these conditions are met, indicating potential trading signals.
Please note that this script is meant for educational purposes and should be used cautiously in a real trading environment. It's important to have a thorough understanding of technical analysis and risk management when using such indicators in actual trading.
ATR LevelsThe indicator calculates and displays key levels based on the Average True Range (ATR) of an asset's price. The ATR is a measure of market volatility, and this indicator uses it to create trigger levels and ATR target levels. The "ATR Levels" indicator helps traders identify potential entry and exit points based on market volatility, providing valuable information for their trading decisions.
The indicator adds text labels to indicate whether the levels are for "Puts" or "Calls" on the trigger levels, and "Target 1" or "Target 2" on the ATR target levels.
Input Description:
ATR Length: This is an input parameter that allows the user to set the number of periods used to calculate the Average True Range (ATR). The ATR measures the market's volatility, and a higher length value will result in a smoother ATR line.
Trigger Percentage: Another input parameter that determines the percentage above and below the previous day's close at which the trigger levels will be plotted. It allows traders to set the sensitivity of the trigger levels.
Lower Trigger Level Color and Upper Trigger Level Color: These input parameters allow the user to customize the colors of the trigger levels. The indicator will plot two lines representing the lower and upper trigger levels.
Level Size: This input parameter allows the user to adjust the thickness of the trigger level lines.
ATR Target Color: An input parameter that sets the color for the ATR target level lines.
ATR Target Multiplier 1 and ATR Target Multiplier 2: These are input parameters that allow the user to set the multiplier for calculating the ATR target levels. The indicator will plot two ATR target lines above and below the previous day's close, each multiplied by the specified multiplier.
Advanced Momentum TrackerThe Advanced Momentum Tracker (AMT) is a technical indicator designed to identify high-probability trend reversals and momentum shifts in real-time. Unlike traditional indicators that rely solely on mathematical formulas, AMT analyzes price action structure and historical patterns to detect when market momentum is shifting from bullish to bearish (and vice versa).
Core Methodology:
The indicator tracks consecutive price movements and maintains a comprehensive database of historical momentum patterns. It identifies trend changes by analyzing:
Sequential candle relationships (opens and closes)
Break of key trailing stop levels formed by recent price action
Historical success rates of similar momentum patterns
Key Features
1. Dynamic Levels:
Automatically plots real-time dynamic trailing stop levels based on current momentum
Color-coded lines: Green for bullish momentum, Red for bearish momentum
These levels act as trigger points for potential trend changes
2. Entry Signal Markers:
Clear BUY (↑) and SELL (↓) arrows when momentum shifts are detected
Arrows positioned above/below candles for maximum visibility ,Signals only appear on confirmed trend changes
3. Momentum Score Display:
Shows statistical probability based on historical pattern analysis
Displays strength percentage of current momentum continuation
Helps traders assess confidence level of the current trend
4. Exit Zone Indicator:
Plots recommended exit levels for active positions
Dynamic color coding: Red for long exits, Green for short exits
Warning system (orange) when price breaches exit zones
5. Position Management Filter:
Optional risk filter to avoid trades with excessive distance from trigger level
Customizable position threshold percentage
Helps maintain consistent risk-reward ratios
6. Comprehensive Alert System:
Customizable alert messages for both long and short signals
Configurable alert frequency (once per bar or once per bar close)
Real-time notifications for all signal types
Customization Options-
Visual Settings:
Toggle visibility of current price level, momentum score, and exit zones
Customizable colors for all elements (bullish/bearish themes)
Adjustable line thickness for dynamic levels
Entry Markers:
Custom colors for long and short entry signals
Adjustable arrow distance from candles
Core Parameters:
Historical Depth: Amount of past data to analyze (default: 20,000 bars)
Sensitivity Level: Controls how strong a move must be to trigger signals (default: 4)
Higher values = fewer but stronger signals
Lower values = more signals with earlier entries
Position Management:
Enable/disable position filter
Set maximum acceptable risk threshold as percentage
How It Works:-
Momentum Detection Engine: The script continuously monitors price action, tracking each bullish and bearish leg. It maintains arrays of opens, closes, and counts to build a comprehensive picture of market structure.
Pattern Recognition: When price breaks key levels (minimum/maximum of recent candles based on sensitivity), the indicator recognizes a potential momentum shift.
Statistical Validation: The script compares the current pattern against its historical database to calculate the probability of momentum continuation.
Signal Generation: When a valid trend change is detected (and passes the position filter if enabled), entry signals are displayed with corresponding exit zones.
Best Use Cases:
Swing trading on any timeframe (works on 1m to 1D charts)
Trend reversal identification
Momentum trading strategies
Works on all markets: Forex, Stocks, Crypto, Indices, Commodities etc
Recommended Settings:
Scalping/Day Trading: Sensitivity 2-3, Historical Depth 10,000-20,000
Swing Trading: Sensitivity 3-4, Historical Depth 20,000-30,000
Position Trading: Sensitivity 4-5, Historical Depth 30,000+
Important Notes:
Signals appear only on confirmed bars (not on real-time candles unless confirmed)
The momentum score becomes more accurate as more historical data is processed
Position filter should be adjusted based on the volatility of the instrument being traded
Best used in conjunction with proper risk management and position sizing
What Makes This Indicator Unique:
Unlike indicators that simply apply mathematical formulas to price data, AMT learns from historical price behavior. It doesn't just tell you what happened—it tells you what's likely to happen next based on thousands of similar situations in the past. The statistical momentum score provides an edge that pure technical indicators cannot offer.
Disclaimer: This indicator is a tool for technical analysis and should not be used as the sole basis for trading decisions. Always use proper risk management and combine with your own analysis. Happy Trading !!

Previous Day Week Month Highs & Lows [MHA Finverse]Previous Day Week Month Highs & Lows is a comprehensive multi-timeframe indicator that automatically plots previous period highs and lows across Daily, Weekly, Monthly, 4-Hour, and 8-Hour timeframes. Perfect for identifying key support and resistance levels that often act as magnets for price action.
How It Works
The indicator retrieves the highest high and lowest low from the previous completed period for each selected timeframe. Lines extend forward into current price action, allowing you to see when price approaches or breaks these critical levels in real-time. The indicator tracks the exact bar where each high and low occurred, ensuring accurate historical placement.
---
Key Features
Multi-Timeframe Levels:
• Current Daily, Previous Daily, 4H, 8H, Weekly, and Monthly highs/lows
• Fully customizable colors and line styles (Solid, Dashed, Dotted)
• Adjustable line width and extension length
Visual Enhancements:
• Price labels showing exact level values
• Range position percentage (distance from high/low)
• Optional period boxes highlighting timeframe ranges
• Day and date labels for reference
Trading Tools:
• Breakout markers when price crosses key levels
• Touch count tracking (how many times price tested each level)
• Time at level display (consolidation detection)
• Customizable thresholds for touch and time analysis
Alert System:
• Individual alerts for each timeframe: Daily High/Low Break, 4H High/Low Break, 8H High/Low Break, Weekly High/Low Break, Monthly High/Low Break
• Toggle switches to enable/disable alerts per timeframe
• Clear messages showing which level was broken and at what price
---
How to Use
Setup:
1. Enable your preferred timeframes in "Highs & Lows MTF" settings
2. Customize colors and styles to match your chart
3. Turn on visual features like price labels and range percentages
4. Set up alerts by creating specific alert conditions or using toggle switches
Trading Applications:
Breakout Trading: Watch for strong momentum when price breaks above previous highs or below previous lows
Support/Resistance: Use these levels as potential reversal points for entry/exit signals
Range Trading: Trade between previous highs and lows using the range position indicator
Stop Loss Placement: Place stops just beyond previous highs (shorts) or lows (longs)
Multiple Timeframe Confirmation: Combine timeframes for stronger signals (e.g., Daily near Weekly support)
---
Best Practices
• Use Weekly/Monthly for swing trading, Daily/4H/8H for day trading
• Combine with volume or momentum indicators for confirmation
• Multiple timeframe levels clustering together create high-probability zones
• The more touches a level has, the more significant it becomes
---
Disclaimer
This indicator is a technical analysis tool for identifying price levels based on historical data. It does not guarantee profits or predict future movements. Trading involves substantial risk. Always use proper risk management and never risk more than you can afford to lose.
