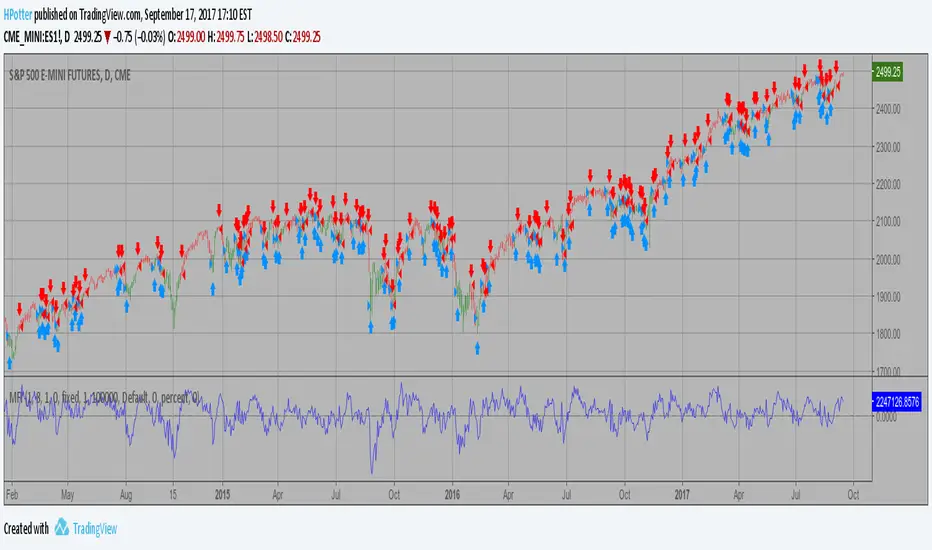
Indicator Based Market Exposure (IBME)The Indicator Based Market Exposure (IBME) system was created by Big Wave Chartist as a way to navigate the markets using a confluence of three different signals to determine when the "internals" of the market are in your favor and how heavily invested to be at any point. The idea of the system is also to flash warning signs when the market internals are beginning to deteriorate so as to take a defensive stance. Of course this system can be strictly adhered to, or it can be incorporated into a more discretionary style of trading, and be combined with progressive exposure into (and out of) the market as positions gain (or lose) traction.
The IBME displays a straightforward action signal based on the combination of the 3 separate signals:
Green 🟢 Full size-longs permitted
Yellow 🟡 Pilot positions permitted
Red 🔴 No longs allowed
So let's get into the signals used:
McClellan Summation Index
Net New Highs/Lows
Net New Highs Crossover
McClellan Summation Index (MSI)
The McClellan Summation Index is a long-term version of the McClellan Oscillator, which is a market breadth indicator based on stock advances and declines. Interpretation is similar to that of the McClellan Oscillator, except that it is more suited to intermediate to major trends and related reversals. The McClellan Summation Index can be calculated as the sum of all the daily values of the McClellan Oscillator. This is used along with the 10-sma to watch for a crossover indicating an uptrend or downtrend beginning.
Net New Highs/Lows
This is the net number of stocks making 52-week highs or lows. For instance, if there are 60 new 52-week highs and 20 new 52-week lows, the net number will be 40 net new 52 week highs. This signal is particularly useful in gauging breadth.
Net New Highs Crossover
This is the description of NNHC from the original separate version of this indicator created by HikoStory: "Net New Highs can guide you to increase or decrease your exposure based on the current market health. They are calculated by subtracting the new highs from the new lows, based on all stocks of the...NASDAQ. A positive value shows that the market is doing good, since more stocks are making new highs compared to new lows. A negative value shows that the market is doing bad, since more stocks are making new lows compared to new highs. Combined with a moving average you can see crossovers that can warn you early when there is a change in the current market health."
The default index for the IBME is the Nasdaq.
The IBME is meant to be used on a daily time frame chart, therefore the signal will only show on a daily time frame chart.
Display options include:
Show/hide individual signals
Table background/font color
Table size/placement
In den Scripts nach "indicator" suchen

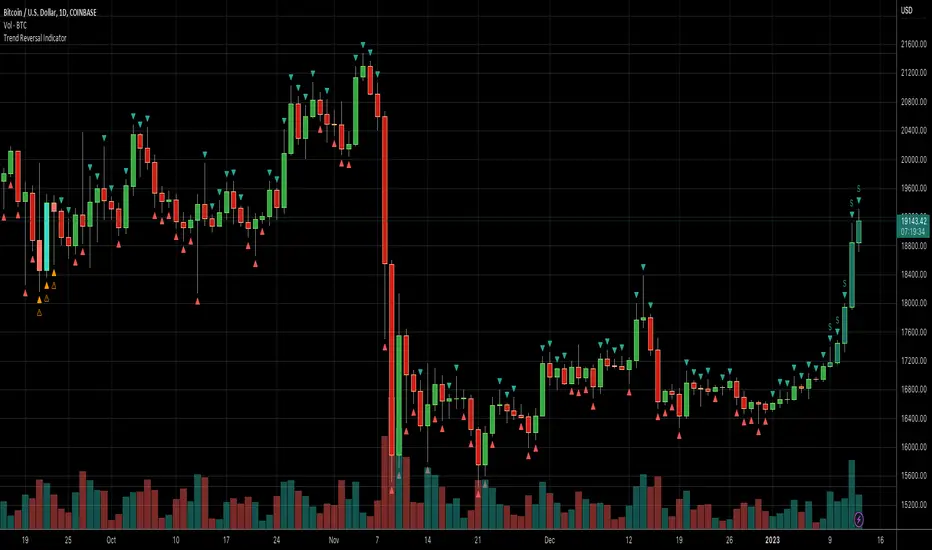
Daily Number/Trend Reversal IndicatorIndicator identifies potential price trend exhaustion.
Compares this period against the 4th prior period for the condition.
9 periods (or more) with the same condition is an indicator that the trend is ending soon.
Indicator Daily-Weekly-Range-In-PriceSpecification: Indicator Daily-Weekly-Range-In-Price helps traders to easily identify the price movement of a range that goes from highs to lows in a specific timeframe. Range price can be chosen between daily or weekly. It can be integrated with strategies giving us more information abot price movement.
Name:Daily-Weekly-Range-In-Price
Category: Mean Reversion. Range Trading
Timeframe: From weekly below, depending on the specific technique.
Technical Analysis: The indicator uses price action from daily to weekly using highs/lows to detect the range movement.
Suggested usage: Every Market especially for Swing Trading Operativity.
Daily-Weekly-Range-In-Price Indicator can identify automatically the range between highs and lows from weekly to minor timeframes with labels on the charts and an histogram helping shown on the chart to easily identify the volatility range juat at one glance.
Highly Dinamic Inputs Settings: Timeframe can be changed from the input options, labes indicating the range in price will change automatically.

Indicator for proxy BTC and ALT dominanceThis indicator calculates a proxy for BTC dominance and ALT domance from total crypto cap by removing USDT and USDC. The indicator has 4 plots:
Proxy BTC Dominance = BTC dominance / (total crypto cap - stablecoin cap)
Proxy ALT Dominance = (Total crypto cap - stablecoins - btc cap) / (total crypto cap - stablecoin cap)
A reference plot of BTC Dominance
A reference plot of Stablecoin dominance

Roberts Pi Cycle Top and Bottom Indicator BTCIndicator Overview
The Pi Cycle Top Indicator has historically been effective in picking out the timing of market cycle highs to within 3 days.
It uses the 111 day moving average (111DMA) and a newly created multiple of the 350 day moving average, the 350DMA x 2.
This updated indicator is based on the original x2 Daily Simple Moving Average Pi Cycle Top Indicator for BTCUSD but with the addition of a 3rd 350 SMA
Standard Pi Cycle SMA = 350*2 SMA + 111 SMA
Updated Pi Cycle SMA = 350*2 SMA + 111 SMA + 350 SMA
How It Can Be Used / How to Read:
Chart should be used on BTCUSD only
Chart should be set to Daily Timeframe only
Buy signal RED SMA crosses up over WHITE SMA
Sell Signal RED SMA crosses up over GREEN SMA (a vetical yellow line will indicate the cycle top)

Pi Cycle Top IndicatorIndicator Overview
The Pi Cycle Top Indicator has historically been effective in picking out the timing of market cycle highs to within 3 days.
It uses the 111 day moving average (111DMA) and a newly created multiple of the 350 day moving average, the 350DMA x 2.
Note: The multiple is of the price values of the 350DMA not the number of days.
For the past three market cycles, when the 111DMA moves up and crosses the 350DMA x 2 we see that it coincides with the price of Bitcoin peaking.
It is also interesting to note that 350 / 111 is 3.153, which is very close to Pi = 3.142. In fact, it is the closest we can get to Pi when dividing 350 by another whole number.
It once again demonstrates the cyclical nature of Bitcoin price action over long time frames. Though in this instance it does so with a high degree of accuracy over the past 7 years.
How It Can Be Used
Pi Cycle Top is useful to indicate when the market is very overheated. So overheated that the shorter term moving average, which is the 111 day moving average, has reached a x2 multiple of the 350 day moving average. Historically it has proved advantageous to sell Bitcoin at this time in Bitcoin's price cycles.
Created By
Philip Swift

Indicator - ATR Profit Loss - DGHi Traders,
This is an on chart indicator that can be used for setting take profit and stop losses very easily using the Average True Range Indicator (ATR). Using a volatility adjusted TP and SL will allow you to set your targets and losses based on market conditions. In the settings, you are able to adjust how much of a multiplier you require depending on your risk tolerance and strategy. For those that follow the NNFX method, the defult settings are preset to 1xATR TP and 1.5xATR SL.
How to use:
- For longs, 'isLong' box must be ticked, for shorts, this box is unticked
- For longs, green line is TP, red line is SL
- For shorts, red line is TP, green line is SL
Regards,
Dillon Grech

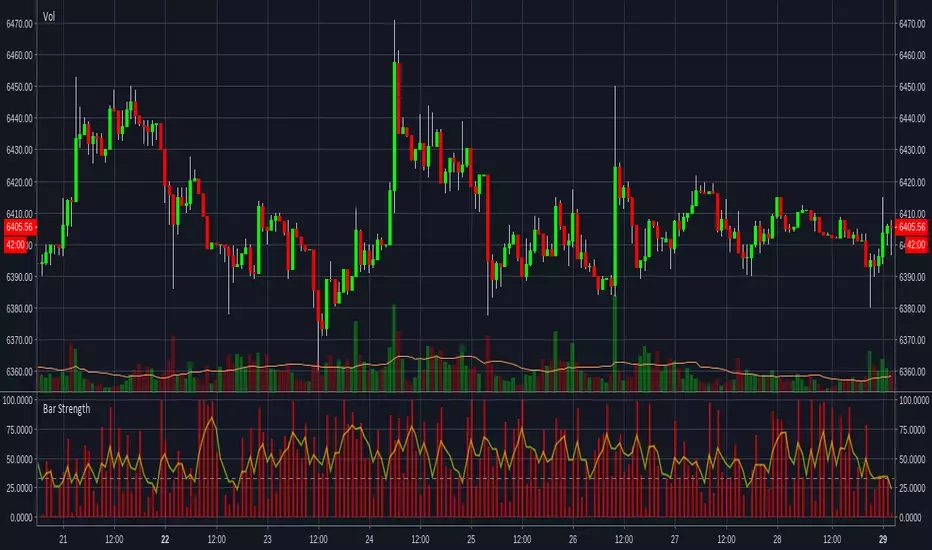
Bar Strength IndicatorIndicator to measure the size of the candle body against the whole candle including the wicks. More information can be found here www.fxstreet.com
This indidactor is based on Marco Mayers article. All credits go to him.
Taleb's Signal to Noise IndicatorIndicator that helps you find potential entries and exits. This indicator is modeled after a public tip by N. Taleb.

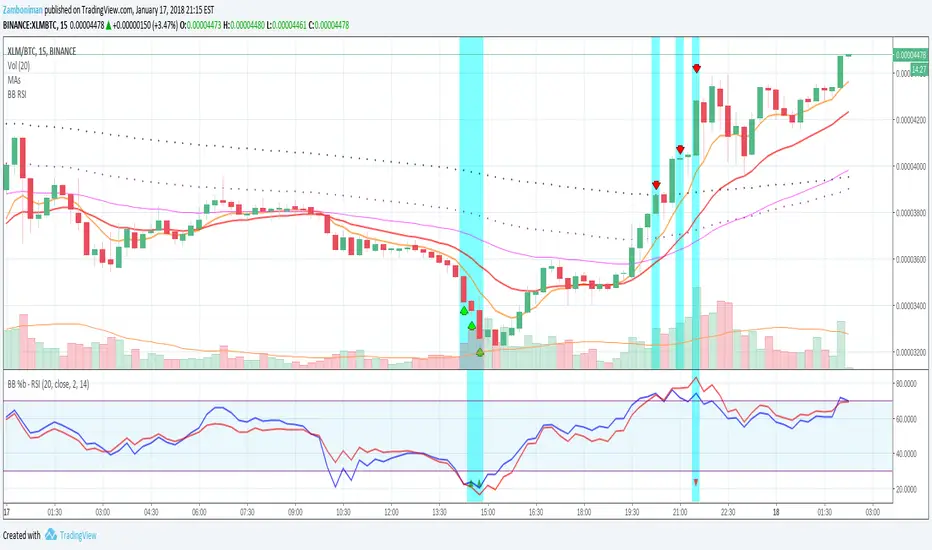
BB %b & RSI Indicator & AlertIndicator for displaying both RSI and a normalized Bollinger Bands %b (Usual 0 - 1 range of BB normalized to the 30 - 70 OB/OS range of RSI) simultaneously.
Settable periods for RSI and BB, and settable standard deviation for BB.
When both Bollinger Bands %b and RSI are OB/OS then the column will turn blue and a buy/sell arrow will appear in the indicator provided other conditions pertaining to the OB/OS condition in one of the last two candles are also met.
You can also set an alert on the arrow indicator appearing.
I use this mainly for Cryptocurrencies, though it is usable in Forex, for shorter time periods to indicate possible trade opportunities.
Money Flow Indicator (Chaikin Oscillator) Indicator plots Money Flow Indicator (Chaikin). This indicator looks
to improve on Larry William's Accumulation Distribution formula that
compared the closing price with the opening price. In the early 1970's,
opening prices for stocks stopped being transmitted by the exchanges.
This made it difficult to calculate Williams' formula. The Chaikin
Oscillator uses the average price of the bar calculated as follows
(High + Low) /2 instead of the Open.
The indicator subtracts a 10 period exponential moving average of the
AccumDist function from a 3 period exponential moving average of the
AccumDist function.
You can change long to short in the Input Settings
WARNING:
- For purpose educate only
- This script to change bars colors.
Money Flow Indicator (Chaikin Oscillator) Strategy Indicator plots Money Flow Indicator (Chaikin). This indicator looks
to improve on Larry William's Accumulation Distribution formula that
compared the closing price with the opening price. In the early 1970's,
opening prices for stocks stopped being transmitted by the exchanges.
This made it difficult to calculate Williams' formula. The Chaikin
Oscillator uses the average price of the bar calculated as follows
(High + Low) /2 instead of the Open.
The indicator subtracts a 10 period exponential moving average of the
AccumDist function from a 3 period exponential moving average of the
AccumDist function.
WARNING:
This script to change bars colors.

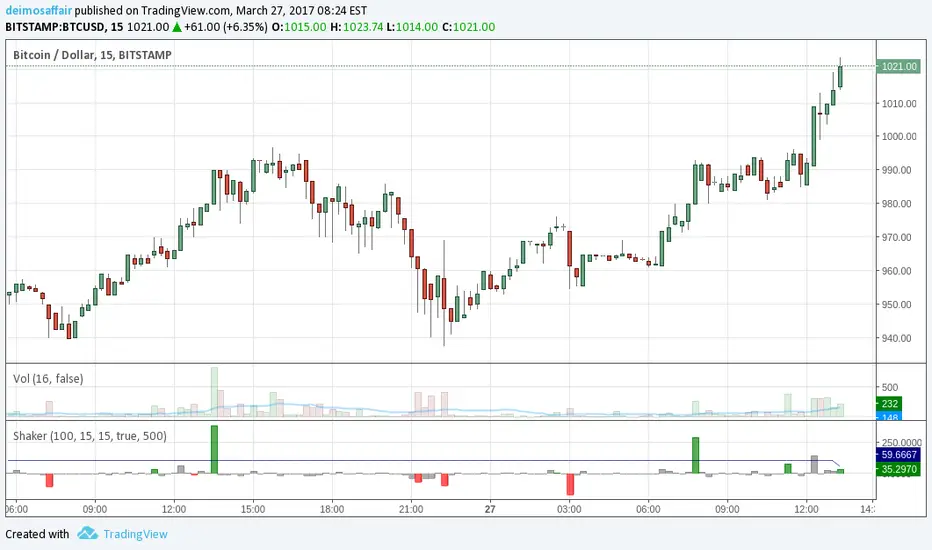
Cooltoyz: market shaker v1.0Panicking over a big ass candle? wondering what's happening on a flat market? Despair no more, this indicator could help with that :)
The market Shaker calculates the price differences, and weights them with the volume used for the move. This volume is not the plain value, but a measure of the past X volume candles.
Examples:
price moves 3%, but with a volume of only ~80% of last candles. looks like weak move
price moves 0.4%, but the volume was a massive 220% bigger than last candles. something happened, even if the market absorbed it all, better pay attention.
in each case, the shaker indicator makes the calculated value bigger/smaller to account for the volume weight of the move.
It's also i real time, the current candle weight is considered on how much time it remains to close. Example, on the 1H chart, if the last candle is 45min to close, the values for the volume are weighted to 25%, since is only 15min "old", while all the other candles are 1h, so the candle is only 25% of it's time to close.
The indicator options has the arguments required to tune the indicator, the candles minutes must match the chart, or the results go crazy.
Realtime Volume Checker : reloadedthe main rules are in version 1.0 of this indicator, here: and they provide useful info to make sense of the indicator
two important improvements:
1 - the candle period is now provided in minutes
2 - the volume MA size does not make an average abymore, now IT CHOOSES the highest value in the range. this provides less, but more significant signals.


Ichimoku Strict exit indicatorIndicator for ichimoku with exit
entry - when all cond meet
exit on base line

Intraday Trading IndicatorIndicator Overview
Moving Averages: Uses a fast EMA (9-period) and a slow EMA (21-period) to determine the trend direction.
Market Profile Approximation: Utilizes VWAP (Volume Weighted Average Price) as a simplified proxy for value area, acting as a dynamic support/resistance level.
SMC: Incorporates the concept of trend confirmation and price interaction with key levels, focusing on pullbacks to the fast EMA within a trending market.
Signals: Generates buy and sell signals when price crosses the fast EMA, filtered by the trend (fast EMA vs. slow EMA) and VWAP position, aiming for high-probability setups.
This design ensures responsiveness on short timeframes while filtering out noise, aligning with the goal of accurate signals for intraday trading.

Wick Percentage IndicatorIndicator for upper and lower wicks. One plot for upper wick, one for lower.
Percentage of wick is based on the opening price of the candle.

Indicator For TrangThis indicator is based on MACD crosses and EMA and SMA crosses. The idea is to print arrows after breakouts and also when the pullback is finished.

DOJI FU IndicatorIndicator is designed to paint a doji, the size of which can be adjusted in settings.
Provided there is a valid doji, the following candle is a 'FU candle' or an 'Institution' candle. This candle wicks above/below the doji and takes liquidity from above or below.
Colours can be changed
Red = Doji candle
Yellow = FU candle
Example shown on the 1hr chart, red doji indicating a change of trend upwards, the FU candle (yellow) takes liquidity from above and sweeps down.

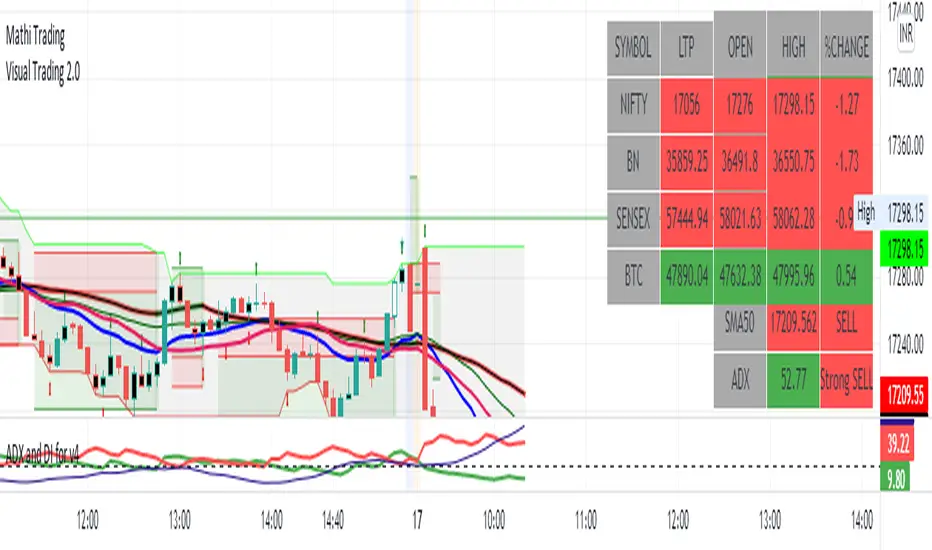
Indicator by MathiCheck out my new indicator i have added pivot, super trend, ema's and sma's everything