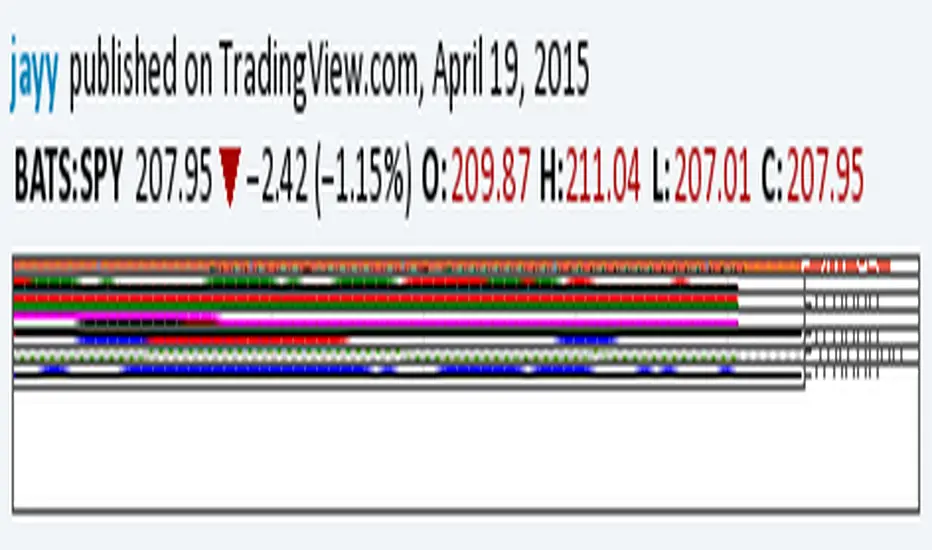
Intramarket Correlator L-O-L-A excerptHere we have an intramarket correlator taken as an excerpt from the L-O-L-A institutional trading system.
The plot displayed on the screen is the correlation index of the correlated security plotted against the security data series. Suggest simple line plots of contrasting colors.
When the plot is below the security price this is an indication of a strong negative correlation. When the plot is above the security price this is indicative of a strong positive correlation.
Provided for free by Tarzan at tradingview. or noprism@hushmail.com
plz contact for more information on L-O-L-A
*** Past performance is not necessarily indicative of future results ***
Life is like a moving picture
Nothing in life is a permanent fixture
Ray Davies
In den Scripts nach "index" suchen

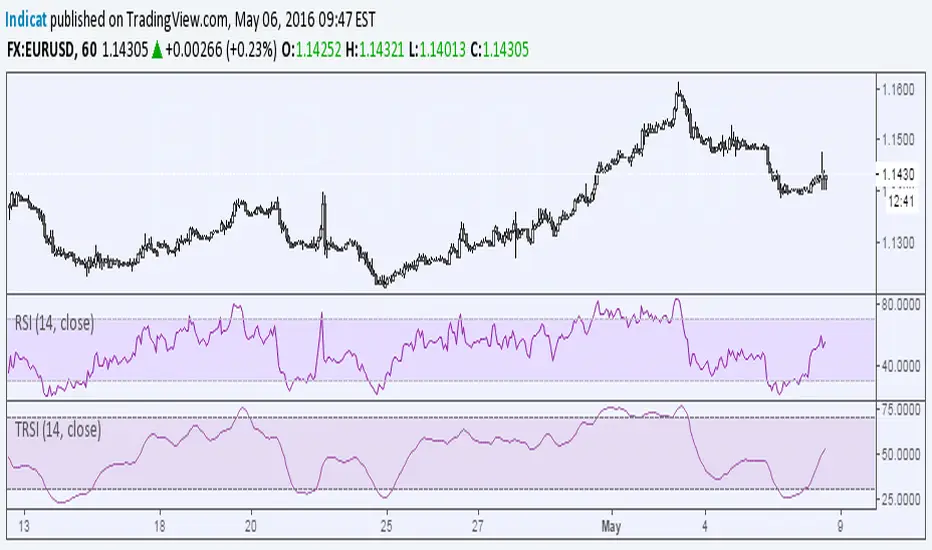
Relative Strength Index on TranquilizersSome weeks ago, I had a patient in my practice who suffered from internal stability disorders.
Certainly not a case of disordered thinking or schizophrenic behaviour, because his general sense of direction wasn’t the problem.
He just couldn’t find the right overall balance, an ailment he struggled with for years.
Straight away I could diagnose that surgery wasn’t an option, so I gave him a medicine he would clearly benefit from.
I never heard from him again…. He must be doing just fine.
Cheers, Indicat...
YOYO index I found this indicator while reading one of my favorite books on volume and didn't see it in the public library, so I thought I would code it up. Pretty simple actually, but I really enjoyed using it.
"Created by Richard Arms Jr. and explained in an article he penned for Barrons's in 1998, it combines the daily spread of a stock or index and divides the daily volume by that number to see how many shares it needs to trade in order to move the issue through one point of its daily spread. This is usually considered a broad market indicator, but is useful for individual issues as well. On a historical basis more volume is required in order to generate a wider price swing at tops, while the opposite is true at bottoms. This is explained by the emotions of greed and fear. At tops there is complacency which requires ever greater volume to get prices to swing in wider ranges, while at bottoms fear can cause greater swings on relatively lower volume."
--The Traders Book of Volume, by Mark Leibovit
This indicator is useful at identifying divergences and trend confirmation. It is also effective in shorter time-frames as well as much longer time frames. The original formula does not use any smoothing, but I have included it as I feel it dulls some of the shorter term sharp turns inherent in this indicator. There is also no adjustment to the length of Richard Arms' original, so I include it in case you feel you need to 'play' with the settings.
Remember, you are responsible for everything you do with any indicator and those results are entirely yours to claim, so by default I am not responsible for any losses nor am I entitled to any gains from the use of this indicator.
Enjoy and as always good trading,
Shiroki

YOYO indexI looked for this indicator in the public library and didn't find it so I thought I would offer it to anyone who felt like they would like to try it out. Frankly, the name caught my attention in one of my favorite books on volume "The Traders Book of Volume" by Mark Leibovit
"Created by Richard Arms Jr. and explained in an article he penned for Barrons's in 1998, it combines the daily spread of a stock or index and divides the daily volume by that number to see how many shares it needs to trade in order to move the issue through one point of its daily spread. This is usually considered a broad market indicator, but is useful for individual issues as well. On a historical basis more volume is required in order to generate a wider price swing at tops, while the opposite is true at bottoms. This is explained by the emotions of greed and fear. At tops there is complacency which requires ever greater volume to get prices to swing in wider ranges, while at bottoms fear can cause greater swings on relatively lower volume."
--The Traders Book of Volume, by Mark Leibovit
This indicator is useful at identifying divergences and trend confirmation. It is also effective in shorter time-frames as well as much longer time frames. The original formula does not use any smoothing, but I have included it as I feel it dulls some of the shorter term sharp turns inherent in this indicator. There is also no adjustment to the length of Richard Arms' original, so I include it in case you feel you need to 'play' with the settings. I hope you all find it useful. Good trading all,
Shiroki

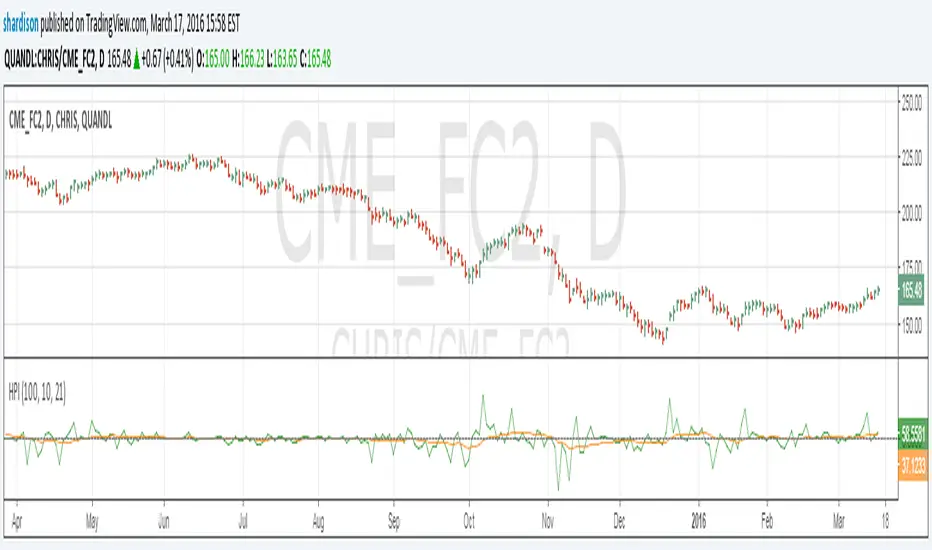
Herrick Payoff Index for Quandl DataUpdate to my previous Herrick Payoff Index script. This script pulls Quandl futures data with daily open interest. The prior version only used the weekly Commitment of Traders open interest data so could only be used on weekly bars. Note: Must use Quandl Symbol methodology in chart (i.e. enter symbol as QUANDL:CHRIS/CME_FC2, QUANDL:CME/FCX2016, ect.). Unfortunately, I haven't been able to program this to pull from the embedded futures data.

BTC Volume Index 1.1 beta [Dia]Indicator calculates total volume across multiple bitcoin exchanges. The influence of each exchange can be adjusted seperately.
0 fee exchanges default to 50%
0 fee futures default to 10%
Define custom lookback periods for price breakout detection.
Look for low-volume price reversals in those candles immediately following high volume peaks. The lower the volume and the greater the open/close price difference of that 2nd candle is compared to the previous one, the higher the likelihood of a local top/bottom being in.
Note:
Bar highlighting is still experimental, future versions will include better filtering options.
Use for confirmation only, not as standalone trading system.

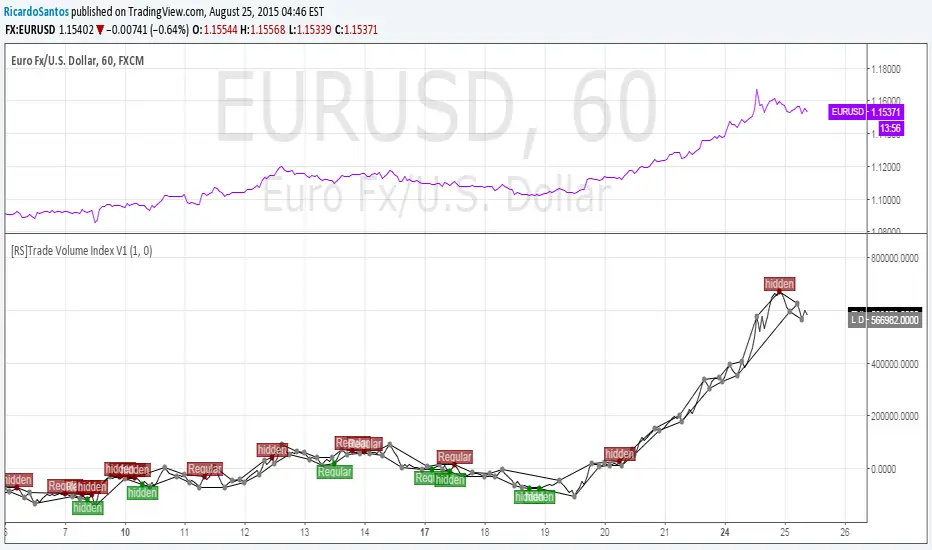
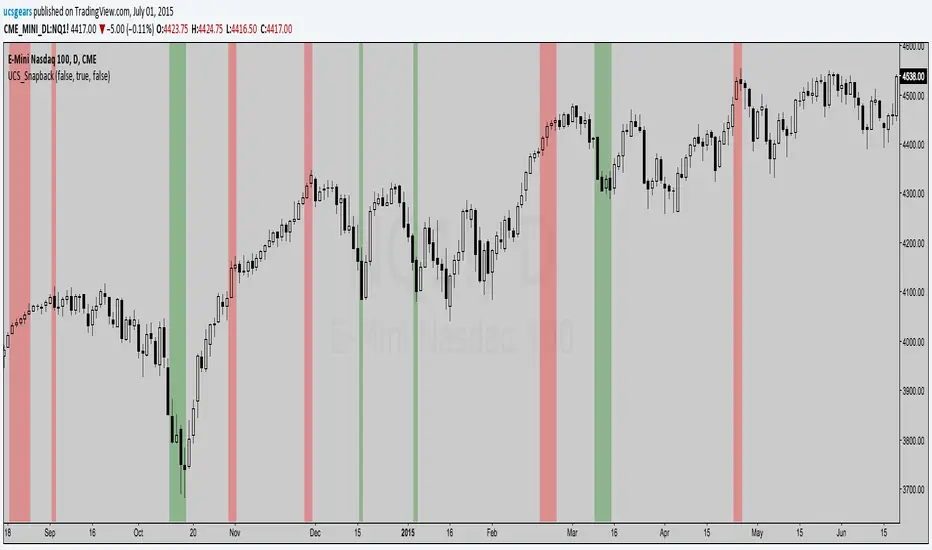
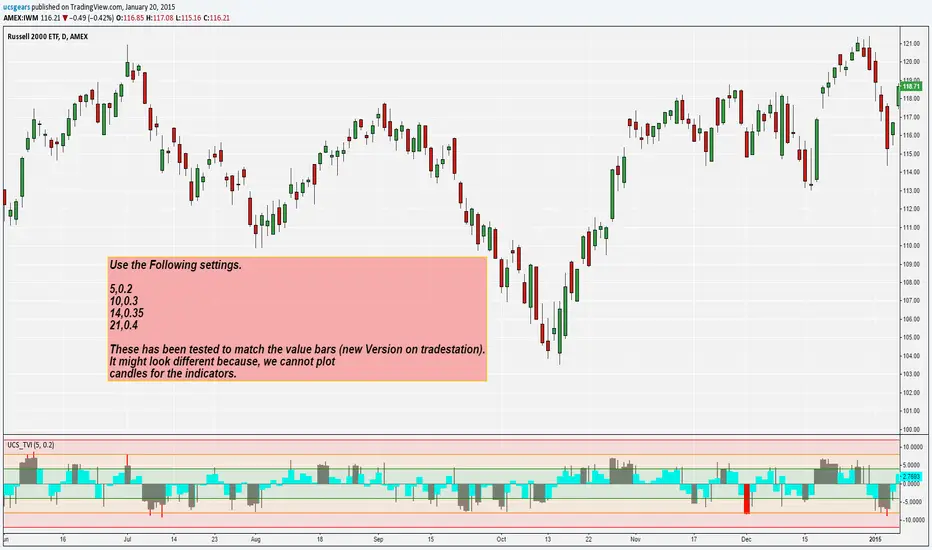
UCS_Extreme Snap Back (TVI)I am calling it a SNAP BACK indicator.
Utilizing the TVI (Transactional Value Index - Link below for indicator / setups)
You can pretty much guess when any instrument could slow down, last stand in a pullback and the last few candles before losing its strong trend.
It varies per person, a short term trader can use this, Long term traders can hedge with options.
A great tool for my trading. Thought I will share this.
This utilizes TVI indicator, currently the TVI is manipulated manually, I have automated a version for future release.
Embrace trading - keep the money flowing.
Composite Momentum Index [LazyBear]This is a composite oscillator derived from modified 5/10/20 Chande's Dynamic Momentum Index values.
Volatility is factored in, by design. Look for OB/OS extremes and divergences.
I added the green/red ribbon look to make it easy to read :)
More info:
www.investopedia.com
List of my public indicators: bit.ly
List of my app-store indicators: blog.tradingview.com

Relative strength to Index set up as per Leaf_WestRelative Strength to index as used by Leaf_West. If you follow his methods be aware of the different moving averages for the different time periods. From Leaf_West: "on my weekly and monthly R/S charts, I include a 13 EMA of the R/S (brown dash line) and an 8 SMA of the 13 EMA (pink solid line). The indicator on the bottom of the weekly/monthly charts is an 8 period momentum indicator of the R/S line. The red horizontal line is drawn at the zero line.
For daily or 130-minute time periods (or shorter), my R/S charts are slightly different - the moving averages of the R/S line include a 20EMA (brown dash line), a 50 EMA (blue dash line) and an 8 SMA of the20 EMA (pink solid line). The momentum indicator is also slightly different from the weekly/monthly charts – here I use a 12 period calculation (vs 8 SMA period for the weekly/monthly charts)." Leaf's methods do evolve and so watch for any changes to the preferred MAs etc..
Bitcoin Index vs. Futures OKCoin WeeklySimple adaptation to lastbattles script to add calculation for index price: calculation can be seen here: www.okcoin.com
I recommend setting it to columns, and setting price at 0, 0 to see divergence of sell/buy.

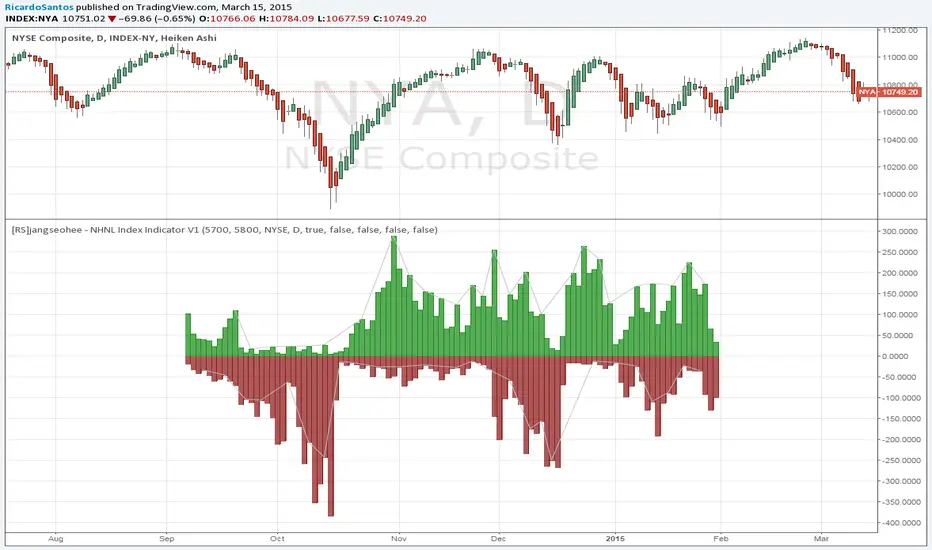
[RS]jangseohee - NHNL Index Indicator V1request for jangseohee: added option for different exchanges, added option to remove data before X point and after Y point in time using candle numbers.
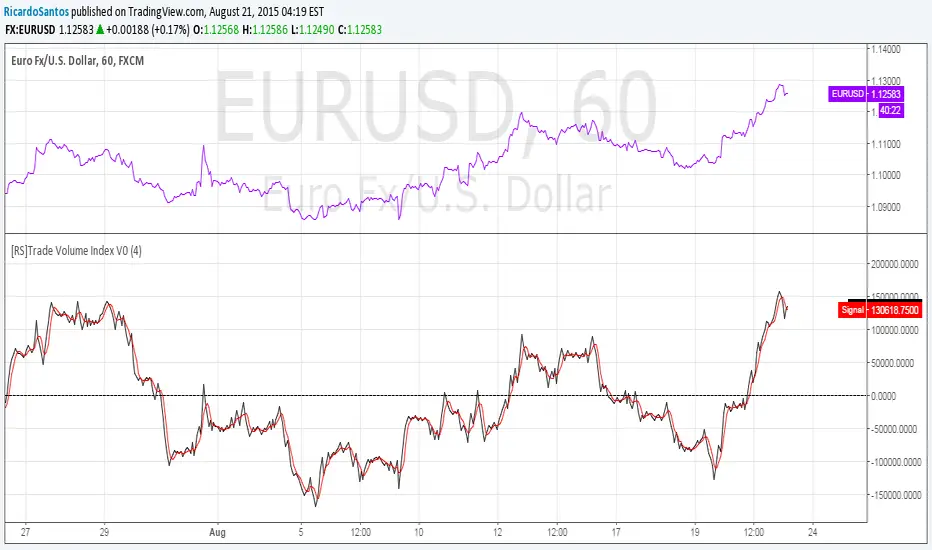
UCS_Transactional Valuation Index-Version 2Version 1 -
Updates include
Better Optimization on the levels.
Plotting only the important Highs and Lows
The extremes can be an important pivot levels.
Over and Undervalue - Gray (Column - close) (Histogram - High/Low)
Extreme conditions - Red
Extreme Alerts and Overlay will be added later.


Enhanced Index [LazyBear]The Enhanced Index (EIDX) is a modified William %R that behaves much like the original, to indicate overbought and oversold market conditions.
EIDX has the advantage of
- Reacting more quickly to changes in buying power.
- Predicting market turning points better than other oscillators. Divergences are more pronounced.
List of my other indicators:

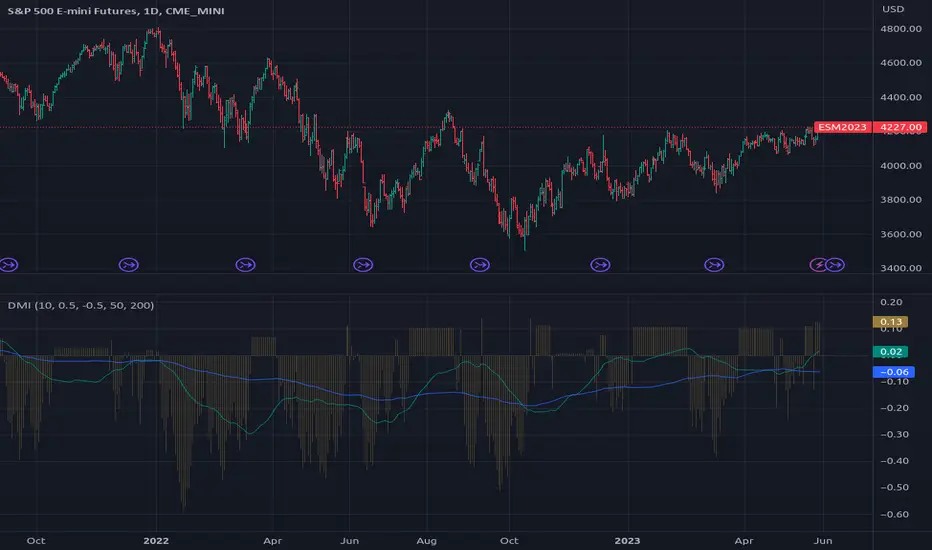
TheLark: Directional Movement Index OscillatorA modified DMI, This turns the standard DMI into an Oscillator. The DMI cross signal is the same, but as an OSC you get the added benefits or finding divergences, etc. The added WIlder's Average Line (blue) can help you see if a short term trend is getting less interesting.

The Lark: Directional Movement IndexAn open source version of the DMI. Mostly published for other scripters to modify.
Typical useage: www.investopedia.com

Indicator: Intrady Momentum IndexThe Intraday Momentum Index (IMI), developed by Tushar Chande, is a cross-breed between RSI and candlestick analysis. IMI determines the candle type that dominated the recent price action, using that to pinpoint the extremes in intraday momentum.
As the market tries to bottom after a sell off, there are gradually more candles with green bodies, even though prices remain in a narrow range. IMI can be used to detect this shift, because its values will increase towards 70. Similarly, as the market begins to top, there will be more red candles, causing IMI to decline towards 20. When the market is in trading range, IMI values will be in the neutral range of 40 to 60.
Usually intraday momentum leads interday momentum. QStick can show interday momentum, it complements IMI. You will find it in my published indicators.
I have added volatility bands based OB/OS, in addition to static OB/OS levels. You can also turn on IMI Ehlers smoothing. BTW, all parameters are configurable, so do check out the options page.
List of my other indicators:
-
- Google doc: docs.google.com
