JP7FX Signals ProJP7FX Signals Pro
Smart session signals based on structure, liquidity shifts and volatility filters.
Designed for use on the 1 minute timeframe.
What this tool does
This indicator builds signals around three things traders track every day.
• session ranges for Asia, Frankfurt, London and New York
• Fair Value Gap behaviour
• Supertrend shifts with volatility confirmation
The script draws each session range on your chart. It tracks when price breaks a session high or low, then checks if the market is above or below the daily open. These conditions help filter trades by direction during different sessions.
It also detects bullish and bearish Fair Value Gaps. The script tracks when an FVG forms, when price enters the imbalance and when it gets mitigated. These checks create part of the signal logic.
Supertrend is used as an extra filter. A crossover above or below the Supertrend gives a directional bias. When combined with session behaviour and FVG conditions, the script can mark possible long or short signals during London or New York.
How the signals form
A signal only prints when the script has all conditions in place.
This includes:
• a session range break in the correct direction
• a price position relative to the daily open
• confirmation from Supertrend
• FVG creation or mitigation on the right side of price
• liquidity taken in previous sessions
These rules reduce noise and avoid signals that appear in weak conditions.
What the indicator is for
• understanding how sessions behave on the 1 minute chart
• tracking liquidity behaviour
• seeing when a clean break and trend shift takes place
• getting notified when the market forms the conditions you set
This is not a buy or sell system on its own
Signals do not replace analysis. You still need market structure, higher timeframe direction, orderblocks or your own trade model.
A signal is only a prompt to look at the chart, not a confirmation to enter a trade.
Price can shift quickly around sessions, so check the context before acting on any alert.
Important notes
• designed for the 1 minute timeframe
• signals do not guarantee trend continuation
• conditions can form in strong or weak market phases
• use your own risk rules and validation before entering trades
JP7FX Signals Pro helps you track session behaviour and FVG interaction more efficiently, but trading decisions still need your full chart process.
In den Scripts nach "imbalance" suchen

FVG Tracker Pro (@JP7FX)FVG Tracker Pro (JP7FX)
FVG Tracker Pro monitors single timeframe Fair Value Gaps and tracks their behaviour over time. It shows when an FVG forms, when it closes and which candle completes the mitigation.
Features
• Tracks old FVGs so users can review how price interacted with previous gaps.
• Highlights when an FVG is fully mitigated and identifies the closing candle.
• Alerts for new FVG creation and FVG mitigation.
• Optional bar colours, visibility filters and 50 percent lines.
• Works on any asset and timeframe.
How It Helps
• Allows users to follow the lifecycle of each FVG.
• Reduces manual work by marking creation and mitigation automatically.
• Helps traders who study Smart Money concepts and price inefficiencies.
Alerts
Alert conditions are included for:
• New FVG creation
• Full mitigation of an FVG
Users can tailor alert settings to match their preference.

Obsidian Flux Matrix# Obsidian Flux Matrix | JackOfAllTrades
Made with my Senior Level AI Pine Script v6 coding bot for the community!
Narrative Overview
Obsidian Flux Matrix (OFM) is an open-source Pine Script v6 study that fuses social sentiment, higher timeframe trend bias, fair-value-gap detection, liquidity raids, VWAP gravitation, session profiling, and a diagnostic HUD. The layout keeps the obsidian palette so critical overlays stay readable without overwhelming a price chart.
Purpose & Scope
OFM focuses on actionable structure rather than marketing claims. It documents every driver that powers its confluence engine so reviewers understand what triggers each visual.
Core Analytical Pillars
1. Social Pulse Engine
Sentiment Webhook Feed: Accepts normalized scores (-1 to +1). Signals only arm when the EMA-smoothed value exceeds the `sentimentMin` input (0.35 by default).
Volume Confirmation: Requires local volume > 30-bar average × `volSpikeMult` (default 2.0) before sentiment flags.
EMA Cross Validation: Fast EMA 8 crossing above/below slow EMA 21 keeps momentum aligned with flow.
Momentum Alignment: Multi-timeframe momentum composite must agree (positive for longs, negative for shorts).
2. Peer Momentum Heatmap
Multi-Timeframe Blend: RSI + Stoch RSI fetched via request.security() on 1H/4H/1D by default.
Composite Scoring: Each timeframe votes +1/-1/0; totals are clamped between -3 and +3.
Intraday Readability: Configurable band thickness (1-5) so scalpers see context without losing space.
Dynamic Opacity: Stronger agreement boosts column opacity for quick bias checks.
3. Trend & Displacement Framework
Dual EMA Ribbon: Cyan/magenta ribbon highlights immediate posture.
HTF Bias: A higher-timeframe EMA (default 55 on 4H) sets macro direction.
Displacement Score: Body-to-ATR ratio (>1.4 default) detects impulses that seed FVGs or VWAP raids.
ATR Normalization: All thresholds float with volatility so the study adapts to assets and regimes.
4. Intelligent Fair Value Gap (FVG) System
Gap Detection: Three-candle logic (bullish: low > high ; bearish: high < low ) with ATR-sized minimums (0.15 × ATR default).
Overlap Prevention: Price-range checks stop redundant boxes.
Spacing Control: `fvgMinSpacing` (default 5) avoids stacking from the same impulse.
Storage Caps: Max three FVGs per side unless the user widens the limit.
Session Awareness: Kill zone filters keep taps focused on London/NY if desired.
Auto Cleanup: Boxes delete when price closes beyond their invalidation level.
5. VWAP Magnet + Liquidity Raid Engine
Session or Rolling VWAP: Toggle resets to match intraday or rolling preferences.
Equal High/Low Scanner: Looks back 20 bars by default for liquidity pools.
Displacement Filter: ATR multiplier ensures raids represent genuine liquidity sweeps.
Mean Reversion Focus: Signals fire when price displaces back toward VWAP following a raid.
6. Session Range Breakout System
Initial Balance Tracking: First N bars (15 default) define the session box.
Breakout Logic: Requires simultaneous liquidity spikes, nearby FVG activity, and supportive momentum.
Z-Score Volume Filter: >1.5σ by default to filter noisy moves.
7. Lifestyle Liquidity Scanner
Volume Z-Scores: 50-bar baseline highlights statistically significant spikes.
Smart Money Footprints: Bottom-of-chart squares color-code buy vs sell participation.
Panel Memory: HUD logs the last five raid timestamps, direction, and normalized size.
8. Risk Matrix & Diagnostic HUD
HUD Structure: Table in the top-right summarizes HTF bias, sentiment, momentum, range state, liquidity memory, and current risk references.
Signal Tags: Aggregates SPS, FVG, VWAP, Range, and Liquidity states into a compact string.
Risk Metrics: Swing-based stops (5-bar lookback) + ATR targets (1.5× default) keep risk transparent.
Signal Families & Alerts
Social Pulse (SPS): Volume-confirmed sentiment alignment; triangle markers with “SPS”.
Kill-Zone FVG: Session + HTF alignment + FVG tap; arrow markers plus SL/TP labels.
Local FVG: Captures local reversals when HTF bias has not flipped yet.
VWAP Raid: Equal-high/low raids that snap toward VWAP; “VWAP” label markers.
Range Breakout: Initial balance violations with liquidity and imbalance confirmation; circle markers.
Liquidity Spike: Z-score spikes ≥ threshold; square markers along the baseline.
Visual Design & Customization
Theme Palette: Primary background RGB (12,6,24). Accent shading RGB (26,10,48). Long accents RGB (88,174,255). Short accents RGB (219,109,255).
Stylized Candles: Optional overlay using theme colors.
Signal Toggles: Independently enable markers, heatmap, and diagnostics.
Label Spacing: Auto-spacing enforces ≥4-bar gaps to prevent text overlap.
Customization & Workflow Notes
Adjust ATR/FVG thresholds when volatility shifts.
Re-anchor sentiment to your webhook cadence; EMA smoothing (default 5) dampens noise.
Reposition the HUD by editing the `table.new` coordinates.
Use multiples of the chart timeframe for HTF requests to minimize load.
Session inputs accept exchange-local time; align them to your market.
Performance & Compliance
Pure Pine v6: Single-line statements, no `lookahead_on`.
Resource Safe: Arrays trimmed, boxes limited, `request.security` cached.
Repaint Awareness: Signals confirm on close; alerts mirror on-chart logic.
Runtime Safety: Arrays/loops guard against `na`.
Use Cases
Measure when social sentiment aligns with structure.
Plan ICT-style intraday rebalances around session-specific FVG taps.
Fade VWAP raids when displacement shows exhaustion.
Watch initial balance breaks backed by statistical volume.
Keep risk/target references anchored in ATR logic.
Signal Logic Snapshot
Social Pulse Long/Short: `sentimentEMA` gated by `sentimentMin`, `volSpike`, EMA 8/21 cross, and `momoComposite` sign agreement. Keeps hype tied to structural follow-through.
Kill-Zone FVG Long/Short: Requires session filter, HTF EMA bias alignment, and an active FVG tap (`bullFvgTap` / `bearFvgTap`). Labels include swing stops + ATR targets pulled from `swingLookback` and `liqTargetMultiple`.
Local FVG Long/Short: Uses `localBullish` / `localBearish` heuristics (EMA slope, displacement, sequential closes) to surface intraday reversals even when HTF bias has not flipped.
VWAP Raids: Detect equal-high/equal-low sweeps (`raidHigh`, `raidLow`) that revert toward `sessionVwap` or rolling VWAP when displacement exceeds `vwapAlertDisplace`.
Range Breakouts: Combine `rangeComplete`, breakout confirmation, liquidity spikes, and nearby FVG activity for statistically backed initial balance breaks.
Liquidity Spikes: Volume Z-score > `zScoreThreshold` logs direction, size, and timestamp for the HUD and optional review workflows.
Session Logic & VWAP Handling
Kill zone + NY session inputs use TradingView’s session strings; `f_inSession()` drives both visual shading and whether FVG taps are tradeable when `killZoneOnly` is true.
Session VWAP resets using cumulative price × volume sums that restart when the daily timestamp changes; rolling VWAP falls back to `ta.vwap(hlc3)` for instruments where daily resets are less relevant.
Initial balance box (`rangeBars` input) locks once complete, extends forward, and stays on chart to contextualize later liquidity raids or breakouts.
Parameter Reference
Trend: `emaFastLen`, `emaSlowLen`, `htfResolution`, `htfEmaLen`, `showEmaRibbon`, `showHtfBiasLine`.
Momentum: `tf1`, `tf2`, `tf3`, `rsiLen`, `stochLen`, `stochSmooth`, `heatmapHeight`.
Volume/Liquidity: `volLookback`, `volSpikeMult`, `zScoreLen`, `zScoreThreshold`, `equalLookback`.
VWAP & Sessions: `vwapMode`, `showVwapLine`, `vwapAlertDisplace`, `killSession`, `nySession`, `showSessionShade`, `rangeBars`.
FVG/Risk: `fvgMinTicks`, `fvgLookback`, `fvgMinSpacing`, `killZoneOnly`, `liqTargetMultiple`, `swingLookback`.
Visualization Toggles: `showSignalMarkers`, `showHeatmapBand`, `showInfoPanel`, `showStylizedCandles`.
Workflow Recipes
Kill-Zone Continuation: During the defined kill session, look for `killFvgLong` or `killFvgShort` arrows that line up with `sentimentValid` and positive `momoComposite`. Use the HUD’s risk readout to confirm SL/TP distances before entering.
VWAP Raid Fade: Outside kill zone, track `raidToVwapLong/Short`. Confirm the candle body exceeds the displacement multiplier, and price crosses back toward VWAP before considering reversions.
Range Break Monitor: After the initial balance locks, mark `rangeBreakLong/Short` circles only when the momentum band is >0 or <0 respectively and a fresh FVG box sits near price.
Liquidity Spike Review: When the HUD shows “Liquidity” timestamps, hover the plotted squares at chart bottom to see whether spikes were buy/sell oriented and if local FVGs formed immediately after.
Metadata
Author: officialjackofalltrades
Platform: TradingView (Pine Script v6)
Category: Sentiment + Liquidity Intelligence
Hope you Enjoy!

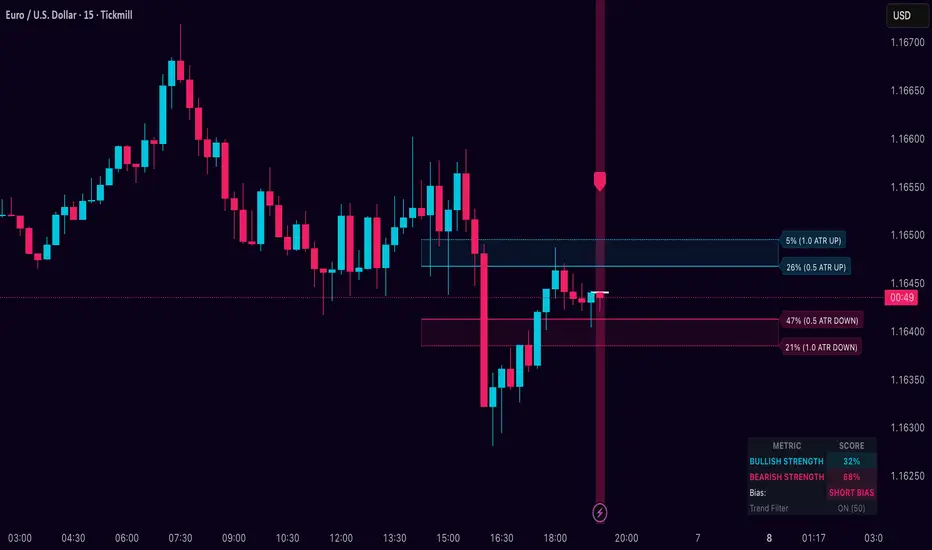
Dynamic Breakout Odds [RayAlgo]█ OVERVIEW
Dynamic Breakout Odds is a probability-based breakout tool that uses ATR and pattern matching to estimate how likely price is to expand up or down from the current candle.
Instead of guessing, the indicator scans historical candles that look like the current one and measures how often price broke above or below by a volatility-based amount.
It then projects those probabilities forward as clean levels and a bias dashboard on your chart.
Use it to quickly answer:
• “Is the next move statistically more likely up or down?”
• “How far does price typically travel from here, in ATR terms?”
█ CONCEPTS
Candle Profile Matching
The script builds a “profile” of the current setup using two elements:
• The color of the previous candle (bullish close vs bearish close)
• The trend environment (above/below EMA, if the filter is enabled)
Only historical candles with the same profile are used for statistics. This keeps the probabilities specific to the current context instead of mixing all market conditions together.
ATR-Based Expansion
For every matching historical candle, the script checks how far price moved away from the open using ATR:
• Upward move thresholds
• Moderate expansion (≈ 0.5 ATR above the open)
• Stronger expansion (≈ 1.0 ATR above the open)
• Downward move thresholds
• Moderate expansion (≈ 0.5 ATR below the open)
• Stronger expansion (≈ 1.0 ATR below the open)
It counts how often each expansion happened, then converts those counts into probabilities.
Normalized Probability Scores
The indicator doesn’t just show raw percentages; it normalizes them so that all scenarios together form a consistent probability set.
Internally it tracks four outcomes for similar candles:
• Chance of a moderate move upward
• Chance of a strong move upward
• Chance of a moderate move downward
• Chance of a strong move downward
These are then normalized so the total is roughly 100%. From this, two main metrics are derived:
• Bullish Strength = combined normalized odds of upside moves
• Bearish Strength = combined normalized odds of downside moves
Whichever side has the higher score defines the current directional bias .
█ WHAT YOU SEE ON THE CHART
1. Breakout Projection Levels
Four horizontal levels are projected around the open of the current bar:
• Two upside levels
• Nearer upside expansion (~0.5 ATR above the open)
• Further upside expansion (~1.0 ATR above the open)
• Two downside levels
• Nearer downside expansion (~0.5 ATR below the open)
• Further downside expansion (~1.0 ATR below the open)
Each line extends a configurable number of bars into the future, so you visually see a breakout “corridor” above and below price.
2. Probability Labels
At the right edge of each line, you’ll see a label such as:
• “X% – near upside”
• “Y% – further downside”
These labels tell you how frequently similar candles in the chosen lookback reached that expansion. You immediately know which scenario has been more common historically.
3. Breakout Zones
Between the paired upside lines and the paired downside lines, shaded “probability zones” can be shown:
• The upper shaded band highlights the typical upside expansion range
• The lower shaded band highlights the typical downside expansion range
These zones visually group probable target areas instead of just single lines.
4. Background Tint
The background behind price is softly tinted towards:
• Bullish color when Bullish Strength > Bearish Strength
• Bearish color when Bearish Strength > Bullish Strength
The stronger the statistical imbalance between the two, the more pronounced the tint. This gives you an instant feel for whether conditions lean more Long, more Short, or are nearly Neutral.
5. Directional Bias Arrow
On the last bar the script can plot a clean arrow:
• Up-arrow below price when bullish odds dominate
• Down-arrow above price when bearish odds dominate
The arrow is positioned beyond all projection lines, making it easy to see even on cluttered charts and reminding you of the current statistical bias without text.
6. Origin Marker
A small horizontal mark is drawn at the open of the current candle.
This acts as the “starting point” from which all ATR-based expansions above and below are measured.
7. Dashboard Panel
A compact dashboard is drawn in a corner of the chart (location configurable). It displays:
• Bullish Strength – combined normalized probability for upside expansions
• Bearish Strength – combined normalized probability for downside expansions
• Bias – “Long Bias”, “Short Bias”, or “Neutral”
• Trend Filter – shows whether EMA-based filtering is ON or OFF and which length is used
This gives you a quick, text-based summary of the current statistical environment.
█ SETTINGS
Analysis Lookback Period
• Controls how many historical bars the script inspects when searching for similar candles.
• Larger values = more history, smoother statistics, slower adaptation.
• Smaller values = faster adaptation, but more noise and less stability.
ATR Length
• The period used to compute ATR volatility.
• Defines how “big” 0.5 ATR and 1.0 ATR moves are on your current symbol and timeframe.
Trend Filter (EMA)
• Filter by Trend?
• When ON, only historical candles in a similar trend regime are used.
• When OFF, all past candles with similar color are considered, regardless of trend.
• Trend EMA Length
• EMA period used to classify trend.
• Price above EMA → uptrend environment.
• Price below EMA → downtrend environment.
This filter helps you separate behavior in uptrends from downtrends, which can significantly change breakout dynamics.
Visual Settings
• Projection Width (bars)
• How far the lines and zones extend into the future.
• Show Probability Zones
• Toggle shaded bands between each pair of levels.
• Label Size
• Choose smaller or larger text for the probability labels on the right.
• Tint Background by Bias
• Turn the bias-based background on or off.
• Show Bias Marker on Last Candle
• Toggle the up/down arrow marker.
• Dashboard Location
• Select top/bottom left/right corner for the panel.
█ HOW TO USE IT
1. Start With the Dashboard
Look at Bullish Strength vs Bearish Strength:
• If bullish is clearly larger → environment statistically favors upside expansion.
• If bearish is clearly larger → environment statistically favors downside expansion.
• If they are close → treat the situation as Neutral; consider reducing position size or waiting for more clarity.
2. Use Levels as Dynamic Targets
The projected lines and zones can serve as:
• Profit targets based on typical expansion distance
• Logical regions for scaling out
• Areas where you expect price behavior to change (e.g., loss of momentum)
Short-term traders often focus on the nearer expansion levels, while swing traders may use the farther levels as extended targets.
3. Align With Trend (Optional)
With the trend filter ON:
• Prefer Long setups when price is above the EMA and bullish probabilities dominate.
• Prefer Short setups when price is below the EMA and bearish probabilities dominate.
With the filter OFF, you get pure color-plus-pattern statistics across the whole lookback, which can be useful if you deliberately trade counter-trend or range conditions.
4. Combine With Your Existing System
Dynamic Breakout Odds is best used as a confirmation and targeting layer :
• Combine it with structure (support/resistance, supply/demand, order blocks).
• Combine it with volume or orderflow tools if you use them.
• Use the probability zones to validate whether your planned target is realistic relative to recent volatility.
It is not designed to be a standalone “buy/sell” signal generator, but a statistical map around your entries.
█ PRACTICAL EXAMPLES
Example A – Bullish, Moderate Expansion Frequently Hit
• Bullish Strength significantly higher than Bearish Strength.
• The nearer upside level shows a strong historical hit rate.
Interpretation: similar setups often produce at least a moderate push upward before failing.
Use case: trade pullbacks in the direction of the bias, targeting the nearer upside projection as an initial take-profit.
Example B – Bearish, Deeper Downside Often Reached
• Bearish Strength clearly dominant.
• Both the nearer and farther downside levels show decent probabilities.
Interpretation: similar conditions historically saw follow-through to the downside.
Use case: use rallies against the direction of the bias to position into shorts, planning partial exits around the first downside projection and runners toward the second.
Example C – Neutral, Balanced Probabilities
• Bullish and Bearish Strength scores are close.
• Background tint is very light or absent.
Interpretation: the market is statistically indecisive; expansions up or down are similarly likely.
Use case: consider range trading tactics, mean-reversion ideas, or simply standing aside until a clearer skew develops.
█ BEST PRACTICES
• Use on liquid symbols and reasonable timeframes to avoid distorted ATR behavior.
• Don’t overfit lookback length to a single instrument; test across markets.
• Let the indicator provide context, not absolute certainty.
• Always combine with proper risk management (position sizing, max loss per trade, etc.).
• Be cautious with very small sample sizes (e.g., very short lookbacks on low-volume assets).
█ LIMITATIONS & NOTES
• All probabilities are based on historical behavior ; markets can change regime.
• ATR distances are relative to recent volatility and may shrink/expand over time.
• The script intentionally does not guarantee any direction or target; it only reports what has been most common in similar past situations.
█ DISCLAIMER
This tool is for educational and informational purposes only.
It does not constitute financial advice or a guarantee of performance.
Always do your own research, test on demo or historical data, and use appropriate risk management when trading live capital.
Jim Kombein Ph.D, — ETH Micro-mHFT Spread Engine V2.0Overview
This indicator provides a visual dashboard designed to help traders monitor short-term ETH market conditions.
It highlights changes in momentum, temporary imbalance areas, and transitions between quiet and active phases.
The tool does not generate trading signals and contains no automated strategy logic.
개요
이 인디케이터는 ETH의 단기 시장 흐름을 시각적으로 관찰할 수 있도록 구성된 대시보드 도구입니다.
단기 모멘텀 변화, 일시적 불균형 구간, 변동성 전환을 손쉽게 확인할 수 있도록 설계되었습니다.
매매 신호나 자동 매매 기능은 포함되어 있지 않습니다.
Usage
Use this tool as a visual reference in combination with your own judgment.
It helps identify compression zones, movement transitions, and short-term structural shifts in market conditions.
사용법
이 도구는 사용자의 판단을 보조하는 시각적 참고용 지표입니다.
가격 압축 구간, 흐름 전환, 단기 구조 변화를 관찰하는 데 활용할 수 있습니다.
Access
This script is Invite-Only.
To request access, please send me your TradingView ID via direct message.
액세스 안내
본 지표는 초대 전용(Invite-Only) 으로 제공됩니다.
사용을 원하시면 TradingView 메시지를 통해 사용자 ID를 보내주세요.

Jim Kombein Ph.D — ETH Micro-mHFT Spread EngineOverview
This indicator provides a visual micro-HFT dashboard designed to track the asymmetric short-term behavior between ETH and BTC using a statistical spread-based framework.
It highlights micro-structure drift, volatility regime shifts, and compressed/reversal zones that typically precede short-duration directional moves.
The goal is not to generate automatic buy/sell decisions, but to provide a structured real-time visualization of the underlying ETH/BTC spread environment used in high-frequency scalping contexts.
Concept
ETH/BTC relative movement often displays:
Short-horizon volatility asymmetry
Mean-reversion vs. micro-trend switching
Spread drift transitions
Regime-dependent noise amplification
Momentary structural compression before directional bursts
This engine visualizes multiple layers of this behavior simultaneously:
Short-term Z-spread
Slow Z-momentum layer
Mean-drift normalization
Volatility regime transformation
Entry & extreme statistical bands
The multi-layered structure helps traders interpret spread conditions at a glance without exposing algorithmic internals.
What the Indicator Shows
This indicator does not execute trades, nor does it expose private strategy logic.
It simply plots the following analytical layers:
Short & slow Z-spread curves
Mean-drift transitions
Volatility normalization
Statistical entry bands
Extreme deviation zones
Session-based state markers (L / l / S / s)
Visual background shading for regime interpretation
The visualization is designed to be compact and micro-HFT-friendly even on short timeframes.
Usage
Use cases include:
Identifying spread compression before expansion
Monitoring micro-drift reversal attempts
Visually confirming volatility regime suitability
Detecting early ETH/BTC imbalance pockets
Supplementing manual ETH scalping decisions
No trade logic, signals, or position recommendations are provided.
Access
This indicator is Invite-Only.
Users who wish to access it may send me their TradingView ID via message, and I will grant access after verification.

A.I. 👑 Market Cipher EZ🚀 A.I. Market Cipher EZ – “Rubik’s Algo” 2025 Edition
by StupidBitcoin | Built with love & Grok’s help
Imagine a Rubik’s Cube that solves itself while the market moves — every twist and turn instantly reflected in color.
That’s exactly what this indicator does.
Two animated Rubik’s Cubes (Figure 1 & Figure 2) symbolize the dual-layer intelligence inside:
- The outer cube = Supply / Demand / Bull vs Bear forces
- The inner cube = Price / Volume / Trend (xTrend) constantly rotating to find equilibrium
The result? A living, breathing, self-adapting color language that removes noise, bias, and lag — turning complex market physics into simple visual signals even a beginner can trade confidently.
Core Engine (all running live):
• Multi-stage Kalman Filters (standard / volume-adjusted / Parkinson volatility modes)
• k-Nearest-Neighbour (k-NN) machine-learning clustering
• Dynamic VSQC scaling (the “fast Rubik”) + ultra-smooth slow Rubik
• Zero-lag Gaussian + Chebyshev filtering
• AI-driven Stochastic Money Flow % oscillator (3 % – 120 % range)
• Volume imbalance “Vector Recovery Zones” & momentum “Bounce Boxes”
• Real-time color gradients (Classic red/green or Crypto teal/purple themes)
What you actually see on the chart:
- Fast & Slow dynamic trend lines (the “speed lanes”) painted in intelligent gradients
- Stochastic Money Flow % label on every bar (green < 31 % = oversold rocket fuel | red > 69 % red = overbought rejection)
- Bollinger Width % label (optional)
- Vector Recovery Boxes (volume magnets)
- Bull/Bear Bounce Boxes (support & resistance with wick pressure)
- Market-structure squares below bars (green = bullish structure, red = bearish, yellow = neutral)
- Kalman Target marker on current bar (reduces fakeouts)
Top confirmed setups (3:1+ RR):
Longs → Green % label (< 31 %) + price on fast green line + green recovery/bounce box
Shorts → Red % label (> 69 %) + price on slow red line + red recovery/bounce box
Breakouts → Green % + fast line breakout + green structure squares
Breakdowns → Red % + slow line breakdown + red structure squares
All inputs are carefully preset with the developer’s recommended values (lookback 9 / max length 188 / accelerator 4.4 / k = 63) — just load and trade. Tweak only if you really know what you’re doing.
Disclaimer
For educational purposes only. Not financial advice. Use at your own risk. Past performance ≠ future results.
License
Released under CC BY-NC-SA 4.0 + Mozilla Public License 2.0 – free to use, study, modify and share non-commercially with attribution.
Enjoy the colors. May your trends be strong and your drawdowns short.
© 2025 Rubik’s Algo – All Rights Reserved

BTC-ETH Visual DashboardOverview
A visual dashboard designed to monitor the statistical relationship between BTC and ETH.
The indicator displays filtered and normalized curves that approximate the underlying mean-reversion structure between the two assets.
Concept
BTC–ETH relative movements often exhibit asymmetric volatility and temporary divergence.
This dashboard helps visualize:
Spread compression/expansion
Regime transitions
Short-term structural dislocations
Usage
The curves represent different smoothed layers of the BTC/ETH relationship.
Persistent moves away from the central band may indicate spread imbalance or short-term inefficiency.
Purpose
This tool is designed for traders applying statistical arbitrage, relative-value trading, or volatility regime analysis.

CRT Candle Detector📌 Indicator Description – Candle Range Theory (CRT) Assistant
This indicator is designed to help traders easily identify CRT candles and evaluate the market conditions that follow them. By automatically detecting bullish and bearish CRT structures, it allows you to visually confirm whether the market has delivered:
Valid Fair Value Gaps (FVGs)
Liquidity sweeps (LQ / liquidity taken)
Price returning into key ranges after CRT formation
With this tool, you can monitor the internal structure right after a CRT candle forms and spot high-probability continuation or reversal setups more efficiently.
It is especially useful for traders applying Candle Range Theory, FVG-based entries, and liquidity-driven price action models.
The indicator highlights CRT signals directly on the chart and helps you validate whether a proper displacement, imbalance, or liquidity sweep has occurred—allowing for more confident trade planning.

LiqVision Institutional Suite v6.2 – Hybrid ModeLiqVision Institutional Suite v6.2 — Hybrid Mode (Lightning Edition)
Een ultra-geoptimaliseerde Smart Money-indicator gebaseerd op institutionele principes: Liquidity, Market Structure, Order Blocks, FVG’s en Model 1/2 setups.
Dit script combineert meerdere professionele SMC-concepten in één engine:
🔷 Functionaliteiten
1. Liquidity Engine
Automatische detectie van EQH, EQL en Liquidity Sweeps
Dynamische lijnprojectie met smart cleanup
Slimme sweep-detectie voor high-probability entries
2. Market Structure Engine
BOS & CHOCH detectie
Trend continuatie- en reversalsignalen
Swing-based pivot logic
3. Order Block Engine
Automatische OB-detectie met displacement filtering
Bullish & Bearish macro Order Blocks
HTF glow overlay (nieuw in v6.2)
4. FVG Engine
Major Fair Value Gap detection
Up/Down imbalance visual engine
HTF-based color restoration (v6.2 fix)
5. Model 1 & Model 2 Signal Engine
Trend continuation entries (Model 1)
Reversal setups gebaseerd op HTF liquidity & displacement (Model 2)
Auto-tapping logic geïntegreerd met OB/FVG
6. Hybrid Mode Rendering
Slimme shading afhankelijk van timeframe:
LTF → Hide OB/FVG
MTF → White overlays
HTF → Premium glow visuals
🔷 Alerts
Volledige alert-ondersteuning voor:
Model 1 Buy/Sell
Model 2 Buy/Sell
Liquidity Sweep
BOS Up/Down
CHOCH Up/Down
OB Tap
FVG Tap
Any alert() function call
Geschikt voor Telegram, Discord, bots en externe signal pipelines.
🔷 Gebruik
Voeg de indicator toe
Kies timeframe (1m–4h aanbevolen)
Activeer alerts via “Any alert() function call”
Volg Model 1/2 entries voor optimaal resultaat
⚡ DISCLAIMER
Dit script is uitsluitend bedoeld voor educatieve doeleinden. Geen financieel advies. Resultaten uit het verleden geven geen garantie voor de toekomst.

SMC God Mode — PREMIUM v13.0SMC God Mode — Premium v13.0
I developed this script to automate the mechanical parts of Smart Money Concepts (SMC) analysis. Instead of manually drawing structure and zones every morning, this tool calculates them algorithmically based on price action and volatility logic.
How the Algorithm Works:
1. Structure & Trends
The script identifies Swings Highs/Lows based on a pivot system filtered by ATR. It creates a "Clean Structure" view, filtering out minor noise to show true BOS (Break of Structure) and CHoCH (Change of Character).
*Logic:* A breakout is only valid if the candle body closes beyond the pivot with sufficient momentum (Impulse Filter).
2. Quant-Based Order Blocks
Most indicators just highlight the last candle before a move. My algorithm actually **scores** each block (0-100) to find high-probability zones (A+ setups).
Volume & Velocity: It compares the volume of the move against the 20-period average and calculates the "displacement" speed.
Grading: Zones with low volume or weak reactions are filtered out or graded lower (C). Only significant institutional footprints get an "A" grade.
3. Imbalance (FVG) & Liquidity
FVG: Detects gaps where price moved inefficiently. Includes a gradient visual to show the intensity of the gap.
Liquidity Sweeps: The script detects "Stop Hunts" — where price breaks a pivot level but fails to close above/below it, signalling a reversal trap.
Features:
Auto-Fibonacci:
Automatically anchors to the recent structural leg (Premium/Discount zones).
Multi-Timeframe Dashboard:** Shows trend bias from higher timeframes.
Breaker Blocks: Automatically flips failed Order Blocks into Support/Resistance.
Alerts: Fully integrated alerts for CHoCH, Sweeps, and Zone Mitigations.
ACCESS INFORMATION:
This is a private institutional tool (Invite-Only).
To get access, please check the link in my Signature below or visit my profile description.

TTP IFVG Signals With EMA /ICT Gold scalpingThis script uses original logic and alerting rules. in Japan
finding ICT IFVG and EMA conditions.
#IFVG, Forex, ICT, EMA, Scalping, Indicator
This indicator automatically finds IFVG (Imbalance / Fair Value Gap) zones and gives you a buy or sell signal when price comes back and breaks out through that gap.
It also draws a colored box over the gap so you can see the zone visually, and it raises alerts when a new signal appears.
High-level logic:
On every bar, the script looks back up to “IFVG_GapBars” bars.
For each offset i it checks a 3-candle pattern:
– If the low of the newer candle is above the high of the older candle: bullish FVG (price jumped up, leaving a gap).
– If the high of the newer candle is below the low of the older candle: bearish FVG (price jumped down, leaving a gap).
When a valid FVG is found:
– For a bullish FVG it looks for a later close that breaks down through that gap (sell signal).
– For a bearish FVG it looks for a later close that breaks up through that gap (buy signal).
– A moving-average trend filter must agree (downtrend for sells, uptrend for buys).
– It checks that price has not already “filled” the gap before the breakout.
If all conditions are satisfied, it:
– Sets signal_dir = 1 for a buy, or -1 for a sell.
– Draws a box from the original FVG bar to the bar just before the breakout (extended a bit to the right), between the gap high and gap low.
– Plots an ▲ label for buys or ▼ label for sells.
– Triggers the corresponding alert conditions.
Now the parameters:
PipSizeMultilier (PipSizeManual)
Multiplies the symbol’s minimum tick size (syminfo.mintick).
It is used when converting “MinFVG_Pips” into an actual price distance.
If you feel the indicator is too sensitive (too many small gaps), you can increase this multiplier to effectively require a larger price difference.
TickSize
Internal value = syminfo.mintick * PipSizeMultiplier.
This is the actual price step the script uses as a “pip” when checking minimum gap size.
FVG Search Lookback (IFVG_GapBars)
How many bars back from the current bar the script will scan for a 3-candle FVG pattern.
Larger value = it can find older FVGs, but loop cost is higher.
Min FVG Size (Pips/Points) (MinFVG_Pips)
Minimum allowed size of the gap, measured in “pips/points” using TickSize.
If the vertical distance between the gap high and gap low is smaller than this, the gap is ignored.
0.0 means “no size filter” (every FVG is allowed).
FVG Epsilon (Price Units) (FVG_EpsPoints)
Tolerance for the FVG detection.
It is subtracted/added in the condition that checks “low > old high” or “high < old low”.
0.0 means strict gap (no overlap at all). A small positive epsilon allows tiny overlaps to still count as a gap.
Show IFVG Zones (ShowZones)
If true, the script draws a box over the IFVG zone when a signal is confirmed.
If false, no boxes are drawn; you only see the ▲ / ▼ markers and alerts.
Buy Zone Color (ZoneColorBuy)
Fill color and border color for boxes created from bearish FVGs that later produce a buy signal.
Sell Zone Color (ZoneColorSell)
Fill color and border color for boxes created from bullish FVGs that later produce a sell signal.
Box Extension (Bars) (BoxExtension)
How many extra bars to extend the right side of the box beyond the breakout bar.
The internal right coordinate is “bar_index - 1 + BoxExtension”.
Increase this if you want the zone to visually extend further into the future.
MA Period (MA_Period)
Lookback length of the moving average used as a trend filter.
MA Type (MA_Kind)
Type of moving average: “SMA” or “EMA”.
If SMA is chosen, the script uses ta.sma; if EMA, it uses ta.ema.
Moving-average filter behavior:
For sell signals (from bullish FVG): MA must be sloping down (MA < MA ) and price must be below MA.
For buy signals (from bearish FVG): MA must be sloping up (MA > MA ) and price must be above MA.
If these conditions are not satisfied, the FVG is ignored even if the gap and breakout conditions are met.
Signals and alerts:
signal_dir = 1 → buy signal, ▲ label below the bar, “IFVG Buy Alert” / “IFVG Buy/Sell Alert” can fire.
signal_dir = -1 → sell signal, ▼ label above the bar, “IFVG Sell Alert” / “IFVG Buy/Sell Alert” can fire.
signal_dir = 0 → no new signal on this bar.
In short:
This indicator finds 3-candle IFVG gaps, filters them by size and trend, waits for a clean breakout through the gap, draws a box on the original gap zone, and gives you a clear buy or sell signal plus alerts.

STM APEX Pro📊 STM APEX Pro - SMC + ICT + SOM Combined Indicator
The ULTIMATE Smart Money trading tool that combines three powerful concepts into ONE indicator:
━━━━━━━━━━━━━━━━━━━━━━━━━━━━━━
🔷 SMC (Smart Money Concepts)
- Order Blocks (Supply & Demand)
- Fair Value Gaps (FVG/Imbalance)
- Break of Structure (BOS)
- Change of Character (CHoCH)
- Liquidity Sweeps (BSL/SSL)
🔷 ICT (Inner Circle Trader)
- Kill Zones (London, New York, Asia)
- Premium & Discount Zones
- Optimal Trade Entry (OTE)
- Equilibrium Line
🔷 SOM (Swing of MACD)
- MACD Swing Detection
- Multi-Timeframe Confirmation
- Momentum Analysis
━━━━━━━━━━━━━━━━━━━━━━━━━━━━━━
✅ KEY FEATURES:
📌 Smart Signal System
- 4 Signal Modes: Confluence, Custom, Aggressive, Conservative
- Confluence scoring (1-6) for signal quality
- Customizable entry requirements
📌 Advanced SL/TP
- Structure-based (Swing High/Low)
- ATR-based
- Fixed Risk:Reward
- Hybrid method
📌 Real-time Dashboard
- Trend direction
- Premium/Discount zone
- Kill Zone status
- Confluence score
- Multi-TF confirmation
📌 Full Customization
- Every feature can be toggled ON/OFF
- Adjustable colors and styles
- Mobile-friendly mode
━━━━━━━━━━━━━━━━━━━━━━━━━━━━━━
⚙️ SETTINGS GUIDE:
Signal Mode:
- Confluence: Signal when X conditions are met
- Custom: Define your own requirements
- Aggressive: Quick signals (BOS + SOM)
- Conservative: High-quality signals only (4+ confluence)
Recommended Timeframes: M15, H1, H4
Best Pairs: XAUUSD, EURUSD, GBPUSD, US30
━━━━━━━━━━━━━━━━━━━━━━━━━━━━━━
📱 Works on both Desktop and Mobile
🔔 Alert Conditions included for:
- Buy/Sell Signals
- BOS/CHoCH
- Liquidity Sweeps
━━━━━━━━━━━━━━━━━━━━━━━━━━━━━━
⚠️ DISCLAIMER:
This indicator is for educational purposes. Past performance does not guarantee future results. Always use proper risk management.
━━━━━━━━━━━━━━━━━━━━━━━━━━━━━━
💬 Support:
Tags: SMC, ICT, Smart Money, Order Block, FVG, BOS, CHoCH, Liquidity, Kill Zone, MACD

Quantum Trend FVG System [ReyTradez]1️⃣ INTRODUCTION
The Quantum Trend FVG System provides a complete, structured framework for algorithmic trend detection and Fair Value Gap detection, combining smoothed trend evaluation, multi-layered price-action logic, and ATR-based filtering to deliver clear, data-driven market structure insights for trend-following, swing, and intraday trading.
🔹It combines two powerful techniques:
Trend Detector System: Uses smoothed Moving Averages to identify long-term and short-term market trends, helping traders align their trades with the dominant market direction.
FVG Detector System: Identifies Fair Value Gaps and confirms only meaningful gaps by combining ATR-based filtering with the three same-candle technique, which requires three consecutive same-direction candles to validate each FVG, increasing the probability of high-quality trading opportunities.
The Quantum Trend FVG System is engineered with a clear purpose: to deliver accurate, real-time identification of significant Fair Value Gaps and trend conditions that support advanced price-action and SMC-based analysis. While an FVG or trend signal should not be used in complete isolation, these structural events are essential for understanding market imbalance, liquidity displacement, and potential points of reaction. The system is designed to provide consistent, high-quality detection, giving traders a refined and reliable framework for interpreting market structure and anticipating future movement.
2️⃣ TREND DETECTOR SYSTEM
The Trend Detector uses a dual-SMA engine to determine market direction. A user-friendly slider controls sensitivity to make trends more reactive or smoother.
🔹Features:
Colors candles based on bullish or bearish trend
Fills the background with a smooth gradient between SMAs
Confirms trend direction for breakout and continuation trades
3️⃣ FAIR VALUE GAPS (FVG) DETECTOR SYSTEM
Detects high-quality FVGs validated by three consecutive same-direction candles. Only meaningful gaps are displayed, reducing noise.
🔹Bullish FVG Conditions:
3 consecutive bullish candles
Current low > high of 2 candles ago
Passes ATR-based minimum size filter
🔹Bearish FVG Conditions:
3 consecutive bearish candles
Current high < low of 2 candles ago
Passes ATR-based minimum size filter
🔹ATR-Based Filtering (Integrated in FVGs):
Filters out small or insignificant gaps that may not be tradable
ATR period defines market volatility used for comparison
Minimum FVG size is set relative to ATR to ensure only meaningful gaps are considered
4️⃣ SETTINGS OVERVIEW
🔹Trend Detector Settings:
Enable Trend Detector — toggles the Trend Detector system on or off;
Trend Detector Sensitivity — adjusts the responsiveness of the trend detection (0 = lowest sensitivity, 10 = highest sensitivity).
🔹FVG Detector Settings:
Show FVGs — toggles the display of Fair Value Gaps on the chart;
Extend FVGs — controls how far FVG boxes extend into the future;
Number of historical FVGs — sets the maximum number of FVG boxes to display;
Bullish FVG color — selects the color for bullish FVGs;
Bearish FVG color — selects the color for bearish FVGs.
🔹ATR Filter Settings:
ATR Period — sets the number of bars used to calculate ATR;
Min FVG size factor — defines the minimum FVG size relative to ATR required for validity (e.g., 0.5 means the FVG must be at least 50% of the ATR).
5️⃣ TRADING EXAMPLES
🟢 Long Setup Example
A Bullish Trend + valid Bullish FVG confirmed by strong displacement.
🔴 Short Setup Example
A Bearish Trend + valid Bearish FVG confirmed by strong displacement.
6️⃣ CONCLUSION
The Quantum Trend FVG System is designed to automatically detect significant Fair Value Gaps while analyzing the prevailing market trend through its Trend Detector System. By combining smoothed trend analysis with ATR-filtered FVG Detector System, it highlights high-probability zones where price may react, making it easier for traders to identify structurally important areas without manually tracking them.
🔹Traders can now:
✅ Quickly identify market trends
✅ Spot high-probability Fair Value Gaps
✅ Filter minor gaps using ATR
✅ Visualize trend momentum with gradient fills
✅ Maintain a clean, readable chart with historical FVG limits
⚠️ This indicator is not intended to signal exact entry points or guarantee that an FVG will act as a perfect buying or selling zone; rather, it streamlines the identification process and supports the implementation of systematic, rules-based trading strategies, allowing traders to incorporate trend and FVG analysis into their workflow more efficiently.

FVG-BPR-Candle Volume-v2 [Elykia]FVG-BPR & Volume Z-Score - SMC Enhanced
This indicator is a complete toolkit for traders using Smart Money Concepts (SMC) and Price Action analysis. It combines three essential elements to identify high-probability zones: Price Inefficiencies (FVG), Balanced Price Ranges (BPR), and Statistical Volume Anomalies (Z-Score).
The goal is simple: Stop trading "blind" levels and start validating every institutional zone with real volume activity.
Key Features
1. 📊 Volume Z-Score (Statistical Analysis):
Colors candles based on volume intensity relative to its historical average (Bollinger/Standard Deviation logic).
Yellow Candles (Z-Score > 2): High volume, significant activity.
Red Candles (Z-Score > 3): Extreme volume, often a sign of "Capitulation" or major impulse.
Circles Option: Displays a circle on extreme candles for enhanced visibility.
2. ⚡ Fair Value Gaps (FVG):
Automatically detects imbalance zones (Buy-side & Sell-side).
Multi-Timeframe (MTF): Ability to display FVGs from a higher timeframe on your current chart (e.g., H1 FVG on M5 chart).
Dynamic Management: Zones automatically delete once filled (mitigated) to keep the chart clean.
3. 🔄 Balanced Price Ranges (BPR):
Identifies zones where a Bullish FVG and a Bearish FVG overlap.
This is a strong institutional signature indicating aggressive re-pricing. BPRs often act as more reliable support/resistance zones than simple FVGs.
💎 Strategy: "Volume-Backed Rebalancing"
This strategy uses the confluence between SMC structure (FVG/BPR) and Volume confirmation.
1. Zone Identification: Wait for price to form a clear BPR or FVG (M15 or H1 recommended).
2. The Retest (Pullback): Wait for price to return to test this zone. Do not enter blindly (Limit Order), wait for the reaction.
3. Volume Confirmation:
Observe the candle colors within the zone.
If price hits the FVG and a Yellow or Red candle (Volume Z-Score) appears rejecting the zone, this is your signal.
This indicates that institutions are actively defending this level.
4. Entry & Exit: Enter at the close of the volume candle. Place Stop Loss below the FVG/BPR. Target the next liquidity pool (Previous High/Low).
⚠️ DISCLAIMER
This script and the strategy described are provided for educational and research purposes only. Trading financial markets (Forex, Crypto, Indices, Futures) involves a high level of risk and may not be suitable for all investors. You may lose all or part of your initial capital.
Past performance is not indicative of future results. The author implies no guarantee of profit or protection from loss. Use this tool at your own risk and always perform your own analysis before taking a position.

SMC & ICTSMC & ICT Concepts
Key Features:
• Real-time Market Structure: MSS (Market Structure Shift), BOS, CHOCH with labels
• Order Blocks (Bullish & Bearish) – auto-mitigation & breaker detection
• Fair Value Gaps (FVG), Implied FVG, Balance Price Range (BPR)
• Liquidity Grabs (Buyside/Sellside pools from equal highs/lows)
• Volume Imbalance (VI) detection
• Displacement candles
• Killzones: New York, London Open/Close, Asian session background highlight
• NWOG (New Week Opening Gap) & NDOG (New Day Opening Gap)
• Automatic Fibonacci Retracement & Extension between latest FVG, OB, Liquidity, or VI
• Two display modes:
→ Present Mode: Shows only recent & relevant structures (clean chart – recommended for live trading)
→ Historical Mode: Shows full structure history
Perfect confluence tool for scalping, day trading, and swing trading.

Delta Magnet Zone Extended – Selective HideLiquidity Zone Reversal — Description 🔍📊
This indicator automatically identifies liquidity zones where price previously grabbed orders, swept highs/lows, or created strong reaction points. Instead of plotting thin lines, this version converts those levels into zones, giving traders a clearer view of where the market has unfinished business and where future reactions are likely to occur.
These zones act as institutional magnets — areas where liquidity providers, algos, and larger players commonly enter or exit positions.
How It Works ⚙️💡
The script scans recent price action and detects local swing highs and lows. It then builds rectangular liquidity zones around these levels, extending them forward so you can see:
🟥 Bearish liquidity sweep zones
🟩 Bullish liquidity sweep zones
🔁 Areas where price previously failed, rejected, or consolidated
🎯 Potential reversal targets on both sides of the market
These zones update automatically as new structure forms, giving you an always-current map of market memory.
Why the 9-Day Look-Back Is Powerful (My Default) 📅✨
I personally keep the look-back set to 9 days by default because:
✔️ It captures the entire previous trading week
✔️ It maps out where SPY/QQQ/ES has already tapped liquidity
✔️ It shows the true zones institutions defended
✔️ It reveals where price is most likely to react again moving forward
Using a 9-day window gives you a clean, high-signal map of:
Last week’s highs & lows
Prior liquidity sweeps
Rejection zones
Imbalance cleanup levels
This keeps the chart minimal, powerful, and hyper-relevant to current order flow.
How Traders Use These Zones 🎯📈
Here are the most common ways traders use these liquidity zones:
1️⃣ Identify High-Probability Reversal Areas 🔄
Price often reacts strongly when returning to a past liquidity zone — especially if it previously swept stops there.
2️⃣ Confirm Breakouts or Failures 🚪➡️
Break above a bearish zone?
Momentum continuation is likely.
Reject inside a zone?
Reversal or range expansion often follows.
3️⃣ Set Targets & Stop Placement 🎯🛡️
Zones give logical:
Profit targets
Trend exhaustion points
Areas to avoid entering new trades
4️⃣ Time 0DTE Scalps With Precision ⚡
Liquidity zones tighten your expectations for:
Where SPY/QQQ will bounce
Where reversals start
Where liquidity magnets pull price by end of day
Why This Indicator Matters 🧠🔥
Liquidity drives markets.
Not indicators.
Not moving averages.
Not random levels.
This tool shows you where actual orders exist, where they were previously swept, and where institutions are most likely to step in again.
It gives you:
Cleaner charts
Higher confidence
Better strike selection
More precise entries
Stronger exits
All without noise.

JINN: A Multi-Paradigm Quantitative Trading and Execution EngineI. Core Philosophy: A Substitute for Static Analysis
JINN (Joint Investment Neural and Network) represents a paradigm shift from static indicators to a living, adaptive analytical ecosystem. Traditional tools provide a fixed snapshot of the market. JINN operates on a fundamentally different premise: it treats the market as a dynamic, regime-driven system. It processes market data through a hierarchical suite of advanced, interacting models, arbitrates their outputs through a rules-based engine, and adapts its own logic in real-time.
It is designed as a complete framework for traders who think in terms of statistical edge, market regimes, probabilistic outcomes, and adaptive risk management.
II. The JINN Branded Architecture: Your Command and Control Centre
JINN’s power emerges from the synergy of its proprietary, branded architectural components. You do not simply "use" JINN; you command its engines.
1. JINN Signal Arbitration (JSA) Engine
The heart of JINN. The JSA is your configurable arbitration desk for weighing evidence from all internal models. As the Head Strategist, you define the entire arbitration philosophy:
• Priority and Weighting : Define a "chain of command". Specify which model's opinion must be considered first and assign custom weights to their outputs, directly controlling the hierarchy of your analytical flow.
• Arbitration Modes :
First Wins: For high-conviction, rapid signal deployment based on your most trusted leading model.
Highest Score: A "best evidence" approach that runs a full analysis and selects the signal with the highest weighted probabilistic backing.
Consensus: An ultra-conservative, "all-clear" mode that requires a unanimous pass from all active models, ensuring maximum confluence.
2. JINN Threshold Fusion (JTF) Engine
Static entry thresholds can be limiting in a dynamic market. The JTF engine replaces them with a robust, adaptive "breathing" channel.
• Kalman Filter Core : A noise-reducing, parametric filter that provides a smooth, responsive centre for the entry bands.
• Exponentially Weighted Quantile (EWQ) : A non-parametric, robust measure of the signal's recent distribution, resistant to outliers.
• Dynamic Fusion : The JTF engine intelligently fuses these two methodologies. In stable conditions, it can blend them; in volatile conditions, it can be configured to use the "Minimum Width" of the two, ensuring your entry criteria are always the most statistically relevant.
3. JINN Pattern Veto (JPV) with Dynamic Time Warping
The definitive filter for behavioural edge and pattern recognition. The JPV moves beyond value-based analysis to analyse the shape of market dynamics.
• Dynamic Time Warping (DTW) : A powerful algorithm from computer science that compares the similarity of time series.
• Pattern Veto : Define a "toxic" price action template—a pattern that has historically preceded failed signals. If the JPV detects this pattern, it will veto an otherwise valid trade, providing a sophisticated layer of qualitative, shape-based filtering.
4. JINN Flow VWAP
This is not a standard VWAP. The JINN Flow VWAP is an institutionally-aware variant that analyses volume dynamics to create a "liquidity pressure" band. It helps visualise and gate trades based on the probable activity of larger market participants, offering a nuanced view of where significant flow is occurring.
III. The Advanced Model Suite: Your Pre-Built Quantitative Toolkit
JINN provides you with a turnkey suite of institutional-grade models, saving you thousands of hours of research and development.
1. Auto-Tuning Hyperparameters Engine (Online Meta-Learning)
Markets evolve. A static strategy is an incomplete strategy. JINN’s Auto-Tuning engine is a meta-learning layer inspired by the Hedge (EWA) algorithm, designed to combat alpha decay.
• Portfolio of Experts : It treats a curated set of internal strategic presets as a portfolio of "experts".
• Adaptive Weighting : It runs an online learning algorithm that continuously measures the risk-adjusted performance of each expert (using a sophisticated reward function blending Expected Value and Brier Score).
• Dynamic Adaptation : The engine dynamically allocates more influence to the expert strategy that is performing best in the current market regime, allowing JINN’s core logic to adapt without manual intervention.
2. Lorentzian Classification and PCA-Lite EigenTrend
• Lorentzian Engine : A powerful probabilistic classifier that generates a continuous probability (0-1) of market state. Its adaptive, volatility-scaled distribution is specifically designed to handle the "fat tails" and non-Gaussian nature of financial returns.
• PCA-Lite EigenTrend : A Principal Component Analysis engine. It reduces the complex, multi-dimensional data from the Technical and Order-Flow ensembles into a single, maximally descriptive "EigenTrend". This factor represents the dominant, underlying character of the market, providing a pure, decorrelated input for the Lorentzian engine and other modules.
3. Adaptive Markov Chain Model
A forward-looking, state-based model that calculates the probability of the market transitioning between Uptrend, Downtrend, and Sideways states. Our implementation is academically robust, using an EMA-based adaptive transition matrix and Laplace Smoothing to ensure stability and prevent model failure in sparse data environments.
IV. The Execution Layer: JINN Execution Latch Options
A good signal is worthless without intelligent execution. The JINN Execution Latch is a suite of micro-rules and safety mechanisms that govern the "last mile" of a trade, ensuring signals are executed only under optimal, low-risk conditions. This is your final pre-flight check.
• Execution Latch and Dynamic Cool-Down : A core safety feature that enforces a dynamic cool-down period after each trade to prevent over-trading in choppy, whipsaw markets. The latch duration intelligently adapts, using shorter periods in low-volatility and longer periods in high-volatility environments.
• Volatility-Scaled Real-Time Threshold : A sophisticated gate for real-time entries. It dynamically raises the entry threshold during sudden spikes in volatility, effectively filtering out noise and preventing entries based on erratic, unsustainable price jerks.
• Noise Debounce : In market conditions identified as "noisy" by the Shannon Entropy module, this feature requires a real-time signal to persist for an extra tick before it is considered valid. This is a simple but powerful heuristic to filter out fleeting, insignificant price flickers.
• Liquidity Pressure Confirmation : An institutional-grade check. This gate requires a minimum threshold of "Liquidity Pressure" (a measure of volume-driven momentum) to be present before validating a real-time signal, ensuring you are entering with market participation on your side.
• Time-of-Day (ToD) Weighting : A practical filter that recognises not all hours of the trading day are equal. It can be configured to automatically raise entry thresholds during historically low-volume, low-liquidity sessions (e.g., lunch hours), reducing the risk of entering trades on "fake" moves.
• Adaptive Expectancy Gate : A self-regulating feedback mechanism. This gate monitors the strategy's recent, realised performance (its Expected Value). If the rolling expectancy drops below a user-defined threshold, the system automatically tightens its entry criteria, becoming more selective until performance recovers.
• Bar-Close Quantile Confirmation : A final layer of confirmation for bar-close signals. It requires the signal's final score to be in the top percentile (e.g., 85th percentile) of all signal scores over a lookback period, ensuring only the highest conviction signals are taken.
V. The Contextual and Ensemble Frameworks
1. Multi-Factor Ensembles and Bayesian Fusion
JINN is built on the principle of diversification. Its signals are derived from two comprehensive, fully customizable ensembles:
• Technical Ensemble : A weighted combination of over a dozen technical features, from cyclical analysis (MAMA, Hilbert Transforms) and momentum (Fisher Transform) to trend efficiency (KAMA, Fractal Efficiency Ratio).
• Order-Flow Ensemble : A deep dive into market microstructure, incorporating Volume Delta, Absorption, Imbalance, and Delta Divergence to decode institutional footprints.
• Bayesian Fusion : Move beyond simple AND/OR logic. JINN’s Bayesian engine allows you to probabilistically combine evidence from trend and order-flow filters, weighing each according to its perceived reliability to derive a final posterior probability.
2. Context-Aware Framework and Entropy Engine
JINN understands that a successful strategy requires not just a good entry, but an intelligent exit and a dynamic approach to risk.
• Shannon Entropy Filter : A direct application of information theory. JINN quantifies market randomness and allows you to set a precise entropy ceiling to automatically halt trading in unpredictable, high-entropy conditions.
• Adaptive Exits and Regime Awareness : The script uses its entropy-derived regime awareness to dynamically scale your Take Profit and Trailing Stop parameters . It can be configured to automatically take smaller profits in choppy markets and let winners run in strong trends, hard-coding adaptive risk management into your system.
VI. The Dashboard: Your Mission Control
JINN features a dynamic, dual-mode dashboard that provides a comprehensive, real-time overview of the entire system's state.
Mode 1: Signal Gate Metrics Dashboard
This dashboard is your pre-flight checklist. It displays the real-time Pass/Fail/Off status of every single gating and filtering component within JINN, including:
• Core Ensembles : Technical and Order-Flow Ensemble status.
• Trend Filters : VWAP, VWMA, ADX, ATR Slope, and Linear Regression Angle gates.
• Advanced Models : Dual-Lorentzian Consensus, Markov Probability, and JPV Veto status.
• Regime and Safety : Shannon Entropy, Execution Latch, and Expectancy Gate status.
• Final Confirmation : A master "All Hard Filters" status, giving you an at-a-glance confirmation of system readiness.
Mode 2: Quantitative Metrics Dashboard
This dashboard provides a high-level, institutional-style data readout of the current market state, as seen through JINN's analytical lens. It includes over 60 key metrics for both Signal Gate and Quantitative Metrics, such as:
• Ensemble and Confidence Scores : The raw numerical output of the Technical, Order-Flow, and Lorentzian models.
• Volatility and Volume Analysis : Realised Volatility (%), Relative Volume, Volume Sigma Score, and ATR Z-Score.
• Momentum and Market Position : ADX, RSI Z-Score, VWAP Distance (%), and Distance from 252-Bar High/Low.
• Regime Metrics : The numerical value of the Shannon Entropy score and the Model Confidence score.
VII. The User as the Head Strategist
With over 178 meticulously designed user inputs, JINN is the ultimate "glass box" engine. The internal code is proprietary, but the control surface is transparent and grants you architectural-level command.
• Prototype Sophisticated Strategies : Test complex, multi-model theses at your own pace that would otherwise take weeks of coding. Want to test a strategy that uses a Lorentzian classifier driven by the EigenTrend, arbitrated by JSA in "highest score" mode, and filtered by a strict Markov trend gate? These can be configured and unified.
• Tune the Engine to Any Market : The inputs provide the control surface to optimise JINN's behaviour for specific assets and timeframes, from crypto scalping to swing trading indices.
• Build Trust Through Configuration : The granular controls allow you to align the script's behaviour precisely with your own market view, building trust in your own deployment of the tool.
JINN is a commitment. It is a tool for the serious analyst who seeks to move from discretionary trading to a systematic, quantitative, and adaptive approach. If this aligns with your philosophy, we invite you to apply for access.
Disclaimer
This script is for informational and educational purposes only. It does not constitute financial, investment, or trading advice, nor is it a recommendation to buy or sell any asset.
All trading and investment decisions are the sole responsibility of the user. It is strongly recommended to thoroughly test any strategy on a paper trading account for at least one week before risking real capital.
Trading financial markets involves a high risk of loss, and you may lose more than your initial investment. Past performance is not indicative of future results. The developer is not responsible for any losses incurred from the use of this script.

Simulateur Carnet d'Ordres & Liquidité [Sese] - Custom🔹 Indicator Name
Order Book & Liquidity Simulator - Custom
🔹 Concept and Functionality
This indicator is a technical analysis tool designed to visually simulate market depth (Order Book) and potential liquidity zones.
It is important to adhere to TradingView's transparency rules: This script does not access real Level 2 data (the actual exchange order book). Instead, it uses a deductive algorithm based on historical Price Action to estimate where Buy Limit (Bid) and Sell Limit (Ask) orders might be resting.
Methodology used by the script:
Pivot Detection: The indicator scans for significant Swing Highs and Swing Lows over a user-defined lookback period (Length).
Level Projection: These pivots are projected to the right as horizontal lines.
Red Lines (Ask): Represent potential resistance zones (sellers).
Blue Lines (Bid): Represent potential support zones (buyers).
Liquidity Management (Absorption): The script is dynamic. If the current price crosses a line, the indicator assumes the liquidity at that level has been consumed (orders filled). The line is then automatically deleted from the chart.
Density Profile (Right Side): Horizontal bars appear to the right of the current price. These approximate a "Time Price Opportunity" or Volume Profile, showing where the market has spent the most time recently.
🔹 User Manual (Settings)
Here is how to configure the inputs to match your trading style:
1. Detection Algorithm
Lookback Length (Candles): Determines the sensitivity of the pivots.
Low value (e.g., 10): Shows many lines (scalping/short term).
High value (e.g., 50): Shows only major structural levels (swing trading).
Volume Factor: (Technical note: In this specific code version, this variable is calculated but the lines are primarily drawn based on geometric pivots).
2. Visual Settings
Show Price Lines (Bid/Ask): Toggles the horizontal Support/Resistance lines on or off.
Show Volume Profile: Toggles the heatmap-style bars on the right side of the chart.
Extend Lines: If checked, untouched lines will extend to the right towards the current price bar.
3. Colors and Transparency Management
Customize the aesthetics to keep your chart clean:
Bid / Ask Colors: Choose your base colors (Default is Blue and Red).
Line Transparency (%): Crucial for chart visibility.
0% = Solid, bright colors.
80-90% = Very subtle, faint lines (recommended if you overlay this on other tools).
Text Size: Adjusts the size of the price labels ("BUY LIMIT" / "SELL LIMIT").
🔹 How to Read the Indicator
Rejections: Unbroken lines act as potential walls. Watch for price reaction when approaching a blue line (support) or red line (resistance).
Breakouts/Absorption: When a line disappears, it means the level has been breached. The market may then seek the next liquidity level (the next line).
Density (Right-side boxes): More opaque/visible boxes indicate a price zone "accepted" by the market (consolidation). Empty gaps suggest an imbalance where price might move through quickly.
⚠️ Disclaimer
This script is for educational and technical analysis purposes only. It is a simulation based on price history, not real-time order book data. Past performance is not indicative of future results. Trading involves risk.

Smart Money ProSmart Money Pro V 8.1 is an advanced trading indicator that tracks institutional "smart money" movements using multiple Smart Money Concepts (SMC) techniques:
Market Structure: Identifies Change of Character (CHoCH), Break of Structure (BOS), and Internal/External Market Structure (IDM)
Order Blocks: Detects demand/supply zones including EXT OB, IDM OB, SCOB, and mitigation/breaker blocks
Order Flow: Tracks major and minor order flows with mitigation levels
Fair Value Gaps (FVG): Highlights price inefficiencies and imbalance zones
Liquidity Levels: Maps liquidity sweeps and key pivot levels
Price Structure: Shows OTE (Optimal Trade Entry) zones, PDH/PDL (Previous Day High/Low), equilibrium levels, and swing sweeps
Candle Patterns: Detects Inside and Outside bars
The indicator helps traders identify institutional entry/exit points, liquidity grabs, and high-probability trading zones.
Smart Money Pro V 8.1 هو مؤشر متقدم لتتبع تحركات المؤسسات المالية "الأموال الذكية" باستخدام مفاهيم Smart Money Concepts (SMC):
هيكل السوق: يحدد تغيير الاتجاه (CHoCH)، كسر الهيكل (BOS)، والهيكل الداخلي/الخارجي (IDM)
مناطق الطلب والعرض: يكتشف Order Blocks بأنواعها (EXT OB, IDM OB, SCOB) ومناطق الاختراق والتخفيف
تدفق الأوامر: يتتبع التدفقات الرئيسية والثانوية مع مستويات التخفيف
فجوات القيمة العادلة (FVG): يبرز مناطق عدم الكفاءة السعرية وعدم التوازن
مستويات السيولة: يرسم مصائد السيولة والنقاط المحورية الرئيسية
هيكل السعر: يعرض مناطق OTE (نقاط الدخول المثلى)، أعلى/أدنى سعر سابق (PDH/PDL)، مستويات التوازن، وكسر القمم/القيعان
أنماط الشموع: يكتشف شموع Inside و Outside Bar

KVS-Ultimate FVG & iFVG System [MTF + Distance Filter]Description: This indicator identifies Fair Value Gaps (FVG) and Inversion FVGs (iFVG) across multiple timeframes (MTF) with an advanced visualization system. Unlike standard FVG indicators, this script solves the "chart clutter" problem with a unique Distance Filter and offers a customizable Split Label System.
Key Features:
1. Unique Distance Filter (Clean Screen Mode):
When enabled, the script only shows the closest FVGs to the current price within a user-defined limit.
Keeps your chart clean while focusing on relevant price action levels.
2. Split Label System (Tabular Design):
Completely customizable label positioning, sizing, and coloring.
Separate controls for Normal FVGs and iFVGs.
Smart Label Logic: If you hide the FVG box, its label automatically hides. If an FVG breaks and becomes an iFVG (or fades), the label logic switches automatically to the iFVG settings.
3. Strict Mode Filtering:
Enabled: Checks if the candle closing price effectively breaks the previous structure (High/Low of the 1st candle), ensuring high-quality gaps.
Disabled: Detects all gaps between wicks (Standard calculation).
4. Multi-Timeframe (MTF) Support:
Monitor FVGs from up to 5 different timeframes simultaneously on a single chart.
5. Dynamic Interaction:
Choose how the script reacts when an FVG is broken: Turn it into an iFVG (Inversion) or simply fade the color (Ghost/Fade mode).
How to Use:
Use the "Distance Filter" checkbox in settings to clean up old/far blocks.
Adjust "TF1" to "TF5" to set up your multi-timeframe analysis.
Customize the Label Panel to align text perfectly with your chart style.
Disclaimer: This tool is for educational purposes and support for technical analysis.

ICT Fair Value Gap (FVG) Detector │ Auto-Mitigated │ 2025Accurate ICT / Smart Money Concepts Fair Value Gap (FVG) detector
Features:
• Detects both Bullish (-FVG) and Bearish (+FVG) using strict 3-candle rule
• Boxes automatically extend right until price mitigates them
• Boxes auto-delete when price closes inside the gap (true mitigation)
• No repainting – 100% reliable
• Clean, lightweight, and works on all markets & timeframes
• Fully customizable colors and transparency
How to use:
– Bullish FVG (green) = potential support / buy zone in uptrend
– Bearish FVG (red) = potential resistance / sell zone in downtrend
Exactly matches The Inner Circle Trader (ICT) methodology used by thousands of SMC traders in 2024–2025.
Enjoy and trade safe!

Aggressive VS Passive Orders Depletion @MaxMaserati 3.0Aggressive VS Passive Orders Depletion Indicator
Overview
This institutional-grade order flow analysis tool identifies and tracks limit order accumulation zones where significant buy and sell orders are placed in the market. It combines Highest Volume Candle Profile analysis with Market Structure detection to reveal where institutional traders have positioned their orders, and monitors in real-time whether these orders are being absorbed (depleted) or defended.
Core Concept: Order Block Detection & Depletion
This tool tracks the actual limit orders at key price levels and shows you:
Where institutional orders are placed (Buy Order Blocks vs Sell Order Blocks)
How strong these order zones are (original volume strength as %)
Real-time order flow activity (aggressive buyers vs aggressive sellers)
Depletion status (are the orders being consumed or defended?)
How It Works: Dual-Engine System
Engine 1: Volume Profile Analysis - Point of Control (POC) Detection
Divides price range into 25 horizontal levels (configurable)
Analyzes the last 120 bars (configurable lookback)
Distributes volume across price levels based on where each bar traded
Identifies the Point of Control (POC) - the price level with highest traded volume
Determines market bias: Bullish if price above POC, Bearish if below
Purpose: Shows where the majority of volume has been traded, indicating institutional accumulation zones and fair value areas.
Engine 2: Market Structure Analysis (PHL - Pivot High/Low)
Uses fractal pivot detection (configurable strength)
Identifies swing highs and lows that create market structure
Tracks Break of Structure (BOS) - price breaks recent swing in trend direction
Tracks Market Structure Shift (MSS) - price breaks swing points against trend
Maintains a trailing price at the most recent significant swing point
Purpose: Identifies where smart money is likely defending key structural levels with limit orders.
Key Innovation #1: Dynamic Confluence Zone Detection
When the Volume Profile POC and Market Structure trail price align within a configurable sensitivity threshold (default 1.0%), the indicator creates an Order Block Zone.
The Algorithm:
Monitors both engines continuously
Creates zones ONLY when POC is within X% of the structural swing point
Both engines must agree on the significance of the price level
Optional volume confirmation filter
This dual-confirmation approach filters out weak levels and highlights only the highest-probability zones where institutional orders are likely clustered.
Zone Types:
🟢 Buy Order Blocks (Support) - Created when confluence occurs with price above the zone. Represents accumulated buy limit orders waiting to support price.
🔴 Sell Order Blocks (Resistance) - Created when confluence occurs with price below the zone. Represents accumulated sell limit orders waiting to resist price.
Key Innovation #2: Real-Time Aggressive VS Passive Order Flow Analysis
The indicator performs sophisticated order flow decomposition on each candle that interacts with a zone, separating market activity into distinct categories:
Order Flow Categories:
1. Aggressive Orders - Market orders that consume liquidity
Aggressive Buy Volume: Market buys hitting sell limits (taking offers)
Aggressive Sell Volume: Market sells hitting buy limits (hitting bids)
Marked with (AGG) label when detected
Indicates urgent traders willing to pay the spread
2. Passive Orders - Limit orders adding liquidity
Passive Buy Volume: New buy limits being placed (making bids)
Passive Sell Volume: New sell limits being placed (making offers)
Shows patient traders providing liquidity
3. New Order Flow - Fresh buying/selling pressure
New Buyers: Total new buying activity (aggressive + passive)
New Sellers: Total new selling activity (aggressive + passive)
Net pressure indicator for zone health
Key Innovation #3: Advanced Order Flow Decomposition Algorithm
The indicator uses a proprietary candle analysis formula to separate aggressive from passive orders based on two key metrics:
Key Metrics:
Body Strength = |Close - Open| / (High - Low)
Close Position = (Close - Low) / (High - Low)
Bullish Candle Analysis:
Strong Aggressive Buying (Close Position ≥ 0.8 AND Body Strength ≥ 0.7):
90% aggressive buying, 10% passive selling, 90% new buyers
Moderate Aggressive Buying (Close Position ≥ 0.6 AND Body Strength ≥ 0.5):
70% aggressive buying, 20% passive selling, 80% new buyers, 20% new sellers
Weak Bullish (Close Position ≥ 0.5):
0-30% aggressive buying, 20-30% passive selling, 60% new buyers, 40% new sellers
Very Weak Bullish (Close Position < 0.5):
0% aggressive buying, 40% passive selling, 40% new buyers, 60% new sellers
Bearish Candle Analysis:
Strong Aggressive Selling (Close Position ≤ 0.2 AND Body Strength ≥ 0.7):
90% aggressive selling, 10% passive buying, 90% new sellers
Moderate Aggressive Selling (Close Position ≤ 0.4 AND Body Strength ≥ 0.5):
70% aggressive selling, 20% passive buying, 80% new sellers, 20% new buyers
Weak Bearish (Close Position ≤ 0.5):
0-30% aggressive selling, 20-30% passive buying, 60% new sellers, 40% new buyers
Very Weak Bearish (Close Position > 0.5):
0% aggressive selling, 40% passive buying, 40% new sellers, 60% new buyers
What This Reveals:
High close position + strong body = Aggressive buying overwhelming sellers
Low close position + strong body = Aggressive selling overwhelming buyers
Mid-range close = Battle between buyers and sellers
Small body = Passive orders dominating (limit orders being placed, not filled)
Key Innovation #4: Dynamic Depletion System with Intelligent Thresholds
The indicator adapts depletion thresholds based on zone strength:
High Liquidity Zones (>300% volume strength):
Depletion at 40% consumption - Massive clusters considered broken early because partial depletion indicates institutional withdrawal
Medium Liquidity Zones (150-300% volume strength):
Depletion at 60% consumption - Standard institutional behavior, majority must be consumed
Normal Liquidity Zones (75-150% volume strength):
Depletion at 80% consumption - Retail and smaller institutional zones need near-complete absorption
Low Liquidity Zones (<75% volume strength):
Depletion at 100% consumption - Weak zones must be fully absorbed before marked depleted
Why This Matters:
Strong zones failing early = powerful reversal signal (institutions gave up)
Weak zones holding = hidden strength (more orders being added)
Adaptive logic prevents false signals from fixed thresholds
Depletion Formula:
For Buy Order Zones:
Zone Liquidity % = (Original Buy Volume / Average Volume) × 100
Consumed % = (Sell Volume Absorbed / Average Volume) × 100
If Consumed Volume > Dynamic Threshold → Zone DEPLETED
For Sell Order Zones:
Zone Liquidity % = (Original Sell Volume / Average Volume) × 100
Consumed % = (Buy Volume Absorbed / Average Volume) × 100
If Consumed Volume > Dynamic Threshold → Zone DEPLETED
Key Innovation #5: Absorption Detection & Battle Analysis
The indicator identifies when one side is overwhelming the other using a configurable Absorption Threshold (default 1.5x = 50% more volume).
Battle States for Buy Order Blocks:
New Buyers Dominating (New Buyers > New Sellers × 1.5):
Label: ↑ New Buyers: +X% - Buy orders successfully defended
Sellers Attacking (New Sellers > New Buyers × 1.5):
Label: ↓ Sellers Attack: +X% (AGG) - Sell orders overwhelming the zone
Active Battle (Both active, <1.5x ratio):
Label: Battle: B+X% vs S+Y% - Active two-way order flow
Quiet Zone (Minimal activity):
Label: ↔ Quiet: X% - Zone untested or ignored
Battle States for Sell Order Blocks:
New Sellers Dominating (New Sellers > New Buyers × 1.5):
Label: ↓ New Sellers: +X% - Sell orders successfully defended
Buyers Absorbing (New Buyers > New Sellers × 1.5):
Label: ↑ Buyers Absorb: +X% (AGG) - Buy orders overwhelming the zone
Active Battle (Both active, <1.5x ratio):
Label: Battle: S+X% vs B+Y% - Active two-way order flow
Quiet Zone (Minimal activity):
Label: ↔ Quiet: X% - Zone untested or ignored
The (AGG) Marker:
Appears when aggressive market orders are detected (high body strength + extreme close position). Indicates institutional-sized urgency—someone is willing to pay market price NOW. Often precedes breakouts or strong continuations.
Label System Explained
No Label = Untested Zone
When a zone is first created, you see ONLY the colored box with NO label. This means:
Price has NOT yet reached this order block
The limit orders are still pending/resting
The zone is a future area of interest
Labels only appear after first price contact
Label Format (After First Touch):
Line 1: ● XX% Order Type
Line 2: Flow Analysis
Example Labels:
Buy Order Blocks:
● 150% Buy Orders + ↑ New Buyers: +85%
● 150% Buy Orders + ↑ New Buyers: +120% (AGG)
● 150% Buy Orders + Battle: B+45% vs S+38%
● 150% Buy Orders + ↓ Sellers Attack: +95% (AGG)
● 150% Buy Orders + ↓ Sellers Attack: +95% (AGG)
● 150% Buy Orders
Sell Order Blocks:
● 200% Sell Orders + ↓ New Sellers: +110%
● 200% Sell Orders + ↓ New Sellers: +140% (AGG)
● 200% Sell Orders + Battle: S+62% vs B+41%
● 200% Sell Orders + ↑ Buyers Absorb: +88% (AGG)
● 200% Sell Orders + ↑ Buyers Absorb: +88% (AGG)
● 200% Sell Orders
Status Indicators:
- Price penetrated through the zone
- Orders fully consumed, zone exhausted
Gray color - Zone no longer active
Directional Arrows:
↑ - Upward pressure (buyers stronger)
↓ - Downward pressure (sellers stronger)
↔ - Balanced/quiet (low activity)
↗ / ↘ - Mixed battle with bias
Point of Control (POC) Sub-Level Analysis
Each order block contains advanced volume distribution tracking:
Multi-Level Analysis (default 5 levels): Zones subdivided into horizontal price levels
Volume Distribution: Every candle's volume distributed across sub-levels based on price overlap
Buy/Sell Separation: Each level tracks buy vs sell volume independently
Dynamic POC Line: Marks the price level with highest traded volume within the zone
Real-Time Updates: POC adjusts as new volume enters, showing where "fairest price" is migrating
Style Options: Solid, Dashed, or Dotted lines (configurable width 1-5)
POC Trading Significance:
Represents the most accepted price within the order block
Often the best entry price for limit orders (highest liquidity)
POC migration shows whether zone is being "worked higher" or "worked lower"
Breaking through POC often signals zone failure
Key Settings
Volume Profile:
Lookback Period: 120 bars (historical period for POC)
Price Rows: 25 levels (granularity of volume distribution)
Volume Confirmation: Require structure breaks to align with volume bias
Market Structure:
Pivot Strength: 1 (swing detection sensitivity)
Show Trail: Optional trailing price visualization
Confluence Detection:
Sensitivity: 1.0% (distance threshold for POC/Structure alignment)
Lower = Stricter confluence, fewer zones
Higher = More zones detected
Order Flow Analysis:
Show Real-Time Order Flow: Live buyer/seller activity
Show Aggressive Markers: (AGG) labels for market orders
Show Directional Arrows: Price direction indicators (↑↓↔↗↘)
Absorption Threshold: 1.5x (when one side overwhelms the other)
1.5 = 50% more volume needed
2.0 = 100% more (stricter)
1.2 = 20% more (more sensitive)
Visual Options:
Hide Depleted Zones: Auto-remove exhausted blocks
Smart Bar Coloring: Color candles based on signal alignment
Zone Colors: Customize buy/sell colors
Label Text Size: Tiny, Small, Normal, Large
POC Settings:
Show POC Lines: Toggle Point of Control display
POC Analysis Levels: 3-10 levels
Line Width: 1-5 pixels
Line Style: Solid, Dashed, or Dotted
Trading Applications
1. Institutional Order Detection - Identify where large players positioned limit orders using Volume Profile POC + Market Structure confluence
2. Support/Resistance Validation - Dual confirmation filters weak levels, highlights high-probability reversal areas
3. Order Flow Imbalance Trading - Trade in direction of aggressive flow using (AGG) markers, fade zones showing absorption
4. Breakout/Breakdown Confirmation - and statuses validate moves through key levels
5. Liquidity Hunting - Track stop-loss clusters, anticipate stop runs based on depletion patterns
6. Entry Refinement - Use POC lines for precise limit placement at "fairest price" within zones
Combined Signal System
HVN Volume Profile × Market Structure Signals:
STRONG BUY: Both engines bullish + structure break up + volume confirmation
BUY: Bullish bias with partial confirmation
WEAK BUY: Early bullish signals
STRONG SELL: Both engines bearish + structure break down + volume confirmation
SELL: Bearish bias with partial confirmation
WEAK SELL: Early bearish signals
Alert Conditions:
Strong Buy/Sell signals (with volume confirmation)
Confluence zone activation (new order block created)
Order block depletion (zone exhausted)
What Makes This Indicator Unique
Industry-Standard Foundation:
Volume Profile POC detection + Market Structure analysis (swing pivots, BOS/MSS) + Point of Control tracking
Unique Innovations:
Dynamic Confluence Algorithm + Aggressive vs Passive Order Flow Decomposition + Adaptive Depletion Thresholds + Real-Time Absorption Detection + Battle Analysis with (AGG) markers + Complete Unified Methodology
Technical Excellence:
Resource-optimized (max 50 zones), comprehensive safety checks, multi-tier labeling, flexible customization
Best Practices
Wait for first touch - No label = untested zone
Watch (AGG) markers - Institutional urgency signal
Trust adaptive depletion - Strong zones failing early = major reversal
Use POC for entries - Best price within zone
Combine higher timeframes - Daily/4H zones strongest
Respect zones - Failed support becomes resistance
Follow battle labels - Contested areas show stop clusters
Adjust sensitivity - Tight ranges = lower %, trending = higher %
Performance Notes
Maximum Active Zones: 50 (automatic cleanup)
Maximum Lines: 400 (POC managed dynamically)
Lookback Cap: 1000 bars for optimization
Updates: All calculations on bar close for confirmed signals
