FVG / FRACTALS HELPERTG: imjustdanya
Индикатор автоматически находит фракталы/имбалансы на выбранных таймфреймах
Можно настраивать всё,от внешнего вида, до количества отображаемых объектов
Экономит много времени,и очень эффективен при интрадей торговле в стратегии Price Action
The indicator automatically detects fractals and imbalances on selected timeframes.
You can customize everything — from appearance to the number of displayed objects.
It saves a lot of time and is highly effective for intraday trading within a Price Action strategy.
In den Scripts nach "imbalance" suchen

Miggy Oscillator — NeoWave v7.4.3 Adaptive ProMiggy Oscillator — NeoWave v7.4.3 Adaptive Pro
Miggy Oscillator — NeoWave v7.4.3 Adaptive Pro is an adaptive market oscillator built to identify trend reversals, momentum exhaustion, and liquidity pivot zones across multiple timeframes.
It combines NeoWave-style wave phase detection, volatility-adjusted threshold bands, and contextual divergence logic to deliver reliable reversal signals for Scalp, Intraday, and Swing trading.
Key Concepts
This script introduces a custom wave-phase engine that estimates the current stage of market structure rather than simply combining existing indicators.
It uses asymmetric momentum smoothing and ATR-based volatility scaling to adapt naturally between calm and high-volatility environments.
Divergences are context-aware: they only trigger when both momentum inflection and wave-phase confirmation align, minimizing false signals common to classic RSI or MACD tools.
How It Works
Wave Phase Detection
Calculates the relative position of price within impulsive or corrective phases based on momentum deviation from a dynamic baseline.
Adaptive Threshold Bands
Expands or contracts automatically with real-time volatility to keep sensitivity consistent across different market regimes.
Divergence and Exhaustion Logic
Bullish divergence: price forms a lower low while the oscillator forms a higher low during a corrective phase.
Bearish divergence: price forms a higher high while the oscillator forms a lower high during an impulsive phase.
Exhaustion tags appear when the oscillator pierces an adaptive band and momentum slope weakens.
Mode System
Scalp Mode: high sensitivity, short reaction window.
Intraday Mode: balanced sensitivity and confirmation.
Swing Mode: slower reaction, wide filters for large-scale moves.
Optional Long-Only Bias
Filters out short setups to focus on bullish structures.
How to Use
Choose the operational mode based on your timeframe.
Monitor interactions between the oscillator and outer bands for possible exhaustion or divergence.
Confirm the signal using structure or candle confirmation.
Manage risk:
Tight stops for Scalp mode (1–5 min).
ATR-based stops for Intraday mode (5–30 min).
Structural stops for Swing mode (1H+).
For better accuracy, combine it with Miggy Wave AI or Miggy Fibonacci Matrix to find confluence zones.
Inputs and Customization
Mode Selector: Scalp / Intraday / Swing
Sensitivity Control
Band Multiplier (threshold width)
Divergence Confirmation Bars
Long-Only Option
Color Presets: Miggy Neon (default), Solana Glow, Arctic Pulse, or custom
Signal Labels On/Off
Alert Language: EN or ES
Alerts
Available alert conditions:
Bullish Reversal Detected
Bearish Reversal Detected
Momentum Exhaustion Near Band
Example alert text:
Miggy Oscillator — Bullish reversal detected (Mode: {mode})
Miggy Oscillator — Bearish reversal detected (Mode: {mode})
Miggy Oscillator — Momentum exhaustion near {upper/lower} band
Best Practices
Always confirm divergence with price structure or higher timeframe context.
Avoid taking counter-trend signals in strong trends without confirmation.
Adjust Band Multiplier or switch mode during extreme volatility.
Works on Crypto, Forex, Stocks, Indices, and Commodities.
Limitations
This is not an automated trading system.
It is a technical analysis tool intended to help visualize momentum imbalances and potential reversals.
Performance depends on market conditions and trader confirmation.
Versioning and License
Uses TradingView’s Update feature for improvements (no separate minor releases).
Any future legacy fork will be explained clearly in the description.
License: MIT (open source).
Developed by Miggy.io / Mr. Migraine — 2025.
Publication Compliance
English-only title and description.
No emojis or special characters.
Original adaptive algorithm with detailed explanation.
Clear usage instructions.
Suitable for a clean chart publication preview.

HVIB UltimateThis script shows specific VIBs (volume imbalances) Customizable
HVIB - shows all HVIBS for short/ long, timeframe customization (current, 10, 15), colour customization, Fill close customisation (body/wick, number of closes needed to stop showing it as a valid)
2: FVIB indicator - shows two types of Failed vibs
FHVIBs (basicaly HVIBS but only those failed ones)
FVIB - Vib between two same candles closed by the third opposite candle (failed vib)
I like to have those two indicators three times copied for each timeframes /HVIBS 3 times and Fhvibs three times. to turn in quickly on and off and look which timeframes are aligned (which is even stronger I believe)

FVG / FRACTALS HELPERTG: imjustdanya
Индикатор автоматически находит фракталы/имбалансы на выбранных таймфреймах
Можно настраивать всё,от внешнего вида, до количества отображаемых объектов
Экономит много времени,и очень эффективен при интрадей торговле в стратегии Price Action
The indicator automatically detects fractals and imbalances on selected timeframes.
You can customize everything — from appearance to the number of displayed objects.
It saves a lot of time and is highly effective for intraday trading within a Price Action strategy.

CB Spot v BN Futs Premium by Chop324Coinbase Spot vs Binance Futures Premium Tracker
What This Indicator Does:
This indicator automatically tracks the price premium or discount between Coinbase spot prices and Binance perpetual futures for any cryptocurrency you're viewing. It works dynamically with whatever ticker you load it on - no manual configuration needed.
How It Works:
The script extracts the base currency from your current chart (BTC, ETH, SOL, etc.) and automatically constructs the corresponding tickers:
Coinbase Spot: COINBASE: USD
Binance Perpetual Futures: BINANCE: USDT.P
It then calculates the simple price difference: Coinbase Spot - Binance Futures
Visual Display:
The premium/discount is plotted as a histogram:
Green columns: Coinbase trading at a premium (higher than Binance)
Red columns: Coinbase trading at a discount (lower than Binance)
Baseline at 0: Represents price parity between exchanges
Why This Matters:
Coinbase premium is a useful market sentiment indicator, particularly for institutional/US retail activity:
Positive premium: Often indicates strong US-based buying pressure
Negative premium: May suggest selling pressure or capital flowing to offshore exchanges
Extreme deviations: Can signal localized supply/demand imbalances or arbitrage opportunities
Usage:
Simply load the indicator on any crypto chart (BTCUSDT, ETHUSDT, SOLUSDT, etc.) and it will automatically display the premium/discount for that asset.
Note: Requires both Coinbase spot and Binance perpetual futures data to be available for the symbol you're viewing.

MIG and MC 发布简介(中文)
MIG and MC 指标帮助日内交易者快速识别微型缺口(Micro Gap)与微型通道(Micro Channel)。脚本支持过滤开盘跳空、合并连续缺口,并自动绘制
FPL(Fair Price Line)延伸线,既可追踪缺口是否被填补,也能直观标注潜在的趋势结构。为了确保跨周期一致性,最新版本对开盘前后和跨日场景做了专门处理
主要特性
- 自动检测并显示看涨/看跌微型缺口,支持按需合并连续缺口。
- 自定义是否忽略开盘缺口、缺口显示范围与 FPL 样式。
- FPL 触及后即停止延伸,辅助研判缺口是否真正回补。
- 内置强收盘与缺口过滤的微型通道识别,可选多种严格程度。
- 适用于 1/5/9 分钟等日内周期,也适用于更长周期。
Recommended English Description
The MIG and MC indicator highlights Micro Gaps and Micro Channels so you can track true intraday imbalances without noise. It merges
consecutive gaps, projects Fair Price Lines (FPL) that stop once touched, and offers a full intraday-ready opening-gap filter so your
early bars stay clean. The latest update refines cross-session handling, giving reliable gap plots on 1-, 5-, and 9-minute charts as well as higher time frames.
Key Features
- Detects bullish and bearish micro gaps with optional gap merging.
- Toggle opening-gap filters and configure look back, visibility, and FPL style.
- FPL lines stop as soon as price revisits the gap, making gap closure obvious.
- Micro Channel mode uses strong-close and gap filters to mark high-quality trend legs.
- Consistent behavior across intraday and higher time frames.

Volume Cluster Support and Resistance Levels [QuantAlgo]🟢 Overview
This indicator identifies statistically significant support and resistance levels through volume cluster analysis, isolating price zones characterized by elevated trading activity and institutional participation. By quantifying areas where volume concentration exceeded historical norms, it reveals price levels with demonstrated supply-demand imbalances that exhibit persistent influence on subsequent price action. The methodology is asset-agnostic and timeframe-independent, applicable across equities, cryptocurrencies, forex, and commodities from intraday to weekly intervals.
🟢 Key Features
1. Support and Resistance Levels
The indicator scans historical price data to identify bars where volume exceeds a user-defined threshold multiplier relative to the rolling average. For each qualifying bar, a representative price is calculated using the average of high, low, and close. Proximate price levels within a specified percentage range are then aggregated into discrete clusters using volume-weighted averaging, eliminating redundant signals. Clusters are ranked by cumulative volume to determine statistical significance. Finally, the indicator plots horizontal levels at each cluster price: support levels (green) below current price indicate zones where historical buying pressure exceeded selling pressure, while resistance levels (red) above current price mark zones where sellers historically dominated. These levels represent areas of established liquidity and price discovery, where institutional order flow previously concentrated.
The Touch Count (T) metric quantifies historical price interaction frequency, while Total Volume (TV) measures aggregate trading activity at each level, providing objective criteria for assessing level strength and trade execution decisions.
2. Volume Histogram
A histogram appears below the price chart, displaying relative volume for each bar within the lookback period, with bar height scaled to the maximum volume observed. Green bars represent up-periods (close > open) indicating buying pressure, while red bars show down-periods (close < open) indicating selling pressure. This visualization helps you confirm the validity of support/resistance levels by seeing where volume actually spiked, identify accumulation/distribution patterns, and validate breakouts by checking if they occur on above-average volume.
3. Built-in Alerts
Automated alerts trigger when price crosses below support levels or breaks above resistance levels, allowing you to monitor multiple assets without constant chart-watching.
4. Customizable Color Schemes
The indicator provides four preset color configurations (Classic, Aqua, Cosmic, Custom) optimized for visual clarity across different charting environments. Each scheme maintains consistent color mapping for support and resistance zones across both level lines and volume histogram components. The Custom configuration permits full color specification to accommodate individual charting setups, ensuring optimal visual contrast for extended analysis sessions.
Classic:
Aqua:
Cosmic:
Custom:
🟢 Pro Tips
→ Trade entry optimization: Execute long positions at support levels with high touch counts or upon confirmed resistance breakouts accompanied by above-average volume
→ Risk parameter definition: Position stop-loss orders near identified support/resistance zones with statistical significance to minimize premature exits
→ Breakout validation: Require volume confirmation exceeding historical average when price penetrates resistance to filter false breakouts
→ Level strength assessment: Prioritize levels with higher touch counts and total volume metrics for enhanced probability trade setups
→ Multi-timeframe confluence: Synthesize support/resistance levels across multiple timeframes to identify high-conviction zones where daily support aligns with 4-hour resistance structures

Orb DivergenceOrb Divergence is a market reversal indicator that visually highlights moments when price momentum is ready to shift direction.
It detects hidden energy imbalances within price movements and identifies potential trend turning points formed by these accumulations.
The indicator displays colored orbs and clear “UP / DOWN” signals to mark upcoming reversals in a simple and intuitive way.
Rather than focusing on short-term reactions, it emphasizes key zones where market momentum may truly change.
Designed as a visual compass, Orb Divergence helps you spot the moments when the market takes a breath — and prepares to turn.
For a deeper and more data-driven approach to market structure and reversal dynamics, you may also want to explore Teometric Demand Model V3;

Malama's Heat MapOverview
Malama's Heat Map is an overlay indicator that visualizes historical liquidity as a dynamic heatmap aligned with the price chart, using volume as a proxy to map activity across time (X-axis) and price levels (Y-axis). It constructs a grid of up to 5000 cells via a matrix, distributing bar volume into discrete price bins to highlight concentration zones, creating a color-graded visualization from cool (low activity) to hot (high liquidity). This aids in identifying "Type II" fair value areas, support/resistance from past volume clusters, or potential imbalances without order book access. Built for v6 compatibility with efficiency in mind—computations run solely on the last bar, includes object limit enforcement, and offers two intra-bar volume distribution methods for flexible approximation.
Core Mechanics
The indicator generates a trailing heatmap through binning, accumulation, and box-based rendering:
Grid Setup: Configurable lookback (bars back, default 100) sets horizontal time span; bins (price divisions, default 50) define vertical resolution, limited to 5000 total cells to prevent errors. Bin height dynamically = max(mintick, (lookback high - low) / bins).
Y-Axis Stabilization: Anchors boundaries to the prior bar's high/low (if available) for a flicker-free view during live bar updates. All historical bar data (high/low/close/volume) is clipped to these bounds.
Volume Distribution Proxy:
Even: Divides bar volume equally across spanned bins (straightforward uniform spread).
POC Weighted (Inverse): Treats bar close as POC proxy; applies inverse distance weighting (1/(|bin - POC bin| + 1), normalized) to emphasize volume near the estimated control point, simulating clustered intra-bar trading.
Matrix Building: On last bar only, loops backward over lookback bars (newest right-aligned). For each, computes low/high bin indices, distributes volume per selected method into the matrix (columns=time, rows=price bins from low to high).
Scaling & Palette: Extracts max matrix value for relative normalization (0-1); maps to a 5-tier stepped color scheme (user-customizable: blue 90% transp. low → red 50% transp. high) for non-linear intensity.
Rendering: Clears old boxes, then iterates matrix to draw only non-zero cells as thin boxes: X spans one bar width (left=historical index from bar_index, right=next bar), Y fills bin height. Borderless for seamless heatmap effect.
The result is a right-leaning, chart-scrolling visualization emphasizing recent liquidity buildup.
Why This Adds Value & Originality
While session-based volume profiles exist, this heatmap captures ongoing multi-bar liquidity evolution ("Type II" style), revealing horizontal value areas or gaps dynamically. Originality shines in the custom inverse-weighting for POC realism (no ta.* dependencies), matrix-driven persistence for quick redraws, and stabilization to eliminate repaints—issues plaguing similar scripts. v6 adaptations (e.g., custom clamp, matrix recreation on input change) ensure broad compatibility without bloat. It condenses complex liquidity scanning into one tool: spot red "hot" bands as magnets, blue voids as FVGs. Unlike generic heatmaps, the proxy options and limit-aware design scale across timeframes/assets (e.g., forex vs. crypto), reducing the need for layered indicators.
How to Use
Setup: Apply as overlay. Defaults suit ~4-day 1H view; tune lookback/bins (e.g., 50x100 for intraday fine-detail, but watch 5000 cap—errors auto-flag excesses). Select "POC Weighted" for nuanced clustering, "Even" for simplicity. Customize palette (e.g., desaturate for dark themes).
Reading the Heatmap:
X-Axis (Time): Left=older (fainter context), right=recent focus; tracks evolving liquidity trails.
Y-Axis (Price): Bottom=range low, top=high; vertical density shows price-level attraction.
Colors: Faint blue (sparse volume, possible inefficiencies) → vivid red (dense activity, likely SR). Horizontal streaks = sustained value zones.
Trading Insights: Price wicking into red? Anticipate fills/reversals. Blue gaps post-break? Targets for retraces. Ideal on 5M–Daily; layer with candlesticks off for purity.
Example: In BTCUSD 4H, a yellow-red band at $60K from prior consolidation → treat as dynamic support for longs on dips.
Tips
Balance settings: High bins = sharper verticals but cap lookback (e.g., 80x60=4800 cells). Test on volatile pairs first.
"POC Weighted" excels in ranging markets; switch to "Even" for trending (avoids close-bias skew).
For deeper analysis, screenshot/export or pair with divergence tools; add manual alerts via box counts if extended.
Efficiency: Last-bar only keeps it snappy; refresh on input tweaks.
Limitations & Disclaimer
Visualization is historical/proxy-based—lagging by one bar, no forward projection or tick-level precision (close-as-POC is estimate). Clipping may trim outlier wicks; low-volume bars dilute globally. Stepped colors are relative (max scales per redraw), potentially compressing extremes. Exceeds 5000 cells? Runtime error halts—no fallback resize. Not real liquidity (volume ≠ depth); best as visual aid, not quantitative. Updates post-close only. Backtest zones on specific symbols—correlation ≠ causation. Not advice; trade responsibly. Ideas in comments!

Manifold Singularity EngineManifold Singularity Engine: Catastrophe Theory Detection Through Multi-Dimensional Topology Analysis
The Manifold Singularity Engine applies catastrophe theory from mathematical topology to multi-dimensional price space analysis, identifying potential reversal conditions by measuring manifold curvature, topological complexity, and fractal regime states. Unlike traditional reversal indicators that rely on price pattern recognition or momentum oscillators, this system reconstructs the underlying geometric surface (manifold) that price evolves upon and detects points where this topology undergoes catastrophic folding—mathematical singularities that correspond to forced directional changes in price dynamics.
The indicator combines three analytical frameworks: phase space reconstruction that embeds price data into a multi-dimensional coordinate system, catastrophe detection that measures when this embedded manifold reaches critical curvature thresholds indicating topology breaks, and Hurst exponent calculation that classifies the current fractal regime to adaptively weight detection sensitivity. This creates a geometry-based reversal detection system with visual feedback showing topology state, manifold distortion fields, and directional probability projections.
What Makes This Approach Different
Phase Space Embedding Construction
The core analytical method reconstructs price evolution as movement through a three-dimensional coordinate system rather than analyzing price as a one-dimensional time series. The system calculates normalized embedding coordinates: X = normalize(price_velocity, window) , Y = normalize(momentum_acceleration, window) , and Z = normalize(volume_weighted_returns, window) . These coordinates create a trajectory through phase space where price movement traces a path across a geometric surface—the market manifold.
This embedding approach differs fundamentally from traditional technical analysis by treating price not as a sequential data stream but as a dynamical system evolving on a curved surface in multi-dimensional space. The trajectory's geometric properties (curvature, complexity, folding) contain information about impending directional changes that single-dimension analysis cannot capture. When this manifold undergoes rapid topological deformation, price must respond with directional change—this is the mathematical basis for catastrophe detection.
Statistical normalization using z-score transformation (subtracting mean, dividing by standard deviation over a rolling window) ensures the coordinate system remains scale-invariant across different instruments and volatility regimes, allowing identical detection logic to function on forex, crypto, stocks, or indices without recalibration.
Catastrophe Score Calculation
The catastrophe detection formula implements a composite anomaly measurement combining multiple topology metrics: Catastrophe_Score = 0.45×Curvature_Percentile + 0.25×Complexity_Ratio + 0.20×Condition_Percentile + 0.10×Gradient_Percentile . Each component measures a distinct aspect of manifold distortion:
Curvature (κ) is computed using the discrete Laplacian operator: κ = √ , which measures how sharply the manifold surface bends at the current point. High curvature values indicate the surface is folding or developing a sharp corner—geometric precursors to catastrophic topology breaks. The Laplacian measures second derivatives (rate of change of rate of change), capturing acceleration in the trajectory's path through phase space.
Topological Complexity counts sign changes in the curvature field over the embedding window, measuring how chaotically the manifold twists and oscillates. A smooth, stable surface produces low complexity; a highly contorted, unstable surface produces high complexity. This metric detects when the geometric structure becomes informationally dense with multiple local extrema, suggesting an imminent topology simplification event (catastrophe).
Condition Number measures the Jacobian matrix's sensitivity: Condition = |Trace| / |Determinant|, where the Jacobian describes how small changes in price produce changes in the embedding coordinates. High condition numbers indicate numerical instability—points where the coordinate transformation becomes ill-conditioned, suggesting the manifold mapping is approaching a singularity.
Each metric is converted to percentile rank within a rolling window, then combined using weighted sum. The percentile transformation creates adaptive thresholds that automatically adjust to each instrument's characteristic topology without manual recalibration. The resulting 0-100% catastrophe score represents the current bar's position in the distribution of historical manifold distortion—values above the threshold (default 65%) indicate statistically extreme topology states where reversals become geometrically probable.
This multi-metric ensemble approach prevents false signals from isolated anomalies: all four geometric features must simultaneously indicate distortion for a high catastrophe score, ensuring only true manifold breaks trigger detection.
Hurst Exponent Regime Classification
The Hurst exponent calculation implements rescaled range (R/S) analysis to measure the fractal dimension of price returns: H = log(R/S) / log(n) , where R is the range of cumulative deviations from mean and S is the standard deviation. The resulting value classifies market behavior into three fractal regimes:
Trending Regime (H > 0.55) : Persistent price movement where future changes are positively correlated with past changes. The manifold exhibits directional momentum with smooth topology evolution. In this regime, catastrophe signals receive 1.2× confidence multiplier because manifold breaks in trending conditions produce high-magnitude directional changes.
Mean-Reverting Regime (H < 0.45) : Anti-persistent price movement where future changes tend to oppose past changes. The manifold exhibits oscillatory topology with frequent small-scale distortions. Catastrophe signals receive 0.8× confidence multiplier because reversal significance is diminished in choppy conditions where the manifold constantly folds at minor scales.
Random Walk Regime (H ≈ 0.50) : No statistical correlation in returns. The manifold evolution is geometrically neutral with moderate topology stability. Standard 1.0× confidence multiplier applies.
This adaptive weighting system solves a critical problem in reversal detection: the same geometric catastrophe has different trading implications depending on the fractal regime. A manifold fold in a strong trend suggests a significant reversal opportunity; the same fold in mean-reversion suggests a minor oscillation. The Hurst-based regime filter ensures detection sensitivity automatically adjusts to market character without requiring trader intervention.
The implementation uses logarithmic price returns rather than raw prices to ensure
stationarity, and applies the calculation over a configurable window (default 5 bars) to balance responsiveness with statistical validity. The Hurst value is then smoothed using exponential moving average to reduce noise while maintaining regime transition detection.
Multi-Layer Confirmation Architecture
The system implements five independent confirmation filters that must simultaneously validate
before any singularity signal generates:
1. Catastrophe Threshold : The composite anomaly score must exceed the configured threshold (default 0.65 on 0-1 scale), ensuring the manifold distortion is statistically extreme relative to recent history.
2. Pivot Structure Confirmation : Traditional swing high/low patterns (using ta.pivothigh and ta.pivotlow with configurable lookback) must form at the catastrophe bar. This ensures the geometric singularity coincides with observable price structure rather than occurring mid-swing where interpretation is ambiguous.
3. Swing Size Validation : The pivot magnitude must exceed a minimum threshold measured in ATR units (default 1.5× Average True Range). This filter prevents signals on insignificant price jiggles that lack meaningful reversal potential, ensuring only substantial swings with adequate risk/reward ratios generate signals.
4. Volume Confirmation : Current volume must exceed 1.3× the 20-period moving average, confirming genuine market participation rather than low-liquidity price noise. Manifold catastrophes without volume support often represent false topology breaks that don't translate to sustained directional change.
5. Regime Validity : The market must be classified as either trending (ADX > configured threshold, default 30) or volatile (ATR expansion > configured threshold, default 40% above 30-bar average), and must NOT be in choppy/ranging state. This critical filter prevents trading during geometrically unfavorable conditions where edge deteriorates.
All five conditions must evaluate true simultaneously for a signal to generate. This conjunction-based logic (AND not OR) dramatically reduces false positives while preserving true reversal detection. The architecture recognizes that geometric catastrophes occur frequently in noisy data, but only those catastrophes that align with confirming evidence across price structure, participation, and regime characteristics represent tradable opportunities.
A cooldown mechanism (default 8 bars between signals) prevents signal clustering at extended pivot zones where the manifold may undergo multiple small catastrophes during a single reversal process.
Direction Classification System
Unlike binary bull/bear systems, the indicator implements a voting mechanism combining four
directional indicators to classify each catastrophe:
Pivot Vote : +1 if pivot low, -1 if pivot high, 0 otherwise
Trend Vote : Based on slow frequency (55-period EMA) slope—+1 if rising, -1 if falling, 0 if flat
Flow Vote : Based on Y-gradient (momentum acceleration)—+1 if positive, -1 if negative, 0 if neutral
Mid-Band Vote : Based on price position relative to medium frequency (21-period EMA)—+1 if above, -1 if below, 0 if at
The total vote sum classifies the singularity: ≥2 votes = Bullish , ≤-2 votes = Bearish , -1 to +1 votes = Neutral (skip) . This majority-consensus approach ensures directional classification requires alignment across multiple timeframes and analysis dimensions rather than relying on a single indicator. Neutral signals (mixed voting) are displayed but should not be traded, as they represent geometric catastrophes without clear directional resolution.
Core Calculation Methodology
Embedding Coordinate Generation
Three normalized phase space coordinates are constructed from price data:
X-Dimension (Velocity Space):
price_velocity = close - close
X = (price_velocity - mean) / stdev over hurstWindow
Y-Dimension (Acceleration Space):
momentum = close - close
momentum_accel = momentum - momentum
Y = (momentum_accel - mean) / stdev over hurstWindow
Z-Dimension (Volume-Weighted Space):
vol_normalized = (volume - mean) / stdev over embedLength
roc = (close - close ) / close
Z = (roc × vol_normalized - mean) / stdev over hurstWindow
These coordinates define a point in 3D phase space for each bar. The trajectory connecting these points is the reconstructed manifold.
Gradient Field Calculation
First derivatives measure local manifold slope:
dX/dt = X - X
dY/dt = Y - Y
Gradient_Magnitude = √
The gradient direction indicates where the manifold is "pushing" price. Positive Y-gradient suggests upward topological pressure; negative Y-gradient suggests downward pressure.
Curvature Tensor Components
Second derivatives measure manifold bending using discrete Laplacian:
Laplacian_X = X - 2×X + X
Laplacian_Y = Y - 2×Y + Y
Laplacian_Magnitude = √
This is then normalized:
Curvature_Normalized = (Laplacian_Magnitude - mean) / stdev over embedLength
High normalized curvature (>1.5) indicates sharp manifold folding.
Complexity Accumulation
Sign changes in curvature field are counted:
Sign_Flip = 1 if sign(Curvature ) ≠ sign(Curvature ), else 0
Topological_Complexity = sum(Sign_Flip) over embedLength window
This measures oscillation frequency in the geometry. Complexity >5 indicates chaotic topology.
Condition Number Stability Analysis
Jacobian matrix sensitivity is approximated:
dX/dp = dX/dt / (price_change + epsilon)
dY/dp = dY/dt / (price_change + epsilon)
Jacobian_Determinant = (dX/dt × dY/dp) - (dX/dp × dY/dt)
Jacobian_Trace = dX/dt + dY/dp
Condition_Number = |Trace| / (|Determinant| + epsilon)
High condition numbers indicate numerical instability near singularities.
Catastrophe Score Assembly
Each metric is converted to percentile rank over embedLength window, then combined:
Curvature_Percentile = percentrank(abs(Curvature_Normalized), embedLength)
Gradient_Percentile = percentrank(Gradient_Magnitude, embedLength)
Condition_Percentile = percentrank(abs(Condition_Z_Score), embedLength)
Complexity_Ratio = clamp(Topological_Complexity / embedLength, 0, 1)
Final score:
Raw_Anomaly = 0.45×Curvature_P + 0.25×Complexity_R + 0.20×Condition_P + 0.10×Gradient_P
Catastrophe_Score = Raw_Anomaly × Hurst_Multiplier
Values are clamped to range.
Hurst Exponent Calculation
Rescaled range analysis on log returns:
Calculate log returns: r = log(close) - log(close )
Compute cumulative deviations from mean
Find range: R = max(cumulative_dev) - min(cumulative_dev)
Calculate standard deviation: S = stdev(r, hurstWindow)
Compute R/S ratio
Hurst = log(R/S) / log(hurstWindow)
Clamp to and smooth with 5-period EMA
Regime Classification Logic
Volatility Regime:
ATR_MA = SMA(ATR(14), 30)
Vol_Expansion = ATR / ATR_MA
Is_Volatile = Vol_Expansion > (1.0 + minVolExpansion)
Trend Regime (Corrected ADX):
Calculate directional movement (DM+, DM-)
Smooth with Wilder's RMA(14)
Compute DI+ and DI- as percentages
Calculate DX = |DI+ - DI-| / (DI+ + DI-) × 100
ADX = RMA(DX, 14)
Is_Trending = ADX > (trendStrength × 100)
Chop Detection:
Is_Chopping = NOT Is_Trending AND NOT Is_Volatile
Regime Validity:
Regime_Valid = (Is_Trending OR Is_Volatile) AND NOT Is_Chopping
Signal Generation Logic
For each bar:
Check if catastrophe score > topologyStrength threshold
Verify regime is valid
Confirm Hurst alignment (trending or mean-reverting with pivot)
Validate pivot quality (price extended outside spectral bands then re-entered)
Confirm volume/volatility participation
Check cooldown period has elapsed
If all true: compute directional vote
If vote ≥2: Bullish Singularity
If vote ≤-2: Bearish Singularity
If -1 to +1: Neutral (display but skip)
All conditions must be true for signal generation.
Visual System Architecture
Spectral Decomposition Layers
Three harmonic frequency bands visualize entropy state:
Layer 1 (Surface Frequency):
Center: EMA(8)
Width: ±0.3 × 0.5 × ATR
Transparency: 75% (most visible)
Represents fast oscillations
Layer 2 (Mid Frequency):
Center: EMA(21)
Width: ±0.5 × 0.5 × ATR
Transparency: 85%
Represents medium cycles
Layer 3 (Deep Frequency):
Center: EMA(55)
Width: ±0.7 × 0.5 × ATR
Transparency: 92% (most transparent)
Represents slow baseline
Convergence of layers indicates low entropy (stable topology). Divergence indicates high entropy (catastrophe building). This decomposition reveals how different frequency components of price movement interact—when all three align, the manifold is in equilibrium; when they separate, topology is unstable.
Energy Radiance Fields
Concentric boxes emanate from each singularity bar:
For each singularity, 5 layers are generated:
Layer n: bar_index ± (n × 1.5 bars), close ± (n × 0.4 × ATR)
Transparency gradient: inner 75% → outer 95%
Color matches signal direction
These fields visualize the "energy well" of the catastrophe—wider fields indicate stronger topology distortion. The exponential expansion creates a natural radiance effect.
Singularity Node Geometry
N-sided polygon (default hexagon) at each signal bar:
Vertices calculated using polar coordinates
Rotation angle: bar_index × 0.1 (creates animation)
Radius: ATR × singularity_strength × 2
Connects vertices with colored lines
The rotating geometric primitive marks the exact catastrophe bar with visual prominence.
Gradient Flow Field
Directional arrows display manifold slope:
Spawns every 3 bars when gradient_magnitude > 0.1
Symbol: "↗" if dY/dt > 0.1, "↘" if dY/dt < -0.1, "→" if neutral
Color: Bull/bear/neutral based on direction
Density limited to flowDensity parameter
Arrows cluster when gradient is strong, creating intuitive topology visualization.
Probability Projection Cones
Forward trajectory from each singularity:
Projects 10 bars forward
Direction based on vote classification
Center line: close + (direction × ATR × 3)
Uncertainty width: ATR × singularity_strength × 2
Dashed boundaries, solid center
These are mathematical projections based on current gradient, not price targets. They visualize expected manifold evolution if topology continues current trajectory.
Dashboard Metrics Explanation
The real-time control panel displays six core metrics plus regime status:
H (Hurst Exponent):
Value: Current Hurst (0-1 scale)
Label: TREND (>0.55), REVERT (<0.45), or RANDOM (0.45-0.55)
Icon: Direction arrow based on regime
Purpose: Shows fractal character—only trade when favorable
Σ (Catastrophe Score):
Value: Current composite anomaly (0-100%)
Bar gauge shows relative strength
Icon: ◆ if above threshold, ○ if below
Purpose: Primary signal strength indicator
κ (Curvature):
Value: Normalized Laplacian magnitude
Direction arrow shows sign
Color codes severity (green<0.8, yellow<1.5, red≥1.5)
Purpose: Shows manifold bending intensity
⟳ (Topology Complexity):
Value: Count of sign flips in curvature
Icon: ◆ if >3, ○ otherwise
Color codes chaos level
Purpose: Indicates geometric instability
V (Volatility Expansion):
Value: ATR expansion percentage above 30-bar average
Icon: ● if volatile, ○ otherwise
Purpose: Confirms energy present for reversal
T (Trend Strength):
Value: ADX reading (0-100)
Icon: ● if trending, ○ otherwise
Purpose: Shows directional bias strength
R (Regime):
Label: EXPLOSIVE / TREND / VOLATILE / CHOP / NEUTRAL
Icon: ✓ if valid, ✗ if invalid
Purpose: Go/no-go filter for trading
STATE (Bottom Display):
Shows: "◆ BULL SINGULARITY" (green), "◆ BEAR SINGULARITY" (red), "◆ WEAK/NEUTRAL" (orange), or "— Monitoring —" (gray)
Purpose: Current signal status at a glance
How to Use This Indicator
Initial Setup and Configuration
Apply the indicator to your chart with default settings as a starting point. The default parameters (21-bar embedding, 5-bar Hurst window, 2.5σ singularity threshold, 0.65 topology confirmation) are optimized for balanced detection across most instruments and timeframes. For very fast markets (scalping crypto, 1-5min charts), consider reducing embedding depth to 13-15 bars and Hurst window to 3 bars for more responsive detection. For slower markets (swing trading stocks, 4H-Daily charts), increase embedding depth to 34-55 bars and Hurst window to 8-10 bars for more stable topology measurement.
Enable the dashboard (top right recommended) to monitor real-time metrics. The control panel is your primary decision interface—glancing at the dashboard should instantly communicate whether conditions favor trading and what the current topology state is. Position and size the dashboard to remain visible but not obscure price action.
Enable regime filtering (strongly recommended) to prevent trading during choppy/ranging conditions where geometric edge deteriorates. This single setting can dramatically improve overall performance by eliminating low-probability environments.
Reading Dashboard Metrics for Trade Readiness
Before considering any trade, verify the dashboard shows favorable conditions:
Hurst (H) Check:
The Hurst Exponent reading is your first filter. Only consider trades when H > 0.50 . Ideal conditions show H > 0.60 with "TREND" label—this indicates persistent directional price movement where manifold catastrophes produce significant reversals. When H < 0.45 (REVERT label), the market is mean-reverting and catastrophes represent minor oscillations rather than substantial pivots. Do not trade in mean-reverting regimes unless you're explicitly using range-bound strategies (which this indicator is not optimized for). When H ≈ 0.50 (RANDOM label), edge is neutral—acceptable but not ideal.
Catastrophe (Σ) Monitoring:
Watch the Σ percentage build over time. Readings consistently below 50% indicate stable topology with no imminent reversals. When Σ rises above 60-65%, manifold distortion is approaching critical levels. Signals only fire when Σ exceeds the configured threshold (default 65%), so this metric pre-warns you of potential upcoming catastrophes. High-conviction setups show Σ > 75%.
Regime (R) Validation:
The regime classification must read TREND, VOLATILE, or EXPLOSIVE—never trade when it reads CHOP or NEUTRAL. The checkmark (✓) must be present in the regime cell for trading conditions to be valid. If you see an X (✗), skip all signals until regime improves. This filter alone eliminates most losing trades by avoiding geometrically unfavorable environments.
Combined High-Conviction Profile:
The strongest trading opportunities show simultaneously:
H > 0.60 (strong trending regime)
Σ > 75% (extreme topology distortion)
R = EXPLOSIVE or TREND with ✓
κ (Curvature) > 1.5 (sharp manifold fold)
⟳ (Complexity) > 4 (chaotic geometry)
V (Volatility) showing elevated ATR expansion
When all metrics align in this configuration, the manifold is undergoing severe distortion in a favorable fractal regime—these represent maximum-conviction reversal opportunities.
Signal Interpretation and Entry Logic
Bullish Singularity (▲ Green Triangle Below Bar):
This marker appears when the system detects a manifold catastrophe at a price low with bullish directional consensus. All five confirmation filters have aligned: topology score exceeded threshold, pivot low structure formed, swing size was significant, volume/volatility confirmed participation, and regime was valid. The green color indicates the directional vote totaled +2 or higher (majority bullish).
Trading Approach: Consider long entry on the bar immediately following the signal (bar after the triangle). The singularity bar itself is where the geometric catastrophe occurred—entering after allows you to see if price confirms the reversal. Place stop loss below the singularity bar's low (with buffer of 0.5-1.0 ATR for volatility). Initial target can be the previous swing high, or use the probability cone projection as a guide (though not a guarantee). Monitor the dashboard STATE—if it flips to "◆ BEAR SINGULARITY" or Hurst drops significantly, consider exiting even if target not reached.
Bearish Singularity (▼ Red Triangle Above Bar):
This marker appears when the system detects a manifold catastrophe at a price high with bearish directional consensus. Same five-filter confirmation process as bullish signals. The red color indicates directional vote totaled -2 or lower (majority bearish).
Trading Approach: Consider short entry on the bar following the signal. Place stop loss above the singularity bar's high (with buffer). Target previous swing low or use cone projection as reference. Exit if opposite signal fires or Hurst deteriorates.
Neutral Signal (● Orange Circle at Price Level):
This marker indicates the catastrophe detection system identified a topology break that passed catastrophe threshold and regime filters, but the directional voting system produced a mixed result (vote between -1 and +1). This means the four directional components (pivot, trend, flow, mid-band) are not in agreement about which way the reversal should resolve.
Trading Approach: Skip these signals. Neutral markers are displayed for analytical completeness but should not be traded. They represent geometric catastrophes without clear directional resolution—essentially, the manifold is breaking but the direction of the break is ambiguous. Trading neutral signals dramatically increases false signal rate. Only trade green (bullish) or red (bearish) singularities.
Visual Confirmation Using Spectral Layers
The three colored ribbons (spectral decomposition layers) provide entropy visualization that helps confirm signal quality:
Divergent Layers (High Entropy State):
When the three frequency bands (fast 8-period, medium 21-period, slow 55-period) are separated with significant gaps between them, the manifold is in high entropy state—different frequency components of price movement are pulling in different directions. This geometric tension precedes catastrophes. Strong signals often occur when layers are divergent before the signal, then begin reconverging immediately after.
Convergent Layers (Low Entropy State):
When all three ribbons are tightly clustered or overlapping, the manifold is in equilibrium—all frequency components agree. This stable geometry makes catastrophe detection more reliable because topology breaks clearly stand out against the baseline stability. If you see layers converge, then a singularity fires, then layers diverge, this pattern suggests a genuine regime transition.
Signal Quality Assessment:
High-quality singularity signals should show:
Divergent layers (high entropy) in the 5-10 bars before signal
Singularity bar occurs when price has extended outside at least one of the spectral bands (shows pivot extended beyond equilibrium)
Close of singularity bar re-enters the spectral band zone (shows mean reversion starting)
Layers begin reconverging in 3-5 bars after signal (shows new equilibrium forming)
This pattern visually confirms the geometric narrative: manifold became unstable (divergence), reached critical distortion (extended outside equilibrium), broke catastrophically (singularity), and is now stabilizing in new direction (reconvergence).
Using Energy Fields for Trade Management
The concentric glowing boxes around each singularity visualize the topology distortion
magnitude:
Wide Energy Fields (5+ Layers Visible):
Large radiance indicates strong catastrophe with high manifold curvature. These represent significant topology breaks and typically precede larger price moves. Wide fields justify wider profit targets and longer hold times. The outer edge of the largest box can serve as a dynamic support/resistance zone—price often respects these geometric boundaries.
Narrow Energy Fields (2-3 Layers):
Smaller radiance indicates moderate catastrophe. While still valid signals (all filters passed), expect smaller follow-through. Use tighter profit targets and be prepared for quicker exit if momentum doesn't develop. These are valid but lower-conviction trades.
Field Interaction Zones:
When energy fields from consecutive signals overlap or touch, this indicates a prolonged topology distortion region—often corresponds to consolidation zones or complex reversal patterns (head-and-shoulders, double tops/bottoms). Be more cautious in these areas as the manifold is undergoing extended restructuring rather than a clean catastrophe.
Probability Cone Projections
The dashed cone extending forward from each singularity is a mathematical projection, not a
price target:
Cone Direction:
The center line direction (upward for bullish, downward for bearish, flat for neutral) shows the expected trajectory based on current manifold gradient and singularity direction. This is where the topology suggests price "should" go if the catastrophe completes normally.
Cone Width:
The uncertainty band (upper and lower dashed boundaries) represents the range of outcomes given current volatility (ATR-based). Wider cones indicate higher uncertainty—expect more price volatility even if direction is correct. Narrower cones suggest more constrained movement.
Price-Cone Interaction:
Price following near the center line = catastrophe resolving as expected, geometric projection accurate
Price breaking above upper cone = stronger-than-expected reversal, consider holding for larger targets
Price breaking below lower cone (for bullish signal) = catastrophe failing, manifold may be re-folding in opposite direction, consider exit
Price oscillating within cone = normal reversal process, hold position
The 10-bar projection length means cones show expected behavior over the next ~10 bars. Don't confuse this with longer-term price targets.
Gradient Flow Field Interpretation
The directional arrows (↗, ↘, →) scattered across the chart show the manifold's Y-gradient (vertical acceleration dimension):
Upward Arrows (↗):
Positive Y-gradient indicates the momentum acceleration dimension is pushing upward—the manifold topology has upward "slope" at this location. Clusters of upward arrows suggest bullish topological pressure building. These often appear before bullish singularities fire.
Downward Arrows (↘):
Negative Y-gradient indicates downward topological pressure. Clusters precede bearish singularities.
Horizontal Arrows (→):
Neutral gradient indicates balanced topology with no strong directional pressure.
Using Flow Field:
The arrows provide real-time topology state information even between singularity signals. If you're in a long position from a bullish singularity and begin seeing increasing downward arrows appearing, this suggests manifold gradient is shifting—consider tightening stops. Conversely, if arrows remain upward or neutral, topology supports continuation.
Don't confuse arrow direction with immediate price direction—arrows show geometric slope, not price prediction. They're confirmatory context, not entry signals themselves.
Parameter Optimization for Your Trading Style
For Scalping / Fast Trading (1m-15m charts):
Embedding Depth: 13-15 bars (faster topology reconstruction)
Hurst Window: 3 bars (responsive fractal detection)
Singularity Threshold: 2.0-2.3σ (more sensitive)
Topology Confirmation: 0.55-0.60 (lower barrier)
Min Swing Size: 0.8-1.2 ATR (accepts smaller moves)
Pivot Lookback: 3-4 bars (quick pivot detection)
This configuration increases signal frequency for active trading but requires diligent monitoring as false signal rate increases. Use tighter stops.
For Day Trading / Standard Approach (15m-4H charts):
Keep default settings (21 embed, 5 Hurst, 2.5σ, 0.65 confirmation, 1.5 ATR, 5 pivot)
These are balanced for quality over quantity
Best win rate and risk/reward ratio
Recommended for most traders
For Swing Trading / Position Trading (4H-Daily charts):
Embedding Depth: 34-55 bars (stable long-term topology)
Hurst Window: 8-10 bars (smooth fractal measurement)
Singularity Threshold: 3.0-3.5σ (only extreme catastrophes)
Topology Confirmation: 0.75-0.85 (high conviction only)
Min Swing Size: 2.5-4.0 ATR (major moves only)
Pivot Lookback: 8-13 bars (confirmed swings)
This configuration produces infrequent but highly reliable signals suitable for position sizing and longer hold times.
Volatility Adaptation:
In extremely volatile instruments (crypto, penny stocks), increase Min Volatility Expansion to 0.6-0.8 to avoid over-signaling during "always volatile" conditions. In stable instruments (major forex pairs, blue-chip stocks), decrease to 0.3 to allow signals during moderate volatility spikes.
Trend vs Range Preference:
If you prefer trading only strong trends, increase Min Trend Strength to 0.5-0.6 (ADX > 50-60). If you're comfortable with volatility-based trading in weaker trends, decrease to 0.2 (ADX > 20). The default 0.3 balances both approaches.
Complete Trading Workflow Example
Step 1 - Pre-Session Setup:
Load chart with MSE indicator. Check dashboard position is visible. Verify regime filter is enabled. Review recent signals to gauge current instrument behavior.
Step 2 - Market Assessment:
Observe dashboard Hurst reading. If H < 0.45 (mean-reverting), consider skipping this session or using other strategies. If H > 0.50, proceed. Check regime shows TREND, VOLATILE, or EXPLOSIVE with checkmark—if CHOP, wait for regime shift alert.
Step 3 - Signal Wait:
Monitor catastrophe score (Σ). Watch for it climbing above 60%. Observe spectral layers—look for divergence building. If you see curvature (κ) rising above 1.0 and complexity (⟳) increasing, catastrophe is building. Do not anticipate—wait for the actual signal marker.
Step 4 - Signal Recognition:
▲ Bullish or ▼ Bearish triangle appears at a bar. Dashboard STATE changes to "◆ BULL/BEAR SINGULARITY". Energy field appears around the signal bar. Check signal quality:
Was Σ > 70% at signal? (Higher quality)
Are energy fields wide? (Stronger catastrophe)
Did layers diverge before and reconverge after? (Clean break)
Is Hurst still > 0.55? (Good regime)
Step 5 - Entry Decision:
If signal is green/red (not orange neutral), all confirmations look strong, and no immediate contradicting factors appear, prepare entry on next bar open. Wait for confirmation bar to form—ideally it should close in the signal direction (bullish signal → bar closes higher, bearish signal → bar closes lower).
Step 6 - Position Entry:
Enter at open or shortly after open of bar following signal bar. Set stop loss: for bullish signals, place stop at singularity_bar_low - (0.75 × ATR); for bearish signals, place stop at singularity_bar_high + (0.75 × ATR). The buffer accommodates volatility while protecting against catastrophe failure.
Step 7 - Trade Management:
Monitor dashboard continuously:
If Hurst drops below 0.45, consider reducing position
If opposite singularity fires, exit immediately (manifold has re-folded)
If catastrophe score drops below 40% and stays there, topology has stabilized—consider partial profit taking
Watch gradient flow arrows—if they shift to opposite direction persistently, tighten stops
Step 8 - Profit Taking:
Use probability cone as a guide—if price reaches outer cone boundary, consider taking partial profits. If price follows center line cleanly, hold for larger target. Traditional technical targets work well: previous swing high/low, round numbers, Fibonacci extensions. Don't expect precision—manifold projections give direction and magnitude estimates, not exact prices.
Step 9 - Exit:
Exit on: (a) opposite signal appears, (b) dashboard shows regime became invalid (checkmark changes to X), (c) technical target reached, (d) Hurst deteriorates significantly, (e) stop loss hit, or (f) time-based exit if using session limits. Never hold through opposite singularity signals—the manifold has broken in the other direction and your trade thesis is invalidated.
Step 10 - Post-Trade Review:
After exit, review: Did the probability cone projection align with actual price movement? Were the energy fields proportional to move size? Did spectral layers show expected reconvergence? Use these observations to calibrate your interpretation of signal quality over time.
Best Performance Conditions
This topology-based approach performs optimally in specific market environments:
Favorable Conditions:
Well-Developed Swing Structure: Markets with clear rhythm of advances and declines where pivots form at regular intervals. The manifold reconstruction depends on swing formation, so instruments that trend in clear waves work best. Stocks, major forex pairs during active sessions, and established crypto assets typically exhibit this characteristic.
Sufficient Volatility for Topology Development: The embedding process requires meaningful price movement to construct multi-dimensional coordinates. Extremely quiet markets (tight consolidations, holiday trading, after-hours) lack the volatility needed for manifold differentiation. Look for ATR expansion above average—when volatility is present, geometry becomes meaningful.
Trending with Periodic Reversals: The ideal environment is not pure trend (which rarely reverses) nor pure range (which reverses constantly at small scale), but rather trending behavior punctuated by occasional significant counter-trend reversals. This creates the catastrophe conditions the system is designed to detect: manifold building directional momentum, then undergoing sharp topology break at extremes.
Liquid Instruments Where EMAs Reflect True Flow: The spectral layers and frequency decomposition require that moving averages genuinely represent market consensus. Thinly traded instruments with sporadic orders don't create smooth manifold topology. Prefer instruments with consistent volume where EMA calculations reflect actual capital flow rather than random tick sequences.
Challenging Conditions:
Extremely Choppy / Whipsaw Markets: When price oscillates rapidly with no directional persistence (Hurst < 0.40), the manifold undergoes constant micro-catastrophes that don't translate to tradable reversals. The regime filter helps avoid these, but awareness is important. If you see multiple neutral signals clustering with no follow-through, market is too chaotic for this approach.
Very Low Volatility Consolidation: Tight ranges with ATR below average cause the embedding coordinates to compress into a small region of phase space, reducing geometric differentiation. The manifold becomes nearly flat, and catastrophe detection loses sensitivity. The regime filter's volatility component addresses this, but manually avoiding dead markets improves results.
Gap-Heavy Instruments: Stocks that gap frequently (opening outside previous close) create discontinuities in the manifold trajectory. The embedding process assumes continuous evolution, so gaps introduce artifacts. Most gaps don't invalidate the approach, but instruments with daily gaps >2% regularly may show degraded performance. Consider using higher timeframes (4H, Daily) where gaps are less proportionally significant.
Parabolic Moves / Blowoff Tops: When price enters an exponential acceleration phase (vertical rally or crash), the manifold evolves too rapidly for the standard embedding window to track. Catastrophe detection may lag or produce false signals mid-move. These conditions are rare but identifiable by Hurst > 0.75 combined with ATR expansion >2.0× average. If detected, consider sitting out or using very tight stops as geometry is in extreme distortion.
The system adapts by reducing signal frequency in poor conditions—if you notice long periods with no signals, the topology likely lacks the geometric structure needed for reliable catastrophe detection. This is a feature, not a bug: it prevents forced trading during unfavorable environments.
Theoretical Justification for Approach
Why Manifold Embedding?
Traditional technical analysis treats price as a one-dimensional time series: current price is predicted from past prices in sequential order. This approach ignores the structure of price dynamics—the relationships between velocity, acceleration, and participation that govern how price actually evolves.
Dynamical systems theory (from physics and mathematics) provides an alternative framework: treat price as a state variable in a multi-dimensional phase space. In this view, each market condition corresponds to a point in N-dimensional space, and market evolution is a trajectory through this space. The geometry of this space (its topology) constrains what trajectories are possible.
Manifold embedding reconstructs this hidden geometric structure from observable price data. By creating coordinates from velocity, momentum acceleration, and volume-weighted returns, we map price evolution onto a 3D surface. This surface—the manifold—reveals geometric relationships that aren't visible in price charts alone.
The mathematical theorem underlying this approach (Takens' Embedding Theorem from dynamical systems theory) proves that for deterministic or weakly stochastic systems, a state space reconstruction from time-delayed observations of a single variable captures the essential dynamics of the full system. We apply this principle: even though we only observe price, the embedded coordinates (derivatives of price) reconstruct the underlying dynamical structure.
Why Catastrophe Theory?
Catastrophe theory, developed by mathematician René Thom (Fields Medal 1958), describes how continuous systems can undergo sudden discontinuous changes when control parameters reach critical values. A classic example: gradually increasing force on a beam causes smooth bending, then sudden catastrophic buckling. The beam's geometry reaches a critical curvature where topology must break.
Markets exhibit analogous behavior: gradual price changes build tension in the manifold topology until critical distortion is reached, then abrupt directional change occurs (reversal). Catastrophes aren't random—they're mathematically necessary when geometric constraints are violated.
The indicator detects these geometric precursors: high curvature (manifold bending sharply), high complexity (topology oscillating chaotically), high condition number (coordinate mapping becoming singular). These metrics quantify how close the manifold is to a catastrophic fold. When all simultaneously reach extreme values, topology break is imminent.
This provides a logical foundation for reversal detection that doesn't rely on pattern recognition or historical correlation. We're measuring geometric properties that mathematically must change when systems reach critical states. This is why the approach works across different instruments and timeframes—the underlying geometry is universal.
Why Hurst Exponent?
Markets exhibit fractal behavior: patterns at different time scales show statistical self-similarity. The Hurst exponent quantifies this fractal structure by measuring long-range dependence in returns.
Critically for trading, Hurst determines whether recent price movement predicts future direction (H > 0.5) or predicts the opposite (H < 0.5). This is regime detection: trending vs mean-reverting behavior.
The same manifold catastrophe has different trading implications depending on regime. In trending regime (high Hurst), catastrophes represent significant reversal opportunities because the manifold has been building directional momentum that suddenly breaks. In mean-reverting regime (low Hurst), catastrophes represent minor oscillations because the manifold constantly folds at small scales.
By weighting catastrophe signals based on Hurst, the system adapts detection sensitivity to the current fractal regime. This is a form of meta-analysis: not just detecting geometric breaks, but evaluating whether those breaks are meaningful in the current fractal context.
Why Multi-Layer Confirmation?
Geometric anomalies occur frequently in noisy market data. Not every high-curvature point represents a tradable reversal—many are artifacts of microstructure noise, order flow imbalances, or low-liquidity ticks.
The five-filter confirmation system (catastrophe threshold, pivot structure, swing size, volume, regime) addresses this by requiring geometric anomalies to align with observable market evidence. This conjunction-based logic implements the principle: extraordinary claims require extraordinary evidence .
A manifold catastrophe (extraordinary geometric event) alone is not sufficient. We additionally require: price formed a pivot (visible structure), swing was significant (adequate magnitude), volume confirmed participation (capital backed the move), and regime was favorable (trending or volatile, not chopping). Only when all five dimensions agree do we have sufficient evidence that the geometric anomaly represents a genuine reversal opportunity rather than noise.
This multi-dimensional approach is analogous to medical diagnosis: no single test is conclusive, but when multiple independent tests all suggest the same condition, confidence increases dramatically. Each filter removes a different category of false signals, and their combination creates a robust detection system.
The result is a signal set with dramatically improved reliability compared to any single metric alone. This is the power of ensemble methods applied to geometric analysis.
Important Disclaimers
This indicator applies mathematical topology and catastrophe theory to multi-dimensional price space reconstruction. It identifies geometric conditions where manifold curvature, topological complexity, and coordinate singularities suggest potential reversal zones based on phase space analysis. It should not be used as a standalone trading system.
The embedding coordinates, catastrophe scores, and Hurst calculations are deterministic mathematical formulas applied to historical price data. These measurements describe current and recent geometric relationships in the reconstructed manifold but do not predict future price movements. Past geometric patterns and singularity markers do not guarantee future market behavior will follow similar topology evolution.
The manifold reconstruction assumes certain mathematical properties (sufficient embedding dimension, quasi-stationarity, continuous dynamics) that may not hold in all market conditions. Gaps, flash crashes, circuit breakers, news events, and other discontinuities can violate these assumptions. The system attempts to filter problematic conditions through regime classification, but cannot eliminate all edge cases.
The spectral decomposition, energy fields, and probability cones are visualization aids that represent mathematical constructs, not price predictions. The probability cone projects current gradient forward assuming topology continues current trajectory—this is a mathematical "if-then" statement, not a forecast. Market topology can and does change unexpectedly.
All trading involves substantial risk. The singularity markers represent analytical conditions where geometric mathematics align with threshold criteria, not certainty of directional change. Use appropriate risk management for every trade: position sizing based on account risk tolerance (typically 1-2% maximum risk per trade), stop losses placed beyond recent structure plus volatility buffer, and never risk capital needed for living expenses.
The confirmation filters (pivot, swing size, volume, regime) are designed to reduce false signals but cannot eliminate them entirely. Markets can produce geometric anomalies that pass all filters yet fail to develop into sustained reversals. This is inherent to probabilistic systems operating on noisy real-world data.
No indicator can guarantee profitable trades or eliminate losses. The catastrophe detection provides an analytical framework for identifying potential reversal conditions, but actual trading outcomes depend on numerous factors including execution, slippage, spreads, position sizing, risk management, psychological discipline, and market conditions that may change after signal generation.
Use this tool as one component of a comprehensive trading plan that includes multiple forms of analysis, proper risk management, emotional discipline, and realistic expectations about win rates and drawdowns. Combine catastrophe signals with additional confirmation methods such as support/resistance analysis, volume patterns, multi-timeframe alignment, and broader market context.
The spacing filter, cooldown mechanism, and regime validation are designed to reduce noise and over-signaling, but market conditions can change rapidly and render any analytical signal invalid. Always use stop losses and never risk capital you cannot afford to lose. Past performance of detection accuracy does not guarantee future results.
Technical Implementation Notes
All calculations execute on closed bars only—signals and metric values do not repaint after bar close. The indicator does not use any lookahead bias in its calculations. However, the pivot detection mechanism (ta.pivothigh and ta.pivotlow) inherently identifies pivots with a lag equal to the lookback parameter, meaning the actual pivot occurred at bar but is recognized at bar . This is standard behavior for pivot functions and is not repainting—once recognized, the pivot bar never changes.
The normalization system (z-score transformation over rolling windows) requires approximately 30-50 bars of historical data to establish stable statistics. Values in the first 30-50 bars after adding the indicator may show instability as the rolling means and standard deviations converge. Allow adequate warmup period before relying on signals.
The spectral layer arrays, energy field boxes, gradient flow labels, and node geometry lines are subject to TradingView drawing object limits (500 lines, 500 boxes, 500 labels per indicator as specified in settings). The system implements automatic cleanup by deleting oldest objects when limits approach, but on very long charts with many signals, some historical visual elements may be removed to stay within limits. This does not affect signal generation or dashboard metrics—only historical visual artifacts.
Dashboard and visual rendering update only on the last bar to minimize computational overhead. The catastrophe detection logic executes on every bar, but table cells and drawing objects refresh conditionally to optimize performance. If experiencing chart lag, reduce visual complexity: disable spectral layers, energy fields, or flow field to improve rendering speed. Core signal detection continues to function with all visual elements disabled.
The Hurst calculation uses logarithmic returns rather than raw price to ensure stationarity, and implements clipping to range to handle edge cases where R/S analysis produces invalid values (which can occur during extended periods of identical prices or numerical overflow). The 5-period EMA smoothing reduces noise while maintaining responsiveness to regime transitions.
The condition number calculation adds epsilon (1e-10) to denominators to prevent division by zero when Jacobian determinant approaches zero—which is precisely the singularity condition we're detecting. This numerical stability measure ensures the indicator doesn't crash when detecting the very phenomena it's designed to identify.
The indicator has been tested across multiple timeframes (5-minute through daily) and multiple asset classes (forex majors, stock indices, individual equities, cryptocurrencies, commodities, futures). It functions identically across all instruments due to the adaptive normalization approach and percentage-based metrics. No instrument-specific code or parameter sets are required.
The color scheme system implements seven preset themes plus custom mode. Color assignments are applied globally and affect all visual elements simultaneously. The opacity calculation system multiplies component-specific transparency with master opacity to create hierarchical control—adjusting master opacity affects all visuals proportionally while maintaining their relative transparency relationships.
All alert conditions trigger only on bar close to prevent false alerts from intrabar fluctuations. The regime transition alerts (VALID/INVALID) are particularly useful for knowing when trading edge appears or disappears, allowing traders to adjust activity levels accordingly.
— Dskyz, Trade with insight. Trade with anticipation.

Money Volume • Buyers vs Sellers — @tgambinoxThis indicator estimates the total amount of money traded (Volume × Price)
and splits it between buyers and sellers based on each candle’s behavior.
It displays green bars for buyers and orange bars for sellers, allowing you to see
which side of the market is concentrating the capital.
Useful for detecting flow imbalances, buying/selling pressure,
and confirming price moves alongside total monetary volume (blue line).

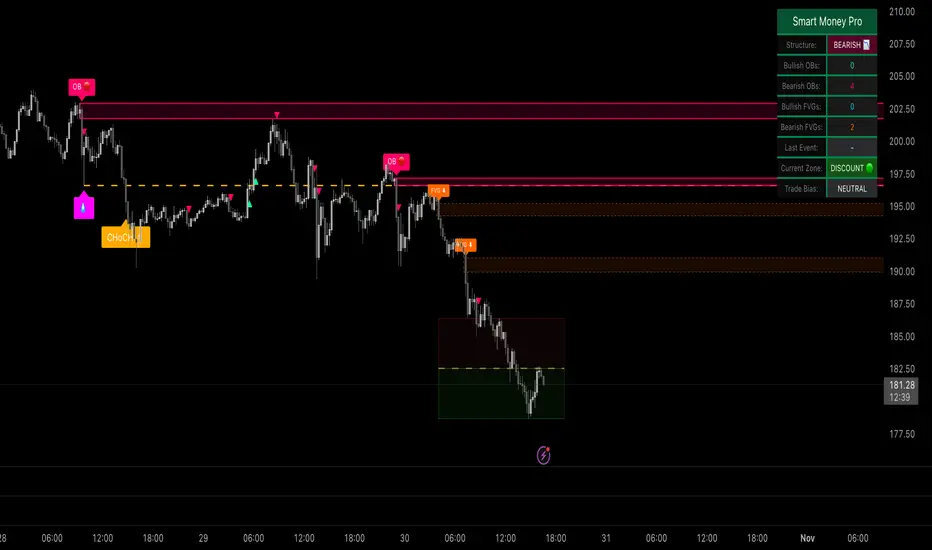
Smart Money Concepts ProSmart Money Concepts Pro
A professional-grade framework for visualizing institutional price behavior through key Smart Money Concepts. It automatically maps structure shifts, imbalances, and liquidity events so traders can study how price develops around supply and demand.
Core Components
Market Structure (BOS / CHoCH) — Detects continuation and reversal breaks using pivot-based logic with a close-beyond threshold and configurable cooldown.
Order Blocks — Highlights institutional footprints validated by volume and distance filters; zones extend until mitigation.
Fair Value Gaps — Marks three-bar inefficiencies that meet a minimum gap size and optionally auto-remove once filled by a user-defined percentage.
Liquidity Sweeps — Identifies stop-hunt wicks exceeding a configurable extension beyond recent highs or lows.
Premium / Discount Zones — Defines equilibrium and price positioning within recent swing ranges.
Confluence Entries (optional) — Generates neutral BUY / SELL markers only when structure, zone, and directional context align.
Dashboard — Summarizes current structure bias, recent events, zone counts, and directional alignment in real time.
Why it’s distinct
All detections are governed by explicit thresholds—volume multipliers, minimum distances, and fill-percent logic—so each signal results from quantifiable structure rather than heuristic pattern matching. Automatic cleanup ensures charts remain clear as zones are mitigated or gaps filled.
Best use
Applicable across Forex, indices, crypto, and equities. Designed for study on 15 m – 1 D timeframes.
For optimal alignment, pin plots to the Right Scale after adding the script.
Access
This indicator is public invite-only. Click Request Access on this page to apply. Access requests are manually reviewed.
Disclaimer: This script is provided for educational and analytical purposes only. It does not constitute financial or investment advice.
Support & Resistance Zones + FVG**Overview:**
This tool automatically identifies **key support and resistance levels** and highlights **Fair Value Gaps (FVGs)** on the chart. It helps traders of all levels **visualize important price areas**, spot potential market reactions, and make better-informed trading decisions.
Support and resistance zones are areas where price tends to **reverse, stall, or accelerate**, making them essential for entries, exits, and stop-loss placement. Fair Value Gaps represent rapid price movements that leave temporary imbalances, which often act as **future targets or reversal points**. Together, these features provide a **comprehensive view of market structure**.
---
## Features:
1. **Automatic Support & Resistance Detection:**
* Detects zones based on recent price action patterns:
* **Bull-to-Bear transitions** → resistance zones
* **Bear-to-Bull transitions** → support zones
* Dynamically calculates **zone heights** based on recent candle ranges, adapting to market volatility.
2. **Broken Zones & Proximity Alerts:**
* Highlights zones that have been broken, helping traders **focus on relevant levels**.
* Optional proximity alerts indicate broken zones that are **near the current price**, showing potential retests.
3. **Fair Value Gaps (FVGs):**
* Detects bullish and bearish gaps automatically.
* Options to **ignore narrow gaps** and **remove fully crossed FVGs**.
* Acts as a guide for potential **price targets or reversal areas**.
4. **Clean Chart & Customization:**
* Hides overlapping or invalid zones to reduce clutter.
* Fully adjustable inputs, including:
* Zone length
* Lookback range
* Zone height multiplier
* FVG extension
* Display and opacity settings
5. **Timeframe-Independent:**
* Works on **any chart interval**, from scalping to long-term swing charts.
---
## How It Helps Traders:
* **Identify Key Levels Automatically:**
Visualizes areas where the price has historically reacted. These zones act as **natural barriers** guiding entries and exits.
* **Spot Broken Zones:**
Broken zones may lose significance but could act as **future retest points**, helping assess trend continuation or reversal.
* **Visualize Price Gaps (FVGs):**
Gaps left by rapid price movement often act as **price magnets**, providing potential targets or reversal points.
* **Reduce Noise:**
Automatically hides overlapping or invalid zones for a **cleaner, easier-to-read chart**, highlighting only the most significant levels.
* **Adaptable to Any Trading Style:**
Useful for **swing trading, intraday trading, or scalping**, showing where buyers and sellers are most active.
---
## Practical Usage Guide:
1. **Enable Support & Resistance Zones:**
* Visualize critical price levels.
* Adjust **zone length, lookback range, and height multiplier** to fit your trading style and volatility.
2. **Enable FVGs:**
* Highlights gaps created by rapid price movements.
* Customize **minimum gap size, extension, and filtering options** to reduce chart noise.
3. **Observe Price Reactions:**
* **Bounce at support:** Potential buy opportunity.
* **Reversal at resistance:** Potential sell/short opportunity.
* **Breakout:** Watch for price breaking a zone for trend continuation trades.
4. **Risk Management:**
* Place stop-loss orders just outside zones to protect trades.
* Use broken zones as **profit targets** or areas to tighten stops.
5. **Trend Analysis:**
* Understand where buyers and sellers are concentrated.
* Identify strong trends by observing multiple zones being respected or broken.
6. **Multi-Timeframe Application:**
* Apply on different timeframes to **align short-term entries with longer-term structure**, improving trade probability.
---
## Key Inputs & Customizations:
* **Support & Resistance Zones:**
* Show/Hide Zones
* Zone Length Extend (bars)
* Loopback Range (bars)
* Zone Height Multiplier
* Hide Overlapped Zones
* Hide Broken Zones
* Ignore Last N Candles for Break Check
* Show Proximity Broken Zones
* Proximity Range for Broken Zones
* **Fair Value Gaps (FVGs):**
* Show/Hide FVGs
* Extend FVGs (bars)
* Minimum FVG Size
* Ignore Narrow FVGs
* Ignore Fully Crossed FVGs
* Up and Down Colors with Opacity
---
**Summary:**
This indicator saves **time, improves chart clarity, and highlights key market levels**. It is suitable for beginners who want to **understand market structure visually**, as well as experienced traders seeking **precise entry, exit, and target zones**. By combining support/resistance detection with Fair Value Gaps, it provides a **complete visual guide to price behavior**, helping traders make **more confident and informed decisions**.

Nancy's All-In-One [Private] [Institutional]A Private Institutional Tool by Design
PRIVATE ACCESS ONLY
This script is not for public usage or those casually scrolling through the indicator library. This is a private tool, built for precision, and extremely powerful in the wrong hands. Used properly, it can unlock financial freedom yes, it’s that potent.
“This is the closest you’ll get to peeking behind the curtain of institutional strategy without having a Bloomberg terminal or a Wall Street badge.”
– KC Research
What It Does
The Nancy All-In-One is the culmination of thousands of hours of backtesting, real-world application, and tactical insights drawn from elite strategies used at places like Renaissance Technologies, proprietary desks, and private equity firms.
This version fuses:
DTT Root Candles & Time-Zone Price Levels (including NY Judas, Kyoto, Osaka, etc.)
Intraday Sessions & Micro Box Models (Turncoat, Bishop, Knight, Big Ben, etc.)
Quarterly Micro Cycles — breaks down time into high-probability 90-minute blocks
Fib-Based Inner Intervals — ideal for sniper-level scalps or early entries
SMT Divergences, PD High/Low, NWOG/NDOG/EHPDA setups
Multi-Timeframe Visualization (with user control over display resolution)
Every line, label, and box drawn has a purpose, engineered to expose fractal imbalances, liquidity traps, and premium/discount zones with surgical accuracy.
How to Use It
Use the 1M or 5M chart — This script was optimized with lower-timeframe precision in mind. It works higher up, but that’s not its primary edge.
Turn on sessions you want under Turn Modules On group. Each session represents a model with its own behavior (e.g. Osaka Model = Asia liquidity expansion).
Price Lines — The "DTT Root Candles" levels are critical. These are not random timestamps—they represent algorithmic triggers derived from real volume and timing analysis.
Quarterly Cycles — Use these to trade from zone-to-zone with context. Each 90-minute block often contains a reversal, breakout, or liquidity sweep.
SMT, PDHL, NWOG, NDOG — These are best used with confluence. The more boxes and lines that agree, the higher your confidence.
Built for Traders Who Know the Game
This is not a magic button. It’s a complex system that assumes you're willing to study it, adapt it, and integrate it into your own strategy. It’s a tool—not a signal generator. It won't tell you when to buy or sell, but it will show you exactly where institutions are hunting.
Settings & Customization
You can toggle each element on/off to declutter your chart.
Change label sizes, opacity, and styles to suit your preferences.
Adjust session times if you're not in EST (UTC-5 default).
Works Best With:
1M to 15M charts (although elements scale up)
Liquid FX pairs, indices (SPX, NAS100), BTC, and ETH
Time-sensitive entries (news, killzones, session opens)
Final Note
This was developed internally by Nancy and private anon entities, and is still being actively expanded. Portions of the code are open-source, but most logic is proprietary and reverse-engineering resistant.
If you don’t know what NWOG, EQH/PDH, or SMT are—this isn’t for you. If you do... welcome to the other side.

Price–Volume Anomaly DetectorDescription
This indicator identifies unusual relationships between price strength and trading volume. By analyzing expected intraday volume behavior and comparing it with current activity, it highlights potential exhaustion, absorption, or expansion events that may signal changing market dynamics.
How It Works
The script profiles average volume by time of day and compares current volume against this adaptive baseline. Combined with normalized price movement (ATR-based), it detects conditions where price and volume diverge:
Exhaustion: Strong price move on low volume (potential fade)
Absorption: Weak price move on high volume (potential reversal)
Expansion: Strong price move on high volume (momentum continuation)
Key Features
Adaptive time-based volume normalization
Configurable sensitivity thresholds
Optional visibility for each anomaly type
Adjustable label transparency and offset
Light Mode support: label text automatically adjusts for dark or light chart backgrounds
Lightweight overlay design
Inputs Overview
Volume Profile Resolution: Defines time bucket size for expected volume
[* ]Lookback Days: Controls how quickly the profile adapts
Price / Volume Thresholds: Tune anomaly sensitivity
Show Expansion / Exhaustion / Absorption: Toggle specific labels
Label Transparency & Offset: Adjust chart visibility
How to Use:
Apply the indicator to any chart or timeframe.
Observe where labels appear:
🔴 Exhaustion: strong price, weak volume
🔵 Absorption: weak price, strong volume
🟢 Expansion: strong price, strong volume
Use these as context clues, not trade signals — combine with broader volume or trend analysis.
How It Helps
Reveals hidden price–volume imbalances
Highlights areas where momentum may be fading or strengthening
Enhances understanding of market behavior beyond raw price action
⚠️Disclaimer:
This script is provided for educational and informational purposes only. It is not financial advice and should not be considered a recommendation to buy, sell, or hold any financial instrument. Trading involves significant risk of loss and is not suitable for every investor. Users should perform their own due diligence and consult with a licensed financial advisor before making any trading decisions. The author does not guarantee any profits or results from using this script, and assumes no liability for any losses incurred. Use this script at your own risk.

UTS CORE + BOS + CHOCH – RR/TP/SL 📊 Indicator Working Principle
### 🔹 1. BOS (Break of Structure)
* **Definition:** Occurs when the price breaks the previous swing high or swing low level.
* **Interpretation:**
* If the last high is broken upwards → **Bullish BOS** (confirmation of uptrend).
* If the last low is broken downwards → **Bearish BOS** (confirmation of downtrend).
---
### 🔹 2. CHOCH (Change of Character)
* **Definition:** Indicates a trend reversal.
* **Interpretation:**
* In an uptrend, if the last low is broken downwards → **CHOCH↓** (start of downtrend).
* In a downtrend, if the last high is broken upwards → **CHOCH↑** (start of uptrend).
* **Chart:** Blue “CHOCH↑” labels on the chart mark trend reversals.
---
### 🔹 3. FVG (Fair Value Gap)
* **Definition:** A price gap formed between 3 candles.
* **Logic:**
* If the low of one candle stays above the high of the candle two bars back, a gap is created.
* Price tends to return to these gaps to “fill” them.
* **Chart:** The indicator highlights these gaps automatically (green/purple lines).
---
### 🔹 4. Signal Generation (BUY / SELL)
* A valid BOS or CHOCH confirmation + presence of FVG → **signal is triggered.**
* **Rules:**
* Upward break → **BUY signal**
* Downward break → **SELL signal**
* **Chart:** Red “SELL” and green “BUY” labels represent these trade signals.
---
### 🔹 5. RR – TP/SL Management
* When a trade is opened, the indicator automatically calculates **Entry, Stop Loss (SL), and Take Profits (TP1, TP2, TP3).**
* **Risk/Reward ratios:**
* TP1 = 1R
* TP2 = 2R
* TP3 = 3R
* If TP1 is hit and “Breakeven” option is enabled → SL moves to entry (risk-free trade).
---
👉 In short: this indicator tracks **market structure (BOS/CHOCH)**, detects **imbalances (FVG)**, and combines them with **risk/reward management (TP/SL)** to give you a ready-made trade

Liquidity Swap Detector Ultimate - Cedric JeanjeanAdvanced Smart Money Concepts indicator designed to detect high-probability liquidity sweeps and institutional order flow reversals. This professional-grade tool combines multiple ICT (Inner Circle Trader) strategies to identify optimal entry points.
═══════════════════════════════════════════════════════
📊 KEY FEATURES:
✅ Smart Swing Detection
- Identifies confirmed swing highs and lows using adaptive lookback periods
- Eliminates false signals through double-confirmation logic
- Detects liquidity grabs at key market structure points
✅ Fair Value Gap (FVG) Analysis
- Multi-timeframe FVG detection for enhanced accuracy
- Filters imbalances by minimum size threshold
- Combines current timeframe and higher timeframe FVGs
✅ Advanced Volatility Filter
- ATR-based volatility analysis to avoid low-quality setups
- Adjustable volatility threshold (default 0.35%)
- Ensures entries during optimal market conditions
✅ Precision Signal Generation
- LONG signals: Confirmed swing lows + FVG + volatility confirmation
- SHORT signals: Confirmed swing highs + FVG + volatility confirmation
- Clear visual markers with price labels
✅ Comprehensive Alert System
- Three alert types: Simple, Detailed, JSON (for webhooks)
- Separate LONG/SHORT alert controls
- Compatible with MT5 integration via webhooks
- TradingView native alertcondition support
✅ Professional Dashboard
- Real-time ATR monitoring
- Volatility percentage display
- FVG status indicator
- Alert status tracker
═══════════════════════════════════════════════════════
⚙️ CUSTOMIZABLE PARAMETERS:
🔹 Lookback Swing (1-50): Defines swing detection sensitivity
🔹 ATR Multiplier: Controls wick filter strength
🔹 Volatility Filter: Minimum required market volatility (%)
🔹 FVG Filter: Minimum fair value gap size (%)
🔹 FVG Timeframe: Higher timeframe for multi-TF analysis
🔹 Visual Options: Toggle swing marks, FVG zones, labels
🔹 Alert Controls: Enable/disable LONG/SHORT notifications
═══════════════════════════════════════════════════════
📈 HOW IT WORKS:
1. The indicator scans for confirmed swing points using a robust double-confirmation algorithm
2. Simultaneously analyzes Fair Value Gaps on both current and higher timeframes
3. Validates market volatility to ensure sufficient price movement
4. Generates precise entry signals when all conditions align
5. Triggers customizable alerts for instant notification
═══════════════════════════════════════════════════════
🎯 BEST PRACTICES:
- Use on liquid markets (Forex majors, indices, crypto)
- Recommended timeframes: 15m, 1H, 4H
- Combine with support/resistance for confirmation
- Adjust lookback period based on market volatility
- Test alert settings before live trading
- Use JSON alerts for automated trading integration
═══════════════════════════════════════════════════════
⚡ ALERT CONFIGURATION:
1. Click the Alert icon (bell) in TradingView
2. Select "Liquidity Swap Detector Ultimate - TITAN v6"
3. Choose your preferred alert condition:
- LONG Signal: Only bullish setups
- SHORT Signal: Only bearish setups
- ANY Signal: All trading opportunities
4. Set expiration and notification preferences
5. For MT5 integration: Select "JSON" message type and configure webhook URL

RSI Breakout Zones█ OVERVIEW
“RSI Breakout Zones” is a technical analysis tool that identifies significant zones on the chart based on the Relative Strength Index (RSI). The indicator maps overbought (OB) and oversold (OS) zones using boxes, then extends them until the next zone of the same type is detected, highlighting breakout points to aid in trade entry decisions. These zones often serve as areas of consolidation, support, or resistance.
█ CONCEPTS
The indicator identifies overbought (above 70) and oversold (below 30) zones, drawing boxes that extend until the next zone of the same type (OB for OB, OS for OS) is detected. Breakout signals are generated when the price crosses the zone boundaries, indicating potential shifts in market momentum.
Why are RSI zones important? These zones represent areas of extreme market sentiment, often leading to corrections or reversals. Overbought zones suggest potential selling pressure, while oversold zones indicate buying opportunities. After a breakout, a zone may switch roles, e.g., from support to resistance or vice versa, making it a key element in price action analysis. Larger zones, formed during high volatility, may attract price for retests due to stronger imbalances in buyer/seller dynamics. Consolidation often occurs within these zones as the market seeks equilibrium before further moves. However, in strong trends, zones may be decisively broken without immediate pullbacks, and their significance depends on their position relative to key support and resistance levels.
█ FEATURES
- RSI Zone Detection: Calculates RSI with a customizable length (default 14) and identifies overbought/oversold zones based on user-defined levels (default 70/30), drawing boxes that dynamically adjust to price action within the zone.
- Customizable Boxes: Zones extend until the next zone of the same type is detected. The indicator draws zones with adjustable colors for overbought (red) and oversold (green) areas, with options for box and zone transparency.
- Breakout Signals: Generates upward (green triangle) and downward (red triangle) breakout signals when the price crosses the top or bottom of a zone. Signals appear below or above the bar, indicating potential trade entry points.
- Midline: Automatically draws a dashed line at the midpoint of each zone, helping traders assess price behavior within the zone and potential halfway retests.
- Box Management: Option to remove outdated boxes.
- Alerts: Built-in support for alerts on breakout signals, enabling traders to receive notifications for key zone crossings.
█ HOW TO USE
Add to Chart: Apply the indicator to your TradingView chart via the Pine Editor or Indicators menu.
Configure Settings:
- RSI Settings: Adjust RSI Length (default 14), Overbought Level (default 70), and Oversold Level (default 30) to tailor zone detection sensitivity—higher lengths smooth signals for longer-term analysis.
- Box Settings: Configure colors and transparency for overbought (red) and oversold (green) zones, including box transparency (default 90) and zone transparency (default 90).
- Signal Settings: Customize breakout signal colors (green for upward, red for downward) and enable/disable keeping boxes after RSI normalization.
Interpreting Signals:
- Upward Breakout Signal: A green triangle below the bar indicates a breakout, suggesting potential bullish momentum and trend continuation or reversal.
- Downward Breakout Signal: A red triangle above the bar indicates a breakout, suggesting potential bearish momentum.
- RSI Zones: If the price re-enters a zone after a breakout, it may signal a false breakout or consolidation; persistent zones can act as future support/resistance levels. Consolidation often occurs within these zones as the market seeks equilibrium.
- Use signals alongside other technical analysis tools for confirmation, such as moving averages (to confirm trend direction), Fibonacci levels (to identify key price zones), or volume indicators (to validate breakout strength). Analyze RSI zones on higher timeframes for stronger signals due to broader market context.
█ APPLICATIONS
- Momentum Trading: Use RSI zones as overbought/oversold filters. In an uptrend, look for buying opportunities on upward breakouts, and in a downtrend, on downward breakouts. Combining with MACD crossovers, Fibonacci levels, or pivot points enhances zone significance.
- Inter-Zone Trading: Utilize breakouts from one RSI zone and hold the position until reaching the next zone, which may act as a target level or reversal point.
█ NOTES
- Test the indicator across different timeframes and markets (stocks, forex, crypto) to optimize RSI length and levels for your trading style.
- For best results, use in trending markets where RSI extremes are more predictive; in ranging markets, additional filters are recommended to reduce false signals.
- Always combine with risk management; RSI zones alone do not guarantee reversals, and false breakouts may occur in low-liquidity environments.

Smart Money Concepts Pro – OB, FVG, Liquidity + Trade SetupsThis script is a complete Smart Money Concepts (SMC) toolkit designed for traders who want clean and actionable charts without clutter.
It combines the most important institutional concepts into one indicator:
Order Blocks (OB): auto-detection of bullish and bearish order blocks with mitigation tracking, merging and TTL (time-to-live).
Fair Value Gaps (FVG): automatic gap recognition with size filters, mitigation tracking and lifetime control.
Liquidity Pools (EQH/EQL): equal highs and equal lows marked with tolerance (ATR-based or fixed).
Break of Structure (BOS): up/down structure shifts plotted directly on the chart.
Multi-Timeframe (HTF): option to use higher timeframe data (e.g. H4, Daily) for stronger zones.
Trend Filter: show zones only in the direction of market structure.
Trade Setups: automatic signals for OB Retest + Trend setups, with entry, stop-loss and take-profit levels (custom R-R).
Flexible Zone Extension: choose between extending zones to the live bar or fixed box width for a cleaner look when scrolling.
Features
Fully customizable (pivot length, ATR filters, box width, TTL, zone colors)
Separate presets for Scalping, Intraday, Swing trading styles
Visual trade planning with entry/SL/TP lines and optional labels
Works across all markets (crypto, forex, indices, stocks)
How to use
Bias: identify overall direction (BOS + HTF zones).
Wait: for price to return to an unmitigated OB or FVG.
Entry: take the setup signal (OB retest + trend filter).
Risk: stop-loss at opposite OB boundary.
Target: TP based on chosen R-R multiple (default 2R).
⚡ Whether you scalp short-term moves or swing trade HTF zones, this indicator gives you a clear institutional edge in spotting supply/demand imbalances and high-probability setups.

Dinkan Price Action Pro | Pure Price Action Toolkit🔸 Overview
Dinkan Price Action Pro is a pure price-action research toolkit that automatically detects and visualizes Order Blocks (OB), Fair Value Gaps (FVG), merged-candle hidden structures, liquidity zones (including HTF bias liquidity), and trendline & chart-pattern liquidity.
This indicator helps traders align with the Higher Time Frame (HTF) bias — the direction of the dominant institutional wave — and uncover hidden candlestick structures that normal timeframe charts never show.
⚙️ Core Features
✅ Automatic Order Block detection (bullish & bearish)
✅ Fair Value Gaps with real-time fill tracking
✅ Merged-Candle Engine — reveals hidden structures between standard timeframes
✅ Liquidity Zones — equal highs/lows, trendline liquidity & HTF liquidity pools
✅ HTF Bias Engine — detect directional bias across multiple timeframes
✅ Auto Trendlines & Chart Pattern Liquidity
🔍 How It Works (Step by Step)
🕯️ A. Merged Candle Engine (Hidden Structure)
1️⃣ Choose how many candles to merge (e.g., 3–5).
2️⃣ The script groups candles backward from the current bar in continuous sets.
3️⃣ Each merged candle forms using:
• Open = first candle’s open • Close = last candle’s close
• High = highest high • Low = lowest low
4️⃣ These new candles expose “hidden” structures between fixed timeframes — revealing true base-impulse patterns missed by normal charts.
🟩 B. Order Block Detection
Detects consolidation (base) followed by strong impulse.
Marks demand (green) and supply (red) zones automatically.
Strength calculated using impulse range (and volume, if available).
Older, mitigated OBs can be hidden for clarity.
🟦 C. Fair Value Gaps (FVG)
Automatically detects imbalances between consecutive candles.
Unfilled FVGs are highlighted; once filled, zones fade or gray out.
Works dynamically across merged and standard candles.
🟧 D. Liquidity Zones
Finds equal highs/lows, wick clusters, and structural liquidity.
Trendline liquidity and chart-pattern liquidity detected in real time.
Projects HTF liquidity zones from higher charts down to current timeframe.
🔺 E. HTF Bias Engine
Analyzes higher and medium timeframes (HTF/MTF) using CISD-style confirmation.
Bias auto-adjusts or can be manually selected.
🧭 Purpose: Identify the dominant institutional flow and trade in its direction.
⏰ Timeframe Alignment
Recommended structure:
HTF: 4H or 1D
MTF: 1H or 30M
LTF: 15M or 5M
Users may let the script auto-adjust or manually configure each timeframe combination.
📘 Inputs & Settings
🔹 OB sensitivity (Low / Medium / High)
🔹 Volume weighting toggle
🔹 HTF & MTF selection (Auto / Manual)
🔹 Multi-symbol mode
🔹 Visual toggles (OB, FVG, trendlines, merged candles, bias labels)
🔹 Alert toggles (zone touch, bias flip, hidden structure detection)
📊 How to Use — Workflow Example
1️⃣ Load the indicator on your chart.
2️⃣ Check the HTF Bias direction — trade only in that direction.
3️⃣ Identify nearby Order Blocks or FVGs inside HTF liquidity areas.
4️⃣ Watch the Merged Candle View to confirm hidden structures (base + impulse).
5️⃣ Wait for LTF confirmation (e.g., small structure break, wick rejection).
6️⃣ Place stop beyond the opposite OB edge; target next liquidity cluster.
🎯 This workflow aligns your lower-timeframe trades with the dominant higher-timeframe flow.
🧱 Repainting & Stability
Completed OBs and FVGs remain static — they do not repaint.
Real-time zones during candle formation can update until candle closes (standard behavior).
Merged candles are recalculated each bar; once a group closes, it remains fixed historically.
⚠️ Limitations
This is not a buy/sell signal generator.
Volume-weighted features require volume data.
Use responsible risk management and independent confirmation methods.
🔒 Invite-Only / Locked Code
The script is published as invite-only to protect proprietary implementations of:
The merged-candle engine
Liquidity and bias-detection heuristics
Invite-only publishing complies with TradingView rules.
All logic, purpose, and usage are fully described here for transparency.
🧩 Originality & Usefulness
This script is an original integrated system, not a simple mashup.
Each module is interconnected to provide a unified analytical process:
The Merged Candle Engine creates hybrid bars that expose hidden base–impulse patterns.
These merged bars feed into the Order Block and Fair Value Gap logic, refining zone accuracy.
The Liquidity Detector references those zones and merged bars to locate valid structural pools.
Finally, the HTF Bias Engine confirms directional context across multiple pairs and timeframes.
Together, these elements form a dynamic framework that interprets institutional footprints and structure flow — something no single indicator can achieve individually.
The combination produces new analytical value: a precise, adaptive HTF bias alignment and structure-based liquidity map in one visual system.
📜 Disclaimer
This tool is for educational and analytical use only.
It does not constitute financial advice.
Trading involves risk — always perform independent analysis and practice sound risk management.
Past performance does not guarantee future results.
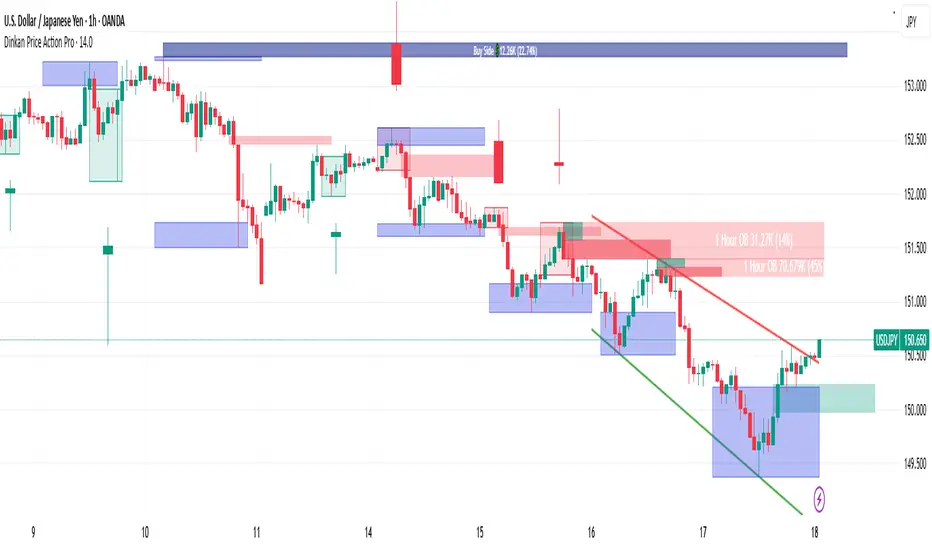
ORDER FLOW Professional & Delta LineThe ORDER FLOW Professional & Delta Line indicator provides a powerful visualization of buy and sell volume imbalances within each candle — offering traders a deeper view into market order flow dynamics.
Inspired by footprint charts, this tool estimates Up Volume, Down Volume, and their difference (Delta) to highlight whether buyers or sellers are in control. It’s designed for traders who want a clear and professional way to track volume-based momentum directly on their charts.
🔹 Key Features:
Accurate estimation of buy (Up) and sell (Down) volume per bar
Delta Line displaying the net order flow difference
Customizable delta color for personalized visualization
Optional numeric labels showing Up, Down, and Δ values
Footprint-style column display in a clean lower panel
Background color shading to reflect positive/negative delta
💡 Ideal For:
Professional traders and volume analysts seeking to confirm price action through order flow insights, detect absorption or exhaustion, and enhance decision-making with visual delta tracking.

Tick-Based Delta Volume BubblesTICK-BASED DELTA VOLUME BUBBLES
OVERVIEW
A real-time order flow indicator that displays volume delta at the tick level, helping traders identify buying and selling pressure as it develops during live market hours. Unlike traditional volume delta indicators that rely on bar close data, this indicator captures actual tick-by-tick volume changes and directional bias, providing granular insight into market dynamics.
HOW IT WORKS
The indicator monitors live tick data during real-time trading by tracking volume increases between consecutive price updates. Each time volume increments, the script calculates the volume delta, determines price direction, assigns directional bias to the volume, and accumulates net delta for each bar.
This methodology is identical to the tick detection mechanism used in professional cumulative volume delta tools, ensuring accuracy and reliability.
FEATURES
Real-Time Tick Detection
- Captures genuine tick-by-tick volume flow using varip persistence
- Not estimated from OHLC data
- Processes actual market ticks as they occur
Adaptive Bubble Sizing
- Bubbles scale based on delta strength relative to a customizable moving average (default 20 bars)
- Highlights significant order flow imbalances
- Five size levels from tiny to huge
Dual Display Modes
- Normal Mode: Sized bubbles with optional volume labels positioned at bar midpoint
- Minimal Mode: Clean dots above/below bars for unobtrusive delta visualization
Flow Classification
- Aggressive Buy (bright green): Strong positive delta with greater than 1.2x strength
- Aggressive Sell (bright red): Strong negative delta with greater than 1.2x strength
- Passive Buy (light green): Moderate positive delta
- Passive Sell (light red): Moderate negative delta
Intensity Mode (Optional)
- Gray: Low intensity (less than 0.5x average)
- Blue: Medium intensity (0.5-1.0x average)
- Orange: High intensity (1.0-2.0x average)
- Red: Extreme intensity (greater than 2.0x average)
Smart Filtering
- Percentile-based filters (customizable) ensure only significant delta events are displayed
- Reduces chart clutter while highlighting important order flow
- Separate thresholds for bubble display and numeric labels
Data Collection Status
- Optional progress box in top-right corner
- Shows real-time bar collection progress
- Displays percentage completion and bars remaining
- Automatically hides when sufficient data is collected
Hide Until Ready Option
- Suppresses bubble display until the averaging period is complete
- Prevents misleading signals from incomplete data
- Default requires 20 bars before displaying bubbles
SETTINGS
Delta Average Length (1-200, default 20)
- Lookback period for calculating delta strength baseline
- Higher values = longer-term delta comparison
- Lower values = more sensitive to recent changes
Hide Bubbles Until Enough Data
- Prevents display until averaging period completes
- Ensures reliable delta strength calculations
Show Data Collection Status Box
- Displays progress indicator during initialization
- Can be disabled if you understand the warmup period
Minimal Mode
- Switches to simple dot display above/below bars
- Green dots above bars = positive delta
- Red dots below bars = negative delta
- Maintains color intensity or flow type classification
Show Bubbles
- Master toggle for bubble display
Bubble Volume Percentile (0-100, default 60)
- Minimum percentile rank required to display bubble
- Higher values = fewer, more significant bubbles
- Lower values = more bubbles displayed
Show Numbers in Bubbles
- Toggle delta value labels
- Only appears in normal mode
- Disabled automatically in minimal mode
Label Volume Percentile (0-100, default 90)
- Higher threshold for displaying numeric labels
- Typically set higher than bubble percentile
- Reduces label clutter on chart
Intensity Mode
- Switch from flow-type coloring to magnitude-based coloring
- Useful for identifying volume spikes regardless of direction
IMPORTANT NOTES
Real-Time Only: This indicator processes live tick data and does not provide historical analysis. It begins collecting data when added to a live chart.
Volume Required: Symbol must have volume data available. Will not function on symbols without volume (most forex pairs from retail brokers).
Initialization Period: Requires the specified number of bars (default 20) to calculate accurate delta strength. Use the "Hide Until Ready" option to prevent premature signals.
Market Hours: Only collects data during live market hours. Does not backfill historical data.
CREDITS
Tick detection methodology inspired by the Kioseff Trading Tick CVD indicator. This implementation adapts the same core tick-level volume delta calculation for bubble-style visualization and per-bar delta analysis.

Volume Profile Two-Tone - Hit Counter - Meter V1 Volume Profile Two-Tone - Hit Counter - Meter V1
Overview
The Volume Profile Two-Tone - Hit Counter - Meter V1 is a Pine Script v6 indicator for TradingView, designed to visualize buy and sell activity distribution across price levels within a user-defined window or intraday session. It plots a dual-color horizontal histogram showing buying (green) and selling (red) volume intensity, along with optional hit-count numbers and meter overlays. The profile dynamically updates as new bars form, providing an intuitive picture of where market participants are most active.
The enhanced V1 edition introduces persistent hit counts, real-time adaptive row rebuilding, and improved memory management for smoother performance in both rolling-window and session modes.
How It Works
The indicator divides the selected range into rows (price bins) and aggregates trade volume (or tick volume) per bar.
Each bin separately sums up bullish and bearish contributions based on candle direction and delta logic, then draws side-by-side histogram bars:
• Buy Volume (green): Total volume from bullish bars within the bin.
• Sell Volume (red): Total volume from bearish bars within the bin.
A rolling or session-based window determines how many recent bars are analyzed. Value Area (VA), Point of Control (POC), and total hits per bin are computed continuously. The display auto-adjusts as price moves, keeping the profile anchored to the latest visible bars.
Behind the scenes, optimized arrays manage active boxes, lines, and labels for each bin. Functions like ensure_rows() rebuild buffers only when necessary, guaranteeing efficiency without repainting past data. Persistent hit-tracking ensures each price level maintains its count even when temporarily hidden.
Key Features
• Dual-Tone Volume Histogram: Buy/sell split with distinct colors for immediate visual contrast.
• Rolling or Session Profiles: Choose between continuous rolling windows or intraday session resets.
• Persistent Hit Counts: Displays total touches per bin, remaining stored even when bins refresh.
• Adaptive Row Management: Automatic rebuilding when zooming, scrolling, or changing resolution.
• Value Area + POC Detection: Highlights the most active price levels and volume concentration zones.
• Meter Overlay Option: Adds gradient bars or directional meters for quick trend context.
• Performance Optimized: Uses lightweight arrays and cached line handles for minimal CPU load.
• Custom Color Control: Editable buy/sell colors, opacity, row count, and profile width.
• Full Persistence Mode: Profiles remain visually consistent across bar updates without redraw gaps.
What It Displays
The Volume Profile Two-Tone - Hit Counter - Meter V1 presents an adaptive horizontal histogram beside the chart’s candles, revealing how volume is distributed across price.
• Green segments show dominant buying interest; red segments reveal selling pressure.
• POC line identifies the highest-volume price.
• Hit-count numbers quantify how often price traded at each level.
• Optional meters display relative directional strength within the same range.
This visual layering helps traders quickly identify supply/demand zones, balance areas, and developing auction profiles across intraday or multi-session contexts.
Originality
The Pine Script v6 indicator uses efficient array management (array.new_*, array.set, array.get) and native math operations for rendering.
It avoids external dependencies, relying only on built-in TradingView functions like request.security, box.new, line.new, and label.new for dynamic plotting.
Common Ways People Use It
• Scalpers: Study short-term imbalances or high-activity levels to time entries/exits.
• Day Traders: Track evolving session volume and POC migration.
• Swing Analysts: Compare rolling distributions to identify value shifts over multiple days.
• Volume Profilers: Combine with VWAP or order-flow tools for deeper context.
Configuration Notes
Profile Mode: Select Rolling Window (bars) or Session (intraday).
Rows and Width: Default = 72 rows, 44 bars width.
Colors and Opacity: Adjust to match chart theme.
Performance Mode: Choose Accurate or Fast (approximate) for speed control.
Show Hits / Meter: Enable hit-count numbers and gradient meters for added context.
Legal Disclaimer
For informational and educational purposes only—not investment, financial, or trading advice. Past performance does not guarantee future results; trading involves significant risk. Provided “as is,” without warranties. Consult a qualified professional before making decisions. By using, you accept all risks and agree to this disclaimer.
