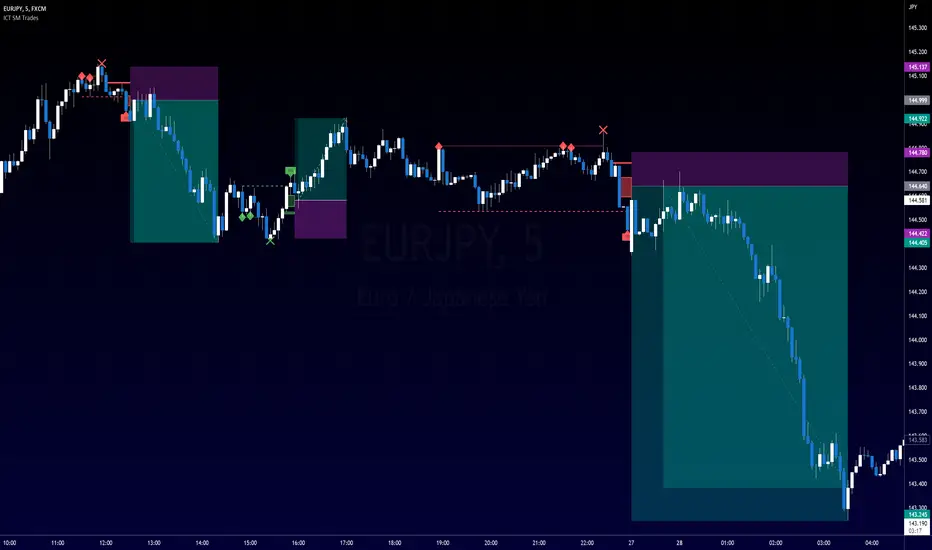
ICT SM Trades (liquidity find & grab, MSS, FVG, killzones)Indicator looks for ICT & Smart Money trades on any timeframe. These types of trades reveal how the big institutions, banks and hedge funds trade with big money. If they want their very big positions to be filled they need to find areas in chart where the majority of the money is sitting. Where is it? Where is the majority of orders placed? Right below supports or right above resistance, these orders are stoplosses or stop orders. So they need to push the price to these areas, take all the available stoplosses and trigger all the available stop orders in order to fill their positions and then push the price to the opposite side to make profit (and retail to lose).
Indicator looks for support or resistance (S/R) areas which are represented by dotted lines. This S/R areas are created by minimum of 2 pivot high/low (H/L). Every pivot H/L that creates the S/R area is marked with diamond label. This S/R area is called liquidity. After liquidity is created, indicator looks for liquidity grab (mostly represented by fast spike to this area - it is labeled with x-cross) and then price should go fast to the opposite side of the created structure. Indicator considers as a created structure everything that was created on the other side of the candles from the oldest pivot H/L which creates particular liquidity. For example, if liquidity is created with 3 pivot highs, indicator looks at the oldest pivot high and from there it is looking for the lowest low. Under this lowest low is dashed line which means that this level should be broken with closed candle. This action is called market structure shift (MSS), when the price shifted very fast from highs to lows. After MSS, when the price went fast to one direction, there were some imbalances in prices, in our example selling pressure was a lot bigger than buying pressure and there were created some long untested bearish candles. This untested areas in candles are called imbalances or gaps of fair value gaps (FVG). These are labeled with rectangles. It is expected that these gaps will be tested in near future to "balance the market".
We can put limit orders into these gaps and await some retracement after MSS to open our positions and after the positions are opened we can expect trend continuation in the direction where market structure shift was made (away from liquidity grab). So stoplosses can be placed above/below liquidity grab candle (marked with x-cross).
In settings of the indicator you can set whether only long or only short trades will be shown. Long trades are green and short trades are red. You can set if fair value gaps will be shown as well. The last thing in settings is session. You can set custom session which will be shown as background color on your chart.
In den Scripts nach "imbalance" suchen
Smart Money BusterAfter daytrading for a while i came into conclusion that price action trading is the most successful way to trade for me and this project was for me to simplify my way of trading at the beginning. Eventually it got big and turned into a very useful helper indicator for me to setup on different pairs for alerts and only look at the charts to decide for entry when the alerts come from 120 different pairs that i set it up. Since i always looked at indicators for a way to make my job simpler and give me more time to do more important things for me rather than drawing lines on different pairs eveyday i think it got to a point where it works to my liking and making me gain time, thus more money.
This indicator uses smart money concepts like Market Structure, Order Blocks, Quassimodo Levels, Structure Breaks, Pumps and Dumps, Imbalances(In the works will be added in first update) to help trader catch what the whales are thinking and how to enter in the right time for swing trading, catching bottoms and tops.
Here are some of the features as of release:
Detects Market Structure and draws zig-zag lines and keeps note of pivot points.
Detects Order blocks and draws boxes when the conditions met
Detects the quassimodo levels and changes the color of the box to signal double confluence meaning stronger signal
Draws structure break lines
Setting to set structure break percentage before drawing boxes to get the boxes drawn if you want to be more 'sure' about the Order Block Levels.
Setting to change depth and backstep values for zigzags to be able to let you fit the system for different time frames.
Setting to set MSB trigger point between High and Low, Close and Open or hl2 values.
Setting to set Signal Triggering Range between Start, Middle and End meaning eg. if you set it to Middle it will wait for MSB trigger point to hit the middle of the box before giving you a signal.
Setting for changing HH-LL pivot points lookback count, 5 as default. Increasing this value will make you compare your pivot points with more data, really useful in lower time frames where will be a lot of zig-zags and highs and lows giving you a method to avoid false signals. Recommended to keep it lower values on 30 min and higher and increase it in lower Timeframes according to market volatility.
Setting to add a Box limit where the box of order block will be set invalid after certain candles and it still didn't trigger. Default value of 0 means it's disabled.
Setting to set Candle volatility percentage value to avoid big candles getting opposite signals on fast pump or dump schemes and bust those market makers schemes. Gotta say this came out really handy in crypto markets :)
As an end you can set alerts for 'Buy' , ' Sell ', ' Buy and Sell' together or if you wish you can connect it to bots via webhook as an entry. Although haven't connected to any bots myself as i think the best method of trading is human and machine working together. Since we have the creativity and out of the box thinking and machines have the ability to brute force calculation and huge bandwith that we don't currently have. At least until Elon Musk turns is into a cyborg, which i am not very eager about.
Planned Features:
- Add ability to detect imbalances(fair value gaps) to add third confluence to detect dragon fruit entries. This will make the system work with triple confluence.
- Add more settings so humans can command the ai better.
- Maybe a strategy version after i write my own dynamic take profit algorithm to give system ability make quantitative decisions based on current position profit levels.
- Although i think i fixed almost all the important bugs if there ever comes up one bugs will take priority for updates.
- And some things i may decide to add later. I will keep working on this project since it works well for me.
And like always, happy trading.

Price Action All In One IndicatorIf you are the one who is "Price Action" style & does not want to use many indicators or complex indicators or you are an ICT (The Inner Circle Trader)
student or ICT charter, this simple beautiful All In One Indicator is right for you.
The indicator has the following functions.
TIME ZONE SETTING
The default timezone is New York Time GMT-4, if you leave the time zone setting blank, it will use the symbol timezone. Note that the trading time changes with one hour delay in winter. so if you just trade forex, and leave the time zone setting blank, TradingView will adjust the symbol timezone automatically for you or don't forget to change the timezone setting GMT-4 or GMT-5 depending on daylight saving time.
STATISTIC PANEL
You can choose which panel to show through settings.
Session Info Panel : pips info of ADR, Asian, London, and New York sessions.
Trend Panel : showing trend (up/down) of
5m/15m/1h/4h/D/W time frames (TF)
4MA (default values: SMA with lengths: 20–50–100–200)
Money Management Panel : in trading, money management is very important. Just put the % risk, & stop loss value below, the indicator will calculate a suitable size/amount for each trade.
Size by Lots: input stop loss in pips
Size by Units: input stop loss in % (of price)
(*)Units size is calculated by % stop loss & current bar close price. You have to determine a stop-loss price to convert to % stop loss by yourself.
TIME SEPARATORS
We can choose which time separators we want to display. The indicator has 5 options: Anchor Time/Day/Week/Month/Quarter. Of course, we can choose to show just one or all 5 of them.
With Anchor Time you can choose which time you want to draw a vertical line for better timing analysis. This can show up to 2 Anchor Time lines. The default values are 00:00 (New York Midnight Opening) and 08:30 (New York Session Opening). You also have an option to show the past lines or not.
About Day Separator, cause TradingView has supported Session Breaks in Setting but if you don't like to use it or when enabling, it distracts you, you can use mine. My favorite trading dates are Tuesday & Wednesday.
PRICE LEVELS
For intraday trading, the high/low/close of the previous day, the previous week, ADR (default period is 5) are very important key levels. You can choose which one you like to show for better analysis. Of course, you can change the color & style of the lines. This is also my favorite indicator.
This indicator also has an option to show up to 2 price lines at a specific time, you can choose the price type (high/low/close/open) that you want to display. The default time values are:
Specific Time 1: 0:00. (New York Midnight Opening Price)
Specific Time 2: 8:30 am. (New York Session Opening Price)
ACCUMULATION ZONE
The market tends to reprice the higher/lower to the old high/low or imbalance/fair value price to promote buy/sell stops or to provide smart money pricing for long/short entries. Typically, it redistributes quickly and you must learn to anticipate them at key levels intraday. Weak short/long holders will be squeezed in the retracement.
Except for the open price, the price changes continuously until the closing time, so the accumulation area can also be changed in real-time, but if you combine it with other information when analyzing, you can predict/determine whether the zone has been established or not with high probability. In short, price needs time to be accumulated, I usually don't pay attention to this daily zone till London open/close or New York sessions
Not only daily zone, but the indicator also supports higher timeframes accumulation zone from
SESSION & STD
There are 3 sessions: Asian, London, New York. The default values are below (New York Time).
Asian: 19:00 ~ 00:00
London Open (London KillZone): 01:00 ~ 05:00
New York Open (New York KillZone): 07:00 ~ 10:00
If you do not want to show the label, just leave the label values blank or change them to whatever you want.
This is one of my favorite functions. I use it on 15m, 30m, 1h TF for Forex intraday trading. My favorite trading sessions are London Open & New York Open.
You also can choose to show or not Standard Deviations (STD). The default values are set for Asian Range STD and max STD levels can be shown are 5. I use the following 3 types of STD (New York Time):
CBDR (Central Bank Deviations) STD: 14:00 ~ 20:00
Flout STD: 15:00 ~00:00
Asian Range STD: 19:00 ~ 00:00
LOOKBACK HIGH/LOW/MID
Can show high/low/mid of the data ranges on the daily/4h chart. The default values are:
- 20–40–60 days back from today for daily TF.
- 30–60–90 bars back from the latest bar for 4h TF.
The default anchor bar for calculating the lookback is the latest one but with:
- 4h TF: we can change the lookback from the 1st day of the week.
- Daily TF: we can change the lookback from the 1st day of the month.
The indicator also has options showing the high/low/mid (equilibrium level) lines for better analysis. Especially, on daily TF, we have the option that can show up to 4 lines (25% for each one) of the data range.
Of course, you can change the colors or the style of the high/low/mid lines.
The lookback can be shown on the lower TFs for better detection when the market structure is shifted.
MAGIC BARS
Fractal bar : The bar's color is changed when the divergence occurs between the price & RSI. You can change the RSI period (default value is 14) & RSI source. (open/high/low/close,…)
Imbalance bar or liquidity void or fair value gap - whatever you call it. This is my favorite indicator when trading on all TFs.You can choose to extend the last n imbalance bars if you like in the settings. I make sure I covered all cases of imbalance/fair value gap.
OLD HIGH/LOW
First, this function is not used as the common Support & Resistance that retail traders usually use, so I call it Old High/Low. I usually use it in 2 ways:
Detect the next buy/sell stops that Market Makers aim to manipulate.
Detect whether market structure shifted or not (Break of structure)
In settings you can:
Set the period to detect high/low levels, the default value is 10. My other favorite values are 6 & 2.
On a lower time frame, you might want to set it to a large number to remove noise.
On a higher time frame, a small number is enough, I think.
Choose the numbers of the last lines you want to show on your chart.
Of course, the style of lines can be changed easily.
TRENDLINES
A very simple trendline with default pivot left strength is 10.
By default, trendline uses high/low price but you have the "Using close price" option.
LINEAR REGRESSION CHANNEL
The Linear Regression Channel is a three-line technical indicator used to analyze the upper and lower limits of an existing trend. It is a statistical tool used to predict the future from past data and is used to determine trend direction or when prices may be overextended.
You can choose
To fill the background or not
To show inner/outer lines or not
To change the colors/line styles of upper zone, lower zone, upper lines, lower lines, midline
DIRECTION BOX
Working on all TFs, this looks like the same with lookback function but if you would like to display them in a box for easily focusing/comparing with other symbols or for detecting divergence in a specific period. The indicator also has a setting to show or hide lines connecting between lows or highs.
Another example of how I use High/Low connecting lines to detect divergence between S&P 500 and NASDAQ 100.
ZIG ZAG
Can show up to 2 ZigZag lines.
This is suitable for traders who have difficulty in detecting key levels (recent high/low) of the prices to confirm market structure or just for drawing Fibonacci easily at those levels.
MA (Moving Average)
I believe that this is one of the most used indicators for every trader. There are 5 types of MA to choose from: EMA, SMA, WMA, VWMA, SMMA(RMA).
This can show up to 4 MAs. You can choose the source (close/high/low,…) for each one. My favorite values are 34 & 89 EMA.
This indicator also supports MA Bands. You can select which MA you want to display the bands, and the "width" of the bands can be changed via the settings.
WATERMARK
It's just a simple function but I think it's very useful for those who want to add Copyright info to the chart, to prevent others from copying it.
Others/known issues/limitations
In forex or stock (things that are traded only on weekdays), TradingView's does not include the latest bars till Monday so the Day Separator cannot fill that space. Because TradingView deals with those bars as Sunday's ones so I set the color of Sunday the same as Friday for good UI/UX. On Crypto charts, the indicator shows without problems.
If you see "Internal server study error", please try closing the current TradingView tab in your browser and reopening it in a new tab. The error will disappear.
Because TradingView does not provide any detailed error information when such "general error" occurs. It's very difficult to detect which function is causing this error or is there something that caused TradingView "overloaded" through a long time running/loading on that tab? Honestly, I don't know exactly the cause, but in my experience, this error often occurs in the following cases:
When you have the TradingView Tab open for hours. In my case, I usually leave TradingView tab open overnight & when I come back the next day, this error might appear. (I'm a Mac user & I almost never shut down my Mac)
When you change settings too many times, especially settings of drawing objects like line width in a using session, it might cause this error.
So, after changing the setting or when you come back for the next trade, please save & close that TradingView tab, and then open a new one, everything will work fine.
You can see the images below that show I have tested my indicator from 1-minute time frame, enabled all functions, change every setting to max values & everything still works fine.

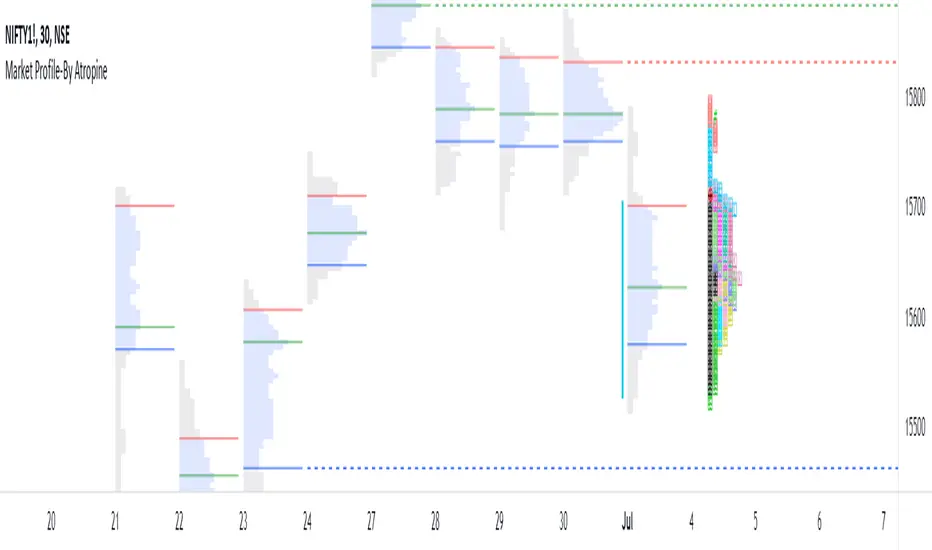
Market Profile-By AtropineWhat is Market profile ?
Market profile is a style of plotting "Price" on the Y-axis and "Time" on the X-axis, which most of the time form a bell-shaped image as the body of the profile.
It helps day traders identify Other Timeframe Participants (Big players) who have money and information power. short-term traders have to follow these big sharks which give direction to markets.
It provides an X-ray vision about the market as Value Area represents 70% of the day’s activity and this will give a clear picture of the current state of the market as it unfolds.
It works in all market conditions. Usually, a trading system or indicator works in certain market conditions like a trending or sideways market. There is no such restriction to Market Profile as it clearly shows the balanced and imbalanced market conditions in both directions all the time.
How does this Market Profile Indicator Works ?
Automatically plots TPO's for Each half an hour(30min) of the trading day, it is designated by a letter, which is also called Time Price Opportunity(TPO) for the current day. Indicator provides Option to Change TPO Text.
First 30 min range denoted with the letter ‘A,’ next 30 min range with the letter ‘B’ ,this two TPO are black colored which Indicates IB (Initial Balance) Range. IB Range is the first one-hour range in the market created by retail traders (most of the time).
Indicator plots TPO continue until the last range of the market, hence the last range is denoted with ‘M’ as the Indian markets currently trade from 9.15 am to 3.30 pm with the last session ‘M” is for only 15 minutes from 3.15 pm to 3.30 pm.
Letter ‘O’ indicates the open price level, which is red colored and Letter ‘#’ indicates the closing price level which is green in colored.
This Indicator gives you an Option to choose the color of each TPO's.
Two Methods of Market Profile one is ‘Split’ profile, and another is ‘Un-Split’ profile, Indicator gives Option to Split or Unsplit the last day profile.
This Indicator gives you an Options to extend Untested Lines(POC,VAH,VAL)The Price level in which maximum time was spent or maximum trading activity happened is called as Point of Control (POC).Value Area (VA) is the 70% price range around POC. It is the fair price of the Instrument on the particular day.
Retail traders can only provide market depth and liquidity, but they fail to give magnitude and direction to the price.
By the end of every trading day, the market profile chart shows not only what happened on that day, but also who is responsible and when it happened.
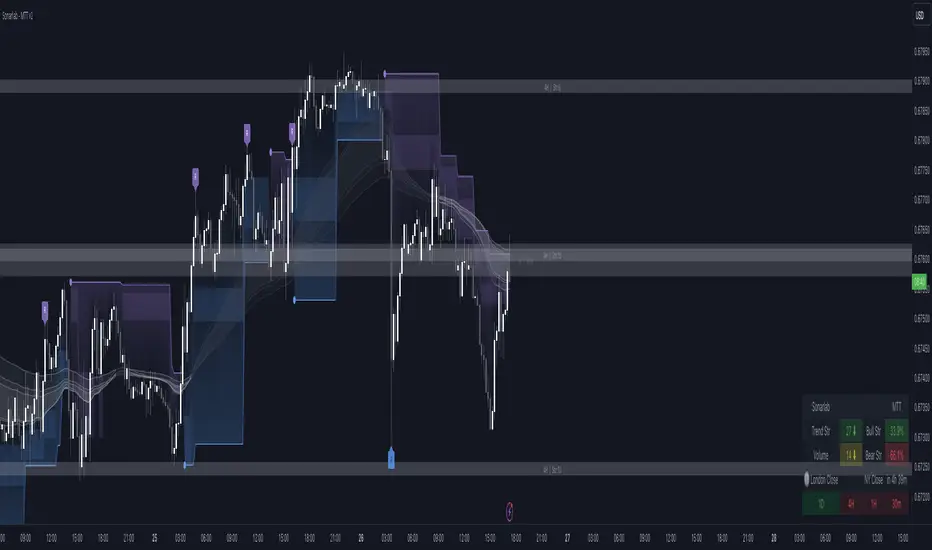
Multi Trend Tool - SonarlabVersion 1 (releasing new updates every 2 weeks
The Sonarlab Liquid Script included a lot of indicators at once, so you have all the tools you need in hand reach.
Features:
01_ Revision Band (Reversal Cloud)
The reversal cloud can be used for many options. These zones can be great areas to take profit or find early entries to use alongside the confirmation or contrarian signals.
02_Supply & Demand Levels / Imbalances (still need some improvement)
The driving force behind changes in price is supply and demand. When there are more buyers than sellers, the market price will move up. Conversely, when there are more sellers than buyers, the market price will move down. When buyers and sellers are more or less even, the market will range. Know where the world’s biggest buyers & sellers are entering and exiting their trades, so you can too.
03_Support and Resistance (Multi Timeframe)
04_Trading Dashboard
Get a quick overview of the current market situation.
- Multi Timeframe Trend Structures
- Volatility %
- Trend Strength %
- Directional Bias: Strong/ Weak/ Neutral
- Trading Sessions
05_Imbalances
See Imbalances within a wink of an eye. Draw them out and make better decisions using those zones (those zones needs to be filled.)
06_Filter options
Filter the signals with Moving averages or with a second trend structure
07_Trend Lines
08_Pivot Highs and Lows
09_Alerts
Even the option to automate the signals true 3Commas (Please wait for our Strategy version of this indicator before using this function).
10_Reduce Risk/ Exit Points
Grey circles on the chart
A lot of things can be changed and customize as you want. You can change/set:
- Colors of Body and Top/Bottom Wicks separately
- Moving Average Values
- Supply and demand values
- Trend Line values
- Colors of the shapes
Sonarlab can be adjusted To All Trading Styles to simply create your own, unique trading strategies around this Powerful Indicator.
Support
For questions, you can reach out on discord or send us a private message on Tradingview or discord group.
We kindly suggest you to test this indicator out on a demo account first.
DCT - Liquidity Heatmap - ProDCT - Liquidity Heatmap - Pro
Overview
This indicator maps liquidity concentration zones by analyzing volume distribution across price levels. It identifies areas where significant trading activity has accumulated, potentially indicating zones of interest for future price interaction.
Methodology
Volume Intensity Calculation
Each price level accumulates a normalized volume score calculated as:
- Volume Intensity = Current Bar Volume / SMA(Volume, lookback period)
- This normalization allows comparison across different volatility regimes and trading sessions
Level Construction
- Price levels are distributed symmetrically above and below current price using percentage-based spacing
- Each level maintains cumulative volume data, tracking both raw volume and normalized intensity
- Levels are visualized as zones with height proportional to the spacing parameter
Sweep Detection Logic
A level is marked as "swept" when price action crosses through it:
- Condition: Low ≤ Level Price AND High ≥ Level Price
- Swept levels stop accumulating new volume and can be styled differently (fade, hide, or preserve)
Color Intensity Grading
Zones are color-coded based on their normalized volume relative to the maximum observed:
- Purple: < 25% of max intensity
- Yellow: 25-50% of max intensity
- Orange: 50-75% of max intensity
- Red: > 75% of max intensity
Optional CVD (Cumulative Volume Delta) Mode
When enabled, directional volume is estimated using candle structure:
- Bullish candles: Buy pressure weighted by (Close - Open) / (High - Low)
- Bearish candles: Sell pressure weighted by (Open - Close) / (High - Low)
- Levels display green/red bias based on accumulated directional volume ratio
Adaptive System
The indicator includes a three-layer adaptive system:
1. Timeframe adaptation: Spacing, level count, and retention automatically adjust for M5 through Daily charts
2. Volatility adaptation: ATR-based adjustments widen spacing during high volatility and tighten during consolidation
3. Market type adaptation: Different imbalance thresholds for BTC/ETH, large altcoins, and small caps
Imbalance Detection
Buy/sell imbalance markers appear when the ratio of accumulated buy volume to sell volume exceeds a configurable threshold (default 1.5x for BTC/ETH, 2.0x for small caps).
What Makes This Implementation Unique
- Dollar-denominated liquidity display: Labels show estimated liquidity in USD (K/M/B format) rather than abstract values
- Three-layer adaptive logic: Combines timeframe, volatility (ATR), and asset-class adjustments simultaneously
- Memory-optimized architecture: Automatic cleanup of old swept levels prevents performance degradation on extended charts
- Forward projection: Active levels extend into future bars for cleaner visualization
- Granular visibility controls: Each intensity tier can be toggled independently
Settings Guide
- Dynamic: Enable adaptive adjustments (recommended)
- Spacing: Distance between levels as % of price
- Levels: Number of levels above/below price
- CVD: Enable directional volume analysis
- Forward: Project levels ahead by specified bars
Usage Notes
- Works on both Perpetual and Spot crypto markets
- Optimized for crypto assets; results may vary on other instruments
- Higher timeframes show broader liquidity structure; lower timeframes show granular detail
- Combine with your own analysis framework
Disclaimer
This indicator visualizes historical volume distribution and does not predict future price movement. Not financial advice. Use appropriate risk management.

Neosha Concept V4 (NY Time)
Imagine the financial market as a huge ocean. Millions of traders throw orders into it every second. But beneath all the noise, there is a powerful current that quietly controls where the waves move. That current is not a person, not a trader, and not random—it is an algorithm.
This algorithm is called the Interbank Price Delivery Algorithm (IPDA).
Think of it as the “navigation system” that guides price through the market.
IPDA has one job:
to move prices in a way that keeps the market efficient and liquid.
To do this, it constantly looks for two things:
1. Where liquidity is hiding
Liquidity is usually found above highs and below lows—where traders place stop losses. The algorithm moves price there first to collect that liquidity.
2. Where price became unbalanced
Sometimes price moves too fast and creates gaps or imbalances. IPDA returns to those areas later to “fix” the missing orders.
Once you start looking at the charts with this idea in mind, everything makes more sense:
Why price suddenly spikes above a high and crashes down
Why big moves leave gaps that price later fills
Why the market reverses right after taking stops
Why trends begin only after certain levels are hit
These are not accidents.
They are the algorithm doing its job.
Price moves in a repeating cycle:
Gather liquidity
Make a strong move (displacement)
Return to fix inefficiency
Deliver to the next target
Most beginners only see the candles.
But once you understand IPDA, you see the intention behind the candles.
Instead of guessing where price might go, you begin to understand why it moves there.
And once you understand the “why,” your trading becomes clearer, calmer, and far more accurate.

Liquidity Entry Triggers (4-Model System) | WarRoomXYZLiquidity Entry Triggers is an open-source, price-action-based analytical framework designed to highlight recurring institutional liquidity behaviors that appear across all liquid markets.
The script focuses on how and where liquidity is taken, rather than attempting to predict direction using oscillators or lagging indicators.
It is optimized for XAUUSD, FX pairs, indices, and crypto , particularly on 1m–15m timeframes where session behavior and liquidity reactions are most visible.
This tool is not a buy/sell signal generator .
It provides contextual entry zones based on structural liquidity logic, allowing traders to apply their own execution rules.
Core Philosophy
Markets move because of:
•Trapped traders
•Forced liquidations
•Session-based liquidity cycles
•Reactions at prior institutional participation zones
This script visualizes four repeatable entry triggers that emerge from those mechanisms.
🔹 1. Failed Breakout / Trapped Trader Model
When price breaks a clearly defined range high or low, breakout traders often enter expecting continuation.
If price fails to hold outside the range and closes back inside, those traders become trapped.
The script detects:
•Breaks beyond recent highs/lows
•Immediate rejection back into the range
•Structural failure of momentum
These conditions frequently lead to mean reversion or reversal moves as trapped traders exit and fuel movement in the opposite direction.
Markers are plotted at the point of failure to highlight potential trap zones.
🔹 2. Liquidation Flush Detection
Sharp impulsive candles with abnormally large wicks often represent liquidation cascades rather than healthy trend continuation.
The script identifies liquidation behavior by measuring:
•Wick-to-body imbalance
•Sudden expansion followed by rejection
•Temporary price inefficiencies
These flushes commonly occur near:
•Session highs/lows
•Range extremes
•Trend exhaustion points
Such events often lead to rebalance moves , where price partially or fully fills the wick.
🔹 3. Orderblock Reaction Zones
Orderblocks represent areas where heavy participation occurred before a strong displacement move.
The script highlights:
•Clean bullish and bearish orderblock structures
•Zones formed during consolidation prior to expansion
•Areas likely to be defended when revisited
Orderblocks with minimal noise and clean departure are prioritized, as they often reflect institutional positioning rather than retail activity.
These zones are intended as reaction areas , not automatic entry signals.
🔹 4. London Session Liquidity Sweep Model
The London session frequently establishes the initial daily high or low.
Later in the session or during New York, price often:
•Sweeps internal liquidity around that level
•Rejects after the sweep
•Continues with the higher-timeframe bias
The script monitors London session behavior and marks:
•Liquidity runs above/below London highs and lows
•Rejections back inside the prior structure
This model is especially effective when combined with broader daily context.
🔹4. How the Components Work Together
The framework is designed as a context stack , not a checklist of signals:
Liquidity Event → Location → Timing → Trader Execution
Each model reinforces the others:
•Failed breakouts often occur after liquidity sweeps
•Liquidation wicks frequently form near orderblocks
•London sweeps often trigger failed momentum moves
•Confluence increases probability, not certainty
🔹 Practical Usage Guide
✔ Identify context
Determine whether price is approaching a range extreme, session level, or prior participation zone.
✔ Wait for a liquidity event
Look for a sweep, failed breakout, or liquidation wick.
✔ Observe reaction
Rejection, displacement, or reclaim behavior provides confirmation.
✔ Execute manually
Stops are commonly placed beyond the liquidity extreme.
Targets are typically internal liquidity, prior highs/lows, or imbalance zones.
The indicator does not manage trades or enforce rules.
Execution and risk management remain the trader’s responsibility.
🔹 5. Originality & Design Notes
This script does not replicate or bundle existing indicators.
It introduces:
•A multi-model liquidity entry framework
•Structural failed breakout detection
•Wick-based liquidation imbalance logic
•Session-aware liquidity sweep visualization
•A unified, minimal, non-lagging design
All concepts are based on observable market behavior and integrated into a single analytical tool.
🔹 6. Suitable Markets & Timeframes
Works best on:
•XAUUSD
•Major FX pairs
•Indices
•Liquid crypto markets
Recommended timeframes:
•1m
•5m
•15m
•30m
🔹7. Limitations & Notes
•This is an analytical framework , not a trading system
•All markings are confirmed at candle close (non-repainting)
•No open interest or order flow data is used
•Results depend on user interpretation and execution
•Best used alongside session bias and higher-timeframe structure
Disclaimer
This script is provided for educational and informational purposes only.
It does not constitute financial advice, investment advice, or a recommendation to buy or sell any instrument.
Trading involves risk, and losses can exceed initial deposits.
The author assumes no responsibility for trading decisions made using this tool.
Users are strongly encouraged to test this script in demo or simulation environments and to apply proper risk management, position sizing, and personal discretion at all times.
By using this script, you acknowledge and accept all associated risks.

Synthetic Liquidity HeatmapSYNTHETIC LIQUIDITY HEATMAP (SLH) v1.0
---
DESCRIPTION
The Synthetic Liquidity Heatmap (SLH) is an advanced statistical order book estimation tool that generates a visual representation of probable liquidity zones without requiring direct access to Level 2 market data. By analyzing price action, volume dynamics, and market microstructure patterns, SLH constructs a synthetic approximation of where institutional orders are likely concentrated.
---
KEY INNOVATIONS
1. CHL SPREAD MODEL (Close-High-Low)
Implements a logarithmic spread estimation model based on the relationship between close price and the high-low midrange. This microstructure approach captures the implicit bid-ask spread behavior embedded in OHLC data, providing insight into market maker activity and order flow imbalances.
2. VSA INTEGRATION (Volume Spread Analysis)
Optional Volume Spread Analysis mode weighs liquidity calculations by the product of volume and candle range. This identifies bars with significant effort (volume) relative to result (price movement), highlighting potential accumulation and distribution zones.
3. DYNAMIC LEVEL SPACING
Liquidity levels are spaced using ATR-based calculations, automatically adapting to current market volatility. This ensures relevant level placement across different instruments and timeframes without manual adjustment.
4. ACCUMULATIVE LIQUIDITY TRACKING
When price revisits the same level multiple times, contracts accumulate rather than creating duplicate zones. This mimics real order book behavior where resting orders stack at key price levels.
5. REAL-TIME HIT DETECTION
The system monitors when price reaches liquidity levels, terminating filled zones and maintaining only active resting liquidity. This provides a dynamic, evolving view of the synthetic order book.
---
MATHEMATICAL FOUNDATION
The CHL Spread Model is defined as:
CHL = √(4 × (ln(C) - M) × (ln(C) - M ))
Where:
- C is the closing price
- M = (ln(H) + ln(L)) / 2 is the log midrange
- M is the previous bar's log midrange
The State Factor adjusts liquidity intensity:
State Factor = max(0.2, 1.0 - (Z_spread × 0.15))
Where Z_spread is the z-score of the current spread relative to its moving average.
Liquidity distribution follows close position analysis:
Bid Strength = is_bullish ? (1 - close_position) × 0.7 + 0.3 : close_position × 0.7 + 0.3
Ask Strength = is_bullish ? close_position × 0.7 + 0.3 : (1 - close_position) × 0.7 + 0.3
---
APPLICATIONS
- Identify probable support and resistance zones based on synthetic order flow
- Visualize where institutional liquidity may be resting
- Anticipate potential reversal or breakout zones
- Complement existing Level 2 data with statistical estimation
- Analyze liquidity dynamics on instruments without accessible order book data
---
VISUAL REPRESENTATION
The heatmap displays:
- Green zones (Bids): Probable buy-side liquidity below current price
- Orange zones (Asks): Probable sell-side liquidity above current price
- Color intensity: Proportional to estimated contract concentration
- Level termination: Zones disappear when price "fills" the liquidity
---
AUTHOR
Name: Hector Octavio Piccone Pacheco
Indicator: Synthetic Liquidity Heatmap (SLH)
Version: 1.0
Date: 2025
Original Contributions:
- CHL-based spread estimation for liquidity inference
- Accumulative synthetic order book model
- ATR-adaptive level spacing system
- Real-time liquidity hit detection engine
- VSA-weighted liquidity distribution
---
DISCLAIMER
Trading involves substantial risk of loss. This indicator provides statistical estimations only and does not represent actual market depth or order book data. Past performance does not guarantee future results. Always conduct your own analysis and risk assessment.
---
ACCESS TO SRC
To request access to the SRC indicator, please contact me through:
Discord: octa_0001

Volume Delta + Bandas de Bollinger📊 Volume Delta + Bollinger Bands Indicator
Characteristics
• Volume Delta Histogram
• Shows the difference between buying and selling pressure.
• Green bars indicate positive delta (buyers dominating).
• Red bars indicate negative delta (sellers dominating).
• The histogram oscillates around the zero line, which represents balance between buyers and sellers.
• Bollinger Bands applied to Delta
• A moving average (basis line) of the delta is calculated.
• Upper and lower bands are plotted using standard deviation.
• These bands highlight periods when the delta moves to statistically extreme levels.
• Helps identify unusual buying or selling pressure compared to recent history.
• Zero Line Reference
• A horizontal line at zero shows equilibrium.
• Crossing above zero suggests net buying pressure.
• Crossing below zero suggests net selling pressure.
How to Use
• Identify Buyer/Seller Dominance
• Green histogram bars above zero → buyers are stronger.
• Red histogram bars below zero → sellers are stronger.
• Spot Extremes with Bollinger Bands
• When delta touches or exceeds the upper band, it signals unusually strong buying pressure.
• When delta touches or exceeds the lower band, it signals unusually strong selling pressure.
• These extremes can precede reversals or mark continuation if confirmed by price action.
• Combine with Price Analysis
• Use delta signals together with price trends and support/resistance levels.
• For example, if price is at resistance and delta spikes into the upper band, it may indicate exhaustion of buyers.
• If price is at support and delta spikes into the lower band, it may indicate exhaustion of sellers.
• Trading Strategy Ideas
• Reversal setups: Look for delta extremes against key price levels.
• Trend confirmation: Sustained delta above zero supports bullish trends; sustained delta below zero supports bearish trends.
• Volatility filter: Bollinger Bands help filter out normal fluctuations and highlight significant imbalances.
👉 In short, this indicator combines order flow pressure (delta) with volatility context (Bollinger Bands), making it useful for spotting moments when buying or selling activity becomes unusually strong compared to recent history.

Breakaway Gaps## Breakaway Gaps — Multi-Method Gap & Imbalance Mapping Tool
**Overview**
Breakaway Gaps is a gap-mapping tool designed to highlight areas where price has displaced rapidly and left potential imbalance zones on the chart. It blends multiple detection techniques into one framework, allowing traders to monitor different styles of “breakaway” behavior without clutter or manual drawing.
---
### What the script provides
- **Gap & imbalance zone detection** — identifies areas where price has moved quickly and may have left inefficiencies behind.
- **Breakaway zones** — highlights areas created by strong directional movement or structural shifts in price.
- **Automatic zone management** — highlighted areas extend forward and are removed once price interacts with them, keeping the chart clean.
- **Adjustable behavior** — all major parameters can be tuned: sensitivity, lookback length, displacement thresholds, color themes, and the number of displayed zones.
---
### Why this tool is useful
- Captures different forms of breakaway conditions in a single indicator.
- Helps traders visualize zones that may act as future reaction points, liquidity magnets, or reference areas.
- Designed to keep the chart clean by automatically maintaining and updating all zones.
- Flexible enough to support both discretionary and systematic styles.
---
### What it does *not* do
- Does **not** generate trade signals, entries, exits, stop levels, or position direction.
- Does not predict outcomes or guarantee that any highlighted zone will be respected or filled.
- Should be used as a contextual tool alongside your own analysis and risk management.
---
### Suggested applications
- Identifying potential retracement targets after strong moves
- Marking areas where liquidity may rest or where price may rebalance
- Supporting market structure, breakout, or liquidity-based trading frameworks
- Higher-timeframe context zones combined with lower-timeframe execution
---
### Customization
The tool offers full user control over sensitivity, zoning behavior, highlight style, and display limits, so traders can adapt it to different markets and timeframes.
---
**Disclaimer**
This tool is for chart visualization only. It does not provide financial advice or guaranteed outcomes. Always use proper risk management and your own judgment when trading.

TCT OBIF Detector█ OVERVIEW
The OBIF (Order Block Imbalance Fill) indicator automatically detects and visualizes high-probability trading zones by combining two powerful Smart Money Concepts: Order Blocks and Fair Value Gaps (FVGs).
An OBIF occurs when an Order Block forms immediately before a Fair Value Gap, creating a zone of institutional interest that price often revisits before continuing its move.
█ CONCEPTS
Order Block (OB)
An Order Block is the last opposing candle before a strong directional move. It represents an area where institutional traders likely placed orders.
- Bullish OB: Last bearish candle before an up-move
- Bearish OB: Last bullish candle before a down-move
Fair Value Gap (FVG)
An FVG is a price imbalance created when a candle's body completely gaps past the previous candle's range, leaving an unfilled area.
- Bullish FVG: Gap up where candle .low > candle .high
- Bearish FVG: Gap down where candle .high < candle .low
OBIF Zone
When an Order Block directly precedes an FVG, it creates an OBIF - a confluence zone with higher probability of acting as support/resistance.
█ HOW TO USE
1. Identify the Trend
Use OBIFs in the direction of the higher timeframe trend for best results.
2. Wait for Price to Return
OBIFs act as magnets - price often returns to fill the imbalance and test the order block.
3. Look for Confirmation
When price enters an OBIF zone, look for:
- Rejection wicks
- Engulfing patterns
- Break of structure on lower timeframes
4. Mitigation
Once price fully trades through the OBIF (touches the opposite edge), the zone is considered mitigated and loses its significance.
█ FEATURES
- Automatic Detection — Identifies OBIFs in real-time as they form
- Visual Zones — Clean, non-intrusive boxes that don't obscure price action
- Mitigation Tracking — Zones automatically update when price mitigates them
- Multi-Timeframe Friendly — Works on any timeframe from 1m to Monthly
- Customizable — Adjust colors, opacity, and display preferences
█ SETTINGS
- Lookback Window — How many candles back to search for the Order Block (default: 3)
- Show Bullish/Bearish — Toggle visibility of each type
- Show Mitigated — Display zones that have been mitigated (shown in gray)
- Fill Opacity — Adjust zone transparency (higher = more see-through)
- Border Width — Thickness of zone borders
█ BEST PRACTICES
✓ Use on higher timeframes (1H+) for more reliable zones
✓ Combine with market structure analysis
✓ Look for OBIFs at key support/resistance levels
✓ Use lower timeframe confirmation for entries
✗ Don't trade every OBIF blindly
✗ Avoid OBIFs against the dominant trend
█ CREDITS
The Composite Trader (TCT) methodologies.

TMT ICT SMC - Hitesh NimjeTMT ICT SMC - Smart Money Concepts
Overview
T
he TMT ICT SMC indicator is a comprehensive, all-in-one toolkit designed for traders utilizing Smart Money Concepts (SMC) and Inner Circle Trader (ICT) methodologies. Developed by Hitesh Nimje (Thought Magic Trading), this script automates the complex task of market structure mapping, order block identification, and liquidity analysis, providing a clear, institutional-grade view of price action.
Whether you are a scalper looking for internal structure shifts or a swing trader analyzing major trend reversals, this tool adapts to your timeframe with precision.
Key Features
1. Market Structure Mapping (Internal & Swing)
* Real-Time Structure: Automatically detects and labels BOS (Break of Structure) and CHoCH (Change of Character).
* Dual-Layer Analysis:
I nternal Structure: Captures short-term momentum and minor shifts for entry refinement.
Swing Structure: Identifies the overarching trend and major pivot points.
* Strong vs. Weak Highs/Lows: visualizes significant swing points to help you identify safe invalidation levels.
* Trend Coloring: Optional feature to color candles based on the active market structure trend.
2. Advanced Order Blocks (OB)
* Auto-Detection: Plots both Internal and Swing Order Blocks automatically.
* Smart Filtering: Includes an ATR or Cumulative Mean Range filter to remove noise and only display significant institutional footprint zones.
* Mitigation Tracking: Choose how order blocks are mitigated (Close vs. High/Low) to keep your chart clean.
3. Liquidity & Gaps
* Fair Value Gaps (FVG): Automatically highlights bullish and bearish imbalances. Includes MTF (Multi-Timeframe) capabilities to see higher timeframe gaps on lower timeframe charts.
* Equal Highs/Lows (EQH/EQL): Marks potential liquidity pools where price often reverses or targets.
4. Multi-Timeframe Levels
* Plots Daily, Weekly, and Monthly High/Low levels directly on your chart to help identify macro support and resistance without switching timeframes.
5. Premium & Discount Zones
* Automatically plots the Fibonacci range of the current price leg to show Premium (expensive), Discount (cheap), and Equilibrium zones, aiding in high-probability entry placement.
Customization
* Style: Switch between a "Colored" vibrant theme or a "Monochrome" minimal theme.
* Control: Every feature can be toggled on/off. Adjust lookback periods, sensitivity thresholds, and colors to match your personal trading style.
* Modes: Choose between "Historical" (for backtesting) and "Present" (for optimized real-time performance).
How to Use
* Trend Confirmation: Use the Swing Structure labels to determine the higher timeframe bias.
* Entry Trigger: Wait for a CHoCH on the Internal Structure within a higher timeframe Order Block or FVG.
* Targeting: Use the Equal Highs/Lows (Liquidity) or opposing Order Blocks as take-profit zones.
Credits
* Author: Hitesh Nimje
* Source: Thought Magic Trading (TMT)
TRADING DISCLAIMER
RISK WARNING
Trading involves substantial risk of loss and is not suitable for all investors. Past performance is not indicative of future results. You should carefully consider whether trading is suitable for you in light of your circumstances, knowledge, and financial resources.
NO FINANCIAL ADVICE
This indicator is provided for educational and informational purposes only. It does not constitute:
* Financial advice or investment recommendations
* Buy/sell signals or trading signals
* Professional investment advice
* Legal, tax, or accounting guidance
LIMITATIONS AND DISCLAIMERS
Technical Analysis Limitations
* Pivot points are mathematical calculations based on historical price data
* No guarantee of accuracy of price levels or calculations
* Markets can and do behave irrationally for extended periods
* Past performance does not guarantee future results
* Technical analysis should be used in conjunction with fundamental analysis
Data and Calculation Disclaimers
* Calculations are based on available price data at the time of calculation
* Data quality and availability may affect accuracy
* Pivot levels may differ when calculated on different timeframes
* Gaps and irregular market conditions may cause level failures
* Extended hours trading may affect intraday pivot calculations
Market Risks
* Extreme market volatility can invalidate all technical levels
* News events, economic announcements, and market manipulation can cause gaps
* Liquidity issues may prevent execution at calculated levels
* Currency fluctuations, inflation, and interest rate changes affect all levels
* Black swan events and market crashes cannot be predicted by technical analysis
USER RESPONSIBILITIES
Due Diligence
* You are solely responsible for your trading decisions
* Conduct your own research before using this indicator
* Verify calculations with multiple sources before trading
* Consider multiple timeframes and confirm levels with other technical tools
* Never rely solely on one indicator for trading decisions
Risk Management
* Always use proper risk management and position sizing
* Set appropriate stop-losses for all positions
* Never risk more than you can afford to lose
* Consider the inherent risks of leverage and margin trading
* Diversify your portfolio and trading strategies
Professional Consultation
* Consult with qualified financial advisors before trading
* Consider your tax obligations and legal requirements
* Understand the regulations in your jurisdiction
* Seek professional advice for complex trading strategies
LIMITATION OF LIABILITY
Indemnification
The creator and distributor of this indicator shall not be liable for:
* Any trading losses, whether direct or indirect
* Inaccurate or delayed price data
* System failures or technical malfunctions
* Loss of data or profits
* Interruption of service or connectivity issues
No Warranty
This indicator is provided "as is" without warranties of any kind:
* No guarantee of accuracy or completeness
* No warranty of uninterrupted or error-free operation
* No warranty of merchantability or fitness for a particular purpose
* The software may contain bugs or errors
Maximum Liability
In no event shall the liability exceed the purchase price (if any) paid for this indicator. This limitation applies regardless of the theory of liability, whether contract, tort, negligence, or otherwise.
REGULATORY COMPLIANCE
Jurisdiction-Specific Risks
* Regulations vary by country and region
* Some jurisdictions prohibit or restrict certain trading strategies
* Tax implications differ based on your location and trading frequency
* Commodity futures and options trading may have additional requirements
* Currency trading may be regulated differently than stock trading
Professional Trading
* If you are a professional trader, ensure compliance with all applicable regulations
* Adhere to fiduciary duties and best execution requirements
* Maintain required records and reporting
* Follow market abuse regulations and insider trading laws
TECHNICAL SPECIFICATIONS
Data Sources
* Calculations based on TradingView data feeds
* Data accuracy depends on broker and exchange reporting
* Historical data may be subject to adjustments and corrections
* Real-time data may have delays depending on data providers
Software Limitations
* Internet connectivity required for proper operation
* Software updates may change calculations or functionality
* TradingView platform dependencies may affect performance
* Third-party integrations may introduce additional risks
MONEY MANAGEMENT RECOMMENDATIONS
Conservative Approach
* Risk only 1-2% of capital per trade
* Use position sizing based on volatility
* Maintain adequate cash reserves
* Avoid over-leveraging accounts
Portfolio Management
* Diversify across multiple strategies
* Don't put all capital into one approach
* Regularly review and adjust trading strategies
* Maintain detailed trading records
FINAL LEGAL NOTICES
Acceptance of Terms
* By using this indicator, you acknowledge that you have read and understood this disclaimer
* You agree to assume all risks associated with trading
* You confirm that you are legally permitted to trade in your jurisdiction
Updates and Changes
* This disclaimer may be updated without notice
* Continued use constitutes acceptance of any changes
* It is your responsibility to stay informed of updates
Governing Law
* This disclaimer shall be governed by the laws of the jurisdiction where the indicator was created
* Any disputes shall be resolved in the appropriate courts
* Severability clause: If any part of this disclaimer is invalid, the remainder remains enforceable
REMEMBER: THERE ARE NO GUARANTEES IN TRADING. THE MAJORITY OF RETAIL TRADERS LOSE MONEY. TRADE AT YOUR OWN RISK.
Contact Information:
* Creator: Hitesh_Nimje
* Phone: Contact@8087192915
* Source: Thought Magic Trading
© HiteshNimje - All Rights Reserved
This disclaimer should be prominently displayed whenever the indicator is shared, sold, or distributed to ensure users are fully aware of the risks and limitations involved in trading.

Advanced Delta Trading System ProAdvanced Delta Trading System Pro
Overview
This indicator is an advanced order flow analysis tool that combines Delta Volume Analysis, Cumulative Volume Delta (CVD), Multi-Timeframe Trend Confirmation, and Volume Profile Zones to identify high-probability trading opportunities based on institutional buying and selling pressure.
🔍 Core Concepts & Methodology
1. Range-Weighted Delta Calculation (Original Implementation)
Unlike basic delta indicators that simply subtract selling volume from buying volume, this script uses a range-weighted approach:
Range Weight = |Price Movement| / Candle Range
Bar Delta = Volume × Direction × Range Weight
Why this matters:
Accounts for intra-bar price action strength
Provides more accurate representation of directional conviction
Filters out low-conviction volume during ranging periods
2. Cumulative Volume Delta (CVD) with Momentum
The script calculates CVD by accumulating bar deltas and applies:
EMA smoothing to reduce noise (adjustable period)
Delta Momentum indicator: Measures the rate of change of delta relative to its average
CVD Slope detection: Identifies accumulation/distribution phases
Formula:
Delta Momentum = Current Absolute Delta / Average Absolute Delta
This normalized momentum metric helps filter low-conviction signals.
3. Multi-Timeframe CVD Confluence (Unique Feature)
The indicator pulls CVD trend data from a higher timeframe (default: 15min) to:
Confirm signals only when aligned with HTF institutional flow
Display HTF bias in the dashboard (Bull ▲ / Bear ▼ / Neutral)
Prevent counter-trend trades against larger timeframe momentum
Edge: Many delta indicators operate on single timeframes; this multi-timeframe approach significantly reduces false signals.
4. Volume Profile Zone Detection
Instead of static support/resistance, the script dynamically identifies:
High Volume Nodes (HVN): Areas with 1.5x above-average volume - potential magnets/reversal zones
Low Volume Nodes (LVN): Areas with <0.5x average volume - breakout zones with minimal resistance
These zones are visualized as semi-transparent boxes on the chart, updated in real-time.
5. Delta-CVD Divergence Detection
The script identifies:
Bullish Divergence: Price makes lower low while CVD makes higher low (accumulation)
Bearish Divergence: Price makes higher high while CVD makes lower high (distribution)
Uses pivot detection with adjustable lookback periods and draws divergence lines automatically.
🎯 Signal Generation Logic
Buy Signal Requirements:
Bar delta exceeds threshold (Average Delta × Imbalance Multiplier)
Delta momentum ≥ minimum threshold (default: 1.2)
CVD slope is positive (accumulation phase)
Higher timeframe CVD is bullish (if MTF enabled)
Candle closes green (price confirmation)
Sell Signal Requirements:
Same criteria but inverted for selling pressure.
Enhanced Signals:
Signals are strengthened when accompanied by divergences, combining immediate imbalance with underlying accumulation/distribution patterns.
📊 Visual Features
1. Intelligent Candle Coloring
Color intensity based on delta momentum (0-3 scale)
Lime: Strong buying | Red: Strong selling | Gray: Neutral
Helps quickly identify conviction behind price moves
2. Delta Labels
Optional labels showing exact delta values (in thousands for readability)
Adjustable frequency (every Nth bar)
Color-coded by strength
3. Real-Time Dashboard
Displays:
Current bar delta
Cumulative Volume Delta (CVD)
Delta momentum reading
Higher timeframe bias
Active signals and divergences
⚙️ Customization Options
Delta Settings:
CVD Smoothing: Controls EMA period for CVD line
Avg Delta Length: Lookback for delta average calculation
Delta Momentum Period: Smoothing for momentum indicator
Signal Filters:
Imbalance Multiplier: Threshold for signal generation (higher = fewer, stronger signals)
CVD Confluence: Require/disable CVD trend alignment
Min Momentum: Filter weak signals below threshold
Volume Zones:
Lookback Period: Bars analyzed for HVN/LVN detection
Max Zone Boxes: Limit visual clutter
Toggle HVN/LVN independently
Multi-Timeframe:
Select any higher timeframe for CVD analysis
HTF Bias Panel: Show/hide dashboard element
🔔 Alert Conditions
Long/Short Signals: Fires when all confluence conditions met
Divergence Alerts: Bullish/Bearish divergence detected
Extreme Momentum: Delta momentum exceeds 2.5× average
HTF Trend Change: Higher timeframe CVD reverses
💡 How to Use
For Scalping:
Use 1-5min charts with 15min HTF confirmation
Focus on extreme momentum alerts (>2.5×)
Enter on signals near HVN zones for better R:R
For Swing Trading:
Use 15min-1H charts with 4H HTF confirmation
Wait for divergences + signal confluence
Avoid LVN zones (price likely to slice through)
Volume Profile Strategy:
Buy at HVN support with bullish delta
Sell at HVN resistance with bearish delta
Target LVN zones for breakout trades
🆚 What Makes This Script Unique
Unlike standard delta indicators, this combines:
Range-weighted delta (more accurate than simple volume delta)
Multi-timeframe confirmation (institutional flow alignment)
Dynamic volume profile zones (not static S/R)
Momentum-filtered signals (reduces noise significantly)
Divergence integration (catches reversals early)
Compared to free alternatives: Most delta scripts show raw cumulative delta without momentum filtering, MTF analysis, or volume profile integration. This script provides a complete order flow analysis system in one indicator.
⚠️ Important Notes
Not a standalone system: Use with price action and market structure
Optimize settings per asset: Crypto needs different settings than forex/stocks
Higher timeframes = more reliable: Reduce noise on lower timeframes with longer smoothing
Volume quality matters: Works best on high-liquidity assets with accurate volume data
📈 Best Timeframes
Scalping: 1m-5m (with 15m HTF)
Day Trading: 5m-15m (with 1H HTF)
Swing Trading: 1H-4H (with D HTF)
This indicator is designed for traders who understand order flow concepts and want a comprehensive, multi-layered approach to delta analysis beyond basic cumulative volume delta indicators.

Ghost Cipher [Bit2Billions]Ghost Cipher — Adaptive Market Flow Engine
*A structured, intelligence-driven framework that decodes market flow using smoothing, liquidity distribution, volatility behavior, and range-based logic.*
Ghost Cipher translates complex price action into a clean, intuitive visual environment. It combines multiple analytical modules—including adaptive smoothing, liquidity mapping, volatility profiling, and CRT range-theory detection—into a cohesive, rule-based system. Each component is designed to complement the others: smoothing reduces noise for clearer trend detection, liquidity mapping identifies imbalance zones for potential reversals, and range theory structures intra-day and multi-timeframe price dynamics.
This integration provides traders with a streamlined, actionable view of market flow from micro swings to macro transitions, supporting both decision-making and workflow efficiency.
Why This Script Is Original and Useful
* Ghost Cipher is not a simple mashup: each module is developed with proprietary logic and integrates dynamically with others.
* Classic elements like moving averages, volatility bands, and order blocks are adapted and enhanced, not copied from public scripts.
* Closed-source design ensures that traders see what the script does (trend, liquidity, range signals) without exposing full underlying code.
* All visual and analytical outputs are designed to add tangible value over existing indicators, reducing manual analysis and improving clarity.
Key Features & Components
1. Candles & Visualization
* Custom Heikin-Ashi–style candle coloring for a clean chart.
* Multi-timeframe overlays to highlight higher-timeframe influence.
2. Smoothed Trend Processin g
* Proprietary smoothing for noise-reduced trend detection.
* Zero-Lag Multi-Ribbon: layered momentum ribbon with gradient shading for lag-free directional assessment.
3. Liquidity & Institutional Mapping
* Real-time liquidity depth visualization.
* Detection of pockets, imbalance zones, and resting liquidity clusters.
* Smart Bullish & Bearish Order Blocks with mitigation-focused logic.
4. Dynamic Demand & Supply Engine
* Auto-detection of institutional demand/supply zones.
* Adaptive boundaries respond to volatility, displacement, and liquidity conditions.
5. Volatility & Channel Tools
* Adaptive Bollinger-style volatility bands.
* Macro trendlines, break structures, and volumetric channel mapping.
6. Intelligent Market Flow Tools
* Dynamic Magic Line: adapts to real-time volatility, range compression, and volume shifts.
* CRT Candle Range Theory: detects ranges, equilibrium zones, and breakout/reaction signals.
7. Market Sessions
* Highlights bull/bear sessions for directional bias and structural insight.
Dashboard Metrics
* Volume Delta Dashboard: aggregated BTC delta across major exchanges; multi-asset pairing for comparison.
* Market Overview Panel: current bias, trend regime, and structured analyst notes.
Chart Clarity & Design Standards
* Only essential real-time labels displayed; historical labels hidden.
* Organized visuals with consistent colors, line types, and modular design for quick interpretation.
How to Use / What Traders Gain
* Reduces manual charting and repetitive analysis.
* Speeds workflow using rule-based, automated visualization.
* Cuts through market noise for consistent, structured insights.
* Supports multi-timeframe and multi-market analysis.
Inputs & Settings
* Default settings pre-configured
* Simple Show/Hide toggles for modules
* Minimal exposed fields for ease of use
Recommended Timeframes & Markets
* Works best on 15M, 1H, 4H, Daily, and higher
* Suitable across forex, crypto, indices, and liquid equities
* Pivot-based modules may show noise on illiquid assets
Performance & Limitations
* May draw many objects → disable unused modules for speed
* Refresh the chart if historical buffer issues occur
* TradingView platform limitations handled internally
License & Legal
* Proprietary © 2025
* Redistribution, resale, or disclosure prohibited
* Independently developed with proprietary extensions
* Any resemblance to other tools may result from public-domain concepts
Respect & Transparency
* Built on widely recognized public trading concepts.
* Developed with respect for the TradingView community.
* Any overlaps or similarities can be addressed constructively.
Disclaimer
* Educational purposes only
* Not financial advice
* Trading carries risk — always use paper testing and proper risk management
FAQs
* Source code is not public
* Works best on 15m, 1H, 4H, Daily, Weekly charts
* Modules can be hidden/shown with toggles
* Alerts can be set up manually by users
* Supports multiple markets: forex, crypto, indices, and equities
About Ghost Trading Suite
Author: BIT2BILLIONS
Project: Ghost Trading Suite © 2025
Indicators: Ghost Matrix, Ghost Protocol, Ghost Cipher, Ghost Shadow
Strategies: Ghost Robo, Ghost Robo Plus
Pine Version: V6
The Ghost Trading Suite is designed to simplify and automate many aspects of chart analysis. It helps traders identify market structure, divergences, support and resistance levels, and momentum efficiently, reducing manual charting time.
The suite includes several integrated tools — such as Ghost Matrix, Ghost Protocol, Ghost Cipher, Ghost Shadow, Ghost Robo, and Ghost Robo Plus — each combining analytical modules for enhanced clarity in trend direction, volatility, pivot detection, and momentum tracking.
Together, these tools form a cohesive framework that assists in visualizing market behavior, measuring momentum, detecting pivots, and analyzing price structure effectively.
This project focuses on providing adaptable and professional-grade tools that turn complex market data into clear, actionable insights for technical analysis.
Crafted with 💖 by BIT2BILLIONS for Traders. That's All Folks!
Changelog
v1.0 Core Release
* Custom Heikin-Ashi Candles: Clean, visually intuitive candle designs for effortless chart reading.
* Smoothed Moving Averages: Advanced smoothing algorithms for precise trend tracking and confirmation.
* Liquidity Depth Visualization: Real-time insight into liquidity levels, depth pockets, and imbalance zones.
* Dynamic Demand & Supply Mapping: Automatic detection of institutional demand and supply zones with adaptive boundaries.
* High-Timeframe Candle Zones (HTF): Dual HTF candle overlays for macro-level trend context and control over candle count.
* Trend Lines & Channels: Macro and aggressive volumetric trendlines for structured market flow analysis.
* Zero-Lag Moving Average Ribbon: Layered ribbon with shaded gradients for smoother, lag-free momentum visualization.
* Volatility Bands: Adaptive Bollinger-style bands for dynamic range analysis.
* Dynamic Magic Line: Self-adjusting line responding to real-time volatility and volume shifts.
* CRT Candle Range Theory: Automatic detection and visualization of CRT candle ranges and range-based signals.
* Bull & Bear Sessions: Highlights key market sessions to identify directional bias and volatility shifts.
* Order Blocks: Smart detection of bullish and bearish institutional order blocks.
* Dashboard Module:
* Volume Delta Dashboard: Aggregated delta volume from all major exchanges for BTC, with the ability to pair up to 4 additional assets.
* Market Overview Panel: Displays current bias, trend insights, and actionable analyst notes.

Session Markers - JDK AnalysisSession Markers is a tool designed to study how markets behave during specific, recurring time windows. Many traders know that price behaves differently depending on the day of the week, the time of the day, or particular market sessions such as the weekly open, the London session, or the New York open. This indicator makes those recurring windows visible on the chart and then analyzes what price typically does inside them. The result is a clear statistical understanding of how a chosen session behaves, both in direction and in strength.
The script works by allowing the trader to define any time window using a start day and time and an end day and time. Every time this window occurs on the chart, the indicator highlights it with a full-height vertical band. These visual markers reveal patterns that are otherwise difficult to detect manually, such as whether certain sessions tend to trend, reverse, consolidate, or create large imbalances. They also help the trader quickly scan through historical price action to see how the market has behaved under similar conditions.
For every completed session window, the indicator measures how much price changed from the moment the window began to the moment it ended. Instead of using raw price differences, it converts these changes into percentage moves. This makes the measurement consistent across different price ranges and market regimes. A one-percent move always has the same meaning, whether the asset is trading at 100 or 50,000. These percentage moves are collected for a user-selected number of past sessions, creating a dataset of how the market has behaved in the chosen time window.
Based on this dataset, the indicator generates several statistics. It counts how many past sessions closed higher and how many closed lower, producing a directional tendency. It also computes the probability of an upward session by dividing the number of positive sessions by the total. More importantly, it calculates the average percentage movement for all sessions in the lookback period. This average move reflects not just the direction but also the magnitude of price changes. A session with frequent small upward moves but occasional large downward moves will show a negative average movement, even if more sessions ended positive. This creates a more realistic representation of true market behavior.
Using this average movement, the script determines a “Bias” for the session. If the average percentage move is positive, the bias is considered bullish. If it is negative, the bias is bearish. If the values are very close to zero, the bias is neutral. This way, the indicator takes both frequency and impact into account, producing a magnitude-aware assessment instead of one that only counts wins and losses. A sequence such as +5%, –1% results in a bullish bias because the overall impact is strongly positive. On the other hand, a series of small gains followed by a large drop produces a bearish bias even if more sessions ended positive, because the large move dominates the average. This provides a far more truthful picture of what the market tends to do during the chosen window.
All relevant statistics are displayed neatly in a small panel in the top-right corner of the chart. The panel updates in real time as new sessions complete and older ones fall out of the lookback range. It shows how many sessions were analyzed, how many ended up or down, the probability of an upward move, the average percentage change, and the final bias. The background color of the panel instantly reflects that bias, making it easy to interpret at a glance.
To use the tool effectively, the trader simply needs to define a time window of interest. This could be something like the weekly opening window from Sunday to Monday, the London open each day, or even a unique custom window. After selecting how many past sessions to analyze, the indicator takes care of the rest. The vertical session markers reveal the structure visually. The statistics summarize the historical behavior objectively. The magnitude-weighted bias provides a realistic indication of whether the window tends to produce upward or downward movement on average.
Session Markers is helpful because it translates repeated market timing behavior into measurable data. It exposes hidden tendencies that are easy to feel intuitively but hard to quantify manually. By analyzing both direction and magnitude, it prevents misleading interpretations that can arise from looking only at win rates. It helps traders understand whether a session typically produces meaningful moves or just small noise, whether it tends to trend or reverse, and whether its behavior has recently changed. Whether used for bias building, session filtering, or deeper market research, it offers a structured framework for understanding the market through time-based patterns.

Sellers vs Buyers 2Pressure Gauges (Custom “Buyer/Seller Pressure” Indicators)
These combine volume, price momentum, and imbalances.
Green bars/lines indicate buying pressure
Red bars/lines indicate selling pressure

Psychological Price Level GBPJPY (.250 / .750)This indicator is designed for GBPJPY traders who work with precision and smart-money-based analysis. It automatically plots psychological price levels at .250 and .750, which are known institutional reference points that often influence market structure, price reactions, and liquidity behavior. Unlike typical round-number indicators, this tool focuses specifically on quarter levels, which are frequently used by algorithms, banks, and experienced institutional traders.
Fixed and Reliable Levels
As price evolves, the levels update automatically and remain fixed on the chart without shifting when you scroll. This ensures that the levels always stay anchored to relevant market structure, making them reliable reference points for planning entries, targets, or stop placements.
Customization
The indicator allows full customization. You can freely adjust the line color, line thickness, and line style to match your personal trading chart layout. You can also choose whether lines extend left, right, or both directions, making the tool flexible enough to fit minimalist or highly marked-up workspaces.
Why These Levels Matter
In smart money trading approaches, the .250 and .750 levels often act as magnetic zones. Price frequently gravitates toward them to test liquidity or engineer traps before continuing its move. These levels may serve as rejection points, breakout confirmation zones, or take-profit areas depending on the broader context. Because they frequently align with order blocks, fair value gaps, and market structure shifts, they can add meaningful confluence to directional bias and trade timing.
Who Can Benefit
This tool is particularly useful for scalpers, day traders, and swing traders who base decisions on liquidity behavior and institutional logic. It works well on any timeframe and complements concepts such as premium and discount models, inefficiencies, fair value gaps, and volume imbalances. Many traders find that these price levels help them identify reactions earlier, refine entries, and improve confidence when executing trades.
Final Note
If this indicator supports your trading workflow, feel free to leave a comment or mark it as a favorite + give it a BOOST . Your feedback helps guide future improvements and ensures the tool continues evolving for serious GBPJPY traders.
Happy trading — and stay precise. 🚀📊

8FigRenko – Precision FVG Zones8FigRenko – Pure FVG Zones is a clean, reliable Fair Value Gap tool designed for traders who want accurate FVG zones only from the chart timeframe — without repainting, without higher-timeframe complications, and without messy borders.
This script is built for traders who want simple, precise, and visually clean imbalance zones that work the way FVGs should work:
🔥 Features
✔ Chart-timeframe FVGs only
No request.security, no multi-TF artifacts, no lagging or repainting.
The script reads exactly what your chart shows and never mixes timeframes.
✔ Wick-based or Body-based detection
Use classic ICT wick gaps, or switch to body-only gaps with one click.
✔ Minimum FVG size (points)
Filters out noise by requiring a minimum point distance (default: 5 points).
Great for futures and fast intraday charts.
✔ Clean, seamless boxes (no borders)
The FVG zones are rendered with borderless boxes, matching the modern style shown in institutional imbalance tools.
✔ Proper “end-to-end” FVG drawing
Each gap box starts from the origin of the imbalance and extends forward automatically.
✔ Auto-disrespect removal
FVGs are automatically deleted when price invalidates the zone:
Bullish FVG removed if close < FVG low
Bearish FVG removed if close > FVG high
No clutter. No manual cleanup.
✔ Extend zones forever or to the current bar
Choose if your FVGs run across the full future chart or just up to the latest candle.
✔ Optional: show only most recent FVG
Great for scalping or IFV (Immediate Fair Value) strategies.

Energy Meter (Candle Range/ATR Ratio)Purpose:
This indicator is a simple, intuitive way to visualize auction energy — the actual force behind a price move — rather than just its appearance on the chart. It’s built on a single idea:
If a bar travels farther than normal in its fixed amount of time, something pushed harder than usual.
That “push” is auction energy, and it’s the raw material of microstructure inference: reading intent and imbalance from nothing more than candles, tempo, and volatility.
Traditional indicators focus on price patterns or volume. This one focuses on pressure — the underlying imbalance driving each bar.
How It Works
Each bar’s True Range is divided by its ATR, producing a normalized ratio:
1.0 = Average energy
>1.2 (default) = Above-normal energy
<1.0 = Quiet, low-pressure bars
This ratio is plotted as a histogram to highlight bursts of force, with a smoothed line added to show the tempo of recent energy changes.
When the histogram spikes, you’re seeing the auction flash its teeth: aggression, initiative, failed absorption, breakout ignition, or the first punch of a reversal.
When the line rolls over, you’re seeing the engine lose torque.
It’s a minimalist tool for seeing who is actually winning the auction, even when price looks deceptively calm.
Why It Matters
Price moves because of imbalance, not geometry. Two candles that look identical can represent completely different internal dynamics.
This indicator helps you see:
Breakout strength vs. fakeouts
Acceleration vs. drift
Exhaustion after extended runs
Reversal attempts with real intent
Quiet absorption before explosive moves
Shifts in aggression hidden inside consolidation
For new traders, it’s a clean introduction to microstructure inference — extracting meaningful order-flow insights without needing L2, DOM, or volume profile.
For experienced traders, it's a compact impulse detector that complements trend, volatility, and liquidity models.
Summary
This is a lightweight, first-principles tool designed to expose the energy signature of the auction: how hard the market is trying to go somewhere.
It doesn’t predict direction — it reveals pressure, so you can judge the quality of the move you’re trading.
Energy beats geometry.
Intent beats patterns.
Microstructure is hiding in every candle; this indicator makes it visible.

Advanced Linear Regression Pro [PointAlgo]Advanced Linear Regression Pro is an open-source tool designed to visualize market structure using linear regression, volatility bands, and optional volume-weighted calculations.
The indicator expands the concept of regression channels by adding higher-timeframe confluence, slope analysis, imbalance detection, and breakout highlighting.
Key Features
• Volume-Weighted Regression
Weights the regression curve based on volume to highlight periods of strong participation.
• Dynamic Standard-Deviation Bands
Upper and lower bands are derived from volatility to help visualize potential expansion or contraction zones.
• Multi-Timeframe (MTF) Regression
Plots higher-timeframe regression lines and bands for additional trend context.
• Slope Strength Analysis
Helps identify whether the current regression slope is trending upward, downward, or in a neutral range.
• Order Flow Imbalance Detection
Highlights bars where price and volume move unusually fast, which may indicate liquidity voids or imbalance zones.
• Breakout Markers
Shows simple visual markers when the price closes beyond volatility bands with volume confirmation.
These are visual signals only, not trading signals.
How to Use
This indicator is meant for visual market analysis, such as:
Observing trend direction through regression slope
Spotting volatility expansions
Comparing price against higher-timeframe regression structure
Identifying areas where price moves rapidly with volume
It can be used on any market or timeframe.
No part of this script is intended as financial advice or a complete trading system.

Supply & Demand ZonesThis indicator detects high-probability supply and demand zones using a multi-step smart money concept approach:
Liquidity Sweep Detection: Identifies when price sweeps above a pivot high (supply setup) or below a pivot low (demand setup), capturing liquidity grabs by institutional traders.
Displacement Confirmation: Requires a strong displacement candle (measured by ATR and body percentage) or fair value gap (FVG/imbalance) in the opposite direction after the sweep.
Volume Confirmation: Optional filter ensures zones form only when volume exceeds the user-defined threshold, indicating institutional participation.
Smart Filtering: Built-in logic prevents overlapping zones, enforces minimum spacing between signals, and requires confirmation bars to eliminate false signals.
Zone Lifecycle Management: Zones are automatically removed when price closes through them with momentum. Breached zones can optionally "flip" to the opposite type when re-tested with strong displacement.
✨ Key Features
Clean Visual Display: Small "D" (Demand) and "S" (Supply) labels with shaded zone boxes
Non-Repainting: All signals use confirmed historical data—no lookahead or repainting
Volume Filter: Optional confirmation using volume spike detection
Zone Flip Logic: Breached demand zones can become supply (and vice versa) when violated
Overlap Prevention: Smart algorithm prevents clustered or duplicate zones
Confirmation Delay: Configurable wait period after sweep to confirm genuine setups
Customizable Inputs: Adjust pivot sensitivity, displacement thresholds, volume filters, and more
Alert Ready: Built-in alert conditions for new supply and demand zone formations
🎯 How to Add to Your Chart
Favorite the Indicator: Click the star icon to add this script to your favorites
Open Your Chart: Navigate to the asset and timeframe you want to trade (works best on 5m-1H intraday charts)
Add Indicator: Click "Indicators" at the top, search for "Supply & Demand Zones (Smart Filtered)", and add to chart
Customize Settings: Click the gear icon ⚙️ to adjust inputs based on your trading style and instrument volatility
Set Alerts: Right-click the indicator name → "Add alert" → Select "Supply Zone" or "Demand Zone" conditions
📖 How to Use
Demand Zones (Green "D" Labels):
Price swept below a swing low (liquidity grab)
Strong bullish displacement or imbalance followed
Trading Action: Look for LONG entries when price returns to the zone or on immediate continuation
Stop Loss: Place just below the zone or sweep low
Target: Next resistance level, supply zone, or risk-reward ratio target
Supply Zones (Red "S" Labels):
Price swept above a swing high (liquidity grab)
Strong bearish displacement or imbalance followed
Trading Action: Look for SHORT entries when price returns to the zone or on immediate continuation
Stop Loss: Place just above the zone or sweep high
Target: Next support level, demand zone, or risk-reward ratio target
Flipped Zones (Orange Labels):
Previous demand/supply zone was broken with strong momentum
Zone has flipped polarity and may now act as the opposite type
Trading Action: Exercise caution—wait for additional confirmation before trading flipped zones
🔍 What to Look For
High-Quality Setups:
Zone forms with above-average volume (check volume filter is enabled)
Clear liquidity sweep visible on the chart
Strong displacement candle with large body percentage
Zone aligns with overall market trend or key structure levels
Multiple timeframe confirmation (check higher timeframe for context)
Avoid These Setups:
Zones forming in choppy, low-volume conditions
Multiple overlapping zones in the same area (indicator filters these automatically)
Zones that appear immediately after news events (set confirmation bars higher)
Counter-trend zones without additional confluence
⚙️ Recommended Settings by Timeframe
5-Minute Charts (Scalping):
Pivot Lookback: 3/3
Min Displacement ATR: 0.9
Confirmation Bars: 1
Min Zone Spacing: 3-5 bars
Volume Threshold: 1.2x
15-Minute Charts (Intraday):
Pivot Lookback: 4/4 (default)
Min Displacement ATR: 1.0 (default)
Confirmation Bars: 2 (default)
Min Zone Spacing: 5-8 bars
Volume Threshold: 1.2x
1-Hour Charts (Swing Trading):
Pivot Lookback: 5/5
Min Displacement ATR: 1.2-1.5
Confirmation Bars: 3
Min Zone Spacing: 8-12 bars
Volume Threshold: 1.3x
💡 Trading Tips & Best Practices
Combine with Price Action: Use this indicator alongside candlestick patterns, support/resistance, and trendlines for confirmation
Multiple Timeframe Analysis: Check higher timeframes for overall bias and major zones
Volume is Key: Enable volume filter to focus on institutional-backed moves
Risk Management: Always use stop losses and proper position sizing
Backtesting: Test settings on your preferred instruments and timeframes before live trading
Context Matters: Consider market conditions, news events, and session times
Wait for Confirmation: Don't rush entries—wait for price reaction at the zone
⚠️ Important Disclaimers
Educational Purpose Only: This indicator is provided for educational and informational purposes. It does not constitute financial advice, investment recommendations, or trading signals.
No Guarantees: Past performance and backtested results do not guarantee future results. Trading involves substantial risk of loss.

ICS🏛️ Institutional Confluence Suite (ICS) Indicator
The Institutional Confluence Suite is a powerful and highly customizable TradingView indicator built to help traders identify key institutional trading concepts across multiple timeframes. It visualizes essential market components like Market Structures (MS), Order Blocks (OB)/Breaker Blocks (BB), Liquidity Zones, and Volume Profile, providing a confluence of institutional price action data.
📈 Key Features & Components
1. Market Structures (MS)
Purpose: Automatically identifies and labels shifts in market trends (Market Structure Shift, MSS) and continuations (Break of Structure, BOS).
Timeframe Detection: You can select detection across Short Term, Intermediate Term, or Long Term swings to match your trading horizon.
Visualization: Plots colored lines (Bullish: Teal, Bearish: Red) to mark the structures and optional text labels (BOS/MSS) for clear identification.
2. Order & Breaker Blocks (OB/BB)
Purpose: Detects and projects potential Supply and Demand zones based on recent price action that led to a swing high or low.
Block Types: Distinguishes between standard Order Blocks and Breaker Blocks (OBs that fail to hold and are traded through, often serving as support/resistance in the opposite direction).
Customization:
Detection Term: Adjusts sensitivity (Short, Intermediate, Long Term).
Display Limit: Sets the maximum number of recent Bullish and Bearish blocks to display.
Price Reference: Option to use the Candle Body (Open/Close) or Candle Wicks (High/Low) to define the block boundaries.
Visualization: Displays blocks as colored boxes (Bullish: Green, Bearish: Red) extending into the future, with a dotted line marking the 50% equilibrium level. Breaker Blocks are indicated by a change in color/line style upon being broken.
3. Buyside & Sellside Liquidity (BSL/SSL)
Purpose: Highlights areas where retail stops/limit orders are likely clustered, often represented by a series of relatively equal highs (Buyside Liquidity) or lows (Sellside Liquidity).
Detection Term: Adjustable sensitivity (Short, Intermediate, Long Term).
Margin: Uses a margin (derived from ATR) to group similar swing points into a single liquidity zone.
Visualization: Plots a line and text label marking the swing point, and a box indicating the clustered liquidity zone.
4. Liquidity Voids (LV) / Fair Value Gaps (FVG)
Purpose: Identifies areas where price moved sharply and inefficiency was created, often referred to as Fair Value Gaps or Imbalances. These are price ranges where minimal trading volume occurred.
Threshold: Uses a multiplier applied to the 200-period ATR to filter for significant gaps.
Mode: Can be set to Present (only show voids near the current price) or Historical (show all detected voids).
Visualization: Fills the price gap with colored boxes (Bullish/Bearish zones), often segmented to represent the price delivery across the gap.
5. Enhanced Liquidity Detection
Purpose: A complementary feature that uses volume and price action to highlight areas of high liquidity turnover, potentially indicating stronger Support and Resistance zones.
Calculation: Utilizes a volume-weighted approach to color-grade liquidity zones based on their significance.
Visualization: Plots shaded boxes (gradient-colored) around swing highs/lows, with text displaying the normalized volume strength.
6. Swing Highs/Lows
Purpose: Directly marks the price points identified as Swing Highs and Swing Lows based on the lookback periods.
Timeframe Detection: Can be enabled for Short Term, Intermediate Term, or Long Term swings.
Visualization: Plots a small colored dot/label (e.g., "⦁") at the swing point.
This indicator is an invaluable tool for traders employing ICT (Inner Circle Trader), Smart Money Concepts (SMC), or general price action strategies, as it automatically aggregates and displays these critical structural and liquidity elements.
