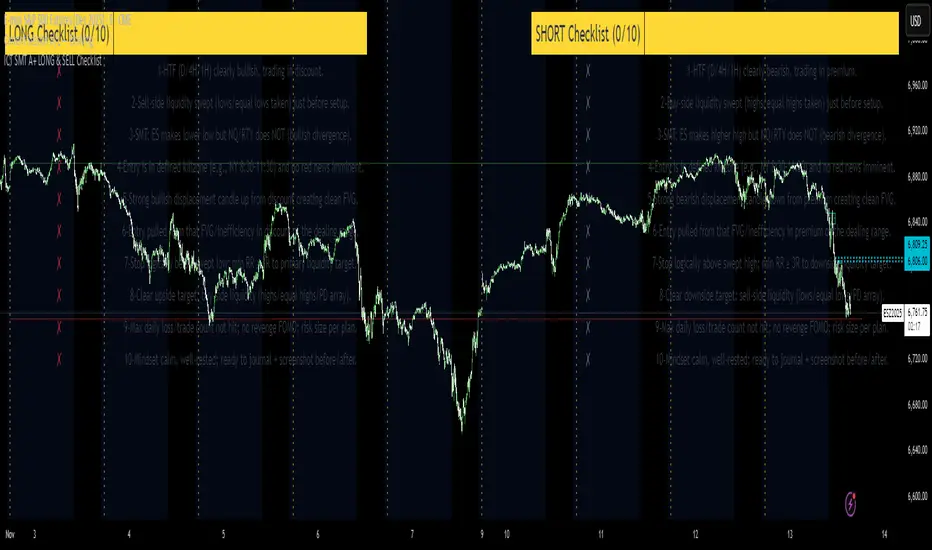
ICT SMT A+ LONG & SELL ChecklistTrade Checklist. Once all items checked color changes from yellow to green. Pine Script® Indikatorvon DaLondonBoy8811
ICT Largest Midnight–00:30 FVG (NY, 1 per day) — FIXEDmarks out the first and largest fvg on the 1 min chart from midnight open until 12:30 am estPine Script® Indikatorvon mattyd42117
ICT Killzones_SAIFKill Zones Shading with High and Low levels highlight for required market sessionsPine Script® Indikatorvon syedsaifalicpa11
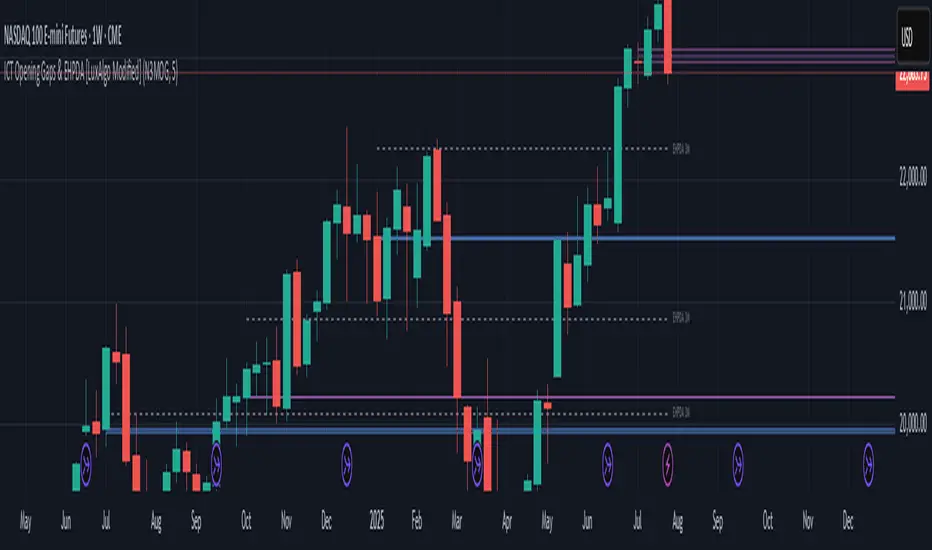
ICT Opening Gaps & EHPDA [LuxAlgo Modified]Modified version of LuxAlgo's original opening gap indicator to include NMOGs and NYOGsPine Script® Indikatorvon JakeTradesIt45
ICT Killzones & Sessions - SA EnhancedAdapts to chart time and adds a "pre-London" indicationPine Script® Indikatorvon ronaldjvanvoorstAktualisiert 124
ICT Macro Tracker° (Open-Source) by PesSpecific time indicator for order effectiveness when US market opensPine Script® Indikatorvon Ngocanhtkm292
ICT SMT Divergence Lines - EnhancedThis indicator identifies and highlights Smart Money Technique (SMT) divergence between two user-selected symbols across any timeframe. It compares the last two completed candles of both symbols and marks potential SMT signals only when market context aligns with smart money principles. ⚡ Key Features ✅ SMT Bullish Signal Symbol 1 forms a lower low compared to its prior candle. Symbol 2 forms a higher low compared to its prior candle. The previous candle on the chart was bearish (close < open). ✅ SMT Bearish Signal Symbol 1 forms a higher high compared to its prior candle. Symbol 2 forms a lower high compared to its prior candle. The previous candle on the chart was bullish (close > open). ✅ Visual Representation Draws a clean, subtle line between the two SMT candles — green for bullish SMT and red for bearish SMT — making divergence easy to spot. Optional small triangle markers above or below the bar where SMT is detected. Old lines are automatically removed to keep the chart uncluttered. ✅ Multi-timeframe compatible Works on any chart timeframe. Compares the last two completed candles in the current chart timeframe, or can be adapted for a fixed higher timeframe.Pine Script® Indikatorvon Ambages81
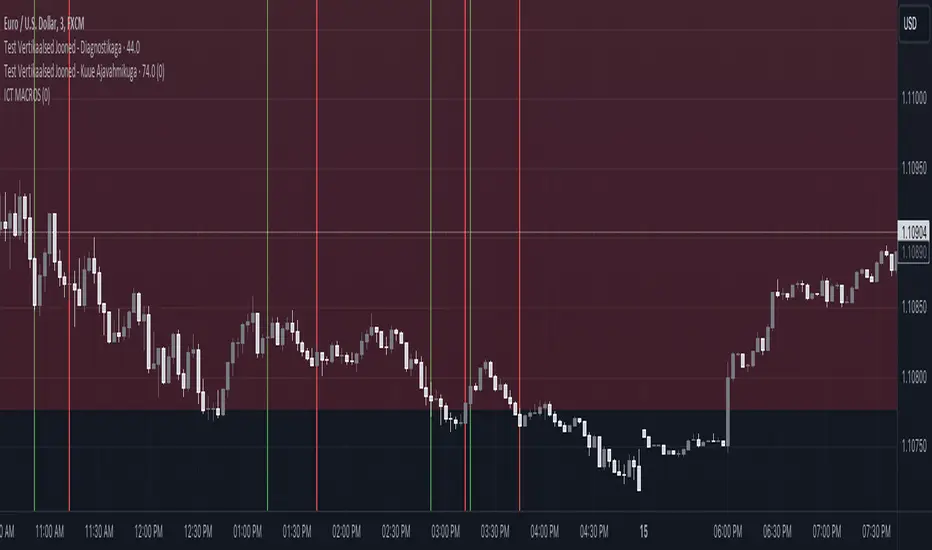
ICT Macro and Daye QT ShiftEST Vertical Lines - Auto DST Adjustment Overview This indicator draws customizable vertical lines at specific Eastern Time (EST/EDT) points throughout the trading day, automatically adjusting for daylight savings time. Designed for precision trading on 1-minute and 5-minute charts, it highlights key intraday moments when price action tends to accelerate. Features - **18 pre-configured NY session times** (09:50-15:45 ET) - **Auto timezone conversion** - Always shows correct EST/EDT regardless of your local timezone - **3 line styles** - Choose between solid/dashed/dotted lines - **Clean labeling** - Optional time markers above each line - **1m/5m optimized** - Perfect for scalpers and day traders - **Visual alerts** - "TOUCH" labels when price interacts with lines Inputs | Parameter | Description | Default | |-----------|-------------|---------| | Line Times | Comma-separated HH:MM times | 09:50,10:10,...15:45 | | Line Color | Line color | Black | | Line Width | 1-5px thickness | 2 | | Line Style | Solid/Dashed/Dotted | Solid | | Show Labels | Display time markers | true | How To Use 1. Apply to 1m or 5m charts 2. Lines appear automatically at specified EST times 3. Watch for price reactions at these key levels 4. Customize styles via indicator settings Ideal For - NY open/London close traders - Earnings/News traders - Breakout traders - Market open/close strategies Updates v1.1 - Added line style customization v1.0 - Initial releasePine Script® Indikatorvon ote61846
ICT Macro H1"H1 Candle Time Box" is a custom TradingView indicator that highlights a configurable time window surrounding the close of each 1-hour (H1) candle. The indicator draws a transparent box 15 minutes before and after each H1 candle close (by default), helping traders visualize time-based reaction zones. 🔍 Features: Custom time window: Users can set how many minutes before and after the H1 close the box should appear. Dynamic positioning: Boxes are drawn slightly above the candles to avoid overlap with price bars. Live time labels: Each box displays its time range (e.g., "08:45 - 09:15") based on the start and end time of the zone. Auto-cleaning: Only a limited number of recent boxes (default: 5) are shown, keeping the chart clean. Requires 1-minute chart for precise timing. This tool is especially helpful for intraday traders to identify areas of interest or market reactions before and after key hourly closes.Pine Script® Indikatorvon bikix6507233
Nirmal Fair Value GapsICT Fair Value Gaps Trade Wisely How a Fair Value Gap Works Formation: A Fair Value Gap occurs when a strong price movement (usually from institutional orders) creates an imbalance between buyers and sellers. This is typically seen in a three-candle pattern, where the middle candle has a large body, and the two surrounding candles have wicks but little overlap with the middle candle’s range. Identification: The FVG is marked between the high of the first candle and the low of the third candle (for bullish gaps). For bearish gaps, it’s the low of the first candle and the high of the third candle. Market Behavior Around FVG: Price often retraces into the gap before resuming its original direction. This happens because the market seeks to "fill" the imbalance where few trades occurred. Traders use FVGs as potential entry zones for trend continuation trades. Trading Fair Value Gaps In an Uptrend: Look for bullish fair value gaps as potential support zones for buy entries. Price may dip into the gap and then continue upward. In a Downtrend: Look for bearish fair value gaps as potential resistance zones for sell entries. Price may retrace into the gap and then drop further. Confluence Factors: FVGs work best when combined with other strategies like order blocks, liquidity zones, or key Fibonacci levels.Pine Script® Indikatorvon TheProBack-Tester128
ICT MACROS (UTC-4)This Pine Script creates an indicator that draws vertical lines on a TradingView chart to mark specific time intervals during the day. It allows the user to see when certain predefined time periods start and end, using vertical lines of different colors. The script is designed to work with time frames aligned to the UTC-4 timezone. ### Key Features of the Script 1. **Vertical Line Drawing Function**: - The script uses a custom function, `draw_vertical_line`, to draw vertical lines at specific times. - This function takes four parameters: - `specificTime`: The specific timestamp when the vertical line should be drawn. - `lineColor`: The color of the vertical line. - `labelText`: The text label for the line (used internally for debugging purposes). - `adjustment_minutes`: An integer value that allows time adjustment (in minutes) to make the lines align more accurately with the chart’s candles. - The function calculates an adjusted time using the `adjustment_minutes` parameter and checks if the current time (`time`) falls within a 3-minute range of the adjusted time. If it does, it draws a vertical line. 2. **User Input for Time Adjustment**: - The `adjustment_minutes` input allows users to fine-tune the appearance of the lines by shifting them slightly forward or backward in time to ensure they align with the chart candles. This is useful because of potential minor discrepancies between the script’s timestamps and the chart’s actual candle times. 3. **Predefined Time Intervals**: - The script specifies six different time intervals (using the UTC-4 timezone) and draws vertical lines to mark the start and end of each interval: - **First interval**: 8:50 - 9:10 AM - **Second interval**: 9:50 - 10:10 AM - **Third interval**: 10:50 - 11:10 AM - **Fourth interval**: 13:10 - 13:40 PM - **Fifth interval**: 14:50 - 15:10 PM - **Sixth interval**: 15:15 - 15:45 PM - For each interval, there are two timestamps: the start time and the end time. The script draws a green vertical line for the start and a red vertical line for the end. 4. **Line Drawing Logic**: - For each time interval, the script calculates the timestamp using the `timestamp()` function with the specified time in UTC-4. - The `draw_vertical_line` function is called twice for each interval: once for the start time (with a green line) and once for the end time (with a red line). 5. **Visual Overlay**: - The script uses the `overlay=true` setting, which means that the vertical lines are drawn directly on top of the existing price chart. This helps in visually identifying the specific time intervals without cluttering the chart. ### Summary This Pine Script is designed for traders or analysts who want to visualize specific time intervals directly on their TradingView charts. It provides a customizable way to highlight these intervals using vertical lines, making it easier to analyze price action or trading volume during key times of the day. The `adjustment_minutes` input adds flexibility to align these lines accurately with chart data.Pine Script® Indikatorvon RevalSalut25
ICT Watermark | FluxxDescription: The watermark indicator is designed to enhance the visual presentation of your trading charts by adding customizable watermarks. This tool allows you to overlay essential information, such as ticker symbols, timeframes, dates, and custom text, directly onto your charts. While providing larger text options then all other watermarks currently available. Key Features: Customizable Watermarks: Users can enable up to two watermarks with adjustable text content, color, size, and position. Dynamic Information Display: Option to display real-time symbol and timeframe details, as well as the current date. Flexible Placement: Watermarks can be positioned at the top, middle, or bottom of the chart, and aligned to the left, center, or right. Multiple Size Options: Includes a variety of text sizes, making the text larger than any other watermark out there! Use Cases: Branding: Add your name or brand to your charts for a personalized touch. Clarity: Overlay important chart details without obstructing the main content, helping in presentations or shared analysis. This indicator is original and valuable for traders who seek to enhance the clarity and professionalism of their charts. It is particularly useful for those who create educational content or wish to maintain consistent chart branding.Pine Script® Indikatorvon FluxxTradesAktualisiert 11107
ICT Premium/DiscountThis script indicator prints lines for the highest, lowest and middle price in a selected time period (in days). With that you can easily see wheter the price is currently high, low or balanced compared to the prices in the selected time period. I also added a gray dotted vertical line to the chart which represents the beginning of your selected time period You can choose the time period on your own and you can also customize the color and style of the lines. Your lines may get printed in a separate window. To fix this, click on the indicator and select Move to -> existing pane above Your lines also may stay stuck on the same place on the chart and are not fixed to a high/low. To fix this, right-click on the left price scale and select Merge all scales into one -> on the rightPine Script® Indikatorvon davidgillesbergerAktualisiert 237
ICT KillZones + Pivot Points [TradingFinder] Support/Resistance 🟣 Introduction Pivot Points are critical levels on a price chart where trading activity is notably high. These points are derived from the prior day's price data and serve as key reference markers for traders' decision-making processes. Types of Pivot Points : Floor Woodie Camarilla Fibonacci 🔵 Floor Pivot Points Widely utilized in technical analysis, floor pivot points are essential in identifying support and resistance levels. The central pivot point (PP) acts as the primary level, suggesting the trend's likely direction. The additional resistance levels (R1, R2, R3) and support levels (S1, S2, S3) offer further insight into potential trend reversals or continuations. 🔵 Camarilla Pivot Points Featuring eight distinct levels, Camarilla pivot points closely correspond with support and resistance, making them highly effective for setting stop-loss orders and profit targets. 🔵 Woodie Pivot Points Similar to floor pivot points, Woodie pivot points differ by placing greater emphasis on the closing price, often resulting in different pivot levels compared to the floor method. 🔵 Fibonacci Pivot Points Fibonacci pivot points combine the standard floor pivot points with Fibonacci retracement levels applied to the previous trading period's range. Common retracement levels used are 38.2%, 61.8%, and 100%. 🟣 Sessions Financial markets are divided into specific time segments, known as sessions, each with unique characteristics and activity levels. These sessions are active at different times throughout the day. The primary sessions in financial markets include : Asian Session European Session New York Session The timing of these major sessions in UTC is as follows : Asian Session: 23:00 to 06:00 European Session: 07:00 to 14:25 New York Session: 14:30 to 22:55 🟣 Kill Zones Kill zones are periods within a session marked by heightened trading activity. During these times, trading volume surges and price movements become more pronounced. The timing of the major kill zones in UTC is : Asian Kill Zone: 23:00 to 03:55 European Kill Zone: 07:00 to 09:55 New York Kill Zone: 14:30 to 16:55 Combining kill zones and pivot points in financial market analysis provides several advantages : Enhanced Market Sentiment Analysis : Aligns key price levels with high-activity periods for a clearer market sentiment. Improved Timing for Trade Entries and Exits : Helps better time trades based on when price movements are most likely. Higher Probability of Successful Trades : Increases the accuracy of predicting market movements and placing profitable trades. Strategic Stop-Loss and Profit Target Placement : Allows for precise risk management by strategically setting stop-loss and profit targets. Versatility Across Different Time Frames : Effective in both short and long time frames, suitable for various trading strategies. Enhanced Trend Identification and Confirmation : Confirms trends using both pivot levels and high-activity periods, ensuring stronger trend validation. In essence, this integrated approach enhances decision-making, optimizes trading performance, and improves risk management. 🟣 How to Use 🔵 Two Approaches to Trading Pivot Points There are two main strategies for trading pivot points: utilizing "pivot point breakouts" and "price reversals." 🔵 Pivot Point Breakout When the price breaks through pivot lines, it signals a shift in market sentiment to the trader. In the case of an upward breakout, where the price crosses these pivot lines, a trader might enter a long position, placing their stop-loss just below the pivot point (P). Conversely, if the price breaks downward, a short position can be initiated below the pivot point. When using the pivot point breakout strategy, the first and second support levels can serve as profit targets in an upward trend. In a downward trend, these roles are filled by the first and second resistance levels. 🔵 Price Reversal An alternative method involves waiting for the price to reverse at the support and resistance levels. To implement this strategy, traders should take positions opposite to the prevailing trend as the price rebounds from the pivot point. While this tool is commonly used in higher time frames, it tends to produce better results in shorter time frames, such as 1-hour, 30-minute, and 15-minute intervals. Three Strategies for Trading the Kill Zone There are three principal strategies for trading within the kill zone : Kill Zone Hunt Breakout and Pullback to Kill Zone Trading in the Trend of the Kill Zone 🔵 Kill Zone Hunt This strategy involves waiting until the kill zone concludes and its high and low lines are established. If the price reaches one of these lines within the same session and is strongly rejected, a trade can be executed. 🔵 Breakout and Pullback to Kill Zone In this approach, once the kill zone ends and its high and low lines stabilize, a trade can be made if the price breaks one of these lines decisively within the same session and then pulls back to that level. 🔵 Trading in the Trend of the Kill Zone Kill zones are characterized by high trading volumes and strong trends. Therefore, trades can be placed in the direction of the prevailing trend. For instance, if an upward trend dominates this area, a buy trade can be entered when the price reaches a demand order block. Pine Script® Indikatorvon TFlab33 1.3 K
ICT Market SessionsThis indicator highlights sessions, kill-zones and significant time elements on the chart based on ITC's method.Pine Script® Indikatorvon mattmaraczi77176
ICT Killzone For Crypto Markets.Adjusted for Crypto 24/7 markets Adjusted for UTC i have hidden the asian open range and daily bars on my charts , you can choose to have them on Less screen clutter London Open 8:00 - 4:30 - Killzone 7:00 - 9:00 NewYork Open 9:30 - 4:00 Killzone 8:00 - 10:00 Shanghai open 9:15 Killzone 8:00 - 10:00 NOT MY ORIGINAL SCRIPT. JUST MODIFIED VERSIONPine Script® Indikatorvon JDcft11436
Flout BoxesICT Flout boxes / CBDR Work in progress - not finishedPine Script® Indikatorvon BryceWHAktualisiert 1919560
Global Sessions & Kill Zones [jpkxyz]Global Sessions & ICT Kill Zones Indicator Overview The Global Sessions & ICT Kill Zones indicator is a comprehensive trading tool designed to help traders identify and visualize the most critical time periods in the 24-hour forex and futures markets. This indicator combines traditional trading session analysis with Inner Circle Trader (ICT) Kill Zone methodology, providing traders with a complete picture of when institutional activity and liquidity are at their peak. Trading Theory & Foundation Session-Based Trading The forex market operates 24 hours a day across four major trading sessions: Sydney, Tokyo, London, and New York. Each session has distinct characteristics in terms of volatility, liquidity, and price behavior. Understanding these sessions is crucial because: Volatility Patterns: Each session exhibits unique volatility profiles based on which markets are open and which institutional players are active Liquidity Concentration: Major price movements tend to occur when multiple sessions overlap, as more market participants are active simultaneously Market Structure: Session highs and lows often act as key support and resistance levels that price respects throughout the trading day Time-Based Strategies: Many professional traders structure their strategies around specific sessions that align with their preferred instruments and trading style ICT Kill Zones The Inner Circle Trader (ICT) methodology emphasizes specific time windows called "Kill Zones" - periods when institutional algorithms and smart money are most active. These time windows represent optimal trading opportunities because: Institutional Activity: Banks, hedge funds, and large institutions execute their orders during these predictable time windows Algorithmic Trading: Many institutional algorithms are programmed to operate during these specific periods Liquidity Sweeps: Kill Zones often feature stop hunts and liquidity grabs before directional moves Higher Probability Setups: Price is more likely to respect technical levels and follow through on setups during these periods The four ICT Kill Zones are: Asian Kill Zone (00:00-03:00 UTC): Early Asian session institutional activity London Kill Zone (07:00-10:00 UTC): London open and European institutional entry New York Kill Zone (12:00-14:00 UTC): New York open and North American institutional entry London Close Kill Zone (15:00-17:00 UTC): European session close and position squaring What This Indicator Visualizes Trading Session Boxes The indicator draws high-to-low range boxes for each major trading session: Sydney Session (21:00-06:00 UTC): Captures the Australian and early Asian trading activity Tokyo Session (00:00-09:00 UTC): Represents the main Asian trading period London Session (08:00-17:00 UTC): Covers the European trading hours New York Session (13:00-22:00 UTC): Encompasses North American trading activity Each session box displays: The session's high and low price levels Customizable colored borders and fills Labels showing the exact high and low values Real-time updates as price moves within the active session Session Overlaps The indicator automatically identifies and highlights all session overlaps with distinct colored boxes: Sydney/Tokyo Overlap: Asian liquidity concentration Tokyo/London Overlap: Asian-European transition period London/New York Overlap: The most volatile period with maximum liquidity Sydney/New York Overlap: Late US session into early Asian session These overlaps are crucial because they represent periods of increased liquidity when multiple major markets are operating simultaneously, often leading to significant price movements and breakouts. ICT Kill Zones Kill Zones are displayed as vertical background highlights that span the entire chart height during their active periods: Visual clarity: Semi-transparent colored backgrounds that don't obstruct price action Label identification: Each Kill Zone is labeled at its start for easy recognition Overlay capability: Kill Zones overlay on top of session boxes, allowing you to see both simultaneously Independent control: Each Kill Zone can be toggled on/off individually How Traders Can Use This Indicator Entry Timing Wait for Kill Zones: Use Kill Zones as your primary trading windows to increase the probability of institutional support for your trades Session Boundaries: Look for breakouts or reversals at session open/close times when new participants enter the market Overlap Periods: Focus on high-conviction setups during session overlaps when liquidity is highest Support & Resistance Session Highs/Lows: Previous session highs and lows often act as key support/resistance levels Sweep Setups: Watch for price to sweep session highs/lows during Kill Zones, then reverse (liquidity grab) Range Trading: Trade within session ranges during low-volatility periods, breakout during overlaps Risk Management Volatility Awareness: Adjust position sizing based on which session is active (London/NY overlap = highest volatility) Stop Placement: Position stops outside of key session levels to avoid being caught in normal intraday ranges Time-Based Exits: Consider exiting or tightening stops as sessions close and liquidity decreases Strategy Development Session-Specific Strategies: Develop different approaches for different sessions based on your instrument's behavior Kill Zone Confirmation: Require setups to occur within Kill Zones for higher probability trades Backtesting Framework: Use historical session and Kill Zone data to backtest time-based strategies Full Customizability Session Customization Every aspect of each trading session can be customized: Toggle Visibility: Show/hide any session independently Time Adjustment: Modify start and end hours to match your broker's server time or personal preference Color Schemes: Customize box colors and border colors for each session Transparency: Adjust fill transparency to see price action clearly while maintaining visual reference Kill Zone Customization Complete control over ICT Kill Zone display: Individual Toggles: Enable or disable each Kill Zone independently based on your trading style Color Selection: Choose distinct colors for each Kill Zone (default: Green, Blue, Yellow, Red) Transparency Control: All Kill Zones use 70% transparency by default, fully customizable Label Display: Toggle Kill Zone labels on/off via the main label settings Visual Preferences Border Control: Toggle session box borders on/off for cleaner charts Label Size: Choose from tiny, small, normal, large, huge, or auto-sizing for all labels Label Colors: Customize label background and text colors to match your chart theme Box Transparency: Set individual transparency levels for each session and overlap Overlap Customization All four session overlaps have independent color controls: Sydney/Tokyo Overlap Tokyo/London Overlap London/New York Overlap Sydney/New York Overlap Technical Features Midnight Handling The indicator uses advanced hour-based detection that seamlessly handles sessions crossing midnight (like Sydney's 21:00-06:00 UTC timeframe) without breaking the visualization into separate boxes. Real-Time Updates Active Sessions: Boxes extend and update in real-time as price moves during active sessions High/Low Tracking: Session highs and lows are continuously updated until the session closes Kill Zone Detection: Background colors appear/disappear precisely at Kill Zone boundaries Clean Chart Integration Minimal Clutter: Only shows active and recently completed sessions Overlay Friendly: Works seamlessly with other indicators and doesn't obstruct price action Performance Optimized: Efficient code that doesn't slow down chart rendering Ideal For Forex Traders: Track the four major forex sessions and plan trades around overlaps Futures Traders: Identify when specific futures markets have peak activity ICT Students: Implement Inner Circle Trader concepts with visual Kill Zone references Session Traders: Build strategies around specific session characteristics Scalpers & Day Traders: Focus on high-liquidity periods for tighter spreads and better fills Swing Traders: Use session levels as key support/resistance for multi-day trades Best Practices Start Simple: Enable only the sessions and Kill Zones relevant to your instruments Color Code Strategically: Use colors that stand out on your chart theme but don't overwhelm Combine with Price Action: Use session levels and Kill Zones as context, not as standalone signals Match Your Timezone: Adjust session times if your broker uses non-UTC server time Focus on Overlaps: Pay special attention to London/New York overlap for highest-probability setups Journal Performance: Track which sessions and Kill Zones work best for your strategy Conclusion The Global Sessions & ICT Kill Zones indicator provides traders with institutional-grade time-based analysis in a highly customizable, visually clear format. By combining traditional session analysis with modern ICT Kill Zone theory, traders gain a comprehensive understanding of when markets are most likely to move and where key levels are established. Whether you're a scalper looking for the highest liquidity periods or a swing trader using session levels for support/resistance, this indicator adapts to your needs while keeping your charts clean and professional. Trade smarter by trading when the market is most active and predictable.Pine Script® Indikatorvon GLITCHCAPITAL31
Trading Macro Windows by BW v2 Trading Macros by BW: Integrating ICT Concepts for Session Analysis This indicator combines two key Inner Circle Trader (ICT) concepts—Change in State of Delivery (CISD) or Inverted Fair Value Gap (IFVG) signals with Macro Time Windows—to provide a unified tool for analyzing intraday price action, particularly during Pacific Time (PT) sessions. Rather than simply merging existing scripts, this integration creates a cohesive visual framework that highlights how macro consolidation periods interact with potential reversal or continuation signals like CISD or IFVG. By overlaying macro candle styling and borders on the chart alongside selectable signal lines, traders can better contextualize setups within ICT's macro narrative, where price often manipulates liquidity during these windows before displacing toward higher-timeframe objectives. Core Components and How They Work Together: Macro Time Windows (Inspired by ICT's Macro Periods): ICT emphasizes "macro" as 30-minute windows (e.g., 06:45–07:15 PT, 07:45–08:15 PT, up to 11:45–12:15 PT) where price tends to consolidate, sweep liquidity, or form key structures like Fair Value Gaps (FVGs). These periods set the stage for the session's directional bias. The indicator styles candles within these windows using a user-defined color for wicks, borders, and bodies (translucent for visibility). This visual emphasis helps traders focus on activity inside macros, where reversals or continuations often originate. Borders are drawn as vertical lines at the start and end of each window (with a +5 minute buffer to capture related activity), using a dotted style by default. This creates a "study zone" that encapsulates macro events, allowing traders to assess if price is respecting or violating these zones in alignment with broader ICT models like the Power of 3 (AMD cycle). Toggle: "Macro Candles Enabled" (default: true) – Turn off to disable styling and borders if focusing solely on signals. CISD or IFVG Signals (Selectable Mode): Mode Selection: Choose between "Change in the State of Delivery" (CISD) or "IFVG" (default: IFVG). Both detect shifts in market delivery during specific 30-minute slices (15–45 or 17–45 minutes past the hour in PT sessions). CISD Mode: Based on ICT's definition of a sudden directional shift, this identifies aggressive displacements after sweeping recent highs/lows. It uses a rolling reference high/low over 6 bars, checks for sweeps (penetrating by at least 2 ticks in the last 2-3 bars), reclamation (closing beyond the reference with at least 50% body), and displacement (50% of prior range or an immediate FVG of 6+ ticks). Signals plot a horizontal line from the close, extending 24 bars right, labeled "CISD." IFVG Mode: Focuses on Inverted Fair Value Gaps, where a bullish FVG (low > high by 13+ ticks) forms but is inverted (closed below) in the same slice, signaling bearish intent (or vice versa). This targets violations against opposing liquidity, often leading to raids on external ranges. Signals plot similarly, labeled "IFVG." Shared Logic: Both modes enforce a 55-bar cooldown to prevent clustering, operate only during PT sessions (06:30–13:00), and use tick-based thresholds for precision across instruments. The integration with macros allows traders to see if signals occur within or at the edges of macro windows, enhancing confirmation—for example, a CISD inside a macro might indicate a manipulated reversal toward the session's true objective. Toggle: "Signals Enabled" (default: true) – Turn off to hide all signal lines and labels, isolating the macro visualization. How Components Interact: Macro windows provide the "narrative context" (consolidation/manipulation), while CISD/IFVG signals detect the "delivery shift" (displacement). Together, they form a mashup that justifies publication: isolated signals can be noisy, but when filtered by macro periods, they align with ICT's session model. For instance, an IFVG inversion during a macro might confirm a liquidity sweep before targeting PD arrays or order blocks. No external dependencies; all calculations are self-contained using Pine's built-in functions like ta.highest/lowest for references and time-based sessions for windows. Usage Guidelines: Apply to intraday charts (e.g., 1-5 min) or stocks during PT hours. Look for confluence: A bull IFVG signal post-macro low sweep might target the next macro high or daily bias. Customize colors/styles for signals (solid/dashed/dotted lines) and macros to suit your chart. Backtest in replay mode to observe how macros frame signals—e.g., price often respects macro borders as S/R. Limitations: Timezone-fixed to PT (America/Los_Angeles); signals are directional hints, not trade entries. Combine with ICT tools like order blocks or liquidity pools for full setups. This script draws from community ICT implementations but refines them into a single, purpose-built tool for macro-driven trading, reducing chart clutter while emphasizing interconnected concepts. Feedback welcome!Pine Script® Indikatorvon brandowu2329
Midnight Range Standard DeviationsCredit to Lex Fx for the basic framework of this script This indicator is designed to assist traders in identifying potential trading opportunities based on the Intraday Concurrency Technique (ICT) concepts, specifically the midnight range deviations and their relationship to Fibonacci levels. It builds upon the work of Lex-FX, whom we gratefully acknowledge for the original concept and inspiration for this indicator. Core Concept: ICT Midnight Range The core of this indicator revolves around the concept of the midnight range. According to ICT, the high and low formed in a specific time window (typically the first 30 minutes after midnight, New York Time) can serve as a key reference point for intraday price action. The indicator identifies this range and projects potential support and resistance levels based on deviations from this range, combined with Fibonacci ratios. How ICT Uses Midnight Range Deviations ICT methodology often involves looking for price to move away from the initial midnight range, then return to it, or deviate beyond it, as key areas for potential entries. Range Identification: The indicator automatically identifies the high and low of the midnight range (00:00 - 00:30 NY Time). Deviation Levels: The indicator calculates and displays deviation levels based on multiples of the initial midnight range. These levels are often used to identify potential areas of support and resistance, as well as potential targets for price movement. These levels can be set in the additional fib levels section, which can be configured in increments of .5 deviations all the way up to 12 deviations. Fibonacci Confluence: ICT often emphasizes the confluence of multiple factors. This indicator adds Fibonacci levels to the midnight range deviations. This allows traders to identify areas where Fibonacci retracements or extensions align with the deviation levels, potentially creating stronger areas of support or resistance. Looking for Sweeps: ICT often uses these levels to look for times that the high and low are swept as potential areas of liquidity, indicating the start of potential continuations. Time-Based Analysis: The time at which price interacts with these levels can also be significant in ICT. The indicator provides options to extend the range lines to specific times (e.g., 3 hours, 6 hours, 10 hours, 12 hours, or a custom defined time) after midnight, allowing traders to focus on specific periods of the trading day. Indicator Settings Explained: Time Zone (TZ): Defines the time zone used for calculating the midnight range. The default is "America/New_York". Range High Color, Range Low Color, Range Mid Color: Customize the colors of the high, low, and mid-range lines. Range Fill Color: Sets the fill color for the area between the range high and low. Line Style: Choose the style of the range lines (solid, dashed, dotted). Range Line Thickness: Adjust the thickness of the range lines for better visibility. Show Fibonacci Levels: Enable or disable the display of Fibonacci deviation levels. Fib Up Color, Fib Down Color: Customize the colors of the Fibonacci levels above (up) and below (down) the midnight range. Show Trendline: Enables a trendline that plots the close price, colored according to whether the price is above the high, below the low, or within the midnight range. Show Range Lines, Show Range Labels: Toggles the visibility of the range lines and their associated labels. Label Size: Adjust the size of the labels for better readability. Hide Prices: Option to display only the deviation values on labels, hiding price values. Place Fibonacci Labels on Left Side: Option to switch label position from right side to left side. Extend Range To (Hours from Midnight): This section gives you a wide variety of options on how far you want to extend the range to, you can do 3,6,10,12, and 23 hours. Alternatively, you can select the "Use Custom Length" and set a specific time in hours. Additional Fib Levels: This section allows the trader to set additional deviation points in increments of .5 deviations from .5 all the way up to 12 deviations TradingView Community Guidelines Compliance: This indicator description adheres to the TradingView community guidelines by: Being educational: It explains the ICT methodology and how the indicator can be used in trading. Being transparent: It clearly describes all the indicator's settings and their purpose. Providing credit: It acknowledges Lex-FX as the original author of the concept. Avoiding misleading claims: It does not guarantee profits or imply that the indicator is a "holy grail." Disclaimer: Usage of this indicator and the information provided is at your own risk. The author is not responsible for any losses incurred as a result of using this indicator. Important Considerations: This indicator is intended for educational purposes and to assist in applying the ICT methodology. It should not be used as a standalone trading system. Always combine this indicator with other forms of technical analysis and risk management techniques. Backtest thoroughly on your chosen market and timeframe before using in live trading. Trading involves risk. Only trade with capital you can afford to lose.Pine Script® Indikatorvon SpxGh0stAktualisiert 119
ATR/ADR MTF Projection ArrayATR/ADR MTF Projection Array Overview A powerful predictive tool that projects ATR (Average True Range) and ADR (Average Daily Range) levels as clean support and resistance arrays on your chart. Designed for traders who want to anticipate the high and low of the day using volatility-based projections with multi-timeframe confluence. This indicator combines traditional ATR analysis with ICT-style ADR methodology, giving you institutional-grade level projections from a single, customizable tool. Key Features 🎯 Dual Volatility Metrics ATR Projections — Classic volatility-based levels with full multi-timeframe support ADR Projections (ICT Style) — Average Daily Range levels using Inner Circle Trader methodology Enable/disable each independently based on your trading preference 📊 Multi-Timeframe ATR Analysis Plot ATR levels from up to 3 timeframes simultaneously (Daily, Weekly, Monthly or custom) Each timeframe displays with distinct styling for easy identification Perfect for confluence trading across multiple time horizons ⚡ ICT ADR Methodology NY Midnight calculation mode (ICT standard) or Classic Daily Key ICT levels built-in: 1/3 ADR (Judas Swing) — Critical manipulation level where fake moves often terminate 1/2 ADR — Mid-range reference 2/3 ADR — Trending day continuation target 100% ADR — Full daily range completion 150% ADR — Extension target for expansion days Two projection modes: Static (from anchor) or Dynamic (from session high/low) 🔧 Flexible Anchor Points Previous Close (default) Daily Open Weekly Open Monthly Open Session Open 📈 Range Completion Tracking Real-time display of how much of the expected daily range has been consumed Visual status indicator helps identify when the day's move may be exhausted How To Use For Bias Confirmation: Establish your directional bias using your preferred method (trigger day, market structure, etc.) Monitor the 1/3 ADR level during London/NY open for potential Judas Swing (manipulation move) Target 2/3 to 100% ADR for your HOD/LOD objective For Target Setting: Use ATR levels as volatility-based profit targets ADR 100% level often marks session extremes When Range Used reaches 100%+, expect consolidation or reversal For Multi-Timeframe Confluence: Enable Weekly/Monthly ATR levels alongside Daily Look for clustering of levels across timeframes for high-probability zones Settings Guide Master Controls — Toggle ATR/ADR systems and bull/bear levels independently ATR Settings — Configure period, multiplier, anchor point, and select which timeframes to display ATR Level Multipliers — Choose which projection levels to show (0.5x, 0.75x, 1.0x, 1.25x, 1.5x) ADR Settings (ICT Style) — Select calculation mode (NY Midnight recommended), period (5 days is ICT standard), and projection mode ADR Level Selection — Toggle individual ICT levels (1/3, 1/2, 2/3, 100%, 150%) Visual Settings — Customize colors, line styles, labels, and info table position Alerts Included ATR 1.0x Bull/Bear Cross ADR 1/3 Judas Swing Zone (Bull/Bear) ADR 100% Range Completion (Bull/Bear)Pine Script® Indikatorvon TSA_TimeSpaceAlgorithm15
Sunmool's Next Day Model FVG AlertNY Killzone FVG Alert - ICT Fair Value Gap Detection Indicator This comprehensive Pine Script indicator is specifically designed for traders following ICT (Inner Circle Trader) methodology and Smart Money Concepts. The indicator automatically detects Fair Value Gaps (FVG) that occur during the New York Killzone session, providing real-time alerts when these critical market imbalances are identified. Key Features: 🎯 Fair Value Gap Detection Automatically identifies bullish and bearish Fair Value Gaps using the classic 3-candle pattern Filters gaps based on customizable minimum size thresholds to avoid insignificant imbalances Provides visual representation through colored boxes and labels for easy identification ⏰ New York Killzone Focus Specifically monitors the NY Killzone session (default: 7:00 AM - 10:00 AM EST) Fully customizable session times to accommodate different trading preferences Only detects FVGs when all three candles forming the gap occur within the killzone timeframe 📅 ICT Next Day Model Compliance Automatically excludes Mondays from FVG detection as per ICT Next Day Model principles Optional Monday exclusion can be toggled on/off based on trading strategy Ensures alignment with professional ICT trading methodologies 🔔 Advanced Alert System Three distinct alert conditions: Bullish FVG, Bearish FVG, and Combined alerts Customizable alert messages for different notification preferences Compatible with TradingView's full alert system including email, SMS, and webhook notifications 🎨 Visual Customization Adjustable colors for bullish and bearish FVG boxes Configurable box extension length for better visualization Optional background highlighting during killzone sessions Clean, professional chart presentation that doesn't clutter your analysis 📊 Technical Specifications Works on all timeframes, though most effective on intraday charts (1m, 5m, 15m) Timezone-aware calculations ensure accurate session detection globally Efficient code structure minimizes processing load and chart lag Compatible with other indicators and doesn't interfere with existing chart setups 🎯 Ideal For: ICT methodology traders seeking automated FVG detection Smart Money Concepts practitioners Scalpers and day traders focusing on NY session Traders looking to identify high-probability entry zones Anyone interested in market structure and liquidity concepts 📈 Trading Applications: Fair Value Gaps often serve as areas where price may return to "fill" the imbalance, making them excellent zones for: Potential reversal areas Take profit targets Stop loss placement reference points Market structure analysis Confluence with other ICT concepts ⚙️ Customizable Parameters: FVG minimum size filter Killzone session start/end times Visual display options Alert preferences Color schemes and styling options This indicator brings institutional trading concepts to retail traders, helping identify the same market inefficiencies that smart money targets. By focusing specifically on the New York Killzone - one of the most liquid and volatile trading sessions - it provides high-quality signals during optimal market conditions. Whether you're new to ICT concepts or an experienced trader looking to automate your FVG detection, this indicator provides the precision and reliability needed for professional trading analysis.Pine Script® Indikatorvon sunmool_118
One for AllOne for All (OFA) - Complete ICT Analysis Suite Version 3.3.0 by theCodeman 📊 Overview One for All (OFA) is a comprehensive TradingView indicator designed for traders who follow Inner Circle Trader (ICT) concepts. This all-in-one tool combines essential ICT analysis features—sessions, kill zones, previous period levels, and higher timeframe candles with Fair Value Gaps (FVGs) and Volume Imbalances (VIs)—into a single, highly customizable indicator. Whether you're a beginner learning ICT concepts or an experienced trader refining your edge, OFA provides the visual structure needed for precise market analysis and execution. ✨ Key Features - 🏷️ Customizable Watermark**: Display your trading identity with customizable titles, subtitles, symbol info, and full style control - 🌍 Trading Sessions**: Visualize Asian, London, and New York sessions with high/low lines, range boxes, and open/close markers - 🎯 Kill Zones**: Highlight 5 critical ICT kill zones with precise timing and visual boxes - 📈 Previous Period H/L**: Track Daily, Weekly, and Monthly highs/lows with customizable styles and lookback periods - 🕐 Higher Timeframe Candles**: Display up to 5 HTF timeframes with OHLC trace lines, timers, and interval labels - 🔍 FVG & VI Detection**: Automatically detect and visualize Fair Value Gaps and Volume Imbalances on HTF candles - ⚙️ Universal Timezone Support**: Works globally with GMT-12 to GMT+14 timezone selection - 🎨 Full Customization**: Control colors, styles, visibility, and layout for every feature 🚀 How to Use Watermark Setup The watermark overlay helps you identify your charts and maintain focus on your trading principles: 1. Enable/disable watermark via "Show Watermark" toggle 2. Customize the title (default: "Name") to display your trading name or account identifier 3. Set up to 3 subtitles (default: "Patience", "Confidence", "Execution") as trading reminders 4. Choose position (9 locations available), size, color, and transparency 5. Toggle symbol and timeframe display as needed Use Case: Display your trading principles or account name for multi-monitor setups or content creation. Trading Sessions Analysis Sessions define market character and liquidity availability: 1. Enable "Show All Sessions" to visualize all three sessions 2. Adjust timezone to match your local market (default: UTC-5 for EST) 3. Customize session times if needed (defaults cover standard hours) 4. Enable session range boxes to see consolidation zones 5. Use session high/low lines to identify key levels for the current session 6. Enable open/close markers to track session transitions Use Case: Identify which session you're trading in, track session highs/lows for liquidity, and anticipate session transition volatility. Kill Zones Trading Kill zones are ICT's high-probability trading windows: 1. Enable individual kill zones or use "Show All Kill Zones" 2. **Asian Kill Zone** (2000-0000 GMT): Early positioning and smart money accumulation 3. **London Kill Zone** (0300-0500 GMT): European market opening volatility 4. **NY AM Kill Zone** (0930-1100 EST): Post-NYSE open expansion 5. **NY Lunch Kill Zone** (1200-1300 EST): Midday consolidation or manipulation 6. **NY PM Kill Zone** (1330-1600 EST): Afternoon positioning and closes 7. Customize colors and times to match your trading style 8. Set max days display to control historical visibility (default: 30 days) Use Case: Focus entries during high-probability windows. Watch for liquidity sweeps at kill zone openings and institutional positioning. Previous Period High/Low Levels Previous period levels act as magnetic price targets and support/resistance: 1. Enable Daily (PDH/PDL), Weekly (PWH/PWL), or Monthly (PMH/PML) levels individually 2. Set lookback period (how many previous periods to display) 3. Choose line style: Solid (current emphasis), Dashed (standard), or Dotted (subtle) 4. Customize colors per timeframe for visual hierarchy 5. Adjust line width (1-5) for visibility preference 6. Enable gradient effect to fade older periods 7. Position labels left or right based on chart layout 8. Customize label text for your preferred notation Use Case: Identify key levels where price is likely to react. Daily levels work on intraday timeframes, Weekly on daily charts, Monthly for swing trading. Higher Timeframe (HTF) Candles HTF candles reveal the larger market context while trading lower timeframes: 1. Enable up to 5 HTF slots simultaneously (default: 5m, 15m, 1H, 4H, Daily) 2. Choose display mode: "Below Chart" (stacked rows) or "Right Side" (compact column) 3. Customize timeframe, colors (bull/bear), and titles for each slot 4. **OHLC Trace Lines**: Visual lines connecting HTF candle levels to chart bars 5. **HTF Timer**: Countdown showing time remaining until HTF candle close 6. **Interval Labels**: Display day of week (Daily+) or time (intraday) on each candle 7. For Daily candles: Choose open time (Midnight, 8:30, 9:30) to match your market structure preference Use Case: Trade lower timeframes while respecting higher timeframe structure. Watch for HTF candle closes to confirm directional bias. FVG & VI Detection Fair Value Gaps and Volume Imbalances highlight inefficiencies that price often revisits: 1. **Fair Value Gaps (FVGs)**: Detected when HTF candle wicks don't overlap between 3 consecutive candles - Bullish FVG: Gap between candle 1 high and candle 3 low (green box by default) - Bearish FVG: Gap between candle 1 low and candle 3 high (red box by default) 2. **Volume Imbalances (VIs)**: Similar detection but focuses on body gaps - Bullish VI: Gap between candle 1 close and candle 3 open - Bearish VI: Gap between candle 1 open and candle 3 close 3. Enable FVG/VI detection per HTF slot individually 4. Customize colors and transparency for each imbalance type 5. Boxes appear on chart at formation and remain visible as retracement targets **Use Case**: Identify high-probability retracement zones. Price often returns to fill FVGs and VIs before continuing the trend. Use as entry zones or profit targets. 🎨 Customization OFA is built for flexibility. Every feature includes extensive customization options: Visual Customization - **Colors**: Independent color control for every element (sessions, kill zones, lines, labels, FVGs, VIs) - **Transparency**: Adjust box and label transparency (0-100%) for clean charts - **Line Styles**: Choose Solid, Dashed, or Dotted for previous period lines - **Sizes**: Control text size, line width, and box borders - **Positions**: Place watermark in 9 positions, labels left/right Layout Control - **HTF Display Mode**: "Below Chart" for detailed analysis, "Right Side" for space efficiency - **Drawing Limits**: Set max days for sessions/kill zones to manage chart clutter - **Lookback Periods**: Control how many previous periods to display (1-10) - **Gradient Effects**: Enable fading for older previous period lines Timing Adjustments - **Timezone**: Universal GMT offset selector (-12 to +14) for global markets - **Session Times**: Customize each session's start/end times - **Kill Zone Times**: Adjust kill zone windows to match your market's characteristics - **Daily Open**: Choose Midnight, 8:30, or 9:30 for Daily HTF candle open time 💡 Best Practices 1. Start Simple: Enable one feature at a time to learn how each element affects your analysis 2. Match Your Timeframe: Use Daily levels on intraday charts, Weekly on daily charts, HTF candles one or two levels above your trading timeframe 3. Kill Zone Focus: Concentrate your trading activity during kill zones for higher probability setups 4. HTF Confirmation: Wait for HTF candle closes before committing to directional bias 5. FVG/VI Entries: Look for price to return to unfilled FVGs/VIs for entry opportunities with favorable risk/reward 6. Customize Colors: Use a consistent color scheme that matches your chart theme and reduces visual fatigue 7. Reduce Clutter: Disable features you're not actively using in your current trading plan 8. Session Context: Understand which session controls the market—trade with session direction or anticipate reversals at session transitions ⚙️ Settings Guide OFA organizes settings into logical groups for easy navigation: - **═══ WATERMARK ═══**: Title, subtitles, position, style, symbol/timeframe display - **═══ SESSIONS ═══**: Enable/disable sessions, times, colors, high/low lines, boxes, markers - **═══ KILL ZONES ═══**: Individual kill zone toggles, times, colors, max days display - **═══ PREVIOUS H/L - DAILY ═══**: Daily high/low lines, style, color, lookback, labels - **═══ PREVIOUS H/L - WEEKLY ═══**: Weekly high/low lines, style, color, lookback, labels - **═══ PREVIOUS H/L - MONTHLY ═══**: Monthly high/low lines, style, color, lookback, labels - **═══ HTF CANDLES ═══**: Global display mode, layout settings - **═══ HTF SLOT 1-5 ═══**: Individual HTF configuration (timeframe, colors, title, FVG/VI detection, trace lines, timer, interval labels) Each setting includes tooltips explaining its function. Hover over any input for detailed guidance. 📝 Final Notes One for All (OFA) represents a complete ICT analysis toolkit in a single indicator. By combining watermark customization, session visualization, kill zone highlighting, previous period levels, and higher timeframe candles with FVG/VI detection, OFA eliminates the need for multiple indicators cluttering your chart. **Version**: 3.3.0 **Author**: theCodeman **Pine Script**: v6 **License**: Mozilla Public License 2.0 Start with default settings to learn the indicator's structure, then customize extensively to match your personal trading style. Remember: tools provide information, but your edge comes from disciplined execution of a proven strategy. Happy Trading! 📈 Pine Script® Indikatorvon Arslan_cs97