ICT Killzones & Pivots [TFO] + VWAP (NY Anchor)Made this for me, Enjoy it if it works for you ICT killzones + Vwap entry model from new york open with alerts Pine Script® Indikatorvon ethanclements41147
ICT Levels PDH/PDL/IB/JP/WH/WL/PDCA lightweight reference-level indicator designed for ICT-style execution and prop-evaluation trading. This script plots only the core, high-signal levels used intraday: Prior Day High / Low (PDH / PDL) Initial Balance High / Low (IBH / IBL) Job Pivot (previous day pivot) Weekly High / Low PDC Right-anchored labels for quick price reference No signals, no bias — levels only Pine Script® Indikatorvon godzcopilotAktualisiert 20
ICT Fair Value Gaps [Zero-Noise Edition]ICT Fair Value Gaps Overview In the Smart Money Concepts (SMC) framework, clarity is the ultimate edge. Most FVG indicators clutter your screen with "ghost boxes" that remain long after they have been filled. This professional-grade tool identifies high-displacement institutional imbalances and automatically dissolves them the moment they are mitigated. Key Features Precision Detection : Uses the classic 3-candle displacement logic to identify institutional gaps. Auto-Mitigation : Boxes are removed the moment price retraces and "fills" the imbalance, keeping your chart 100% clean. High Performance : Optimized with array-based logic for zero-lag performance on all timeframes. Built-in Alerts : Stay informed with real-time notifications when new institutional displacement occurs. How to Trade This Tool The Trigger : A new FVG box appears, confirming institutional "intent." The Draw : Treat the open boxes as magnets for price (Draw on Liquidity). The Entry : Wait for price to retrace and tap the edge of the "open" FVG. The Exit : Use opposing mitigated zones or swing points for targets. Customizable Settings Visuals : Custom color palettes for Bullish and Bearish imbalances. Labels : Toggle "FVG" text on or off for a minimalist HUD experience. Logic : Option to hide filled gaps completely for the ultimate zero-noise experience. Global Compatibility Tested and optimized for: Forex : EURUSD, GBPUSD, AUDUSD. Indices : US30, NAS100, DAX40. Commodities : Gold (XAUUSD), Silver, Oil. Crypto : BTCUSD, ETHUSD. Authors Note This script is written in Pine Script v6 . It is designed for traders who prioritize accuracy over "noisy" indicators. If you find value in this tool, please leave a Boost and follow for more SMC tool releases!Pine Script® Indikatorvon TJT_Pro42
ICT Big Round Numbers (00, 20, 50, 80)This indicator plots "Big Round Numbers", a term for "psychological" or "institutional" forex price levels that occur at 00, 20, 50, & 80 levels in FX markets. The concept is from the work of Michael J. Huddleston aka The Inner Circle Trader ( ICT ). www.youtube.comPine Script® Indikatorvon j5jx5s15
ICT Master: Type-Safe Sessions & FVGsasia, london , new york session and killzones used by ict and other top tradersPine Script® Indikatorvon garethsteadman47Aktualisiert 48
ICT Visible Center-Label CISD & FVGsThis indicator provides a clean, institutional-grade view of market shifts and liquidity gaps, specifically optimized for ICT (Inner Circle Trader) concepts. Core Components CISD (+/-): Identifies a "Change in State of Delivery." A (+) indicates a bullish shift, while a (-) indicates a bearish shift. These appear as fixed black lines with labels that delete automatically once price breaches the level. Multi-Timeframe FVGs: Automatically plots Fair Value Gaps from the 5m, 15m, 1H, and 4H timeframes simultaneously. Center-Locked Labels: Timeframe labels (e.g., "1H") are centered within the gaps, making them easy to identify without scrolling back through price history. Auto-Cleaning Logic: To keep your chart clutter-free, gaps and CISD levels are instantly removed from the screen the moment they are mitigated (filled) by price.Pine Script® Indikatorvon garethsteadman47Aktualisiert 85
ICT Weekly Lines [OPEN/MID]This indicator plots two core weekly reference levels: - Weekly Open: the opening price of the current confirmed week (a common “weekly anchor”). - Weekly Mid: the 50% level of the previous confirmed week’s range. Why weekly levels matter Weekly levels act like “macro structure” on lower timeframes. Even if you trade 1m–15m, price often reacts around weekly anchors because they’re widely watched and represent higher-timeframe positioning. Practical use cases 1. Directional bias filter - Above Weekly Open → bullish tilt / “premium” willingness. - Below Weekly Open → bearish tilt / “discount” willingness. 2. Mean reversion vs continuation - Weekly Mid often behaves like a “magnet” in balanced conditions. - Strong trends can use it as a “pullback boundary” (hold mid → continuation, reclaim mid → reversal attempts). 3. Stop/target structure - Weekly Open/Mid can act as logical target zones or invalidation lines because they’re higher-timeframe derived.Pine Script® Indikatorvon leonwang14820
ICT 1m FVG - Universal ToggleThis indicator is designed for ICT (Inner Circle Trader) style traders who prioritise displacement and Fair Value Gaps (FVG) on the 1-minute timeframe but execute or analyse on higher timeframes like the 15-minute. FVGs are create after a swing point is created on the 15m time frame. i am struggling to get the FVGs to remain visible on the higher time framesPine Script® Indikatorvon SmithD13
ICT FVG MNQ (Fixed Stop + Multi-TP Toggles)use- 18 min timeframe. ICT FVG - use on MNQ 18 min time frame. it has muti TP levels.- Prop firm compatible. Enjoy tradingPine Script® Strategievon bhavneetsinghwalia43
ICT Immediate RebalanceThe ICT Concept, whereby as soon as it is created, the price makes a strong movement in its favor, requires two "Wicks" to coincide at the same level or for there to be an overlap of no more than 2 Pips, a function that this Indicator fulfills to detect them.Pine Script® Indikatorvon Alvaro_Castellano1112
ICT Smart Money Strategy (Working Version)aegon its based on ict version of mss fvg ob htf biasedPine Script® Indikatorvon TARGARYENAEGON79
ICT First Presented FVG with Volume Imbalance [1st P. FVG + VI]The indicator identifies and highlights the first presented Fair Value Gap (FVG) occurringthe morning (09:30–10:00) and afternoon (13:30–14:00) session's first 30 minutes. It includes an optional feature to extend FVG zones when a volume imbalance (V.I.) is detected, providing additional context for areas of potential price inefficiency. This powerful combination helps traders identify significant market structure gaps that often act as support/resistance zones and potential price targets. What is an FVG? A Fair Value Gap, often abbreviated as FVG, is a price range on a chart where there is an inefficiency or imbalance in trading. This typically happens when price moves rapidly in one direction, leaving a gap between the wicks or bodies of three consecutive candles. For example, in a bullish move, if the low of the third candle is higher than the high of the first candle, the space between them is the FVG. What is a Volume Imbalance? A volume imbalance is a smaller, more precise inefficiency within price action, often visible as a "crack" or thin area in the price delivery. It represents a spot where the volume traded was not balanced between buyers and sellers, often seen as a thin wick or a gap between candle bodies. FVG + Volume Imbalance: When you have a fair value gap that contains a volume imbalance, it becomes a more significant area of interest. ICT teaches that you should not ignore a volume imbalance if it’s part of an FVG. In fact, you should use the volume imbalance in conjunction with the FVG to define your trading range more accurately 📊 Volume Imbalance Integration Toggle Option: Enable/disable volume imbalance detection based on preference Extended Boundaries: When enabled, FVG boundaries expand to include volume imbalance zones Accurate Gap Sizing: Total gap calculation includes volume imbalance extensions Multi-Scenario Support: Handles volume imbalances at start, end, or both sides of FVG formations 📈 Multiple Display Modes Current Day: Shows only today's FVGs for clean chart analysis Current Week: Displays all weekly FVGs for broader context Forward Extension: Extends FVG boxes and CE, Upper/Lower Quadrant lines into the future 📊 Visualization Bullish FVGs appear in semi-transparent blue or purple zones (depending on session). Bearish FVGs appear in red or orange zones. Optional dotted lines mark the CE (midpoint) of each FVG for additional reference. Quadrant Division: Additional 25%/75% lines for large FVGs (configurable minimum gap size) 🎯 Smart Filtering First Presentation Only: Only displays the initial FVG in each session, avoiding clutter Minimum Gap Size: Configurable tick-based thresholds for AM and PM sessions Core FVG Validation: Ensures only valid Fair Value Gaps are displayed ⚙️ Configuration Options Display Settings Show Mode: Current Day or Current Week view Forward Extension: 1-500 bars projection Day Labels: Toggle weekday labels in weekly mode Text Color: Customizable label colors Volume Imbalance Settings Include Volume Imbalance: Master toggle for enhanced boundary calculation Automatic Detection: Identifies imbalance scenarios without additional input Session-Specific Settings AM Session (09:30-10:00): Enable/disable AM FVG detection Customizable bullish/bearish colors CE line visibility and coloring Minimum gap size in ticks PM Session (13:30-14:00): Enable/disable PM FVG detection Customizable bullish/bearish colors CE line visibility and coloring Minimum gap size in ticks Quadrant Settings Enable/Disable: Toggle quadrant line display Minimum Gap: Tick threshold for quadrant activation Line Style: Dotted, dashed, or solid Color: Customizable quadrant line color How It Works FVG Boundary Calculation Traditional FVG: High to Low (bullish) or Low to High (bearish) Enhanced FVG: Extended boundaries to include volume imbalance zones when enabled Total Gap Size: Calculated including any volume imbalance extensions Volume Imbalance Detection The indicator identifies volume imbalances by detecting bars where: Bullish Imbalance: Current bar's body is completely above previous bar's body Bearish Imbalance: Current bar's body is completely below previous bar's body ⚠️ Disclaimer This script is a technical visualization tool only. It does not provide financial advice, signals, or predictions. Always perform independent analysis and manage risk appropriately before making trading decisions.Pine Script® Indikatorvon flasiAktualisiert 22151
ICT PDA - Gold & BTC (QuickScalp Bias/FVG/OB/OTE + Alerts)What this script does This indicator implements a complete ICT Price Delivery Algorithm (PDA) workflow tailored for XAUUSD and BTCUSD. It combines HTF bias, OTE zones, Fair Value Gaps, Order Blocks, micro-BOS confirmation, and liquidity references into a single, cohesive tool with early and final alerts. The script is not a mashup for cosmetic plotting; each component feeds the next decision step. Why this is original/useful Symbol-aware impulse filter: A dynamic displacement threshold kTune adapts to Gold/BTC volatility (body/ATR vs. per-symbol factor), reducing noise on fast markets without hiding signals. Scalping preset: “Quick Clean” mode limits drawings to the most recent bars and keeps only the latest FVG/OB zones for a clear chart. Three display modes: Full, Clean, and Signals-Only to match analysis vs. execution. Actionable alerts: Early heads-up when price enters OTE in the HTF bias direction, and Final alerts once mitigation + micro-break confirm the setup. How it works (high-level logic) HTF Bias: Uses request.security() on a user-selected timeframe (e.g., 240m) and EMA filter. Bias = close above/below HTF EMA. Dealing Range & OTE: Recent swing high/low (pivot length configurable) define the range; OTE (62–79%) boxes are drawn contextually for up/down ranges. Displacement: A candle’s body/ATR must exceed kTune and break short-term structure (displacement up/down). FVG: 3-bar imbalance (bull: low > high ; bear: high < low ). Latest gaps are tracked and extended. Order Blocks: Last opposite candle prior to a qualifying displacement that breaks recent highs/lows; zones are drawn and extended. Entry & Alerts: Long: Bullish bias + price inside buy-OTE + mitigation of a bullish FVG or OB + micro BOS up → “PDA Long (Final)”. Short: Bearish bias + price inside sell-OTE + mitigation of a bearish FVG or OB + micro BOS down → “PDA Short (Final)”. Early Alerts: Trigger as soon as price enters OTE in the direction of the active bias. Inputs & controls (key ones) Bias (HTF): timeframe minutes, EMA length. Structure: ATR length, Impulse Threshold (Body/ATR), swing pivot length, OB look-back. OTE/FVG/OB/LP toggles: show/hide components. Auto-Tune: per-symbol factors for Gold/BTC + manual tweak. Display/Performance: View Mode, keep-N latest FVG/OB, limit drawings to last N bars. Recommended usage (scalping) Timeframes: Execute on M1–M5 with HTF bias from 120–240m. Defaults (starting point): ATR=14, Impulse Threshold≈1.6; Gold factor≈1.05, BTC factor≈0.90; Keep FVG/OB=2; last 200–300 bars; View Mode=Clean. Workflow: Wait for OTE in bias direction → see mitigation (FVG/OB) → confirm with micro BOS → manage risk to nearest liquidity (prev-day H/L or recent swing). Alerts available “PDA Early Long/Short” “PDA Long (Final)” / “PDA Short (Final)” Attach alerts on “Any alert() function call” or the listed conditions. Chart & screenshots Please include symbol and timeframe on screenshots. The on-chart HUD shows the script name and state to help reviewers understand context. Limitations / notes This is a discretionary framework. Signals can cluster during news or extreme volatility; use your own risk management. No guarantee of profitability. Changelog (brief) v1.2 QuickScalp: added Quick Clean preset, safer array handling, symbol-aware impulse tuning, display modes. ------------------------------ ملخص عربي: المؤشر يطبق تسلسل PDA عملي للذهب والبتكوين: تحيز من فريم أعلى، مناطق OTE، فجوات FVG، بلوكات أوامر OB، وتأكيد micro-BOS، مع تنبيهات مبكرة ونهائية. تمت إضافة وضع “Quick Clean” لتقليل العناصر على الشارت وحساسية إزاحة تتكيّف مع الأصل. للاستخدام كسكالب: نفّذ على M1–M5 مع تحيز 120–240 دقيقة، وابدأ من الإعدادات المقترحة بالأعلى. هذا إطار سلوكي وليس توصية مالية.Pine Script® Indikatorvon iraqJP61
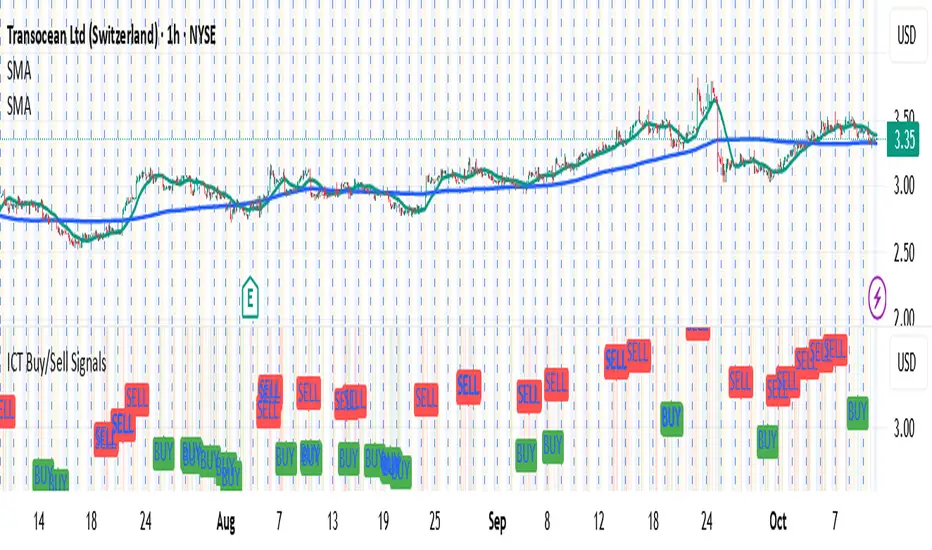
ICT Buy/Sell SignalsAI Generated ICT trading strategy with buy sell signals.Pine Script® Indikatorvon laminack1622
ICT SMC Custom — BOS/MSS + OB + FVGWant me to fill that box? Here’s a ready‑to‑paste description for your publish screen: ⸻ ICT SMC Custom — BOS/MSS + OB + FVG (Crypto‑friendly) A clean Smart Money Concepts tool that marks Break of Structure (BOS), Market Structure Shift (MSS), Order Blocks (OB), and Fair Value Gaps (FVG) with bold, easy‑to‑see visuals. Built for crypto but works on any market and timeframe. What it does • BOS & MSS detection with optional body/wick logic • Order Blocks: auto‑draws the last opposite candle before a BOS, keeps only the most recent N, and fades when mitigated • FVGs: 3‑candle gaps with a minimum size filter and a cap on how many to keep • HTF Swings (optional): plots higher‑timeframe pivot highs/lows for top‑down context • Alerts for BOS/MSS and FVG formation Inputs • Swing pivot length (default 3): sensitivity for structure pivots • Use candle bodies for breaks: close vs level (on) or wicks (off) • Show BOS/MSS labels, Show FVG, Show Order Blocks • Min FVG size (ticks) and Max boxes to keep for FVG/OB • OB uses candle body: body range vs full wick range • Show higher timeframe swings + HTF timeframe • Bullish/Bearish colors How it works • BOS triggers when price breaks the last opposite swing. • MSS flags when the break flips the prior bias. • OB is the most recent opposite candle prior to BOS; it’s marked and later greyed out once price closes through it (mitigation). • FVG is detected when candle 1’s high < candle 3’s low (bear) or candle 1’s low > candle 3’s high (bull). Alerts included • BOS Up / BOS Down • MSS Up / MSS Down • FVG Up / FVG Down Tips • Start on 15m/1h for crypto, pivot length 3–5. • Turn Use candle bodies ON for stricter confirmations, OFF for more signals. • If boxes look cluttered, lower “Max boxes to keep.” Note: This is a visual/educational tool, not financial advice. Always confirm with your own plan and risk management. Pine Script® Indikatorvon isokolovskyibkp7106
ICT/SMC Liquidity Map V3 KyroowThe indicator is designed to map liquidity on the chart following the ICT/SMC logic, with the added feature of precise tracking of the Asian session. It shows you: PDH / PDL → Previous Day High & Low, automatically removed once taken out. EQH / EQL → Equal Highs & Equal Lows (double tops/bottoms), with pip tolerance and a check to ensure no candle has already "cleared" the range. ASH / ASL → Asian Session High & Low (the highs/lows of each closed Asian session). Asian Session → Displayed as a box or shaded area, with visual history. Dynamic tolerance management → EQH/EQL can have different tolerances depending on the timeframe. Automatic removal → Levels are removed once the market takes them (via wick or body, configurable). 💡 In practice: It helps you quickly identify likely liquidity grab zones, whether they come from the previous day, the Asian session, or equal highs/lows. This allows you to anticipate market reactions around these levels.Pine Script® Indikatorvon cedrikPN407
ICT Intraday FrameworkAutomating The Basics Of ICT Intraday Concepts: NWOG/NDOG -from 4:14pm to 9:29am a line will be drawn from 4:14pm close to anticipate ndog/nwog -once 9:30am or later NDOG/NWOG is drawn with High, Mid, and Low prices -has option to extend High, Mid, and Low price lines until start of new day at 2/3pm First Presented Imbalance -draws fp imb from 9:30-10am -has option to extend High, Mid, and Low price lines until start of new day at 2/3pm Custom Macro Window -draw box around high and low of macro -first presented imbalance of macro window Future concepts im planning to add: Asia BSL/SSL HighlightPine Script® Indikatorvon SunovaBeachAktualisiert 33175
ICT Balanced Price Range - Double FVG with VolumeThis is an FVG indicator combined with volume to identify moments when a sudden volume spike creates a price gap. Additionally, I've added the ICT Balanced Price Range, which occurs when two opposing FVGs form a connected gap. This gap has a high probability of reversal and is one of the key signs of liquidity sweeps. Unlike other FVG indicators that filter FVGs based on ATR, average price, or range, I believe such methods lead to overfitting and may not work across multiple pairs with a single setting. Instead, I only filter FVGs when there are consecutive overlapping FVGs. The indicator includes full functionality: Candle color customization FVG line color customization FVG fill color customization BPR color customization Adjustable average volume and volume threshold Highlighting candles with abnormal volume Enjoy and make sure to backtest thoroughly before using!Pine Script® Indikatorvon TheChartist_Code2tradeAktualisiert 22356
ICT Concepts: MML, Order Blocks, FVG, OTECore ICT Trading Concepts These strategies are designed to identify high-probability trading opportunities by analyzing institutional order flow and market psychology. 1. Market Maker Liquidity (MML) / Liquidity Pools Idea: Institutional traders ("market makers") place orders around key price levels where retail traders’ stop losses cluster (e.g., above swing highs or below swing lows). Application: Look for "liquidity grabs" where price briefly spikes to these levels before reversing. Example: If price breaks a recent high but reverses sharply, it may indicate a liquidity grab to trigger retail stops before a trend reversal. 2. Order Blocks (OB) Idea: Institutional orders are often concentrated in specific price zones ("order blocks") where large buy/sell decisions occurred. Application: Identify bullish order blocks (strong buying zones) or bearish order blocks (strong selling zones) on higher timeframes (e.g., 1H/4H charts). Example: A bullish order block forms after a strong rally; price often retests this zone later as support. 3. Fair Value Gap (FVG) Idea: A price imbalance occurs when candles gap without overlapping, creating an area of "unfair" price that the market often revisits. Application: Trade the retracement to fill the FVG. A bullish FVG acts as support, and a bearish FVG acts as resistance. Example: Three consecutive candles create a gap; price later returns to fill this gap, offering a entry point. 4. Time-Based Analysis (NY Session, London Kill Zones) Idea: Institutional activity peaks during specific times (e.g., 7 AM – 11 AM New York time). Application: Focus on trades during high-liquidity periods when banks and hedge funds are active. Example: The "London Kill Zone" (2 AM – 5 AM EST) often sees volatility due to European market openings. 5. Optimal Trade Entry (OTE) Idea: A retracement level (similar to Fibonacci retracement) where institutions re-enter trends after a pullback. Application: Look for 62–79% retracements in a trend to align with institutional accumulation/distribution zones. Example: In an uptrend, price retraces 70% before resuming upward—enter long here. 6. Stop Hunts Idea: Institutions manipulate price to trigger retail stop losses before reversing direction. Application: Avoid placing stops at obvious levels (e.g., above/below recent swings). Instead, use wider stops or wait for confirmation. Pine Script® Indikatorvon stevennano4544 1 K
ICT CheckListCredit to the owner of this script "TalesOfTrader" The Awakening Checklist indicator is a tool designed to help traders evaluate certain key market conditions and elements before making trading decisions. It consists of a series of questions that the trader must answer using the options "Yes", "No" or "N/A" (not applicable). “Has Asia Session ended?” : This question aims to determine if the Asian trading session has ended. The answer to this question can influence trading strategies depending on market conditions. “Have you identified potential medium induction?” : This question concerns the identification of potential average inductions on the market. Recognizing these inductions can help traders anticipate future price movements. "Have you identified potential PoI's": This question asks about the identification of potential points of interest on the market. These points of interest can indicate areas of significant support or resistance. "Have you identified in which direction they are creating lQ?" : This question aims to determine in which direction market participants create liquidity (lQ). Understanding this dynamic can help make informed trade decisions. “Have they induced Asia Range”: This question concerns the induction of the Asian range by market participants. Recognizing this induction can be important in assessing future price movements. “Have you had a medium induction”: This question asks about the presence of a medium induction on the market. The answer to this question can influence trading prospects. “Do you have a BoS away from the induction”: This question aims to find out if the trader has an offer (BoS) far from the identified induction. This can be a risk management strategy. "Doas your induction PoI have imbalance": This question concerns the imbalance of points of interest (PoI) linked to induction. Recognizing this imbalance can help anticipate price movements. “Do you have a valid target in mind”: This question aims to find out if the trader has a clear trading objective in mind. Having a goal can help guide trading decisions and manage risk.Pine Script® Indikatorvon Grxciz197
ICT Indicator with Paper TradingThe strategy implemented in the provided Pine Script is based on **ICT (Inner Circle Trader)** concepts, particularly focusing on **order blocks** to identify key levels for potential reversals or continuations in the market. Below is a detailed description of the strategy: ### 1. **Order Block Concept** - **Order blocks** are price levels where large institutional orders accumulate, often leading to a reversal or continuation of price movement. - In this strategy, **order blocks** are identified when: - The high of the current bar crosses above the high of the previous bar (for bullish order blocks). - The low of the current bar crosses below the low of the previous bar (for bearish order blocks). ### 2. **Buy and Sell Signal Generation** The core of the strategy revolves around identifying the **breakout** of order blocks, which is interpreted as a signal to either enter or exit trades: - **Buy Signal**: - Generated when the closing price crosses **above** the last identified bullish order block (i.e., the highest point during the last upward crossover of highs). - This signals a potential upward trend, and the strategy enters a long position. - **Sell Signal**: - Generated when the closing price crosses **below** the last identified bearish order block (i.e., the lowest point during the last downward crossover of lows). - This signals a potential downward trend, and the strategy exits any open long positions. ### 3. **Strategy Execution** The strategy is executed using the `strategy.entry()` and `strategy.close()` functions: - **Enter Long Positions**: When a buy signal is generated, the strategy opens a long position (buying). - **Exit Positions**: When a sell signal is generated, the strategy closes the long position. ### 4. **Visual Indicators on the Chart** To make the strategy easier to follow visually, buy and sell signals are marked directly on the chart: - **Buy signals** are indicated with a green upward-facing triangle above the bar where the signal occurred. - **Sell signals** are indicated with a red downward-facing triangle below the bar where the signal occurred. ### 5. **Key Elements of the Strategy** - **Trend Continuation and Reversals**: This strategy is attempting to capture trends based on the breakout of important price levels (order blocks). When the price breaks above or below a significant order block, it is expected that the market will continue in that direction. - **Order Block Strength**: Order blocks are considered strong areas where price action could reverse or accelerate, based on how institutional investors place large orders. ### 6. **Paper Trading** This script uses **paper trading** to simulate trades without actual money being involved. This allows users to backtest the strategy, seeing how it would have performed in historical market conditions. ### 7. **Basic Strategy Flow** 1. **Order Block Identification**: The script constantly monitors price movements to detect bullish and bearish order blocks. 2. **Buy Signal**: If the closing price crosses above the last order block high, the strategy interprets it as a sign of bullish momentum and enters a long position. 3. **Sell Signal**: If the closing price crosses below the last order block low, it signals a bearish momentum, and the strategy closes the long position. 4. **Visual Representation**: Buy and sell signals are displayed on the chart for easy identification. ### **Advantages of the Strategy:** - **Simple and Clear Rules**: The strategy is based on clearly defined rules for identifying order blocks and trade signals. - **Effective for Trend Following**: By focusing on breakouts of order blocks, this strategy attempts to capture strong trends in the market. - **Visual Aids**: The plot of buy/sell signals helps traders to quickly see where trades would have been placed. ### **Limitations:** - **No Shorting**: This strategy only enters long positions (buying). It does not account for shorting opportunities. - **No Risk Management**: There are no built-in stop losses, trailing stops, or profit targets, which could expose the strategy to large losses during adverse market conditions. - **Whipsaws in Range Markets**: The strategy could produce false signals in sideways or choppy markets, where breakouts are short-lived and prices quickly reverse. ### **Overall Strategy Objective:** The goal of the strategy is to enter into long positions when the price breaks above a significant order block, and exit when it breaks below. The strategy is designed for trend-following, with the assumption that price will continue in the direction of the breakout. Let me know if you'd like to enhance or modify this strategy further!Pine Script® Strategievon Blessed-Inspired22102
ICT Vacuum BlocksThe indicator draws a box between the closing price of one candle and the opening price of the next whenever a gap occurs, helping traders easily spot potential areas of interest where the market has skipped over price levels. The boxes do not extend beyond the gap itself, keeping the chart clean and focused on the price action. Features: Detects both upward and downward gaps. Non-extending boxes that accurately represent the size of each gap. Customizable colors for up and down gaps to match your chart style.Pine Script® Indikatorvon nacho-fx1150
ICT Asian Range and KillzonesThis TradingView indicator highlights key trading sessions and their price ranges on a chart. It identifies the Asian Range and the Killzones for both the London Open and New York Open sessions. Here’s a brief breakdown: Asian Range: Defines the high and low price levels during the Asian trading session (between the specified start and end hours, default 00:00 to 04:00 UTC). Plots horizontal lines to mark the highest and lowest prices reached during the Asian session. Adds labels showing the values of these high and low points after the session ends. London and New York Killzones: Identifies the “Killzones” or key trading windows for the London Open (default 06:00 to 09:00 UTC) and the New York Open (default 11:00 to 14:00 UTC). Tracks the high and low price levels within these windows and plots rectangles ("boxes") on the chart to visualize these ranges. The boxes are color-coded and customizable, indicating potential areas of high market activity or volatility. Customizable Visuals: Users can adjust the colors, border widths, and other visual properties for better clarity and chart integration. Pine Script® Indikatorvon ICTFusionAktualisiert 44 1.8 K