Directional Strength and Momentum Index█ OVERVIEW
“Directional Strength and Momentum Index” (DSMI) is a technical analysis indicator inspired by DMI, but due to different source data, it produces distinct results. DSMI combines direction measurement, trend strength, and overheat levels into a single index, enhanced with gradient fills, extreme zones, entry signals, candle coloring, and a summary table.
█ CONCEPT
The classic DMI, despite its relatively simple logic, can seem somewhat chaotic due to separate +DI and -DI lines and the need for manual interpretation of their relationships. The DSMI indicator was created to increase clarity and speed up results, consolidating key information into a single index from 0 to 100 that simultaneously:
- Indicates trend direction (bullish/bearish)
- Measures movement strength
- Identifies overheat levels
- Generates ready entry signals
DMI (ADX + +DI / -DI) measures trend direction and strength, but does so based solely on comparing price movements between candles. ADX shows whether the trend is orderly and growing (e.g., above 20–30), but does not assess how dynamic the movement is.
DSMI, on the other hand, takes into account candle size and actual market aggression, thus showing directional momentum — whether the trend has real “fuel” to sustain or accelerate, not just whether it is orderly.
The main calculation difference involves replacing True Range with candle size (high-low) and using directional EMA instead of Wilder smoothing. This allows DSMI to react faster to momentum changes, eliminating delays typical of classic DMI based on TR.
This gives the trader an immediate picture of the market situation without analyzing multiple lines.
█ FEATURES
DSMI Main Line:
- EMA(Directional Index) based on +DS and -DS
- Scale 0–100, smooth color gradient depending on strength
+DS / -DS:
- Positive and Negative Directional Strength
- Gradient fill between lines — more intense with stronger trend
Extreme Zones:
- Default 20 and 80
- Gradient fill outside zones
Trend Strength Levels:
- Weak (<10) → neutral
- Moderate (up to 35)
- Strong (up to 45)
- Overheated (up to 55)
- Extreme (>55)
All levels editable
Entry Signals:
- Activated on crossing entry level (default 20)
Or on direction change when DSMI already ≥ entry level
- Highlighted background (green/red)
Candle Coloring:
- According to current trend
Trend Strength Table:
- Top-right corner
- Shows current strength (WEAK/STRONG etc.) + DSMI value
Alerts:
- DSMI Bullish Entry
- DSMI Bearish Entry
█ HOW TO USE
Add to Chart: Paste code in Pine Editor or find in indicator library.
Settings:
DSMI Parameters:
- DSMI Period → default 20
- Show DSMI Line → on/off
Extreme Zones:
- Lower Level → default 20
- Upper Level → default 80
Trend Strength Levels:
- Weak, Moderate, Strong, Overheated → adjust to strategy
Trend Colors:
- BULLISH → default green
- BEARISH → default red
- NEUTRAL → gray
Entry Signals:
- Show Highlight → on/off
- DSMI Entry Level → default 20
Signal Interpretation:
- DSMI Line: Main strength indicator.
- Gradient between +DS and -DS: Visualizes side dominance.
- Crossing 18 with direction confirmation → entry signal.
- Extreme Zones: Potential reversal or continuation points after correction.
- Table: Quick overview of current trend condition.
█ APPLICATIONS
The indicator works well in:
- Trend-following: Enter on signal, exit on direction change or overheat. When a new trend appears, consider entering a position, preferably with a rising trend strength indicator.
- Scalping/daytrading: Shorter period (7–10), lower entry level.
- Swing/position: Longer period (20–30), higher entry level, extreme zones as filters.
- Noise filtering: Ignores consolidation below “Weak” – increasing value e.g. to 15 highlights consolidation zones, but no signals appear there.
Style Adjustment:
- Aggressive strategies → shorten period and entry level
- Conservative → extend period, raise entry level (25–30), watch “Overheated”
“Weak” level (<10 default) → neutral; increasing it e.g. to 15 gives fewer but higher-quality signals. The Weak zone value controls the level below which no signals appear, and the gradient turns gray (often aligned with consolidation zones).
Combine with:
- Support/resistance levels
- Fair Value Gaps (FVG)
- Volume (Volume Profile, VWAP)
- Other oscillators (RSI, Stochastic)
█ NOTES
- Works on all markets and timeframes.
- Adjust period and levels to instrument volatility.
- Higher entry level → fewer signals, higher quality.
- Neutral color below “Weak” – avoids trading in consolidation.
- Gradient and table enable quick assessment without line analysis.
In den Scripts nach "fvg" suchen

IRONBULL FX AMD📌 Power Of 3 ICT 01 – AMD ICT & SMC Accumulations
Overview:
The Power Of 3 ICT 01 indicator by TradingFinder is designed to visually map out the classic Accumulation–Manipulation–Distribution (AMD) phases of price behavior, based on ICT (Inner Circle Trader) and Smart Money Concepts (SMC) principles. It helps traders recognize the underlying structure of the trading day using session-based detection aligned to the New York timezone.
🔍 Core Logic:
This script divides each trading day into three logical phases:
Accumulation (19:00–01:00 EST)
The period when institutions quietly build positions within a tight range.
Manipulation (01:00–07:00 EST)
False moves designed to induce retail participation in the wrong direction.
Distribution (07:00–13:00 EST)
The actual directional move after trapping liquidity.
These zones are visually marked on the chart using colored transparent boxes, with labels for clear identification.
🛠️ Key Features:
Session-Based Detection:
Uses Pine Script’s time() function to identify when the chart time falls within each of the defined AMD sessions.
Automatic High/Low Range Detection:
For each phase, the indicator tracks the highest high and lowest low within the session window to draw a price range box.
Visual Markers:
Distinct labels and shaded boxes are plotted for each zone:
🔹 Accumulation → Blue
🔸 Manipulation → Orange
🟢 Distribution → Cyan
Fully Customizable Settings:
Each phase’s visibility, session time, and color can be adjusted from the input panel.
📈 Ideal Use Case:
For traders following ICT/SMC methodology
For intraday structure mapping
To combine with other tools like Order Blocks, FVGs, or session breakouts
⚙️ Customization Options:
✅ Toggle visibility for each phase independently
🕒 Modify session start/end times
🎨 Choose custom colors for phase boxes and labels
⚠️ Note: Best used on intraday timeframes (60 min or lower). The indicator is optimized for charts set to the America/New_York timezone.

Candle Range Theory for SeSe04Small Candle Theory — Automatic Detection of Micro-Retracements
📘 Description
The Small Candle Theory indicator automatically identifies market structures where a small candle forms within the range of a larger previous candle, highlighting potential momentum slowdown or local reversal areas.
This is a price action visualization tool, not a trading signal provider.
⚙️ Detection Conditions
📈 Bullish Signal
Candle 1: Large bearish candle
Candle 2: Small bullish candle
Candle 2 closes within the range of Candle 1
→ A blue triangle appears below the confirmation candle.
📉 Bearish Signal
Candle 1: Large bullish candle
Candle 2: Small bearish candle
Candle 2 closes within the range of Candle 1
→ A red triangle appears above the confirmation candle.
🧠 How to Use
This indicator does not generate buy/sell signals.
It highlights moments of reduced volatility that may precede a potential reversal or continuation, depending on market structure.
Best used:
In confluence with structure tools (support/resistance, order blocks, FVGs, etc.)
With strict risk management
On multiple timeframes
⚙️ Settings
No manual input is required.
Detection logic is automatic and works on any asset or timeframe.
🛎️ Alerts (optional)
You can create an alert in TradingView:
"Create Alert" → Condition: Small Candle Theory (Bullish or Bearish)
to receive notifications when a setup appears.
⚠️ Disclaimer
This script is for educational and analytical purposes only.
It does not constitute financial advice.
Trading involves the risk of losing part or all of your invested capital.

Overnight Time Box Overnight Time Box (22:59 → 09:59, minutes & TZ)
Automatically draws a time-based box for a customizable window that can cross midnight. Perfect for marking the overnight range up to London open (e.g., 22:59–09:59 in Europe/Bucharest), but works with any minute-level window.
What it does
Builds a daily box covering all price action between two user-defined times (e.g., 22:59 → 09:59).
Tracks session High/Low in real time and can plot extended HL lines for reference.
Keeps historical boxes on the chart for backtesting and review (no flicker, no errors).
How to use
Add the script to an intraday chart.
Configure:
Time zone (default: Europe/Bucharest).
Interval (HHMM-HHMM) — e.g., 2259-0959 (minutes supported).
Optional: High/Low lines, fill color, border color, line width.
Use on intraday timeframes (M1–H4).
Note: On Daily/Weekly/Monthly, a heads-up label reminds you it’s designed for intraday use.
Inputs
Time zone: correct DST handling.
Interval (HHMM-HHMM): supports windows that span midnight.
Draw High/Low lines: extended HL guides for the session.
Colors & widths: full visual customization.
Use cases
Mark the overnight range into London open (10:00 RO).
Delimit Killzones / ICT Silver Bullet windows.
Study range, liquidity raids, FVGs before major sessions.
Tech notes
Built on Pine Script v5 using input.session → stable, DST-safe.
Increased max_boxes_count / max_lines_count to preserve history.
Boxes are “frozen” at session end and remain on chart.
Limitations
Intended for intraday only.
One interval per script instance; attach multiple instances for multiple windows.

DTC Killzones ICT🕐 DTC Killzones ICT — Visualize Market Sessions Like a Pro
The DTC Killzones ICT indicator is a clean and intuitive tool designed for traders who want to analyze and visualize institutional trading sessions directly on their charts.
Inspired by ICT’s Killzone concept , this script makes it easy to identify overlapping market sessions — such as London, New York, and Asian — and track how price behaves within each zone.
💡 What It Does
This indicator automatically highlights key market sessions (Killzones) on your chart with fully customizable colors, labels, and transparency.
Each zone dynamically updates to reflect real-time highs and lows, helping you identify:
Session ranges and liquidity zones
Volatility windows and breakout areas
Institutional footprints across sessions
Whether you trade Forex, Indices, or Crypto , this script gives you visual clarity on when and where smart money is likely to move.
⚙️ Main Features
✅ Up to four customizable sessions (New York, London, Asian, and London Close)
✅ Adjustable timeframes and timezone options — sync with your exchange or custom UTC offset
✅ Dynamic high/low range tracking for each session
✅ Toggle range outlines, session labels , and transparency levels
✅ Optional daily dividers and session transition markers
✅ Works on any timeframe and any symbol
🧠 How Traders Use It
ICT-based traders can easily mark Killzones to align with setups like FVGs, liquidity grabs, or Silver Bullet entries.
Intraday traders can visualize session volatility and overlap periods for potential entries.
Swing traders can identify daily structure shifts by tracking range-to-range behavior.
🛠️ Customization
You can fully rename, recolor, or disable each session block.
Adjust the range transparency for visual comfort, and toggle session or daily dividers to fit your workflow.
Everything is designed to be clean, light, and modular — no clutter, no confusion.
⚡ Recommended Settings
For ICT-style analysis:
London Session: 02:00–05:00
New York Session: 07:00–10:00
Asian Session: 19:30–24:00
London Close Session: 10:00–12:00
These time windows are fully editable to suit your timezone or strategy.
🧩 Compatibility
Works seamlessly with TradingView’s built-in timezone tools
Compatible with all instruments and timeframes
Designed to overlay directly on your price chart
🏁 Final Notes
The DTC Killzones ICT indicator focuses purely on market session visualization — no alerts, entries, or trading signals.
It’s designed to complement your existing strategies and enhance clarity when analyzing market behavior across global sessions.
📈 Built for traders who value precision, structure, and timing.

Aibuyzone Vector Strategy - Floating DashboardVector Strategy – Floating Dashboard
The Vector Strategy is a visual trading-analysis tool designed to highlight strong directional candles that may represent impulsive moves in the market. It combines candle-structure analysis, volatility expansion, volume conditions, and trend filters into a single clear visual display.
Core Logic
Identifies candles where the body makes up a significant portion of the full bar range, suggesting strong directional intent.
Uses an ATR (Average True Range) expansion filter to confirm that the current candle’s range is larger than normal volatility.
Optionally applies a wick-imbalance requirement to favor bars showing a clear directional bias.
Can include a volume spike filter, marking candles where volume exceeds a moving average multiple.
Trend and Momentum Filters
Local trend: Defined by a fast and slow EMA pair to show short-term bias.
Higher-timeframe trend: Optionally aligns with an EMA from a higher timeframe to confirm broader momentum.
Momentum: RSI filter avoids generating signals in heavily overbought or oversold conditions.
Fair Value Gap (FVG) Option
When enabled, the script checks for a simple three-bar fair-value-gap structure in the direction of the potential signal, acting as an additional confirmation filter.
Signals and Visuals
Plots fast and slow EMAs to visualize the underlying trend.
Displays up/down shapes when qualifying vector-candle conditions occur.
Optional labels show “Vector Long” or “Vector Short” at the candle where conditions align.
Includes alert conditions for both long and short setups.
Floating Dashboard
A compact floating panel summarizes the most recent signal and market context:
Current signal state (Long / Short / Neutral)
Trend bias (Bullish / Bearish / Flat)
RSI reading
Body-to-range percentage
Volume-spike confirmation
Practical Use
This tool can assist traders in identifying strong impulsive candles aligned with a trend filter.
It is meant to complement a complete trading strategy, not to be used in isolation.
Traders may adjust thresholds such as ATR multiple, body-percentage, or RSI range based on the instrument’s volatility and personal risk tolerance.
Important Notice
This script is provided for educational and analytical purposes only.
It does not provide financial advice, recommendations, or guaranteed results.
Market conditions vary, and past performance does not ensure future outcomes.
Always test and validate any configuration in a simulated environment before live trading.

FVGC — MTF ScreenerFVGC — MTF Screener (by Capital Complex)
Part of the FVGC Suite.
A compact, real-time dashboard that scans the 30s, 1m, 2m, and 3m timeframes for FVGC-compliant conditions—showing a green/red dot when a bullish/bearish setup is arming, and a green/red square when the setup confirms. Built to sit beside FVGC — Signals and FVGC — Visual Overlay so you can monitor multiple timeframes at once without clutter.
---
## What it does
Multi-TF heads-up display : Tracks 30s, 1m, 2m, 3m for valid FVGC criteria.
Clear state encoding:
* Dot = conditions are aligning (setup arming).
* Square = entry model confirmed (go/no-go).
Rule-true logic: Mirrors your FVGC rule set (tap/engulf/inversion and guardrails) so the screener matches what your Signals indicator would accept on each timeframe.
Noise control: Honors your Trading Windows to keep the screen focused on the session you actually trade.
---
## Why traders use it
Time compression: See four lower timeframes progress from “almost” to “confirmed” at a glance.
Discipline aid: Use the dot phase as a heads-up, and the square as the only moment you consider action—no more chart hopping.
Suite cohesion: Screener tells you when, Visual Overlay shows where, Signals defines how.
---
## Key features & options
Timeframes: 30s, 1m, 2m, 3m (fixed for clarity and speed).
FVGC-aligned filters: Honors your suite’s guardrails (e.g., IFVG/BOS logic, midpoint FTC checks, opposing-FVG 50% behavior, opening-range distance caps by TF).
Trading Windows aware: Optional pre-window arming visibility for early heads-up.
Readable UI: On-chart table/HUD with per-state colors (dot/square), custom text color control, and minimal footprint.
Timezone aware: Defaults to America/New_York to align with RTH and your other FVGC tools.
---
## Notes
Designed for index futures, indices, and liquid FX.
This is a visual scanner; it does not place orders. Pair with FVGC — Signals for your actual entry/management logic.
---
## Credits & suite
Capital Complex — FVGC Suite
© TheHiddenMarkets (code components)
---
## Disclaimer
This tool is for educational purposes only and does not constitute financial advice. Trading involves risk; do your own research and manage risk appropriately.

RAFEN-G - Kill Zones & Institutional Gaps🔍 What It Does
Kill Zones (KZ1, KZ2, KZ3)
Automatically highlights the main intraday liquidity windows such as the London open, NY AM, and NY PM sessions — customizable by time, color, and transparency.
Perfect for timing setups, identifying liquidity sweeps, or backtesting session behavior.
Institutional GAP Detection (NY 11:00 → 03:00)
Anchored on the New York H1 clock, the script automatically draws the “institutional gap” between the 11:00 close and the 03:00 open of the next trading day.
Each gap is drawn as a transparent box with a label showing its size in price units.
Dynamic Cleanup & Color Updates
Automatically removes old boxes beyond your chosen history limit and keeps all visuals perfectly synchronized in real-time.
⚙️ Key Features
3 fully independent and editable Kill Zones
Adjustable timezone (default: America/New_York)
Works on all intraday timeframes
Auto-management of historical data
Clean and lightweight visuals (up to 2000 boxes)
Real-time color and transparency updates
Alerts when each Kill Zone starts
🧠 Ideal For
Traders using ICT, SMC, or institutional frameworks who want clear visual separation of market sessions and automatic tracking of session-to-session gaps for confluence or imbalance analysis.
🕐 Recommended Use
Apply on 5 min / 15 min / 1 h charts, align timezone to NYC, and combine with liquidity or FVG tools for maximum insight.

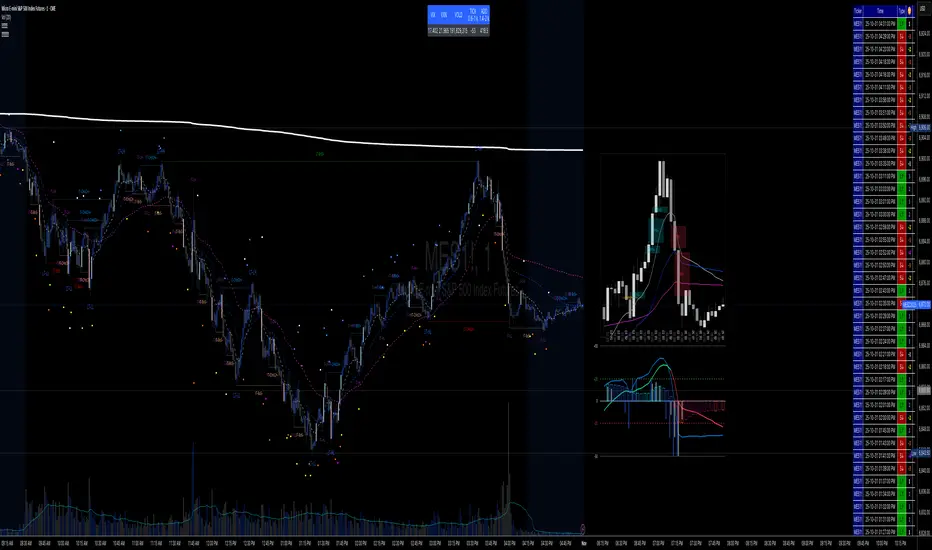
✝️📈📉☢️BANG is a comprehensive multi-timeframe indicator for TradingView, designed for intraday trading of futures and stocks.
To use: Add to a low timeframe chart (e.g., 1-5 minutes), configure anchor mode (daily/weekly/monthly/manual) for session resets, and select timeframe for signals (e.g., 5m). Monitor the mini-charts for HTF overview (candles, VWEMA/VWAP, FVG), RSI/MACD trends, market data table (VIX/VXN/etc.), and ICT structure (pivots, BOS/CHoCH).
For trading: Enter LONG/SHORT on signal bars with strength ☢️ (1-6, higher = stronger confluence), confirmed by multi-timeframe alignment (e.g., anchor daily while trading minutes). Use ATR-based risk management; backtest in demo mode.
Custom Time Separators + Hourly Open LinesThis Indicator is for those who wants to keep the chart clean and Study 1HR Profile.
best USE is : 1HR line Projected and 1 HR separator is plotted on the chart
i Use 4 Hrs. plotted and using for CRT Method to identify
SWEEP of C1 by C2 and, Entering ON C2 when its Trading back up,
or on your comfort of confirmation with MSS + FVG / OB
Lot of ICT Model can be traded and used with this including
PO3
Lumi trades : 1HR PO3
Ttrades CRT and Many more,
let me know if want to add anything if i think its useful we can add.
cheers


Retail vs Banker Net Positions – Symmetry BreakRetail vs Banker Net Positions – Symmetry Break (Institution Focus)
Description:
This advanced indicator is a volume-proxy-based positioning tool that separates institutional vs. retail behavior using bar structure, trend-following logic, and statistical analysis. It identifies net position flows over time, detects institutional aggression spikes, and highlights symmetry breaks—those moments when institutional action diverges sharply from retail behavior. Designed for intraday to swing traders, this is a powerful tool for gauging smart money activity and retail exhaustion.
What It Does:
Separates Volume into Two Groups:
Institutional Proxy: Volume on large bars in trend direction
Retail Proxy: Volume on small or counter-trend bars
Calculates Net Positions (%):
Smooths cumulative buying vs. selling behavior for each group over time.
Highlights Symmetry Breaks:
Alerts when institutions make statistically abnormal moves while retail is quiet or doing the opposite.
Detects Extremes in Institutional Activity:
Flags major tops/bottoms in institutional positioning using swing pivots or rolling windows.
Retail Sentiment Flips:
Marks when the retail line crosses the zero line (e.g., flipping from net short to net long).
How to Use It:
Interpreting the Two Lines:
Aqua/Orange Line (Institutional Proxy):
Rising above zero = Net buying bias
Falling below zero = Net selling bias
Lime/Red Line (Retail Proxy):
Green = Retail buying; Red = Retail selling
Watch for crosses of zero for sentiment shifts
Spotting Symmetry Breaks:
Pink Circle or Background Highlight =
Institutions made a sharp, outsized move while retail was:
Quiet (low ROC), or
Moving in the opposite direction
These often precede explosive directional moves or stop hunts.
Institutional Extremes:
Marked with aqua (top) or orange (bottom) dots
Based on swing pivot logic or rolling highs/lows in institutional positioning
Optional filter: Only show extremes that coincide with a symmetry break
Settings You Can Tune:
Lookback lengths for trend, z-scores, smoothing
Z-Score thresholds to control sensitivity
Retail quiet filters to reduce false positives
Cool-down timer to avoid rapid repeat signals
Toggle visual aids like shading, markers, and threshold lines
Alerts Included:
-Retail flips (green/red)
- Institutional symmetry breaks
- Institutional extreme tops/bottoms
Strategy Tip:
Use this indicator to track institutional accumulation or distribution phases and catch asymmetric inflection points where the "smart money" acts decisively. Confluence with price structure or FVGs (Fair Value Gaps) can further enhance signal quality.

PDH/PDL- [CT]Private Algorithm that is invite only. It is only spread through word of mouth and is not available on any website.
This algorithm will give you the best chance at being green and is even better when following specific plays of someone or yourself.
This is not supposed to guarantee profit and the team are not financial advisors. Please always manage your own risk according to your risk tolerance .
PDH/PDL –
by calmstrades
Description:
The PDH/PDL – indicator automatically plots the Previous Day’s High (PDH) and Previous Day’s Low (PDL) levels directly on your chart — essential reference points for Smart Money Concepts (SMC) and intraday traders.
It also detects and highlights liquidity sweeps when price takes out the prior day’s highs or lows, helping identify potential reversal or continuation zones.
🔍 Features:
Automatic PDH/PDL Levels:
Draws dynamic lines for the previous day’s high and low with customizable styles, colors, and widths.
Smart Money Sweep Detection:
Marks PDH or PDL sweeps using visual labels whenever liquidity is taken.
Clean Visual Customization:
Choose line style (Solid, Dashed, Dotted), color themes, label display, and toggle visibility for all components.
Lightweight & Efficient:
Optimized for smooth performance even on lower timeframes (1m–15m).
⚙️ Settings:
✅ Show PDH / Show PDL
🏷️ Show Labels on Lines
💧 Show Liquidity Sweeps
🎨 Line Style, Width, and Color Controls
💡 How to Use:
Use PDH/PDL as key liquidity levels where price often reacts.
Watch for sweeps (liquidity grabs) followed by structure shifts to identify potential trade setups.
Combine with other SMC tools, such as Order Blocks, FVGs, or BOS/CHoCH indicators, for confirmation.

Ichimoku Average with Margin█ OVERVIEW
“Ichimoku Average with Margin” is a technical analysis indicator based on an average of selected Ichimoku system lines, enhanced with a dynamic safety margin (tolerance). Designed for traders seeking a simple yet effective tool for trend identification with breakout confirmation. The indicator offers flexible settings, line and label coloring, visual fills, and alerts for trend changes.
█ CONCEPT
The Ichimoku Cloud (Ichimoku Kinko Hyo) is an excellent, comprehensive technical analysis system, but for many traders—especially beginners—it remains difficult to interpret due to multiple overlapping lines and time displacements.
Experimentally, I decided to create a simplified version based on its foundations: combining selected lines into a single readable average (avgLine) and introducing a dynamic safety margin that acts as a buffer against market noise.
This is not the full Ichimoku system—it’s merely a clear method for determining trend, accessible even to beginners. The trend changes only after the price closes beyond the margin, eliminating false signals.
█ FEATURES
Ichimoku Lines:
- Tenkan-sen (Conversion Line) – Donchian average over 9 periods
- Kijun-sen (Base Line) – Donchian average over 26 periods
- Senkou Span A – average of Tenkan and Kijun
- Senkou Span B – Donchian average over 52 periods
- Chikou Span – close price (no offset)
Dynamic Average (avgLine):
- Arithmetic mean of only the enabled Ichimoku lines – full component selection flexibility.
Safety Margin (tolerance):
Calculated as:
- tolerance = multiplier × SMA(|open - close|, periods)
- Default: multiplier 1.8, period 100.
Trend Detection:
- Uptrend → when price > avgLine + tolerance
- Downtrend → when price < avgLine - tolerance
- Trend changes only after full margin breakout.
- Margin can be set to 0 – then signals trigger on avgLine crossover.
Signal Labels:
- “Buy” (green, upward arrow) – on shift to uptrend
- “Sell” (red, downward arrow) – on shift to downtrend
Visual Fills:
- Between avgLine and marginLine
- Between avgLine and price (with transparency)
- Colors: green (uptrend), red (downtrend)
Alerts:
- Trend Change Up – price crosses above margin
- Trend Change Down – price crosses below margin
█ HOW TO USE
Add to Chart: Paste code in Pine Editor or find in the indicator library.
Settings:
Ichimoku Parameters:
- Conversion Line Length → default 9
- Base Line Length → default 26
- Leading Span B Length → default 52
- Average Body Periods → default 100
- Tolerance Multiplier → default 1.8
Line Selection:
- Enable/disable: Tenkan, Kijun, Span A, Span B, Chikou
Visual Settings:
- Uptrend Color → default green
- Downtrend Color → default red
- Fill Between Price & Avg → enables shadow fill
Signal Interpretation:
- Average Line (avgLine): Primary trend reference level.
- Margin (marginLine): Buffer – price must break it to change trend. Set to 0 for signals on avgLine crossover.
- Buy/Sell Labels: Appear only on confirmed trend change.
- Fills: Visualize distance between price, average, and margin.
- Alerts: Set in TradingView → notifications on trend change.
█ APPLICATIONS
The indicator works well in:
- Trend-following: Enter on Buy/Sell, exit on reversal.
- Breakout confirmation: Ideal for breakout strategies with false signal protection.
- Noise filtering: Margin eliminates consolidation fluctuations.
Adjusting margin to trading style:
- Short-term trading (scalping, daytrading): Reduce or set margin to 0 → more and faster signals (but more false ones).
- Long-term strategies (swing, position): Increase margin (e.g. 2.0–3.0) → fewer signals, higher quality.
Entry signals are not limited to Buy/Sell labels – use like moving averages:
- Test and bounce off avgLine as support/resistance
- avgLine breakout as momentum signal
- Pullback to margin as trend continuation entry
Combine with:
- Support/resistance levels
- Fair Value Gaps (FVG)
- Volume or other momentum indicators
█ NOTES
- Works on all markets and timeframes.
- Adjust multiplier and periods to instrument volatility.
- Higher multiplier → fewer signals, higher quality.
- Disable unused Ichimoku lines to simplify the average.

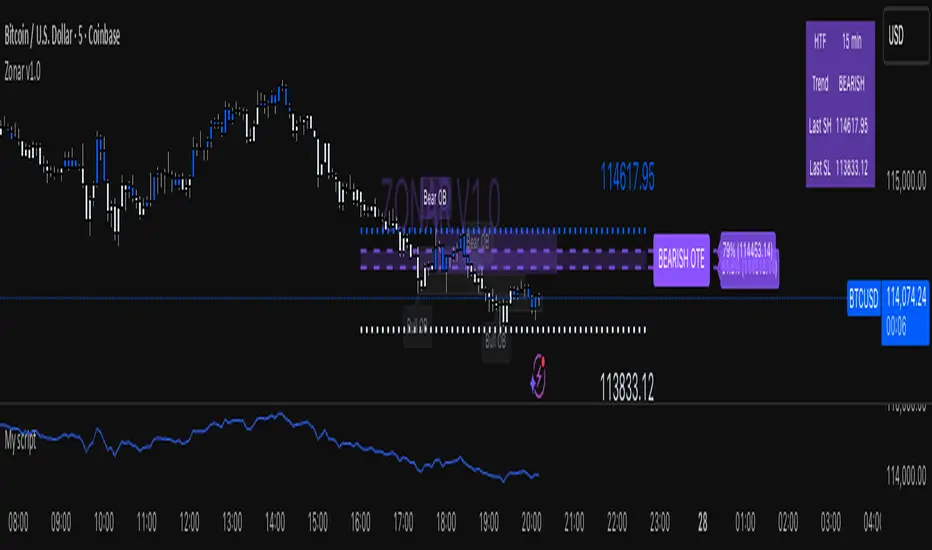
Zonar v1.5🟣 ZONAR v1.5 — Precision Market Mapping System
ZONAR is a proprietary market-structure engine that fuses price-action logic, real-time trend adaptation, and algorithmic zone validation into one integrated framework.
Unlike typical SMC indicators that simply draw order blocks or FVGs, Zonar reconstructs market intent by dynamically grading and updating structural zones as they evolve.
🧠 Core Logic
Zonar’s engine continuously analyses three key dimensions of price movement:
Hierarchical Market Structure Recognition — Detects higher-timeframe swing ranges, recalibrates the active trend, and synchronizes lower-timeframe structure shifts.
Adaptive Zone Generation — Builds order-block, mitigation-block, and imbalance zones only when algorithmic displacement and retracement criteria are met — filtering out noise and redundant zones.
Zone Integrity Tracking — Every plotted zone is validated, aged, and visually deactivated once mitigated or invalidated, giving traders a clean, self-updating chart environment.
⚙️ What Makes ZONAR Unique
Proprietary Zone Logic: Combines displacement candles, body/-wick validation, and retracement confirmation to mark institutional footprints with higher precision.
Dynamic Higher-Timeframe Context: Each zone aligns automatically with higher-timeframe BOS/CHOCH logic, updating the premium/discount bias in real time.
OTE Mapping Engine: Integrates a built-in Optimized Trade Entry (61.8–79%) range, synchronized with structural swing highs/lows for accurate retracement targeting.
Zone Lifecycle Visualization: Active zones transition through stages — valid → retraced → mitigated — visually represented with color fading and label updates.
Smart Signal Output: Generates live entry, stop-loss, and multi-target projections (TP1–TP3) derived from each zone’s structure and directional bias.
🎯 How It Helps
Zonar filters the chaos of price action into a clean, interpretable map — identifying where liquidity is engineered and where true institutional interest resides. It helps traders anticipate rather than react, focusing only on areas where probability, structure, and precision converge.
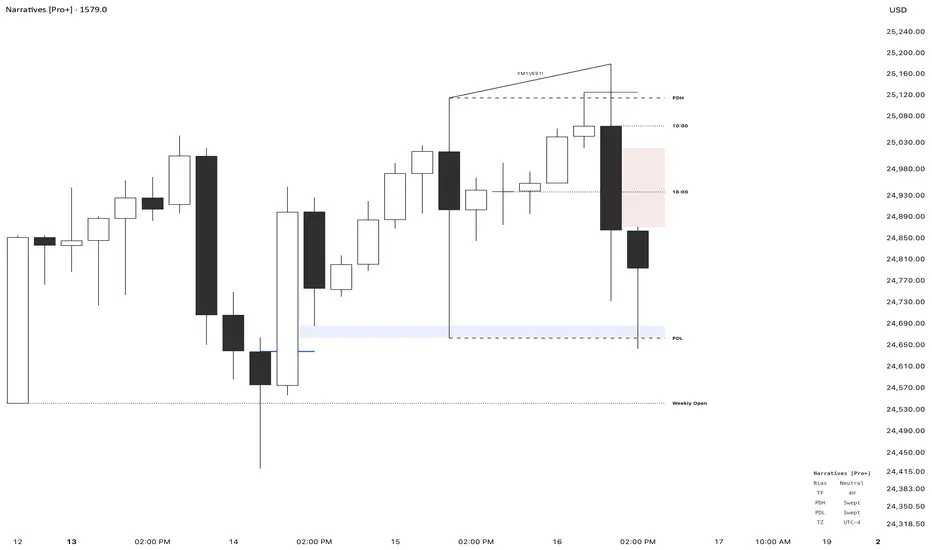
Narratives [Pro+]Narratives - Release
Narratives is a comprehensive trading indicator designed to help traders build a structured narrative around price action. Built on the concepts of Inner Circle Trader, GxT Profiling, and HTF Analysis, It integrates advanced Smart Money concepts such as Fair Value Gaps, SMT Divergence, Liquidity Sweeps, Precision Swing Points, and Session Levels — all within one cohesive and adaptive system. Explore the features below:
Fair Value Gaps (FVG)
- Automatically detects and displays bullish and bearish Fair Value Gaps with dynamic invalidation
- Customizable colors, box limits, and extension behavior until price closes through the gap
- Automatically removes invalidated gaps for a cleaner view
Smart Money Technique (SMT) Divergence
- Detects divergence between correlated assets at Previous Day High/Low levels
- Automatic preset detection for major markets including Indices, Forex, Metals, Energy, and Crypto
- Inversion SMT detection when correlated assets sweep levels while the primary asset does not
- Labels display which specific assets are in divergence
Candle Sweep Detection
- Identifies C2 sweep patterns where Candle 2 sweeps Candle 1’s high or low and closes back
- Detects C3 closure patterns
- Dynamic detection removes sweep lines if subsequent price action invalidates the pattern
- Configurable maximum sweeps and optional bias filtering
Precision Swing Point (PSP)
- Detects swing highs and lows that occur with correlated asset divergence
- Two display modes:
- PSP Only – shows confirmed swing points with divergence
- All Precision Candles – highlights every divergence candle
- Supports up to three correlated assets with both manual and automatic preset modes
Previous Day High/Low (PDH/PDL)
- Plots previous day’s high and low across all intraday timeframes
- Dynamic mitigation stops line extension when levels are swept
- Customizable line styles for active and mitigated states
- Status tracking shows Intact or Swept in the information table
Previous Week High/Low (PWH/PWL)
- Plots previous week’s high and low with automatic detection across all intraday timeframes
- Dynamic mitigation stops line extension when levels are swept
- Customizable line styles for active and mitigated states
- Status tracking shows Intact or Swept in the information table
Premium / Discount Zones
- Automatically calculates and displays Premium and Discount ranges based on current structure
- Helps visualize optimal trade zones within equilibrium
- Optional midpoint (Equilibrium) line
- Fully customizable colors and fill styles
Killzone Levels
- Tracks Asia and London session highs and lows with automatic timezone conversion
- Levels extend until mitigated with optional line removal
- Session-based detection resets daily
Timeline Markers
- Four customizable vertical lines mark key trading times
- Default setup includes major market opens in New York timezone
- Optional display on lower timeframes
Quarterly Theory
- Plots vertical lines marking quarterly cycles across multiple timeframes
- 15M charts: 90m quarters
- 30M charts: Daily quarters (6-hour cycles from 6PM)
- 1H charts: Weekly quarters
- 4H charts: Monthly quarters
- Daily charts: Yearly quarters
Information Table
- Displays current bias, timeframe, PDH/PDL status, and timezone
- Customizable position, colors, font size, and individual element toggles
- Includes Ticker and Timeframe for quick reference