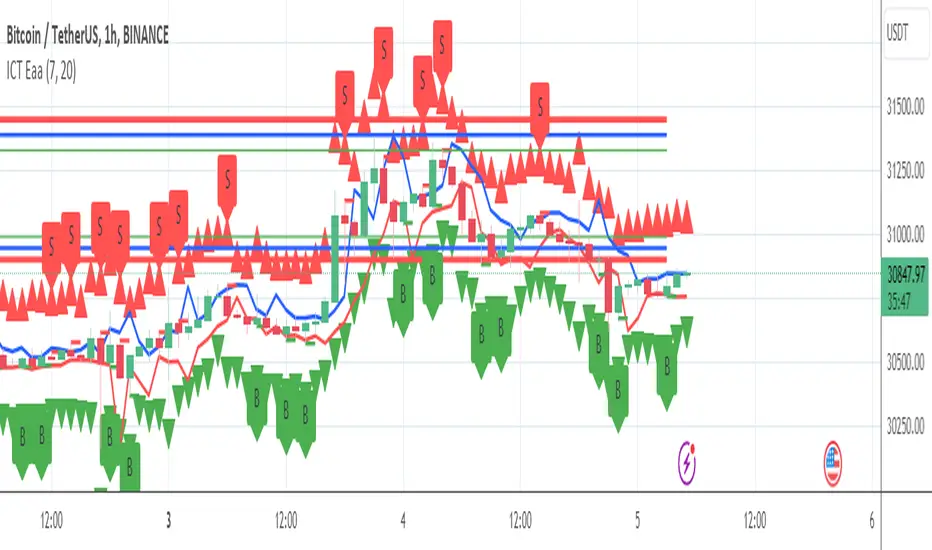
TJR SEEK AND DESTROYTJR SEEK AND DESTROY – Intraday ICT Trading Tool
Built for day traders, TJR SEEK AND DESTROY combines Smart Money concepts like order blocks, fair value gaps, and liquidity sweeps with structure breaks and daily bias to pinpoint high-probability trades during US market hours (9:30–16:00). Ideal for scalping or intraday strategies on stocks, futures, or forex.
What Makes It Unique?
Unlike standalone ICT indicators, this script integrates:
Order Blocks with volume and range filters for precise support/resistance zones.
Fair Value Gaps (FVG) to spot pre-market price imbalances.
Break of Structure (BOS) and Liquidity Sweeps for trend and reversal signals.
A 1H MA-based Bias to align trades with the day’s direction.
BUY/SELL Labels triggered only when bias, BOS, and sweeps align, reducing noise.
How Does It Work?
Order Blocks: Marks zones with high volume (>1.5x 20-period SMA) and low range (<0.5x ATR20) as teal boxes—potential reversal points.
Fair Value Gap: Compares the prior day’s close to the current open (pre- or post-9:30), shown as a purple line and label (e.g., "FVG: 0.005").
Pivot Point: Calculates (prevHigh + prevLow + prevClose) / 3 from the prior day, plotted as an orange line for equilibrium.
Break of Structure: Detects crossovers of 5-bar highs/lows (gray lines), marked with red triangles.
Liquidity Sweeps: Tracks breaches of the prior day’s high/low (yellow lines), marked with yellow triangles.
Daily Bias: Uses 1H close vs. 20-period MA (blue line) for bullish (green background), bearish (red), or neutral (gray) context.
Signals: BUY (green label) when bias is bullish, price breaks up, and sweeps the prior high; SELL (red label) when bias is bearish, price breaks down, and sweeps the prior low.
How to Use It
Setup: Apply to 1M–15M charts for US session trading (9:30–16:00 EST).
Trading:
Wait for a BUY label after a yellow sweep triangle above the prior day’s high in a green (bullish) background.
Wait for a SELL label after a yellow sweep triangle below the prior day’s low in a red (bearish) background.
Use order blocks (teal boxes) as support/resistance for stop-loss or take-profit.
Markets: Best for SPY, ES futures, or forex pairs with US session volatility.
Underlying Concepts
Order Blocks: High-volume, low-range bars suggest institutional activity.
FVG: Gaps between close and open indicate imbalance to be filled.
BOS & Sweeps: Price breaking key levels signals momentum or stop-hunting.
Bias: 1H MA filters trades by broader trend.
Chart Setup
Displays order blocks (teal boxes), pivot (orange), open (purple), bias (colored background), BOS/sweeps (triangles), and signals (labels). Keep other indicators off for clarity.
In den Scripts nach "fvg" suchen

Advanced Market Structure & Order Blocks (fadi)Advanced Market Structure & Order Blocks indicator provides a new approach to understanding price action using ICT (Inner Circle Trader) concepts related to candle blocks to analyze the market behavior and eliminate much of the noise created by the price action.
This indicator is not intended to provide trade signals, it is designed to provide the traders with to support their trading strategies and add clarity where possible.
There are currently three main elements to this indicator:
Market Structure
Order Blocks
Liquidity Voids
Market Structure
In trading, market structure is often identified by observing higher highs and higher lows. An uptrend is characterized by a series of higher highs, where each peak surpasses the previous one, and higher lows, where each trough is higher than the preceding one. Conversely, a downtrend is marked by lower highs and lower lows.
Other indicators usually determine these peaks by calculating the highest or lowest levels within a predefined number of candles. For example, identifying the highest price level within the last 15 candles and marking it as a higher high or a lower high. While this approach offers some structure to price action, it can be arbitrary and random due to price fluctuations and the lack of proper structure analysis beyond finding the highest peaks and valleys within candle ranges.
In his 2022 mentorship, episode 12, ICT introduced an alternative approach focusing on three-candle pivots called Short Term High and Low (STH/STL), which are then used to calculate the Intermediate Term High and Low (ITH/ITL), and in turn, the Long Term High and Low (LTH/LTL). ICT’s approach provides better structure than the traditional method mentioned above. However, it can be confusing and difficult to track. There are great indicators that track and label ICT’s levels, but traders still find it challenging to follow and understand.
The Advanced Market Structure indicator takes a unique approach by analyzing candle formations, using ICT concepts, to identify possible turning points that mimic a real trader’s analysis of price action as closely as possible. However, it should be expected that Market Makers may use market manipulation to induce traders to make failed trades, and no tooling can eliminate these situations.
Advanced Market Structure tracks true Peaks and Valleys as they form, confirms them, and marks the chart with corresponding labels using traditional labeling methods (HH/HL/LH/LL), as such labeling makes it easier for traders to follow and understand. The indicator also draws levels to help identify possible liquidity areas and trade targets.
The indicator uses different calculation methods for the different type of market structure length, however all calculations are based on the same ICT candle blocks concepts.
Market Structure Settings
Other than the display settings, there are four (4) settings, mainly under the Level Settings section.
Allow Nested Candles
This option is only available on the Short Market Structure due to the methods used in calculating highs and lows. When used, the indicator will attempt to detect smaller fluctuations in price by tracking smaller candle moves, if any.
Level Settings
Level Settings allows the trader to decide two main calculations:
1. A new pivot point will form when a candle’s is crossed by the following candle’s
2. For a liquidity sweep and marking a level as mitigated, a candle’s must cross that level
Order Blocks
ICT (Inner Circle Trader) defines an Order Block as the last down-closing candle, or series of candles, before a significant upward price move or the last up-closing candle, or series of candles, before a significant downward price move. These key price levels, marked by substantial buy or sell orders from institutional traders or "smart money," create a block or zone on the price chart. When the price revisits these levels, it often leads to a strong market reaction. Order Blocks can consist of one or multiple consecutive candles of the same color, signaling areas of significant buying or selling interest. ICT's approach to Order Blocks provides traders with a structured method to identify potential areas of support or resistance, where price movements are more likely to change direction. Although ICT has shared some criteria for identifying Order Blocks publicly, the full details are reserved for his upcoming books. This indicator leverages the publicly available information to provide traders with valuable insights into these crucial price levels.
The Advanced Market Structure indicator is designed to be highly flexible, allowing traders to define their own combination of rules for identifying Order Blocks, thus customizing it to fit their unique trading strategies.
Order Block Configuration
Can be nested
An Order Block is defined as the last down candle or candles before a strong move higher, and vice versa for bearish Order Blocks. However, larger-than-usual candles resulting from news events or price action may not qualify as Order Blocks and can mute any Order Block within their range.
The "Can be nested" flag ensures that each Order Block is treated as an independent entity, even if it appears within the body of another Order Block.
Forms at swing point
Order Blocks formed at swing points typically have higher probabilities but are less frequent, assuming the same rules are applied. Additionally, Order Blocks at swing points may become Breaker and Mitigation blocks if they fail, providing more trading opportunities.
Forms a simple pivot point
A simple pivot point corresponds to ICT Short Term High and Low (STH/STL). Order Blocks using simple pivot points can occur in the middle of a move, not just at swing points. These are useful for identifying IOFED setups and supporting blocks that can bolster the price move.
Causes Market Structure Shift
Order Blocks that result in a break above or below a short swing point can help narrow down target order blocks, but they are less frequent. An Order Block causing a break above or below a pivot point does not necessarily indicate a strong Order Block. For example, an Order Block formed at a Lower Low is more likely to fail in a downtrend.
A clean close above order block
When the first candle breaks above an Order Block and closes above its high, this indicates a stronger Order Block. On the other hand, if a candle merely wicks through the Order Block without a solid close above it, it suggests a weaker Order Block. This may indicate hesitation or an impending reversal, as the wick represents a temporary and unsustained price movement.
Has displacement more than X the body
While some traders may capitalize on the initial break above an Order Block's CISD level, others prefer to focus on the return to an Order Block after displacement. Displacement is determined by the body size of the Order Block, and an Order Block cannot be tested until this level has been achieved.
Has a Fair Value Gap
When an Order Block is combined with a Fair Value Gap (FVG), it signifies a strong Order Block. The Fair Value Gap indicates a strong price movement away from the Order Block.
Has a liquidity void
A Liquidity Void occurs when two consecutive candles of the same color do not overlap, creating a gap similar to a Fair Value Gap, but involving one or more middle candles. Liquidity Voids can be utilized in combination with, or as an alternative to, the displacement setting.
Maximum number of OBs
The maximum number of Order Blocks to display.
Mitigated at block’s
An Order Block is considered mitigated when price reaches one of the main Order Block levels.
Liquidity Void
Liquidity Void refers to areas on a price chart where there is one-sided trading activity. This phenomenon occurs when the price of an asset moves sharply in one direction, leaving gaps where two consecutive candles of the same color do not overlap. These gaps can comprise one or more middle candles and indicates a pronounced lack of trading within that price range. Liquidity Voids are important because they highlight areas of minimal resistance, where price is more likely to return to fill the void and balance the market.
Liquidity Void vs Fair Value Gap
While both concepts are related to gaps in price action, they are distinct. A Fair Value Gap is a specific three-candle pattern where the middle candle creates a gap between the first and third candles. In contrast, a Liquidity Void represents a broader area on the chart where there is little to no trading activity, often encompassing multiple candles and indicating a more pronounced imbalance between buy and sell orders.
A FVG can be part of a Liquidity Void, a Liquidity Void can exist without necessarily including an FVG. Both concepts highlight areas of minimal resistance and potential price movement, but they differ in their formation and implications.
Advanced Market Structure and Order Blocks indicator focus on liquidity voids since a liquidity void can substitute for a FVG and it is usually less addressed by other indicators.

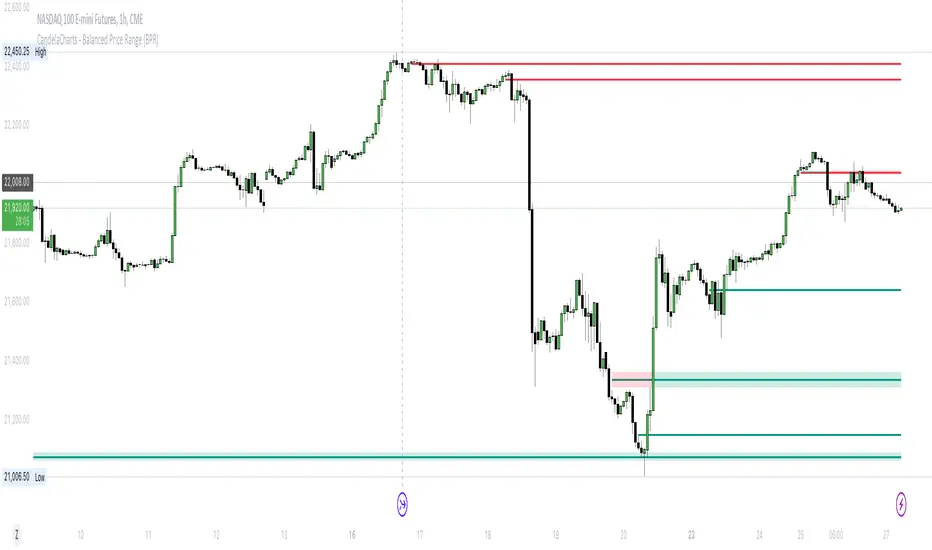
CandelaCharts - Balanced Price Range (BPR) 📝 Overview
ICT Balanced Price Range (BPR) is the area on the price chart where two opposite Fair Value Gaps overlap.
To identify a Balanced Price Range (BPR), mark a fair value gap (FVG) on the sell side of the price and another on the buy side. These FVGs should be directly opposite each other horizontally. The overlapping area between the two is the Balanced Price Range.
The significance of the ICT Balanced Price Range lies in its sensitivity to price movements. When the market approaches a BPR, it often triggers a rapid and notable price reaction.
This reaction occurs because the two opposing FVGs attract the attention of smart money traders—those with substantial capital capable of influencing market trends. As a key concept in the Inner Circle Trader (ICT) methodology, the BPR serves as an ideal entry point, frequently driving considerable market activity.
📦 Features
MTF
Mitigation
Consequent Encroachment (CE)
Threshold
Hide Overlap
Advanced Styling
⚙️ Settings
Show: Controls whether BPRs are displayed on the chart.
Show Last: Sets the number of BPRs you want to display.
Length: Determines the length of each BPR.
Mitigation: Highlights when an BPR has been touched, using a different color without marking it as invalid.
Timeframe: Specifies the timeframe used to detect BPRs.
Threshold: Sets the minimum gap size required for BPR detection on the chart.
Show Mid-Line: Configures the midpoint line's width and style within the BPR. (Consequent Encroachment - CE)
Show Border: Defines the border width and line style of the BPR.
Hide Overlap: Removes overlapping BPRs from view.
Extend: Extends the BPR length to the current candle.
Elongate: Fully extends the BPR length to the right side of the chart.
⚡️ Showcase
Simple
Mitigated
Bordered
Consequent Encroachment
Extended
🚨 Alerts
This script offers alert options for all signal types.
Bearish Signal
A bearish signal is generated when the price re-enters a bearish inversion zone and then reverses downward.
Bullish Signal
A bullish signal is generated when the price revisits a bullish inversion zone and then breaks upward through the top.
⚠️ Disclaimer
Trading involves significant risk, and many participants may incur losses. The content on this site is not intended as financial advice and should not be interpreted as such. Decisions to buy, sell, hold, or trade securities, commodities, or other financial instruments carry inherent risks and are best made with guidance from qualified financial professionals. Past performance is not indicative of future results.
FU Candle Indicator V3.2What the FU Candle Indicator does:
First we need to understand what FU candles are. There's bullish and bearish FU candles.
Bullish FU candles are candles that have a long wick that takes out the previous candles low, then turns around and closes above the high of the previous candle.
Bearish FU candles are candles that have a long wick that takes out the previous candles high, then turns around and closes below the low of the previous candle.
Then there's so called attempted FU candles (ATT FU)
The difference between normal FU candles and ATT FU candles is, that the ATT FU candle doesn't close above/below the high/low of the previous candle but only above the previous candle's body close.
Bullish ATT FU Candle:
Bearish ATT FU Candle:
Detection of Bullish FU Candles:
Bullish FU Candles are detected by measuring the distance between the low of the previous candle and the low of the current candle.
Then the distance between the previous candles high and the current candles close price are measured.
If current candle low < previous candle low and current candle close > previous candle high = Bullish FU Candle.
Detection of Bullish ATT FU Candles:
Bullish ATT FU Candles are detected by measuring the distance between the low of the previous candle and the low of the current candle.
Then the distance between the previous candles close or open price and the current candles close price are measured. If the previous candle closed bearish, the open price is used for comparison, if the previous candle closed bullish, the close price is used for comparison.
If current candle low < previous candle low and current candle close > previous candle open or close = Bullish ATT FU Candle.
Detection of Bearish FU Candles:
Bearish FU Candles are detected by measuring the distance between the high of the previous candle and the high of the current candle.
Then the distance between the previous candles low, AND the current candles close price are measured.
If current candle high > previous candle high, AND current candle close < previous candle low = Bearish FU Candle.
Detection of Bearish ATT FU Candles:
Bearish ATT FU Candles are detected by measuring the distance between the high of the previous candle and the high of the current candle.
Then the distance between the previous candles close or open price and the current candles close price are measured. If the previous candle closed bearish, the open price is used for comparison, if the previous candle closed bullish, the close price is used for comparison.
If current candle high > previous candle high and current candle close < previous candle open or close = Bearish ATT FU Candle.
What makes this script unique?
It shows and liquidity grab and a break of structure on a lower timeframe in one candle.
It allows to adjust the settings for the asset and timeframe you're using
The built in filters (Fractal Filter and EMA Filter) are both optional but allow to filter out certain candles and most importantly it leaves room for experimentation and optimisation to your trading style.
Input Settings and how to use them:
Bullish FU Candle Color --> This setting is to set the color for bullish FU candles.
Bearish FU Candle Color --> This setting is to set the color for bearish FU candles.
Chart --> This setting enables you to display FU's on different timeframes instead of only the current time. It's set to current timeframe by default.
Liq. Grab in Points --> This is the strength of the liquidity grab. By how many points has the current candle taken out the low/ high of the previous candle. It's set to 20 by default but it has to be adjusted to the timeframe and asset you're using.
Engulfing in Points --> This the strength of the engulfing of the previous candle. It measures the distance of the current close price to the open, close, high or low of the previous candle. It depends if the current candle is bullish or bearish and if the previous candle was bullish or bearish and if ATT FUs are enabled but this setting applies to all methods. It's set to 20 by default but you have to adjust it to the asset and timeframe you're using.
Min. Size in Points --> This setting is to filter out tiny candles. It measures the overall size of the FU candle from low to high. It's set to 20 by default but you have to adjust it to the asset and timeframe you are using.
Min. Body Size in Points --> This setting is to filter out FU candles that have a tiny body. It measures the size of the body from open to close. It's set to 20 by default but you have to adjust it to the asset and timeframe you are using.
Max. Body Size in Points --> This setting is to filter out FU candles that have a huge body. It measures the size of the body from open to close. It's set to 10000 by default but you have to adjust it to the asset and timeframe you are using.
Show ATT FU Candles --> ATT FU Candles are FU's where the body only engulfs the previous candles body but not the wick. This type of FU candles is just as valid as the strong FU's where the Body and the wick of the previous Candle is engulfed. The setting is enabled by default.
Rejection Filter --> This setting is used filter out FU candles where the opposite side rejection is stronger than the body direction of the FU. This filters out a lot of traps. It's disabled by default.
Fractal Filter --> FU's are only valid if they broke a fractal of the past x candles. This filters out some of the FU candles that are inside a range and therefore invalid. This is an optional filter and disabled by default.
EMA Filter --> FU's are only if they are above/ below the EMA. This is to filter out most of the FU candles that are inside ranges. The EMA period can be set too. This is an optional filter and enabled and EMA length set to 7 by default. You can enable it and/ or change the length of the EMA to fit your trading style.
Show Entry Lines --> The entry line setting has been changed in terms of styling. The upper and lower line has been removed. Now only the 50% retracement line of the candle body is displayed and the line type, color, strength and length can be set to keep charts as clean as possible.
Alert Timeframes --> You can select the timeframes for which you want to receive an alert if you set and alert for the FU Candle indicator. If you set an alert for the FU Candle Indicator it will send an alert for every FU candle on every selected timeframe.
TF1-TF8 --> This setting is to enable or disable alerts for timeframe 1 - timeframe 8. By default all alerts are disabled, I recommend only enabling the ones that you actually use.
Recommended use:
A bullish FU candle doesn't necessarily mean it's a long and vice versa a bearish FU candle doesn't necessarily mean it's a short. In fact, most FU candles are traps. Often times you'll see a bullish FU candle starting a bearish reversal.
Whenever you see an FU Candle check the following:
Did the FU candle take relevant liquidity?
Is the FU Candle in line with the overall bias or does it go against the bias?
Where did the FU react? Example: A bearish FU candle that reacts in a bullish FVG is a perfect long entry and vice versa.
A bullish FU candle that takes out a relevant swing high can often be a fake-out and price can immediately reverse as the next candle opens.
Timing is also very important. Usually the valid FU candles happen after a strong move to one direction during high volume times and right before or right after a new candle opens on a higher timeframe.
Examples of valid setups:
Nr. 1) Mitigation Setup
Overall bullish on the higher time frame, liquidity grab to the downside, shift in momentum, strong move to the upside left a FVG. later price comes back into the FVG and forms a FU candle --> perfect long trade targeting the opposite side of the range.
Entry either at close of the FU or at the 50% retracement.
Nr. 2) Trap Setup
Clear bullish trend respecting the trend line, bearish FU candle forms but it didn't take any relevant liquidity to the upside. Only internal range liquidity. Perfect long entry using a buy limit below the lower wick of the FU candle with the SL below the nearest low.
Nr. 3) Liquidity Grab Setup
Bearish trend, price comes up aggressively and takes out a high and forms an FU Candle. Market entry short at close of the FU candle or at the 50% retracement of the FU candle or by putting a limit order right above the wick of the candle that follows the FU candle, targeting the opposite side of the range.
Nr. 4) Fake Breakout Setup
Price takes out a significant HTF low, then makes at least 2 BOS on the LTF and forms an Order Block or leaves an FVG. Price forms a bearish U that fails to close below the FVG or Orderblock.
Market entry long at the close of the bearish FU targeting the opposite side of the range. Vice versa for shorts. In simple terms: Bullish FUs at the top of the range and bearish FUs at the bottom of the range are usually always traps.
Sometimes price takes out the high/low of a trap FU before reversing aggressively so you can also have a limit order below the low of the bearish FU or above the high of a bullish FU in this case. But you risk missing the trade.
Entry Methods:
Entry Type 1) Market Entry at the close of the FU candle. --> Never miss a trade, not the best RRR.
Entry Type 2 Limit Entry at the 50% retracement of the body of the FU candle. --> Miss some of the trades but better RRR.
Entry Type 3 Limit order below the wick of the candle that follows the FU candle. --> Miss quite a lot of trades but by far best RRR.
Why this is a closed source script:
The source code of this script is not open because I have spent several years of my life developing it and I use it in all my trading bots.
Also I'm open for feedback and will modify/ update the script for free if I get input that can make it better.
For questions, please reach out via DM or check out my youtube channel. I have several videos explaining in detail how I use these candles, which are valid and which aren't.

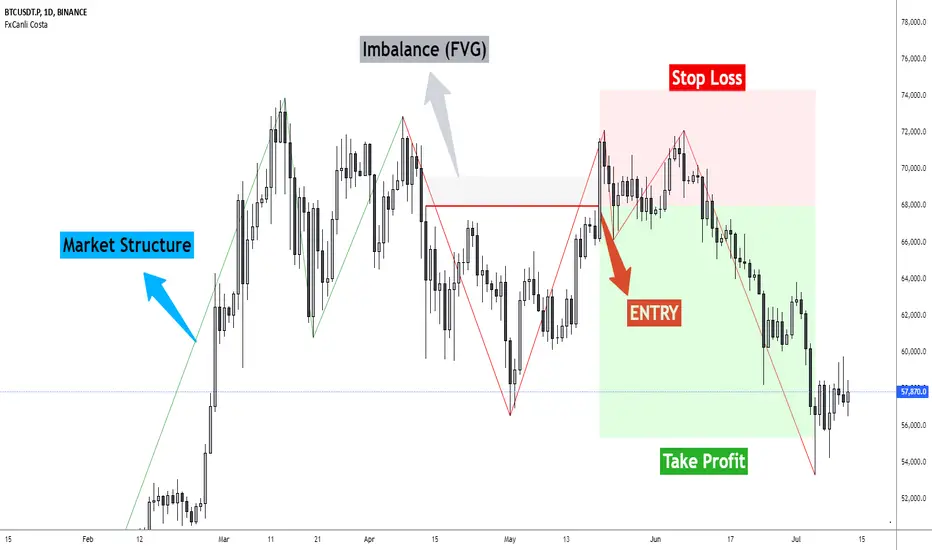
FxCanli CostaFxCanli Costa indicator draws all of the following with FxCanli Costa strategy
▪️ Market Structure
▪️ Up Trend with Green Lines
▪️ Down Trend with Red Lines
▪️ Imbalance(FVG)
▪️ Limit order Level
▪️ Entry Level
▪️ Stop Loss Level
▪️ Take Profit Level
******* Lets first understand about the FxCanli COSTA Strategy *******
Think that, we wait price to reverse from any level -
I call it PRZ (Potential Reversal Zone)
it can reverse in 2 type
Type 1 - it will reverse with 2 wave
Type 2 - it will reverse with 1 wave
⚫ What is PRZ (Potential Reversal Zone)?
Depends on your technical analysis, it can be any Harmonic Pattern level
or it can be Order block at Price action concept.
⚫ What is Imbalance (FVG)?
Fair Value Gaps are price jumps caused by imbalanced buying and selling pressures.
A bullish Fair Value Gap is created when there is a gap between the high of the first candle and the low of the third candle.
A bearish Fair Value Gap is created when there is a gap between the low of the first candle and the high of the third candle.
⚫ FxCanli Costa Strategy is starting now
At my trades, I always wait trend reversal ( Type1 or Type 2 , That I mention above)
for buy trades, I enter the trade below the break out candles
for sell trades, I enter the trade above the break out candles
⚫ Where to put stop loss and take profit?
Stop loss is always above/below swing High/Low
and take profit has to be at least 1/1 Risk/Reward ratio
******* What is FxCanli COSTA Indicator? *******
FxCanli Costa draws all these, depends on FxCanli Costa Strategy
🔴 Market Structure
▪️ Up Trend with Green Lines
▪️ Down Trend with Red Lines
🔴 Trade Levels
FxCanli Costa Indicator first draws Buy Limit level or Sell limit level on the chart
and when Price Reaced to that level it will show Entry / Stop Loss / Take Profit levels
it puts stop loss above/below swing High/Low
and it put Take profit depends on Risk/Reward ratio from inputs.
🔴 FILTERING
FxCanli Costa Indicator's input has got some filtering parts
With these filtering you will not enter all trades
For Example Fibonacci Filtering
it will only give entry signal of impulse's 0.618 and more fibonacci level
🔵 Others Filter are;
RSI Filtering - It will give entry signal, if only RSI is at Overbought or Oversold
EMA Filtering - It will give entry signal with the same direction of Exponential Moving Average
Imbalance Filtering - It will give entry signal, if there is FVG - Imbalance at the entry level
Thanks alot, wish you great trades
Institutional Order Finder (IOF) - Hidden Order Block LiteInstitutional Order Finder (IOF) - Hidden Order Blocks
Institutional Order Finder (IOF) Indicator: Detecting Breaker Blocks and Hidden Order Blocks (HOBs)
The Institutional Order Finder (IOF) Lite is designed to assist traders in identifying breaker blocks, also known as hidden order blocks (HOBs). The indicator helps identify untouched bodies within order blocks and offers comprehensive analysis of fair value gaps (FVGs) and order blocks based on engulfing candles. The method for detecting engulfing patterns is customizable (available in the Pro version).
Features of the Institutional Order Finder (IOF) Lite Indicator
The indicator detects breaker blocks and distinguishes between complete HOBs and partial HOBs (PHOBs). An HOB is created when the body of a candle, to the left of an engulfing candle, ideally fits through the fair value gaps without being touched by wicks. The indicator differentiates between:
HOB (Hidden Order Block): The body completely fits through the FVGs and is untouched by wicks, making it a strong and reliable breaker block.
PHOB (Partial Hidden Order Block): The body does not fully fit, but at least the equilibrium (50% level of the body left of the engulfing candle) is covered by the FVGs.
The minimum requirement for a “good” HOB is for the equilibrium to be crossed by the FVGs. This method provides a focused and high-quality view of the market structure.
Visualization and Market Structure Analysis
The Institutional Order Finder (IOF) displays order blocks as lines, with the equilibrium being a critical analysis point. Once the equilibrium is reached, the order block is considered invalid. In addition to HOBs and PHOBs, the indicator also displays fair value gaps, as well as invalidated order blocks (OBs) and breaker blocks (BBs). Understanding these invalidations is essential for interpreting market behavior and potential turning points. The line representation offers a cleaner view, making it easier to combine multiple timeframes and spot clusters.
Multi-Timeframe Analysis (MTF)
The Lite version allows analysis of up to three different timeframes, helping traders observe the relevance and strength of order blocks across different time periods. For each selected timeframe, not only confirmed order blocks are shown, but also “potential order blocks (OBs) and breaker blocks (BBs).” These blocks are currently forming and are not yet confirmed. Potential OBs and BBs can provide crucial insights into the current market structure, especially for traders who seek early signals.
Lite Version and Limitations
The Lite version of the Institutional Order Finder (IOF) indicator has certain limitations. It can display only up to three timeframes, offers fewer customization options, and focuses on basic analysis tools. Nonetheless, the Lite version is a powerful tool for gaining initial insights into the functionality of the MT Breaker Block indicator and improving understanding of market structure.
Why Use the Institutional Order Finder (IOF) Indicator?
The Lite indicator offers a precise way to analyze and visualize order blocks and breaker blocks. By focusing on identifying untouched bodies and the equilibrium, the indicator provides a unique perspective on market structure, often missing from traditional order block indicators. With its ability to conduct multi-timeframe analysis and identify potential order blocks in real time, the IOF Lite indicator offers a detailed understanding of potential price movements.
Special thanks to Moneytaur for inspiring the creation of this indicator.
Settings Overview
GENERAL SETTINGS
Historical order blocks: Enables the display of historical order blocks on the chart.
Order blocks: Activates the detection and display of order blocks (OB).
Show high quality breaker blocks: Displays only high-quality breaker blocks (BB) that meet strict criteria. The lines for high-quality BBs are twice as thick as regular lines.
ENGULFING
Please choose Engulfing engine: Choose the type of engulfing pattern used to detect order blocks (e.g., “Engulfing Strict” for stricter criteria).
MTF SETTINGS
Default timeframe: Sets the default timeframe for order block analysis when the multi-timeframe (MTF) mode is turned off.
Show MTF order blocks: Enables the display of order blocks from multiple timeframes.
Timeframe 1, Timeframe 2, Timeframe 3: Specify the individual timeframes for MTF analysis.
Activate Timeframe 1, Activate Timeframe 2, Activate Timeframe 3: Control which MTF timeframes are actively used in the analysis.
ORDER BLOCK SETTINGS
Order Block Filter Strategy: Choose a filtering strategy to display only the most relevant OBs.
Extend order blocks to the right: Extends order blocks to the right until they are invalidated.
Show timeframe as label: Displays the timeframe of the order block as a label on the chart.
Bearish OB, Bullish OB, Breaker Block, Old Order Blocks, Old BB-Blocks (and possible): Choose colors for different types of order blocks and breaker blocks for easier visual distinction.
Label text color: Sets the color of the text within labels.
Label background color: Defines the background color of the labels.
Line width: Specifies the thickness of the lines that represent order blocks.
Please choose style of lines / current timeframe, Please choose style of lines / alternative timeframe: Choose the style of lines (e.g., solid or dotted) for the current and alternative timeframes.
Timeframe label offset in bars from actual bar: Determines the offset of labels relative to the candles, improving visibility.
FAIR VALUE GAPS
Show Fair Value Gaps: Activates the detection and display of fair value gaps (FVG), highlighting potential liquidity gaps.
FILTER SETTINGS
Number of Previous Candles (Candle Pattern Strength): Specifies the number of previous candles to analyze to determine the strength of the candle pattern.
Candle Size Multiplier (Candle Pattern Strength): Sets a multiplier for the candle size within the pattern to emphasize stronger patterns.
RSI Period (RSI): Defines the period for the RSI indicator, used to analyze overbought/oversold conditions.
Overbought Level (RSI), Oversold Level (RSI): Sets the RSI threshold values to identify potential trend reversal points.
Minimum Volume (Volume): Specifies the minimum volume that must be reached to validate order blocks and breaker blocks.
This guide provides a comprehensive breakdown of the Institutional Order Finder (IOF) Lite Indicator settings, allowing you to customize and maximize the indicator’s functionality for optimal trading insights.

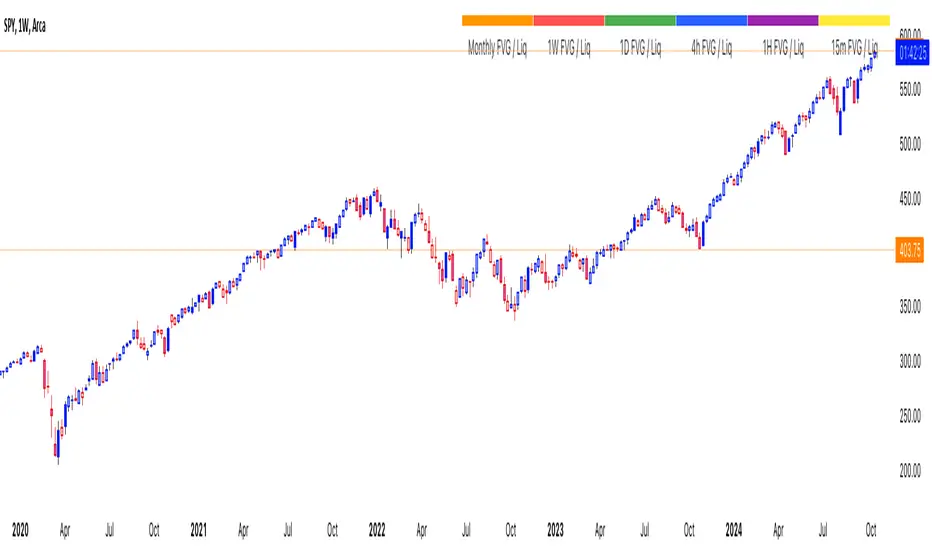
thinkCNE - Key with Multiple ColoursCustomisable Key with Multi-Coloured Highlights for Chart Annotations
Overview:
This Customizable Key indicator is designed to provide traders with a clear and visually customizable legend that can be displayed on their chart. It allows users to annotate their charts with up to 10 distinct labels, each paired with a unique color-coded square. This feature is especially useful when you need to visually differentiate between various technical elements on your chart, such as support/resistance levels, Fair Value Gaps (FVGs), or important pivot points.
Key Features:
Customizable Labels and Colors: Each row in the table can be customized with unique text and background colors. This flexibility allows traders to create a personalized key that reflects the specific elements they are tracking, such as monthly FVGs, daily supports, volume-based zones, or any other custom annotations.
Flexible Number of Rows: The user can enable or disable rows as needed, which ensures that the table only shows relevant information. If fewer than 10 rows are required, the unused rows can be hidden from view, maintaining a clean and uncluttered chart.
Dynamic Table Placement: The key can be placed at different positions on the chart (top-right, middle-right, or bottom-right), giving users control over where the key appears to avoid covering important parts of their technical analysis.
Adjustable Size and Text Format: Users can customize the size of the color squares, the text, and even the overall appearance of the table. The text size can range from small to huge, making the labels easy to read based on personal preferences.
Use Cases:
Annotating Key Technical Zones: The indicator is perfect for annotating multiple technical zones or levels that require consistent attention. For example, traders can label areas like "Monthly FVG," "Daily Support," "Key Resistance," or even "Volume Spike," and color-code them accordingly for quick reference.
Drawing Clarity: A well-organized chart is essential for clear decision-making. This indicator enhances clarity by visually categorizing different chart features, making it easier to quickly interpret the chart without confusion. The customizable color squares ensure that users can quickly identify which technical element corresponds to which label on the chart.
Visual Aid for Strategy Execution: For traders using strategies involving multiple indicators, support and resistance lines, or patterns, this key helps keep track of all the elements, especially when several overlapping annotations might clutter the chart. It allows users to draw specific attention to key areas of interest and explain the rationale for each one.
Educational & Presentational Tool: If you're conducting trading education sessions or presentations, this indicator can serve as a powerful tool to explain concepts in real-time. You can present your chart with clearly marked zones or levels, where each color and label explains the reasoning behind your analysis. It’s a professional tool for walkthroughs or strategy breakdowns.
Benefits:
Enhanced Visual Organization: The color-coded squares and corresponding labels make it easier to maintain organization within a busy chart. Traders can distinguish between multiple chart elements at a glance, which enhances their focus on critical zones or setups.
Improved Decision-Making: By clearly labeling and color-coding areas of importance, traders can reduce the time it takes to assess the chart and make decisions, as the key provides a concise reference.
Customizable to Individual Needs: Traders can adapt the indicator to their specific trading style and chart elements, whether they're swing traders marking longer-term zones or day traders focusing on short-term levels.
Clarity on Complex Charts: For traders using charts with several indicators and drawings, the ability to clearly define what each color and label represents ensures that the chart remains understandable, even with multiple overlays.
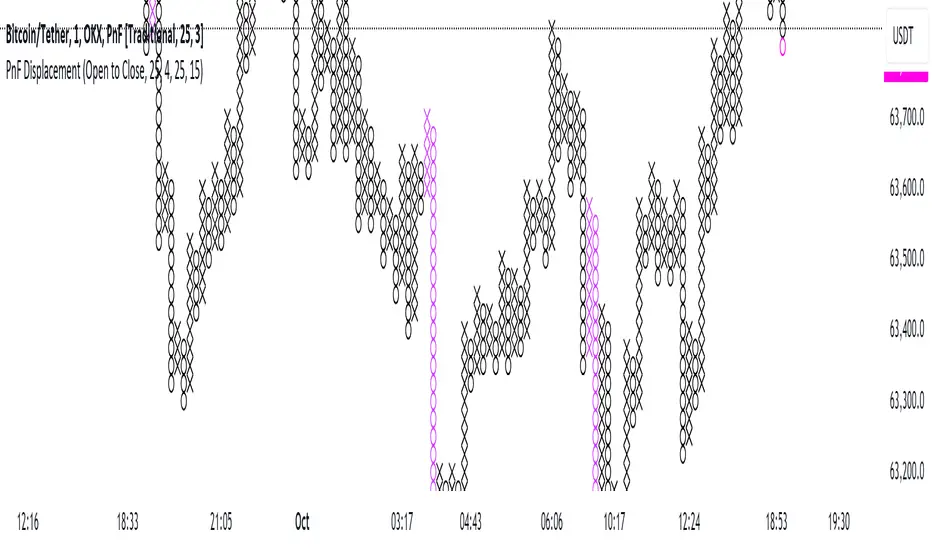
Point and Figure Displacement IndicatorThe PnF Displacement indicator is my custom script for TradingView, designed to analyze Point and Figure (PnF) charts with displacement features.
Key components of the script include:
User Inputs:
Require FVG: A boolean input to determine if a Fair Value Gap (FVG) is required for displacement calculations.
Displacement Type: Allows users to choose between "Open to Close" and "High to Low" for column range calculations.
Displacement Length: Defines how far back to look for calculating the standard deviation of the column range.
Displacement Strength: Multiplier for the standard deviation to adjust sensitivity.
Box Size: Sets the size of each box in the PnF chart.
Number of Boxes for Minimum Displacement: Specifies how many boxes to consider for calculating the minimum displacement.
Displacement Logic:
The script calculates the column range based on the selected displacement type.
It computes a standard deviation of the candle range and determines a minimum displacement based on user-defined box size and count.
The displacement condition combines the FVG check and the column range against the calculated minimum.
Visual Representation:
The bars are colored based on displacement conditions, enhancing visual analysis on the chart.
This indicator aids traders in identifying significant price movements in PnF charts while incorporating user customization options for better analysis.
ICT Balance Price Range [UAlgo]The "ICT Balance Price Range " indicator identifies and visualizes potential balance price ranges (BPRs) on a price chart. These ranges are indicative of periods where the market exhibits balance between bullish and bearish forces, often preceding significant price movements.
🔶 What is Balanced Price Range (BPR) ?
Balanced Price Range is a concept based on Fair Value Gap. Balanced price range (BPR) is the area on price chart where two opposite fair value gaps overlap.
When price approaches the Balanced Price Range (BPR), we assume that the price will react quickly and strongly here. This is because its the combination of two fair value gaps and being a good point of interest for smart money traders.
🔶 Key Features:
Bars to Consider: Determines the number of bars to evaluate for BPR conditions.
Threshold for BPR: Sets the minimum range required for a valid BPR to be identified.
Remove Old BPR: Option to automatically remove invalidated BPRs from the chart.
Bearish/Bullish Box Color: Customizable colors for visual representation of bearish and bullish BPRs.
🔶 Disclaimer
This indicator is provided for educational and informational purposes only.
It should not be considered as financial advice or a recommendation to buy or sell any financial instrument.
The use of this indicator involves inherent risks, and users should employ their own judgment and conduct their own research before making any trading decisions. Past performance is not indicative of future results.
🔷 Related Scripts
Fair Value Gaps (FVG)

BigBeluga - Smart Money ConceptsSmart Money Concepts (SMC) is a comprehensive toolkit built around the around the principles of "smart money" behavior, which refers to the actions and strategies of institutional investors.
SMC transcends traditional technical analysis by delving deeper into this framework. This approach allows users to decipher the actions of these influential players, anticipate their potential impact on market dynamics, and gain insights beyond just price movements.
This all-in-one toolkit provide the user with a unique experience by automating most of the basic and advanced concepts on the chart, saving them time and improving their trading ideas.
🔹Real-time market structure analysis simplifies complex trends by pinpointing key support, resistance, and breakout levels.
🔹Advanced order block analysis leverages detailed volume data to pinpoint high-demand zones, revealing internal market sentiment and predicting potential reversals. This analysis utilizes bid/ask zones to provide supply/demand insights, empowering informed trading decisions.
🔹Imbalance Concepts (FVG and Breakers) allows traders to identify potential market weaknesses and areas where price might be attracted to fill the gap, creating opportunities for entry and exit
🔹Swing failure patterns help traders identify potential entry points and rejection zones based on price swings
🔹Liquidity Concepts, our advanced liquidity algorithm, pinpoints high-impact events, allowing you to predict market shifts, strong price reactions, and potential stop-loss hunting zones. This gives traders an edger to make informed trading decisions based on multi-timeframe liquidity dynamics
🔶 FEATURES
The indicator has quite a lot of features that are provided below:
Swing market structure
Internal market structure
Mapping structure
Discount/Premium zone
Adjustable market structure
Strong/Weak H&L
Sweep
Volumetric Order block / Breakers
Fair Value Gaps / Breakers (multi-timeframe)
Swing Failure Patterns (multi-timeframe)
Deviation area
Equal H&L
Liquidity Prints
Buyside & Sellside
Sweep Area
Highs and Lows (multi-timeframe)
🔶 BASIC DEMONSTRATION
The preceding image illustrates the market structure functionality within the Smart Money Concepts indicator.
Solid lines: These represent the core indicator's internal structure, forming the foundation for most other components. They visually depict the overall market direction and identify major reversal points marked by significant price movements (denoted as 'x').
Dotted lines: These represent an alternative internal structure with the potential to drive more rapid market shifts. This is particularly relevant when a significant gap exists in the established swing structure, specifically between the Break of Structure (BOS) and the most recent Change of High/Low (CHoCH). Identifying these formations can offer opportunities for quicker entries and potential short-term reversals.
Sweeps (x): These signify potential turning points in the market where liquidity is removed from the structure. This suggests a possible trend reversal and presents crucial entry opportunities. Sweeps are identified within both swing and internal structures, providing valuable insights for informed trading decisions.
🔶 USAGE & EXAMPLES
The image above showcases a detailed example of several features from our toolkit that can be used in conjunction for a comprehensive analysis.
Price rejecting from the bullish order block (POC), while printing inside a bullish SFP and internal structure turning bullish (Internal CHoCH).
The image further demonstrates how two bearish order blocks could potentially act as resistance zones when prices approach those levels. These areas might also offer attractive locations to place take-profit orders.
The price has reached our first take-profit level, but is exhibiting some signs of weakness, suggesting a potential pullback which could put the trade at higher risk.
On the other hand, the price action currently exhibits strong bullish sentiment, suggesting favorable entry points and a potential upward trend.
The price has now fully reached our take-profit zone and is also exhibiting bearish confluence, indicating a potential price reversal or trend shift.
🔶 USING CONFLUENCE
The core principle behind the success of this toolkit lies in identifying "confluence." This refers to the convergence of multiple trading indicators all signaling the same information at a specific point or area. By seeking such alignment, traders can significantly enhance the likelihood of successful trades.
In the image above we can see a few examples of the indicator used in confluence with other metrics included in the toolkit.
Liquidity Prints within order blocks
SFP close to the POC
Sweep in liquidity close to a fair value gaps
These are just a few examples of what applying confluence can look like.
🔶 SETTINGS
Window: limit calculation period
Swing: limit drawing function
Internal: a period of the beginning of the internal structure
Mapping structure: show structural points
Algorithmic Logic: (Extreme-Adjusted) Use max high/low or pivot point calculation
Algorithmic loopback: pivot point look back
Premium / Discount: Lookback period of the pivot point calculation
Show Last: Amount of Order block to display
Hide Overlap: hide overlapping order blocks
Construction: Size of the order blocks
Fair value gaps: Choose between normal FVG or Breaker FVG
Mitigation: (close - wick- avg) point to mitigate the order block/imbalance
SFP lookback: find a higher / lower point to improve accuracy
Threshold: remove less relevant SFP
Equal h&L: (short-mid-long term) display longer term
Any Alert(): Trigger alerts based on the selected inputs
Bezahltes Script

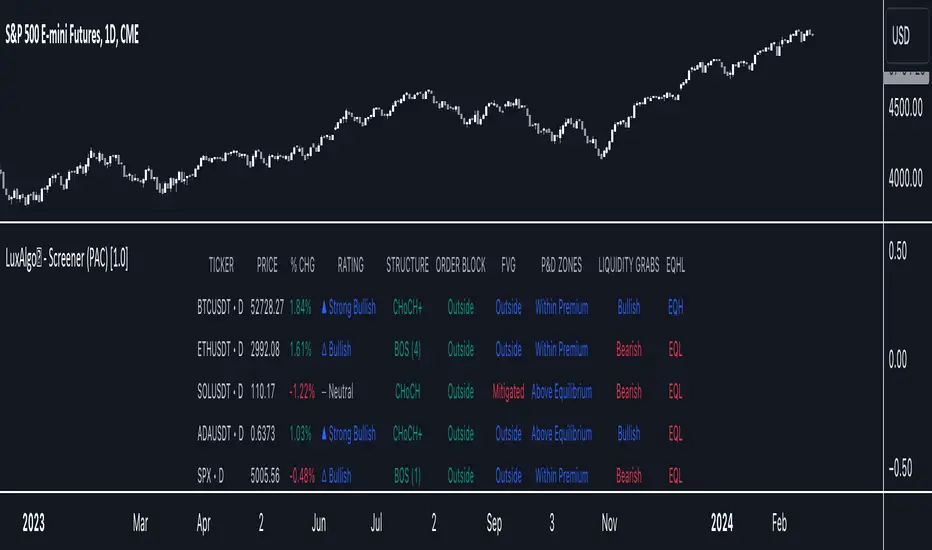
LuxAlgo® - Screener (PAC)The LuxAlgo® - Screener (PAC) is a complete tool allowing users to check returned information from the Price Action Concepts™ toolkit's features for various user selected tickers and timeframes.
Users can customize the returned information by the screener, as well as filtering out displayed tickers based on custom user set rules.
🔶 FEATURES
Users can place the location of the screener everywhere they want, multiple locations are supported, you can even have it on your chart by drag and dropping the screener to your chart, allowing you to analyze them alongside your favorite indicators.
Keeping track of various tickers is crucial to have a deeper understanding of the overall market activity.
Our screener let you quickly access your preferred information in a convenient way thanks to the described features below:
Screening of the main Price Action Concepts™ features on up to 10 user selected tickers and timeframes.
Ticker filtering based on custom user set rules.
Ticker sorting based on ascending/descending user selected data returned by the screener.
The LuxAlgo® - Screener (PAC) returns the following information:
Current price
Current volume
Current price percent change (% CHG)
Current price change (CHG)
Current rating
Most recent market structure
Most recent Order Block type and relative position to price
Order Block buy volume
Order Block sell volume
Order Block total volume
Most recent user set imbalance type status. Options include screening for FVG, Inverse FVG, Double FVG, Volume Imbalance and Opening Gap
Price position relative to Premium/Discount zones
Most recent liquidity grab
Most recent equal high/low
🔹 Rating
Users can quickly check the overall sentiment based on the screeners returned information by looking at the Rating column. Tickers can be rated as follows:
▲ Strong Bullish (more than 80% of the returned information is bullish)
△ Bullish (60% to 80% of the returned information is bullish)
― Neutral (40% to 60% of the returned information is bullish)
▽ Bearish (20% to 60% of the returned information is bullish)
▼ Strong Bearish (less than 20% of the returned information is bullish)
This can be a quick way to asses the confluence between all the returned information on the screener for a specific ticker.
🔹 Filtering
Thanks to the integrated filtering capabilities of the LuxAlgo® - Screener (PAC) you will be able to keep track of the information from tickers that return specific information you want to see.
For example do you want to only see the information from up trending tickers? Nothing easier, all you need is to select the up trending related options (▲ Strong Bullish or △ Bullish) in the rating dropdown menu.
However, you don't have to stop at 1 filtering condition, create more complex ones that fits your trading style for the tickers you truly want to look at!
🔹 Sorting
As traders we want to quickly spot the tickers with most volume, most volatility, with the strongest uptrend or downtrend.
The LuxAlgo® - Screener (PAC) lets you do that by sorting supported information in an ascending or descending order, letting you access the most relevant information faster.
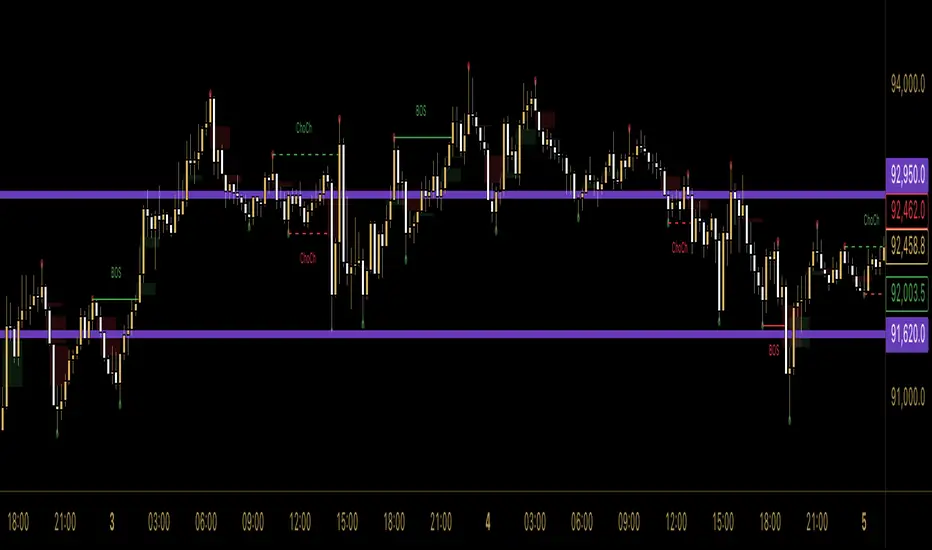
ICT Premium/DiscountGuided by ICT mentorship and help from TraderTim and its community, I created this versatile indicator to mark a "Premium/Discount" price range.
This indicator shows the Premium and Discount Zones in an alternative way, manually setting the start of the band and automatically shows the HTF and LTF FVG present only in the set band, having a cleaning of the graph from possible other distractions, so as to be able to have a clear vision clear of the set trading range
The user has the possibility to:
- Choose the start of the interval from the graph by moving the start line
- Choose to show levels 50% - 75% - 25% of the range
- Choose the color, style and size of the lines
- Choose to display FVG LTF or HTF in range
- Choose the FVG mitigation mode
The indicator must be used as shown by the ICT in its concepts, the Premium and Discount zones are nothing more than zones where the price risks retracing, and consequently we can evaluate making entries in the Premium Zone, Sell is evaluated, in the Discoutn Zone they are evaluated as Buy, taking the opposite area as Take Profit
As in the example below:
If anything is unclear, comment below and I will get back to you as soon as possible.
How to change range:

Order Block & Fractal Zones (OBFZ) Indicator.The "Order Block & Fractal Zones (OBFZ) Indicator." indicator is a technical analysis tool designed to identify and display key price levels on a chart. It utilizes the concept of Order Blocks and the Fractal Value Zone (FVG) to highlight potential support and resistance areas in the market.
The indicator marks bearish and bullish Order Blocks, which are significant price structures characterized by consecutive higher highs and higher lows for a bearish block, or consecutive lower lows and lower highs for a bullish block. These blocks suggest potential areas of market reversal.
Additionally, the indicator calculates and displays retracement and extension levels within each Order Block. These levels are derived from the previous highest and lowest values within a specified number of candles. The retracement levels include 38.2%, 50%, and 61.8%, while the extension levels include 138.2%, 150%, and 161.8%.
Furthermore, the Fractal Value Zone (FVG) is determined to identify the highest high and lowest low within the selected number of candles. The FVG helps identify areas of significant price action and potential breakout zones.
Overall, the "Order Block & Fractal Zones (OBFZ) Indicator." indicator assists traders in identifying potential support and resistance levels, as well as areas of market reversal or breakout. It can be used to make informed trading decisions based on key price levels within the observed price action.
Model Indicator |ASE|The purpose of this indicator is to allow the user to build their own model. Each feature works cohesively together and depending on the filters you enable, the model gives less and more specific entries. This benefits the trader because they have complete control over the kinds of trades they want to take, while maintaining its automatic form.
We want to be as customizable as possible while still meeting our users’ needs. We started this indicator to propel us into our ultimate project, the ASE Algo.
Features:
SMC Display
Current Structure:
Liquidity Levels:
Daily Premium Discount Array
SMT Divergence
Displacement Candles:
Entry Factors
FVG
Continuation FVGs
MTF FVGs
Order Blocks
MTF Order Blocks
Confluence Filters
MS Reversal
Liquidity Level Raid
Inducement
Daily Prem/Disc Array
Target Factors
Liquidity Level Targets
Current Structure Targets
Trade Management
Trade Overlay
Risk:Reward Target
Benefits & Examples:
In the image below the indicator signaled multiple entries based on two simple confluence filters, a MS reversal (CHoCH/MSS) and a Liquidity Raid. Going from left to right we can see a short entry at the highs with a supporting Order Block. Liquidity levels are taken before we see a double IDM right below the respected OB that leads to the next signaled entry. In the middle of the chart we see a long entry that leads right into a short entry showing the effectiveness of such a simple model.
In this supporting image we are showcasing the first implementation of the Trade Overlay feature. This feature displays the Entry and Stop Loss to make it more visible and adds a risk to reward target. Additionally displayed is the SMC Toolkit indicator showing us additional confirmation with our signaled entries playing right out of a higher timeframe FVG.
An additional entry feature is the MTF zone. Setups can form on all timeframes and subjecting yourself to only one may lead you to miss out on some perfect setups or a larger move. In the image below we are on the 1 minute timeframe. We can see the Initial Reversal Entry which played out beautifully and filled a higher timeframe SFVG. With the MTF zone we can see a 3 minute and 5 minute Zone which produces the rest of the trend reaching another higher timeframe SFVG after filling the previous one. Once again showing the benefit of the Toolkit indicator but the plotted entries from such a simple model.
In addition to the model indicators filtered out entry zone, we can use additional confluences to confirm these entries. In the image below we can see a short entry printed after a move out of the Std. Dev. vwap wave which shows over extension. Taking the entry we can have a tight stop loss at the vwap wave or the recent high where we have a liquidity level, targeting a lower liquidity level or higher timeframe FVG.
For this example we are only filtering based on MS Reversals (CHoCH/MSS) to get our entries. Because of this we need additional confirmation to be confident in taking the plotted entry. In the image below you can see a long signal printed, confirmation being the previous Failed Reversal.

Volume Tick Analysis and Order Blocks [Tcs] | ALGOThe indicator has been developed to provide the most complete vision possible of liquidity areas, highly traded past price levels, and how volume tick analysis affects price action.
It helps to draw on all the areas that generate a price move, or market inefficiency.
The indicator has different features:
- ORDER BLOCKS : The indicator draws different kinds of order blocks on the chart.
• Real valuable order blocks - where the price reaction is more probable. It's define by a calculation of the quantity tick volume exchanged between bulls and bears on a price level, which can create a candle event, such as engulfing candles. For this motivation the order blocks plotted will be a real valuable area.
The threshold can be adjusted based on the strategy's needs, in particular this set up has been added to adapt the strategy on different kind of asset. For Cryptocurrency for example the best threshold are between 0.5 and 1. The lower the value, the fewer order blocks will be plotted, but they will be more valuable. It's possible to show the volume exchanged, the percentage, and who controlled the valuable area, bulls or bears, on these order blocks.
For a better visualization, the order block will change color (more transparent) after it will be violated for the first time, and it will be deleted once the price will break trough it.
All order blocks can be extend
GENERAL OB VISUALIZATION
EXAMPLE OF TRADES ON OB
It's also possible to plot the footprint of past and invalidated order blocks on the chart, which can help to draw lines for future valuable areas.
• Secondary order blocks are less valuable order blocks where the probability of a price reaction is less. Usually, they work for small retracements and are more useful for scalpers. the concept is the same as Primary order blocks but without a too restricted calculation of tick volume exchanged
• LIQUIDITY GRABS: Liquidity grabs are plotted on candles that try to invalidate an order block, but high volumes move them to the opposite direction. They happen when opposite players try to move the market in the opposite direction. They are calculated only on primary order blocks.
A good entry usually is when a liquidity grab appear, the price come in the liquidity grab area to fry liquidity and price close again in the liquidity grab area.
• VOLUME VSA: All candles with high and above-average volume are plotted on the chart for both bull and bear volume. It highlights more than average volume, high volume, and extreme volume with different colors. This can help to spot good entries or detect beginning/end of a trend. For example abnormal high volume at the end of a big price movement, in the same direction, can define the end of a trend. If same situation of abnormal high volume, but in the opposite direction of the trend, could define the beginning of a market inversion.
• FAIR VALUE GAPS: It highlights all the inefficiencies of market moves, which can be used as retracement or price return areas. Here, they can be adjusted based on how effective they are adjusting the volume threshold. Bulls and bears FVG are defined in different colors. More effective FVG are plotted in less transparent colors, and you will find three levels of effectiveness.
Both OB and FVG will change color once the price retraces on them, and they will be removed when they are invalidated.
Please note that this indicator is for educational purposes only and should not be used for trading without further testing and analysis.

Bodies X Wix Version of Smart Money Tools by makuchaku & eFeThis is the same Script as Super Fair Value Gaps / FVG /BoS / by makuchaku & eFe. Mine Should Default to Large Text instead of small. The Super Order Blocks I believe was meant to for you to find one of the many Smart Money tools such as turn on the Fair Value gap but leave the others off, or Turn on where the Break of Structure and leave the others off. The reason I believe this is because the default values for each of the structures were default colored (green for positive and red for negative) for all.
Mine has a different Color for every possible structure. As long as you can read with the larger text that I added, then you can create your own boxes positive for break of structure, rejection block, order blocks and fair value gaps for any time frame. The reason I did that is because There's only certain things I believe I will need to mark for myself in each time frame, and then from there You can stretch iyour own box out further in time because if price touches a fair value gap for example, the fair value gap should conyinue in time until at least 2 candles have filed the Fair valu gap going both directions. That's truly when the fair value gap should is mitigated and will from off the chart. However, If I knew How to add the code for that, I would.
Additionally, I have the Max Boxes per chart, so you should have the ability to see every OB, FVG,RJB, & BoS on the chart
I tried my hardest to create a colored border that was different from the box. But the way the original was coded was almost impossible to do. Because they defined each of the structures (FVG, OB, BoS, RJB) outer levels, when the outer levels connect via math in the code, then it joins all the outside lines for a rectangle. When creating a box, the coloe will always be the same as the border unfortunately. (Unless I replan this from the beginning)
I also Changed the default labels for reach structure from a hard to read gray to a white that pops out.
Also, chart indicators are a little large as well. Such as the cross, sideways cross, The green Triangle, and the white Diamond. You'll get used to it or you can change it as well.
Creating videos for students, you need something they can see.
So, I just wanted to ensure everything was a little more unique and easily usable when showing this to my students when I send them private videos for our weekly lessons. I'm trying to learn how to use the IPFS for THAT, (which i see has invaded PineScript) Hope this indicator helps.
If you're to borrow this, Just make sure you keep the authors in the name makuchaku & efe

Smart Money Concepts [Kodexius]Smart Money Concepts is a price action framework designed to integrate market structure, liquidity behavior, and inefficiencies into a single, readable view. Rather than acting as a signal generator, it serves as a live market map highlighting where price has displaced, where liquidity may be resting, which zones remain valid, and how that context updates as new candles print.
What separates this script from typical “SMC bundles” is not the presence of familiar concepts like swings, order blocks, FVGs or liquidity sweeps. The value is in the engine design and how the components are maintained together as a consistent state, with automatic pruning and prioritization so the chart stays usable over time. Many tools can draw boxes, but fewer tools manage the lifecycle of those zones, reduce overlap, rank relevance, and keep the display focused on what still matters near current price.
At the core is a structure model that tracks directional state and labels structural transitions as they happen. CHoCH and BoS are not just printed whenever price crosses a line. Each event is anchored to a swing reference and handled in a way that reduces repeated triggers from the same context, helping you see genuine transitions versus minor noise. This gives structure a “narrative” across time instead of a cluttered sequence of identical labels.
Order blocks are built from the most relevant candle within the post break window and displayed as true zones that extend forward while they remain valid. Beyond the zone itself, the script adds context that is usually missing in basic OB implementations: a volumetric pressure visualization and a displacement strength score that is normalized and ranked over a rolling window. In practice, this creates an information hierarchy. You can quickly see which zones carried more participation, whether the internal push was dominated by buying or selling pressure, and whether the move that created the zone had meaningful displacement relative to recent history. This is designed to help prioritization, not to claim prediction.
Imbalances are handled as a dedicated module with multiple detection modes (FVG, VI, OG, IFVG) and optional MTF logic so you can map inefficiencies from a higher timeframe while executing on a lower timeframe. Each imbalance is displayed as a zone with a midline reference, and mitigation behavior can be tuned (wick or close). IFVG adds lifecycle depth by tracking inversion behavior rather than simply deleting the zone, which can be useful for monitoring how price rebalances and flips inefficiencies over time. An optional sentiment style internal fill is available for visual context, but it is intentionally framed as informational rather than a “buy/sell meter.”
Liquidity is treated as an event driven layer. Pivot highs and lows are tracked as potential liquidity pools, then monitored for sweeps and rejection behavior. If you enable EQH/EQL logic, the script can label equal highs and lows during the sweep process to highlight common resting liquidity formations. A volume filter is available to reduce low quality levels, aiming to keep the liquidity map focused on swings that occurred with meaningful participation rather than every small fluctuation.
Swing Failure Patterns (SFP) are included as a separate confirmation style tool that focuses on rejection after liquidity is taken. The module supports optional volume validation using lower timeframe volume distribution outside the swing level, which helps filter some low quality SFPs on noisy instruments. The output is a cleaner set of events intended to complement structure, liquidity and zones, not replace discretionary decision making.
For higher timeframe context, the HTF candle projection panel can display a compact set of higher timeframe candles to the right of current price, with classic or Heikin Ashi style and configurable sizing, spacing and labels. This allows you to maintain HTF awareness without switching charts, which is especially helpful when structure and zones are being interpreted across multiple timeframes.
Finally, the alert framework is designed around well defined structural and zone states. Alerts cover structural shifts (CHoCH, BoS), liquidity sweeps, new and broken order blocks, breaker behavior (if enabled), new and approached imbalances, premium and discount entries, trendline events, and SFP detection. These alerts are intended as monitoring prompts so you can review context, not as automated trade execution signals.
Every major component is modular and configurable. You can run a minimal structure only layout or enable a full framework with zones, imbalances, liquidity, SFP and HTF projection. The guiding principle is chart clarity and relevance: keep the most important information visible, reduce overlap and stale objects, and maintain a consistent view of how price is interacting with liquidity and value over time.
🔹 Features
🔸 Market Structure Engine (CHoCH and BoS)
This script automatically tracks zigzag based market structure and differentiates between:
CHoCH (Change of Character) : the first meaningful structural shift that suggests the prior directional leg is weakening.
BoS (Break of Structure) : continuation breaks that confirm structure extension in the active direction.
Instead of relying on plain pivot dots, our market structure swings are built with a lightweight zigzag style engine that tracks direction and “locks in” the true leg extreme only when the leg flips. This produces cleaner, more consistent swing highs/lows for BOS/CHoCH than simple left/right pivot checks.
Bullish CHoCH:
Bearish CHoCH:
Bullish BoS:
Bearish BoS:
🔸 Order Blocks with Volumetric and Displacement Insight
The script identifies recent bullish and bearish order block zones around meaningful structural reactions and keeps the display focused on the most relevant areas. Instead of drawing a static rectangle and leaving it there forever, each zone is maintained as an active region on the chart and can be limited by a user defined visibility depth to avoid clutter. When enabled, the overlay also adds compact volume based context inside the block so you can quickly compare relative participation between recent zones and see whether the origin move showed strong follow through versus a softer transition. The intention is to provide structured context and cleaner prioritization on the chart, not to present a trade call or a guaranteed reaction level.
Bullish Order Block:
Bearish Order Block:
Order blocks are derived from the structure shifts, marking the institutional “origin zone” behind a decisive move and projecting it forward as a live area of interest. In practice, it highlights the candle cluster where price last rebalanced before expanding away, so you can track potential retests with context instead of guessing.
Inside each order block, the internal bars act as a compact strength meter green vs red summarizes the relative bullish vs bearish participation, while the blue segment reflects the “departure force” (displacement/momentum) away from the zone. It’s meant to help you scan which blocks left clean and strong versus those that moved out more slowly or with mixed pressure.
🔸 Breaker Blocks & Mitigation Tracking
Tracks when previously identified order blocks fail and converts them into breaker blocks, visually marking a change in how price is interacting with that zone.
Bullish Breaker Block :
Bearish Breaker Block :
Separate handling of bullish and bearish breakers with clear color differentiation.
Includes optional “mitigation” logic using either wick or close to determine when a block is considered broken or mitigated.
Breaker blocks are updated and removed dynamically as price trades through them, keeping the chart focused on current, active zones.
🔸 Imbalances
The imbalance module maps common price inefficiencies as zones, with support for multiple detection styles such as Fair Value Gaps, volume style imbalances, opening gaps, and an inverted gap mode. Each imbalance is drawn as a practical area on the chart with a midpoint reference, so you can quickly see where price may be revisiting unbalanced movement. You can also choose how mitigation is evaluated (wick or close) and optionally run imbalance detection on a separate timeframe for cleaner higher timeframe context while staying on your execution chart.
Fair Value Gaps:
Inverse Fair Value Gaps:
Opening Gaps:
🔸 Liquidity Sweeps, EQH/EQL, and Optional Volume Filter
Liquidity levels are derived from swing highs and lows and then monitored for sweep behavior, where price trades beyond a prior level and rejects back. If you enable EQH/EQL marking, the script can highlight equal highs and equal lows behavior around those liquidity areas to make common pool formations easier to spot. An optional volume filter can be used to reduce tracking of low participation swings, helping keep the liquidity layer focused and less noisy on instruments that produce frequent small pivots.
Sellside Liquidity Sweep Definition:
Buyside Liquidity Sweep Definition:
Highlights equal highs (EQH) and equal lows (EQL) when sweeps occur, marking where price probed above/below prior liquidity and then rejected.
Optional volume filter to ignore low volume swings and focus on more meaningful liquidity zones.
🔸 Premium, Discount, and Equilibrium
The premium and discount view provides a simple contextual map of where price is trading within a measured range, alongside an optional equilibrium line as a midpoint reference. This is intended as a higher level framing tool to help you avoid treating every price location the same, especially when combining structure with reaction zones. Price labels can be enabled for quick orientation, and the display updates as the underlying range evolves.
Projects premium and discount bands based on a dynamically measured range, offering a simple view of where price is trading relative to that range.
Draws separate Premium and Discount boxes with optional price labels for quick orientation.
Optional mid line (equilibrium) to visualize the “50%” of the current range, often used as a reference for balanced versus extended price.
Zones auto update as the underlying range evolves, with logic to prevent stale levels from cluttering the chart.
🔸 Trend Channels
When enabled, the trend module draws swing based diagonal structure using trendlines and a channel style visualization. You can tune sensitivity and choose whether the source should be depending on how you prefer to read trend behavior. The channel is maintained dynamically so you can keep directional context without manually drawing and constantly adjusting diagonal lines, and the script can highlight basic break behavior when price pushes beyond the active diagonal reference.
🔸 Swing Failure Pattern (SFP) Detector
The SFP module highlights common swing failure behavior, where price briefly trades beyond a swing level and then reclaims it, often reflecting a liquidity grab followed by rejection. Bullish and bearish SFPs can be enabled independently, and the display is designed to keep the key level and the rejection visible without excessive clutter. Optional volume validation can be used as a filter, so you can choose whether you want the detector to be more permissive or more selective based on participation characteristics.
🔸 HTF Candle Projection Panel
The HTF panel projects a compact set of higher timeframe candles to the right of price, giving you higher timeframe context without switching charts. You can select classic candles or Heikin Ashi style, adjust the scale and spacing, and optionally display reference lines and labels for OHLC values. This is a visual context tool intended to support multi timeframe reading, not a replacement for your own higher timeframe analysis.
In addition to projecting higher timeframe candles, the HTF panel can also detect and visualize higher timeframe liquidity sweeps directly within the projected candle set. The script monitors each completed HTF candle’s high and low and evaluates subsequent HTF candles for sweep behavior i.e., when price briefly trades beyond a prior HTF extreme but fails to hold acceptance beyond it (filtered using the later candle’s body positioning). When a sweep is detected, the panel draws a dotted sweep line and marks the event, allowing you to spot HTF stop runs and failed breaks without switching timeframes. Sweeps are dynamically invalidated if a later HTF candle shows genuine acceptance beyond that level, ensuring the display stays context relevant and avoids stale markings. This turns the HTF projection from a passive visualization into an actionable context layer for identifying HTF liquidity events while executing on lower timeframes.
🔸 Alerts
Alerts are included for the most practical events produced by the overlay, such as structure shifts (CHoCH and BoS), liquidity sweeps, new and invalidated zones, price approaching recent zones, imbalance creation and mitigation, premium or discount entries, trendline events, and SFP detections. The alerts are designed to function as a monitoring layer so you can be notified when something changes in your mapped context, rather than acting as standalone trade instructions.
🔸 Originality & Usefulness
This script is not a collection of separate SMC drawings layered on top of price. It is built as a unified price action engine where market structure, order blocks, inefficiencies, and liquidity are produced from the same evolving state. That matters because most SMC indicators treat these concepts as independent overlays, which often leads to contradictory markings and excessive clutter. Here, the design priority is consistency and readability: modules update in sync, older elements are managed, and the chart stays usable during live conditions.
A key differentiator is the internal swing logic, which functions like a compact zigzag style structure engine. Instead of reacting to every minor fluctuation, it aims to focus on meaningful swing decisions and treat structure as a sequence. This reduces repetitive labeling and makes structural transitions easier to follow. Structure events are anchored to the swing that defined them and are designed to trigger in a clean, non spammy way, which is critical for anyone who uses structure as a workflow backbone.
The structure layer is intentionally narrative oriented. It separates a transition event from continuation events, so CHoCH is used to highlight the first meaningful shift after an established leg, while BoS is used to mark follow through in the same direction. This is not a prediction claim. It is a clarity feature that helps users read “phase changes” versus “continuation” without constantly second guessing whether the script is just printing noise.
Order blocks are where this script becomes especially distinctive compared to typical SMC tools. Instead of drawing identical rectangles, each block is rendered with an internal gauge that communicates participation and directional dominance at a glance. The zone is visually segmented to reflect bullish and bearish pressure components, and it also carries a volume readout plus a relative weight compared to other recent blocks. This creates a ranked view of blocks rather than an unfiltered pile. In practice, you can prioritize zones faster because the script surfaces which blocks had more meaningful participation and whether the internal push looked one sided or mixed. The result is less subjective filtering and a cleaner chart.
Imbalances are handled as structured inefficiency zones with clear references and optional context. Beyond drawing the zone and midpoint, the script can overlay a sentiment style gauge that divides the imbalance into bullish and bearish portions and updates as new data comes in. The practical value is that you can see whether an inefficiency remains strongly one sided or is gradually being balanced. This turns imbalances from static boxes into a living context layer, which is particularly useful when you monitor reactions over time instead of treating every touch the same.
Liquidity is treated as an event driven tracking system rather than simple pivot plotting. Liquidity pools are identified from swing behavior and can be gated through a participation filter so the script focuses on levels that formed with meaningful activity rather than low quality noise. Once tracked, levels are monitored for outcomes like sweeps and equal high/low behavior, and then updated or retired when they are decisively resolved. This prevents the display from accumulating stale levels and keeps the liquidity layer focused on what is still relevant now.
Swing failure patterns are integrated as selective events rather than continuous spam. The intent is to produce fewer but more structurally meaningful SFPs, aligned with the liquidity narrative, instead of printing clusters around the same price area. This keeps the pattern readable and reinforces the “event based” design philosophy across the script.
Higher timeframe context is supported through a compact HTF projection panel that provides quick orientation without forcing constant timeframe switching. It lets you see where current price action sits inside a larger timeframe candle and range, which helps maintain consistency when you are executing on a lower timeframe but respecting higher timeframe structure.
Disclaimer: This indicator is for educational and analytical purposes only. It does not provide financial advice, and it does not guarantee results.
🔹 How to Use
This tool is designed to support multiple trading styles, but it is most effective when you treat it as a top down mapping and decision support tool. A practical workflow looks like this.
1) Establish higher timeframe bias and context
Start on your reference timeframe such as H4 or Daily and read the market’s dominant story first. Use the Market Structure Engine to identify whether the market is in continuation mode or transition mode. The goal is to avoid executing lower timeframe ideas that conflict with the larger structure narrative.
Use the HTF Candle Projection Panel as a fast orientation aid. It helps you judge whether current price is building acceptance near the highs of the larger candle, rotating back toward its open, or rejecting from its extremes. This is especially useful when you execute on lower timeframes but want to stay aligned with higher timeframe positioning.
Add Premium and Discount framing to understand location. When price is trading in premium, continuation longs are often more selective and require stronger confirmation, while shorts may have better location if structure supports it. When price is in discount, the opposite applies. Treat this as location context, not a rule.
2) Map your key reaction zones with prioritization
Next, build your map of where reactions are most likely to occur. Enable Order Blocks with Volumetric Insight to highlight the most relevant origin zones that form after important structure events. Keep your focus on the most recent blocks and adjust the visible depth so the chart stays clean.
Use the internal gauge and participation readouts to prioritize. Instead of treating every zone as equal, treat higher participation blocks as primary candidates and lower participation blocks as secondary. The bullish and bearish split inside the gauge helps you quickly judge whether the zone formed from a clearly one sided push or a more mixed move, which can inform how strict you want to be with confirmation on a retest.
If you use Breaker Blocks, treat them as role shift zones. They are especially useful when the market has clearly transitioned and you want to track where a previously defended origin area may become a meaningful retest level later.
3) Layer in inefficiencies only where they add clarity
If your workflow includes imbalances, add them selectively to avoid visual overload. Use Fair Value Gaps, Volume Imbalances, or Opening Gaps as secondary reaction areas that often sit inside, near, or between larger zones.
If you enable the internal sentiment gauge, read it as context rather than a signal. It is meant to help you see whether the imbalance remains one sided or has started to balance out as price develops. A strongly one sided presentation can support the idea of continuation through the zone, while a more balanced presentation can support the idea of deeper mitigation or chop. Use it to refine expectations, not to force entries.
4) Track liquidity as events, not as static levels
Enable Liquidity Sweeps and EQH/EQL tagging to highlight where resting liquidity is likely concentrated and when it gets taken. The main value here is narrative: you can see when price runs obvious highs or lows and whether it immediately rejects back into structure or accepts beyond the level.
If you use the volume filter, treat it as a quality gate. The point is to ignore small, low participation swings and keep the liquidity layer focused on levels that formed with meaningful activity. This tends to reduce noise and makes sweeps and equal level behavior more relevant.
Combine the liquidity layer with the Swing Failure Pattern detector to isolate moments where liquidity is taken and then rejected. The cleanest use is when SFPs occur at or near your pre mapped reaction zones, after a sweep, and in alignment with your higher timeframe bias.
5) Refine execution timing on your entry timeframe
Drop to your execution timeframe and use local structure shifts as timing tools. CHoCH and BoS on the lower timeframe can help you see when micro structure is flipping in your intended direction after price interacts with your mapped zone.
If you use the Trend Channel framework, treat it as diagonal context rather than strict support and resistance. A channel helps you see where price is riding the trend and where it is deviating. This can help you time entries by waiting for price to re enter the corridor, show rejection near a boundary, or confirm a shift by building structure outside the channel.
A common practical sequence is: price reaches a mapped OB or imbalance area, liquidity gets taken, price rejects, micro structure begins to flip, and then you execute with your own confirmation and risk rules. The tool helps you see each step clearly, but your plan determines what is sufficient confirmation.
6) Use alerts as monitoring, not as standalone signals
Set alerts only for events that are meaningful to your workflow, such as:
-fresh CHoCH or BoS in your preferred direction
-new or invalidated order blocks and breaker blocks
-price approaching the most recent priority zones
-liquidity sweeps and EQH/EQL interactions
-new SFP events
-entry into premium or discount and interaction with HTF projection levels
-imbalance creation, mitigation, or approach
Treat alerts as prompts to check the chart, not as automatic entries or exits. This script is designed as a mapping and decision support tool. Trade execution, confirmation, and risk management remain entirely dependent on your own strategy and discretion.
🔴 Price Action Practical Notes
💠 Market structure
Market structure is the framework used to describe how price organizes itself into swings. It is built from successive swing highs and swing lows, and it is used to decide whether the market is expanding upward, expanding downward, or transitioning. A practical structure model focuses on “meaningful” turning points rather than every minor fluctuation, because the goal is to capture intent and flow, not noise.
💠 Swing highs and swing lows
A swing high is a local peak where price stops advancing and begins to rotate lower, while a swing low is a local trough where selling pressure pauses and price rotates higher. Swings matter because many traders anchor risk, liquidity, and entries around them. The stronger the reaction away from a swing, the more likely it is to be referenced again as a decision point.
💠 Break of structure
A break of structure is the event where price decisively exceeds a prior swing in the direction of the prevailing move. In practice, it is used as confirmation that a directional leg is still active and that liquidity resting beyond the swing has been taken. This concept is less about predicting and more about validating continuation.
💠 Change of character
A change of character is a structural break that signals transition rather than continuation. Instead of breaking a swing in the same direction as the recent trend, price breaks a key swing in the opposite direction, suggesting that control may be shifting. It is often treated as an early warning that the market may be moving from continuation into reversal or deeper pullback conditions.
💠 Order blocks
An order block is commonly described as the last opposing candle or consolidation zone that precedes a strong directional expansion. The idea is that this area represents a footprint of aggressive execution and unfilled interest. When price revisits it later, it can act as a reaction zone because participants who missed the move may defend it, or because remaining orders may still exist there.
💠 Mitigation and invalidation of a zone
Mitigation describes the process of price returning to a zone and “consuming” the remaining interest there. A zone is typically considered invalidated when price trades through it in a way that implies the resting orders were absorbed and the area no longer has protective value. Some approaches treat a wick through the boundary as enough to invalidate, while others require a candle close beyond the boundary to confirm that the level has truly failed.
💠 Breaker blocks
A breaker block is an order block concept that changes role after being invalidated. When a previously respected zone fails, it can later become a reaction area in the opposite direction because trapped participants may use the retest to exit, or because the market may recognize it as a new supply or demand reference. Breakers are often treated as “failed zones that become liquidity magnets” and are closely watched on retests.
💠 Liquidity and liquidity pools
Liquidity is the availability of resting orders that allow large transactions to execute with minimal slippage. In chart terms, liquidity pools often form around obvious swing highs and lows, equal highs and lows, and clear ranges. These areas attract price because they contain clustered stops and entries that can be used to fuel continuation or trigger reversals through rapid order flow shifts.
💠 Liquidity sweeps
A liquidity sweep is a move where price briefly trades beyond a known liquidity pool and then returns back inside, often closing back within the prior range. The concept implies that stops were triggered and liquidity was captured, but that continuation beyond the swept level did not sustain. Sweeps are frequently used as context for reversals or for confirming that a “cleanout” occurred before a directional move.
💠 Equal highs and equal lows
Equal highs and equal lows describe repeated swing levels that form a flat or nearly flat top or bottom. They matter because they concentrate liquidity. Many traders place stops just beyond these repeated levels, and many breakout traders place entries around them. The result is a dense cluster of orders that can be targeted efficiently by price.
💠Imbalances and inefficiencies
Imbalances represent zones where price moved so quickly that it left behind inefficient trading, meaning fewer transactions occurred in that region compared to surrounding areas. The underlying idea is that markets often revisit these areas to rebalance, fill gaps, or complete unfinished business. Imbalances are treated as areas of interest for pullback entries, targets, or reaction zones.
💠 Fair value gap
A fair value gap is a specific form of imbalance commonly framed as a three candle displacement that leaves a gap between candles, indicating rapid repricing. Traders use it as a proxy for inefficiency: if price returns, it may partially or fully fill the gap before continuing. The midpoint of the gap is often treated as a particularly relevant reference, but whether price respects it depends on context.
💠 Inverted fair value gap
An inverted fair value gap is the idea that once an imbalance is “broken” in a meaningful way, the zone can flip its behavior. Instead of acting like a supportive zone, it may become resistive (or vice versa) on a later retest. Conceptually, this is similar to role reversal: what once behaved as a continuation aid can become a rejection zone after failure.
💠 Premium, discount, and equilibrium
Premium and discount describe where price sits relative to a defined recent range. Premium is the upper portion of that range and discount is the lower portion. Equilibrium is the midpoint. The concept is mainly used to align trade direction with location: buying is generally more attractive in discount and selling is generally more attractive in premium, assuming you are trading mean reversion within a range or seeking favorable risk placement within a broader trend.
💠 Swing failure pattern
A swing failure pattern is a reversal archetype where price breaks a known swing level, fails to hold beyond it, and returns back through the level. The logic is that the breakout attempt attracted orders and triggered stops, but the market rejected the extension. SFPs are often considered higher quality when the failure is followed by a decisive move away and when it aligns with a broader liquidity narrative.
💠 Higher timeframe context
Higher timeframe context means framing intraday or lower timeframe signals within the structure of a larger timeframe. This can include aligning trades with higher timeframe swings, using higher timeframe candles as reference for open/high/low behavior, and avoiding taking counter trend signals when the larger timeframe is strongly directional. The purpose is to improve signal quality by ensuring the smaller timeframe idea is not fighting a dominant larger flow.
💠 Trend channels
A trend channel is a structured way to visualize a market’s directional “lane” by framing price between two roughly parallel boundaries. The central idea is that trending price action often oscillates in a repeatable corridor: pullbacks tend to stall around one side of the lane, while impulses tend to extend toward the opposite side. Instead of treating trend as a single line, a channel treats trend as an area, which better reflects real market behavior where reactions occur in zones rather than at perfect prices.
A channel typically has three functional references: a guiding line that represents the prevailing slope, an upper boundary that approximates where bullish expansions tend to stretch before mean reversion, and a lower boundary that approximates where bearish pullbacks tend to terminate before continuation. The space between boundaries represents the market’s accepted path. When price stays inside this corridor, the trend is considered healthy. When price repeatedly fails to progress within it, the trend is weakening.
Channels are commonly used for timing and location. In an uptrend channel, pullbacks into the lower portion of the corridor are often treated as higher quality “location” for continuation attempts, while pushes into the upper portion are treated as extension territory where risk of a pause or retracement increases. In a downtrend channel, the logic is mirrored: rallies into the upper portion are often treated as sell side location, and moves into the lower portion are treated as extension territory. The channel does not predict direction by itself; it provides a disciplined map for where continuation is more likely versus where momentum is more likely to cool.
A key concept is acceptance versus deviation. If price briefly pierces a boundary and snaps back inside, that is often interpreted as a deviation, meaning the market tested outside the lane but did not accept it. If price holds outside the corridor and begins to build new swings there, that suggests acceptance and a potential regime change: either a new channel with a different slope, a shift into range, or a broader reversal context. This is why channels are most useful when you treat them as a framework for evaluating behavior, not as rigid support and resistance.

Trading Playbook Panel (SMC + EW + Sniper)🔥 What This Script Does
The indicator creates a visual floating panel containing:
1. HTF Bias Framework (H4 → H1 → M15)
Guides you through determining trend, liquidity direction, imbalance zones, and institutional order flow.
2. Valid Setup Models
Covers both:
Continuation setups (displacement → OTE → FVG entry)
Reversal setups (liquidity sweep → CHoCH → retest)
3. 5-Minute Sniper Entry Checklist
Ensures high-precision entries with:
Liquidity sweep
CHoCH
Displacement
FVG formation
Retest entry
Strict invalidation rules
This is the exact logic used in prop-firm and institutional trading models.
4. Stop-Loss & Invalidation Rules
Built with institutional logic:
SL beyond liquidity sweep
SL beyond invalidation swing
Works for both BUY and SELL setups.
5. Multi-Stage Take Profit Mapping
Including:
Internal liquidity
Equal highs/lows
Imbalance
Opposite OB
HTF draw
Designed for partials + runners.
6. Risk-Management System
A complete discipline structure:
0.5–2% risk per setup
Max daily loss
Max trades per day
Stop-after-loss rule
No chasing / no mid-range entries
7. Pre-Trade Checklist
A professional assessment framework to verify trade quality.
8. Trading Psychology Principles
Reinforces mindset, discipline, and patience.
⭐ Who This Script Is For
This tool is ideal for:
SMC traders
ICT style traders
Elliott Wave traders
Scalpers & intraday traders
Prop-firm challengers
Anyone wanting to follow a repeatable, rules-based system
It keeps you consistent, structured, and focused on the highest-probability setups.
🧠 Why This Script Works
Most traders lose because they:
Enter impulsively
Skip rules
Don’t analyze multi-timeframe structure
Enter without liquidity confirmation
Use random entry zones
This script eliminates that.
It forces a clear, step-by-step process:
1️⃣ Top-down bias
2️⃣ Liquidity location
3️⃣ Sweep → CHoCH → Displacement
4️⃣ Refined 5M entry
5️⃣ Strict SL & TP rules
It removes emotion and replaces it with pure process.
⚙️ Customizable
Move the panel anywhere on the chart
Change panel colors
Change text colors
Perfect for dark or light mode
🎯 Summary
This is not a trading signal indicator.
This is your rulebook, your discipline engine, and your playbook — right on your chart.
It keeps you aligned with the highest-probability setups used by advanced SMC and EW traders.
Use it before every trade.
Trade like a professional — every day.

ICT 3 Models - Entry Signals 1.2This script combines 3 powerful ICT (Smart Money Concepts) Entry Models into one comprehensive strategy setup. It is designed to identify high-probability setups based on Higher Timeframe POIs and includes a fully functional Strategy Tester engine.
🔥 The 3 Entry Models:
Model 1 (MSS + FVG): Classic reversal setup using HTF Order Blocks, Liquidity Sweep, Market Structure Shift (MSS), and entry at FVG.
Model 2 (SMT / Sweep): Catches "Turtle Soup" or Failure Swing setups where price grabs liquidity and quickly reverses using FVG confirmation.
Model 3 (AMD / Box): Accumulation, Manipulation, Distribution setup. Identifies consolidation boxes and trades the manipulation leg.
✨ Highlights:
Full Backtesting Engine: Test the strategy with customizable Initial Capital and Order Sizing.
Auto HTF POI: Automatically plots Higher Timeframe Order Blocks on your chart.
Flexible Risk Management: Set SL/TP via Fixed Points or ATR Multiplier.
Alerts Included: Ready for automation.
Disclaimer: This tool is for educational purposes only. Trading involves risk.
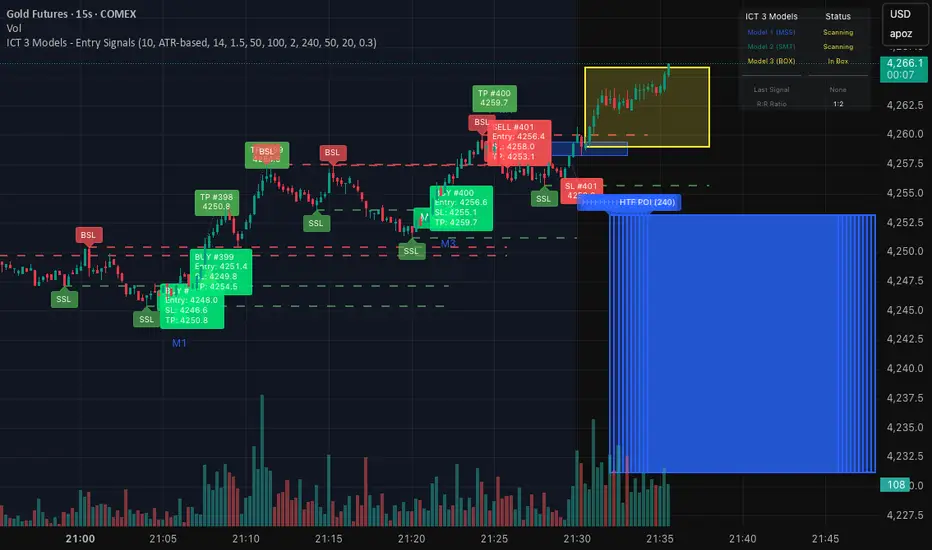
Bästa Bob Multi-RSI 😎👊✅ RSI 7 → Fast impulse indicator
• Shows micro-movements
• Reacts instantly to liquidity sweeps
• Perfect for entry timing
✅ RSI 14 → Macro momentum indicator
• Captures the real trend
• Filters out noise
• Confirms larger market movements
When both are in sync → you get true market direction plus perfect timing.
👉 How to Use RSI 7 + RSI 14
1️⃣ Entry Signals (the best method)
BUY when:
• RSI 7 turns up from oversold
• RSI 14 is also sloping upward or gets crossed by RSI 7 from below
→ Extremely accurate right after a liquidity sweep.
SELL when:
• RSI 7 turns down from overbought
• RSI 14 is sloping downward or gets crossed by RSI 7 from above
→ Works insanely well for fakeouts and FVG entries.
2️⃣ Trend Filter
• When RSI 14 stays above 50 → market is bullish
• When RSI 14 stays below 50 → bearish
RSI 7 is then used only for timing entries.
3️⃣ A++ Setups (your favorite ones 😉🔥)
The best signals appear when:
✔ RSI 7 crosses RSI 14 at the same time as:
• a liquidity sweep happens
• price taps into an FVG or Order Block
• volume reacts
• your trend filter (EMA, HTF) supports the move
This combo is criminally effective when scalping BTC, NAS100, and XAUUSD.

ZLBD Lite - Free Version🆓 ZLBD Lite - Smart Bounce Detector (Free Version)
This is the free version of our professional ZLBD Pro indicator.
Designed to help traders identify high-probability reversal zones using Smart Money Concepts.
✨ FREE FEATURES:
• Basic Buy/Sell Signals: Identifies potential reversals.
• Demand & Supply Zones: Automatically draws key support/resistance blocks.
• Anti-Repetition Filter: Reduces signal noise.
• Simple Dashboard: Tracks active zones.
🚫 LIMITATIONS (Lite Version):
❌ No Signal Strength Meter (0-100%)
❌ No Market Trend Detection
❌ No FVG (Fair Value Gaps)
❌ No Session Timing
❌ Limited Zone History
🔓 UNLOCK FULL POWER (ZLBD PRO):
Upgrade to the PRO version to get:
✅ Real-time 0-100% Strength Meter
✅ Advanced Trend Filter (Strong/Medium/Weak)
✅ Full FVG Detection
✅ VIP Telegram Access
✅ Personal Support
🚀 HOW TO UPGRADE:
Contact us on Telegram: @ZlbdPro_Support
💡 HOW TO USE (Lite):
1. Wait for a Green Zone (Demand) to form.
2. Look for a 🟢 BUY triangle.
3. Confirm with your own analysis.
4. Target the next Red Zone (Supply).
👍 Boost & Follow for updates!

SMT Fill by DukeSong
What is SMT fill?
Two correlated assets have common FVG on one candle, one asset touched the gap while the other did not. This is a strong sign of trend continuation.
What does this indicator do?
Display FVGs that has SMT fill of current asset (e.g. NQ) with respect to a correlated asset (e.g. ES).
How to use?
Add indicator, select the correlated asset, SIMPLE!

SMC Indicator by BadshahIntroduction
Unlock the hidden narrative of price action with this focused Smart Money Concepts (SMC) toolkit. Designed for precision and clarity, this indicator strips away chart noise to reveal the "skeleton" of the market. Whether you are tracking trend continuations or hunting for valid reversals, this tool automates the technical heavy lifting, allowing you to focus purely on execution.
How It Works
This script analyzes price action in real-time to map out two critical components of institutional trading:
1. Market Structure Architecture The indicator uses a rolling pivot algorithm to identify significant Highs and Lows based on your preferred sensitivity.
BOS (Break of Structure): Marks the confirmation of trend momentum. A solid line is drawn when price successfully closes beyond a structural pivot in the direction of the trend (e.g., breaking a high in an uptrend).
ChoCh (Change of Character): signals a potential shift in market sentiment. A dashed line appears when price violates a key swing point opposite to the prevailing trend, often the first sign of a reversal.
2. Liquidity Inefficiencies (FVG) The script scans every candle formation to detect Fair Value Gaps (Imbalances)—zones where aggressive buying or selling occurred without reciprocal trading.
Bullish Gaps: Highlighted when a candle's low fails to overlap with the high of the candle two periods prior.
Bearish Gaps: Highlighted when a candle's high fails to overlap with the low of the candle two periods prior.
These boxes extend forward, serving as high-probability "magnets" for price to revisit and rebalance.
Settings & Customization
Swing Length: Adjust the lookback period to tune the indicator for Scalping (lower values) or Swing Trading (higher values).
Visual Control: Toggle specific features (BOS, ChoCh, FVG) on or off and fully customize colors to blend with your chart theme.
Disclaimer
This indicator is strictly for analytical and educational purposes. It visualizes historical and real-time data but does not guarantee future market movements. Always manage your risk responsibly.