[TehThomas] - ICT Inversion Fair value Gap (IFVG) The Inversion Fair Value Gap (IFVG) indicator is a powerful tool designed for traders who utilize ICT (Inner Circle Trader) strategies. It focuses on identifying and displaying Inversion Fair Value Gaps, which are critical zones that emerge when traditional Fair Value Gaps (FVGs) are invalidated by price action. These gaps represent key areas where price often reacts, making them essential for identifying potential reversals, trend continuations, and liquidity zones.
What Are Inversion Fair Value Gaps?
Inversion Fair Value Gaps occur when price revisits a traditional FVG and breaks through it, effectively flipping its role in the market. For example:
A bullish FVG that is invalidated becomes a bearish zone, often acting as resistance.
A bearish FVG that is invalidated transforms into a bullish zone, serving as support.
These gaps are significant because they often align with institutional trading activity. They highlight areas where large orders have been executed or where liquidity has been targeted. Understanding these gaps provides traders with a deeper insight into market structure and helps them anticipate future price movements with greater accuracy.
Why This Strategy Works
The IFVG concept is rooted in ICT principles, which emphasize liquidity dynamics, market inefficiencies, and institutional order flow. Traditional FVGs represent imbalances in price action caused by gaps between candles. When these gaps are invalidated, they become inversion zones that can act as magnets for price. These zones frequently serve as high-probability areas for price reversals or trend continuations.
This strategy works because it aligns with how institutional traders operate. Inversion gaps often mark areas of interest for "smart money," making them reliable indicators of potential market turning points. By focusing on these zones, traders can align their strategies with institutional behavior and improve their overall trading edge.
How the Indicator Works
This indicator simplifies the process of identifying and tracking IFVGs by automating their detection and visualization on the chart. It scans the chart in real-time to identify bullish and bearish FVGs that meet user-defined thresholds for inversion. Once identified, these gaps are dynamically displayed on the chart with distinct colors for bullish and bearish zones.
The indicator also tracks whether these gaps are mitigated or broken by price action. When an IFVG is broken, it extends the zone for a user-defined number of bars to visualize its potential role as a new support or resistance level. Additionally, alerts can be enabled to notify traders when new IFVGs form or when existing ones are broken, ensuring timely decision-making in fast-moving markets.
Key Features
Automatic Detection: The indicator automatically identifies bullish and bearish IFVGs based on user-defined thresholds.
Dynamic Visualization: It displays IFVGs directly on the chart with customizable colors for easy differentiation.
Real-Time Updates: The status of each IFVG is updated dynamically based on price action.
Zone Extensions: Broken IFVGs are extended to visualize their potential as support or resistance levels.
Alerts: Notifications can be set up to alert traders when key events occur, such as the formation or breaking of an IFVG.
These features make the tool highly efficient and reduce the need for manual analysis, allowing traders to focus on execution rather than tedious chart work.
Benefits of Using This Indicator
The IFVG indicator offers several advantages that make it an indispensable tool for ICT traders. By automating the detection of inversion gaps, it saves time and reduces errors in analysis. The clearly defined zones improve risk management by providing precise entry points, stop-loss levels, and profit targets based on market structure.
This tool is also highly versatile and adapts seamlessly across different timeframes. Whether you’re scalping lower timeframes or swing trading higher ones, it provides actionable insights tailored to your trading style. Furthermore, by aligning your strategy with institutional logic, you gain a significant edge in anticipating market movements.
Practical Applications
This indicator can be used across various trading styles:
Scalping: Identify quick reversal points on lower timeframes using real-time alerts.
Day Trading: Use inversion gaps as key levels for intraday support/resistance or trend continuation setups.
Swing Trading: Analyse higher timeframes to identify major inversion zones that could act as critical turning points in larger trends.
By integrating this tool into your trading routine, you can streamline your analysis process and focus on executing high-probability setups.
Conclusion
The Inversion Fair Value Gap (IFVG) indicator is more than just a technical analysis tool—it’s a strategic ally for traders looking to refine their edge in the markets. By automating the detection and tracking of inversion gaps based on ICT principles, it simplifies complex market analysis while maintaining accuracy and depth. Whether you’re new to ICT strategies or an experienced trader seeking greater precision, this indicator will elevate your trading game by aligning your approach with institutional behavior.
If you’re serious about improving your trading results while saving time and effort, this tool is an essential addition to your toolkit. It provides clarity in chaotic markets, enhances precision in trade execution, and ensures you never miss critical opportunities in your trading journey.
__________________________________________
Thanks for your support!
If you found this idea helpful or learned something new, drop a like 👍 and leave a comment, I’d love to hear your thoughts! 🚀
Make sure to follow me for more price action insights, free indicators, and trading strategies. Let’s grow and trade smarter together! 📈
In den Scripts nach "fvg" suchen

CandelaCharts - X Model📝 Overview
The X Model Indicator is a sophisticated trading strategy designed to identify high-probability entry points for both long and short positions. It utilizes a combination of key market levels, price action patterns, and multi-timeframe analysis to generate precise signals.
The model offers tailored entry conditions for both long and short trades, ensuring optimized risk-reward setups.
📦 Features
Previous Day High/Low (ERL): Resistance level from the previous day’s high/low.
H1 Bullish/Bearish FVG (IRL): A Bullish Fair Value Gap (FVG) on the 1-hour chart indicating price target potential.
m15 MSS / SMT: Market Structure Shift and Smart Money Technique on the 15-minute chart confirming the market's direction.
Only Short/Long Above/Below 00:00: Triggers short positions only after midnight to avoid potential market noise from earlier sessions.
⚙️ Settings
Core
Status: Filter models based on status
Bias: Controls what model type will be displayed, bullish or bearish
Fractal: Controls the timeframe pairing will be used
Sweep: Shows the sweep that forms a model
I-sweep: Controls the visibility of invalidated sweeps
D-purge: Plots the double purge sweeps
CISD: Displays the Change In State of Delivery for a model
Labels: Adjust the HTF candle label size
History
History: Controls the amount of past models displayed on the chart
HTF
Candles: Controls the number of HTF candles that will be visible on the chart
Open: Highlights with a line the open price of the current HTF candle
Show True Day Open: Display True Day Open line
Offset: Controls the distance of HTF from the current chart
Space: Controls the space between HTF candles
Size: Controls the size of HTF candles
LTF
H/L Line: Displays on the LTF chart High and Low of each HTF candle
O/C Line: Displays on the LTF chart Open and Close of each HTF candle
PD Arrays
PD Array: Displays ICT PD Arrays
CE Line: Style the equilibrium line of the PD Array
Border: Style the border of the PD Array
Projections
StDev: Controls standard deviation available levels
Labels: Controls the size of standard deviation levels
Anchor: Controls the anchor point of standard deviation levels (wick, body)
Lines: Controls the line widths and color of standard deviation levels
Dashboard
Panel: Display information about the current model
💡 Framework
The model incorporates multiple timeframe alignments for increased precision and reliability. The following timeframes are utilized for a comprehensive view of the market:
1m - 5m - 1H
2m - 15m - 4H
3m - 20m - 8H
5m - 30m - 12H
15m - 1H - 1D
1H - 4H - 1W
4H - 1D - 1M
1D - 1W - 3M
1W - 1M - 12M
These alignments ensure that the model captures both short-term price movements and longer-term trends, allowing for well-informed decision-making across various market conditions.
The X Model Indicator employs a precise set of conditions for both short and long entries, designed to capture optimal market opportunities based on key price levels, market imbalances, and institutional activity. These conditions combine multiple timeframes, price action patterns, and market sentiment to enhance the accuracy of entry signals.
Here's how each condition works:
Short Entry Conditions:
Previous Day High (ERL): The previous day’s high acts as a significant resistance level for the market. A price rejection or failure to break above this level indicates a potential short opportunity, as the market may reverse or consolidate.
H1 Bullish FVG (IRL): A Bullish Fair Value Gap (FVG) on the 1-hour chart highlights an area of price imbalance. This signals that the price may attempt to move back into this gap, providing a high-probability short entry if combined with other bearish signals.
m15 MSS / SMT: On the 15-minute chart, the Momentum Shift (MSS) and Smart Money Tool (SMT) indicators are used to confirm market manipulation or shift in momentum. If these indicators show bearish market activity, they strengthen the case for a short position.
Only Short Above 00:00: To avoid noise from earlier market sessions, the model only triggers short entries after midnight (00:00), ensuring that the trade occurs during a more stable, predictable phase of the trading day.
Long Entry Conditions:
Previous Day Low (ERL): The previous day’s low serves as a support level, marking an area where the price is likely to bounce. If the price pulls back and tests this level, it suggests a high-probability long entry, especially when other indicators align.
H1 Bearish FVG (IRL): A Bearish Fair Value Gap (FVG) on the 1-hour chart shows an imbalance to the downside, where the price may reverse and move upwards. This gap is often seen as an opportunity for the price to return to equilibrium, presenting a favorable long entry.
m15 MSS / SMT: The Momentum Shift (MSS) and Smart Money Tool (SMT) on the 15-minute chart help identify the market’s true intentions. A shift towards bullish momentum or signs of smart money accumulation increases the likelihood of a successful long entry.
Only Long Below 00:00: To focus on the market’s early session dynamics, the model only triggers long entries before midnight (00:00), capturing potential moves during quieter periods when the price can show clearer directional trends.
⚡️ Showcase
Introducing X Model is a powerful trading tool designed to elevate your market analysis and boost your trading success.
Bearish Model
Bullish Model
Unlock your full trading potential and experience the difference with X Model — your ultimate tool for smarter, more informed trading decisions.
🚨 Alerts
This script offers alert options for all model types. The alerts need to be setup manually from Tradingview.
Bearish Model
A bearish model alert is triggered when a model forms, signaling a high sweep on HTF and CISD on LTF.
Bullish Model
A bullish model alert is triggered when a model forms, signaling a low sweep on HTF and CISD on LTF.
⚠️ Disclaimer
These tools are exclusively available on the TradingView platform.
Our charting tools are intended solely for informational and educational purposes and should not be regarded as financial, investment, or trading advice. They are not designed to predict market movements or offer specific recommendations. Users should be aware that past performance is not indicative of future results and should not rely on these tools for financial decisions. By using these charting tools, the purchaser agrees that the seller and creator hold no responsibility for any decisions made based on information provided by the tools. The purchaser assumes full responsibility and liability for any actions taken and their consequences, including potential financial losses or investment outcomes that may result from the use of these products.
By purchasing, the customer acknowledges and accepts that neither the seller nor the creator is liable for any undesired outcomes stemming from the development, sale, or use of these products. Additionally, the purchaser agrees to indemnify the seller from any liability. If invited through the Friends and Family Program, the purchaser understands that any provided discount code applies only to the initial purchase of Candela's subscription. The purchaser is responsible for canceling or requesting cancellation of their subscription if they choose not to continue at the full retail price. In the event the purchaser no longer wishes to use the products, they must unsubscribe from the membership service, if applicable.
We do not offer reimbursements, refunds, or chargebacks. Once these Terms are accepted at the time of purchase, no reimbursements, refunds, or chargebacks will be issued under any circumstances.
By continuing to use these charting tools, the user confirms their understanding and acceptance of these Terms as outlined in this disclaimer.

C|M Capital (Market Structure Pro)CM Capital (Market Structure Pro)
Overview:
The CM Capital (Market Structure Pro) Indicator is a groundbreaking tool for traders seeking a comprehensive market analysis. This closed-source script merges multiple facets of market dynamics into a single, user-friendly interface, designed to enhance decision-making by providing a multi-dimensional view of market behavior. By combining advanced market structure detection, liquidity event identification, Fair Value Gap analysis, and session-specific insights, this indicator offers traders a strategic advantage in navigating the complexities of financial markets.
Key Functionalities:
Market Structure Insights:
Break of Structure (BOS) and Market Structure Shifts (MSS):
Methodology: Our approach uses fractal analysis coupled with custom algorithms to dissect price movements, identifying pivotal moments where market structure breaks or shifts. The script evaluates candle patterns, volume data, and price momentum to flag these events.
Customization: Users can choose between candle close or wick confirmations and select from various line styles for visualization, tailoring the sensitivity to match their trading strategy, whether it's scalping or swing trading.
Utility: These markers act as early signals for trend changes, allowing traders to prepare for potential reversals or continuations, especially useful in volatile markets where timely decisions are crucial.
Structure Strength:
Highs and Lows Definition: The 'Structure Strength' setting in this indicator directly influences the identification of structure highs and lows. It's not just about detecting market structure; it's about defining what constitutes a significant high or low based on your trading horizon.
Swing vs. Internal Structure:
Lower Strength: Opting for a lower strength setting will highlight more extreme, swing-type structures. This means the indicator will mark out only the most pronounced highs and lows, which are ideal for traders focusing on broader market swings or longer-term trends.
Higher Strength: Conversely, increasing the strength level plots more internal structure levels. This setting is perfect for traders who want to dive into the market's micro-movements, offering insights into potential support and resistance within ongoing trends, essentially capturing more reactive and detailed price action.
Strategic Application: This adjustable parameter allows traders to zoom in or out on the market structure, aligning with their trading style or the specific market conditions they're navigating. Whether you're looking to catch significant market turns or to finesse entries and exits within a trend, the structure strength setting provides the granularity needed for nuanced market analysis.
Liquidity Sweeps:
Detection: Beyond traditional price action analysis, our indicator incorporates a unique method to spot liquidity sweeps. By analyzing price movements against historical support/resistance zones, it highlights instances where significant orders might have been absorbed, suggesting areas of potential price reversal or continuation.
Visualization: Liquidity sweeps are visually marked with customizable colors and an 'X' label, making them instantly recognizable. This feature is particularly beneficial for traders looking to enter or exit trades based on market inefficiencies or anticipated institutional activity.
Application: Traders can use these signals to anticipate where the market might react strongly, either as support for entries or as a caution for exits, enhancing trade precision.
Fair Value Gaps (FVGs):
Identification: Our proprietary FVG detection algorithm looks for price discrepancies over recent bars, signaling where the market could aim to rebalance. This is not merely about spotting gaps but understanding their context within the market's flow.
Enhanced Visualization: Users can extend FVGs across the chart, providing a clearer view of potential mean reversion points or continuation levels, aiding in setting targets or stop-losses.
Strategic Use: FVGs serve as dynamic levels where traders might expect price action to revisit, offering opportunities for mean reversion trades or confirming trend strength.
Session Visualization:
Session Markers: By delineating Asia, London, and New York session times, the indicator helps traders recognize session-specific volatility, trends, and liquidity conditions. Each session can be customized for color and duration, aligning with various trading strategies.
Timeframe Correlation: Integrating session analysis with structural and liquidity insights allows for a strategy where trades are timed not just by price action but by when in the global market cycle they occur, potentially increasing the effectiveness of entry and exit points.
Watermark Display:
Personalization: Add a personal touch or brand identity to your charts with customizable text and color options for the watermark, enhancing both the aesthetic and functional aspects of your trading setup.
Originality:
This script's originality lies in its holistic approach to market analysis. The integration of these diverse yet synergistic components provides a unique toolset:
Confluence of Signals: Each element enhances the others, creating a confluence where structural changes, liquidity events, and time-based market conditions are analyzed in concert, offering a more complete trading signal than isolated indicators.
Customization for Diverse Trading Styles: From high-frequency scalping to long-term trend following, the script's flexibility caters to a broad spectrum of trading strategies by allowing adjustments in sensitivity, visualization, and application.
How to Use:
Setup: Add the script to your chart and explore the settings in the input panel. Customize the visual and functional aspects to align with your trading style.
Strategy Application:
Use BOS/MSS for trend confirmation, liquidity sweeps for entry/exit precision, FVGs for mean reversion opportunities, and session markers to time your trades optimally.
Consider combining signals for stronger trade validation; for instance, a BOS during the London session might be more significant if it coincides with a liquidity sweep and an FVG from the Asian session.

Macros ICT KillZones [TradingFinder] Times & Price Trading Setup🔵 Introduction
ICT Macros, developed by Michael Huddleston, also known as ICT (Inner Circle Trader), is a powerful trading tool designed to help traders identify the best trading opportunities during key time intervals like the London and New York trading sessions.
For traders aiming to capitalize on market volatility, liquidity shifts, and Fair Value Gaps (FVG), understanding and using these critical time zones can significantly improve trading outcomes.
In today’s highly competitive financial markets, identifying the moments when the market is seeking buy-side or sell-side liquidity, or filling price imbalances, is essential for maximizing profitability.
The ICT Macros indicator is built on the renowned ICT time and price theory, which enables traders to track and leverage key market dynamics such as breaks of highs and lows, imbalances, and liquidity hunts.
This indicator automatically detects crucial market times and optimizes strategies for traders by highlighting the specific moments when price movements are most likely to occur. A standout feature of ICT Macros is its automatic adjustment for Daylight Saving Time (DST), ensuring that traders remain synced with the correct session times.
This means you can rely on accurate market timing without the need for manual updates, allowing you to focus on capturing profitable trades during critical timeframes.
🔵 How to Use
The ICT Macros indicator helps you capitalize on trading opportunities during key market moments, particularly when the market is breaking highs or lows, filling Fair Value Gaps (FVG), or addressing imbalances. This indicator is particularly beneficial for traders who seek to identify liquidity, market volatility, and price imbalances.
🟣 Sessions
London Sessions
London Macro 1 :
UTC Time : 06:33 to 07:00
New York Time : 02:33 to 03:00
London Macro 2 :
UTC Time : 08:03 to 08:30
New York Time : 04:03 to 04:30
New York Sessions
New York Macro AM 1 :
UTC Time : 12:50 to 13:10
New York Time : 08:50 to 09:10
New York Macro AM 2 :
UTC Time : 13:50 to 14:10
New York Time : 09:50 to 10:10
New York Macro AM 3 :
UTC Time : 14:50 to 15:10
New York Time : 10:50 to 11:10
New York Lunch Macro :
UTC Time : 15:50 to 16:10
New York Time : 11:50 to 12:10
New York PM Macro :
UTC Time : 17:10 to 17:40
New York Time : 13:10 to 13:40
New York Last Hour Macro :
UTC Time : 19:15 to 19:45
New York Time : 15:15 to 15:45
These time intervals adjust automatically based on Daylight Saving Time (DST), helping traders to enter or exit trades during key market moments when price volatility is high.
Below are the main applications of this tool and how to incorporate it into your trading strategies :
🟣 Combining ICT Macros with Trading Strategies
The ICT Macros indicator can easily be used in conjunction with various trading strategies. Two well-known strategies that can be combined with this indicator include:
ICT 2022 Trading Model : This model is designed based on identifying market liquidity, structural price changes, and Fair Value Gaps (FVG). By using ICT Macros, you can identify the key time intervals when the market is seeking liquidity, filling imbalances, or breaking through important highs and lows, allowing you to enter or exit trades at the right moment.
Silver Bullet Strategy : This strategy, which is built around liquidity hunting and rapid price movements, can work more accurately with the help of ICT Macros. The indicator pinpoints precise liquidity times, helping traders take advantage of market shifts caused by filling Fair Value Gaps or correcting imbalances.
🟣 Capitalizing on Price Volatility During Key Times
Large market algorithms often seek liquidity or fill Fair Value Gaps (FVG) during the intervals marked by ICT Macros. These periods are when price volatility increases, and traders can use these moments to enter or exit trades.
For example, if sell-side liquidity is drained and the market fills an imbalance, the price might move toward buy-side liquidity. By identifying these moments, which may also involve breaking a previous high or low, you can leverage rapid market fluctuations to your advantage.
🟣 Identifying Liquidity and Price Imbalances
One of the important uses of ICT Macros is identifying points where the market is seeking liquidity and correcting imbalances. You can determine high or low liquidity levels in the market before each ICT Macro, as well as Fair Value Gaps (FVG) and price imbalances that need to be filled, using them to adjust your trading strategy. This capability allows you to manage trades based on liquidity shifts or imbalance corrections without needing a bias toward a specific direction.
🔵 Settings
The ICT Macros indicator offers various customization options, allowing users to tailor it to their specific needs. Below are the main settings:
Time Zone Mode : You can select one of the following options to define how time is displayed:
UTC : For traders who need to work with Universal Time.
Session Local Time : The local time corresponding to the London or New York markets.
Your Time Zone : You can specify your own time zone (e.g., "UTC-4:00").
Your Time Zone : If you choose "Your Time Zone," you can set your specific time zone. By default, this is set to UTC-4:00.
Show Range Time : This option allows you to display the time range of each session on the chart. If enabled, the exact start and end times of each interval are shown.
Show or Hide Time Ranges : Toggle on/off for visual clarity depending on user preference.
Custom Colors : Set distinct colors for each session, allowing users to personalize their chart based on their trading style.These settings allow you to adjust the key time intervals of each trading session to your preference and customize the time format according to your own needs.
🔵 Conclusion
The ICT Macros indicator is a powerful tool for traders, helping them to identify key time intervals where the market seeks liquidity or fills Fair Value Gaps (FVG), corrects imbalances, and breaks highs or lows. This tool is especially valuable for traders using liquidity-based strategies such as ICT 2022 or Silver Bullet.
One of the key features of this indicator is its support for Daylight Saving Time (DST), ensuring you are always in sync with the correct trading session timings without manual adjustments. This is particularly beneficial for traders operating across different time zones.
With ICT Macros, you can capitalize on crucial market opportunities during sensitive times, take advantage of imbalances, and enhance your trading strategies based on market volatility, liquidity shifts, and Fair Value Gaps.

Everything ICT v1█ OVERVIEW
This script presents some of the concepts taught by the ICT. It includes "Fair value gaps", "Double tops and bottoms", "New week opening gaps", "Optimal trade entry" and some other minor things. This is a work in progress and there will be more concepts included in the future.
█ FEATURES
The first group in the indicator's menu is "Active fair value gaps" .
Its purpose is to display a FVG if the price enters one. Most of the other scripts are deleting the FVG when the price go through it but this script won't. You can choose how many candles to look back for a FVG, FVG lines transparency and to show only current FVG and delete old ones.
Second, you can choose to show relatively equal highs and lows otherwise known as double bottoms and tops . There is a filter which will remove some of the lines. It is included to clean up your chart a bit but if you don't want to miss something you can leave it enabled.
There is a precision value which is ranging between 20 and 120. Higher number means the difference between the two highs/lows should be very small. On its biggest setting 120 it will display only equal highs/lows.
You can choose the colors and width of the lines.
"Weekend gaps" category is self explanatory. You can chose either to show them or not, colors and width.
"Optimal trade entry" is constantly measuring a defined range and it's presenting real-time a graph on the chart with which you can easily find if price is in OTE.
There are options to choose how many candles to look back for defining a range and everything else is for the minimal visual representation.
And lastly, there are options to show horizontal line at 0:00 am NY local time, clock adjustment setting if the line doesn't correspond to its spot and option to change the color of a FVG candle which in my opinion is the most useful thing in a trading indicator.
Credits: ICT
═════════════════════════════════════════════════════════════════════════
This indicator is not meant to be, and do not constitute, financial, investment, trading, or other types of advice.
Please note that it is NOT providing trading signals but trading ideas instead.
Under no circumstances will the Programmer be held responsible or liable in any way for any claims, damages, losses, expenses, costs or liabilities whatsoever (including, without limitation, any direct or indirect damages for loss of profits, business interruption or loss of information) resulting or arising directly or indirectly from your use of or inability to use this indicator or anything linked to it, or from your reliance on the information and material on this indicator, even if the Programmer has been advised of the possibility of such damages in advance.
All trades you make are your responsibility.
UK100 London Judas & IFVG SetupUK100 London Judas & IFVG Setup
Overview This indicator is a specialized trading tool designed to automate the ICT Judas Swing strategy specifically for the UK100 (FTSE 100) index during the London Market Open. It combines institutional time-based logic with price action confirmation using Inversion Fair Value Gaps (IFVG) to identify high-probability reversal setups.
How It Works The strategy is based on the concept that the initial move after the London Open is often a "fake-out" (manipulation) designed to trap retail traders and engineer liquidity before the true trend of the day begins.
Session & Opening Price:
The script marks the London Open price (default 09:00 Warsaw / 08:00 London time) with a dashed line.
This serves as the "line in the sand." Prices moving away from this line initially are monitored for manipulation.
Judas Swing (Liquidity Sweep):
If price moves BELOW the open, it is hunting Sell-Side Liquidity (trapping sellers).
If price moves ABOVE the open, it is hunting Buy-Side Liquidity (trapping buyers).
The Entry Trigger: Inversion FVG (IFVG):
The indicator scans for Fair Value Gaps (FVG) created during the manipulation phase.
BUY Signal: The price manipulates lower, creates a Bearish FVG (Red Box), but then aggressively reverses and closes ABOVE that gap. The gap is now "Inverted" (turns Green), acting as support.
SELL Signal: The price manipulates higher, creates a Bullish FVG (Green Box), but then aggressively reverses and closes BELOW that gap. The gap is now "Inverted" (turns Orange), acting as resistance.
Key Features
Automated Pattern Recognition: No need to manually draw gaps. The script detects valid FVG inversions that align with the Judas Swing logic.
Built-in Risk Calculator: The signal labels display the exact Lot Size you should use based on your account balance and risk percentage (default 0.5%). It calculates this dynamically based on the Stop Loss distance.
Institutional Targets: The indicator fetches H1 Fractals (Liquidity) from the 1-hour timeframe and plots them on your 1-minute chart as blue lines. These are your primary Take Profit (TP) levels.
Stop Loss Visualization: Automatically suggests a Stop Loss placement behind the swing high/low of the reversal structure.
How to Use
Timeframe: Set your chart to 1 Minute (1m).
Asset: UK100 (FTSE 100).
Wait: Allow the London session to open. Watch for price to move away from the opening line.
Execute: When a BUY or SELL label appears:
Enter the trade using the Lot Size shown on the label.
Set your Stop Loss at the price shown on the label.
Target the blue H1 Liquidity lines for profit taking.
Settings
Timezone: Set this to your chart/exchange timezone (Default: Europe/Warsaw).
Account Balance: Input your current trading capital (e.g., 100,000) for accurate risk calculations.
Risk Per Trade %: The percentage of your account you are willing to lose if the Stop Loss is hit (Standard: 0.5% - 1.0%).
Contract Size: The value of 1 point movement (Check your broker's specifications. Usually 1 for CFDs).
Alerts You can set a single alert in TradingView to capture all signals. Select the indicator and choose "Any alert() function call". You will receive a notification with the direction (Buy/Sell), Entry Price, and Lot Size.

[Yorsh] BJN iFVG Model BJN iFVG Model - Mechanical Trading System
Description:
The BJN iFVG Model is not just an indicator; it is a full-scale, semi-automated trading architecture designed to mechanically execute the specific "BJN" Inverted FVG strategy.
Designed for precision traders operating on Lower Timeframes (1m to 5m), this script eliminates the cognitive load of manual analysis. It automates every single step of the mechanical model—from Higher Timeframe narrative building to tick-perfect structural validation and risk calculation.
This tool transforms your chart into a professional trading cockpit, split into three intelligent engines:
1. The Matrix (Context Engine)
Before looking for an entry, you must understand the narrative. The Matrix handles the heavy lifting of multi-timeframe analysis without cluttering your chart:
Real-Time Delivery State: Automatically detects if price is reacting from valid HTF PD Arrays (1H, 4H, Daily) to confirm a "Delivery" state.
Liquidity Sweeps: Tracks Fractals across three dimensions (1H, 15m, and Micro-Structure) to identify liquidity raids instantly.
Advanced SMT Divergence: A built-in, multi-mode SMT engine scans for correlation breaks (Pivot SMT, Adjacent Wick SMT, and FVG SMT) between NQ/ES (or custom tickers) in real-time.
Time & Macro Tracking: Automatically visualizes Killzones and highlights high-probability Macro windows.
2. The Executioner (Entry Engine)
Once the context is set, the Executioner handles the specific Inverted FVG (iFVG) entry model with strict mechanical rules:
Structural Integrity: Automatically identifies the Invalidation Point (IP), Floor/Ceiling, and Break-Even levels for every setup.
Hazard Detection: The script proactively scans the "Trading Leg" for opposing unmitigated FVGs (Hazards). If the path isn't clean, the trade is flagged or invalidated.
Composite Logic: Intelligently merges "noisy" price action into Composite FVGs to reduce false signals.
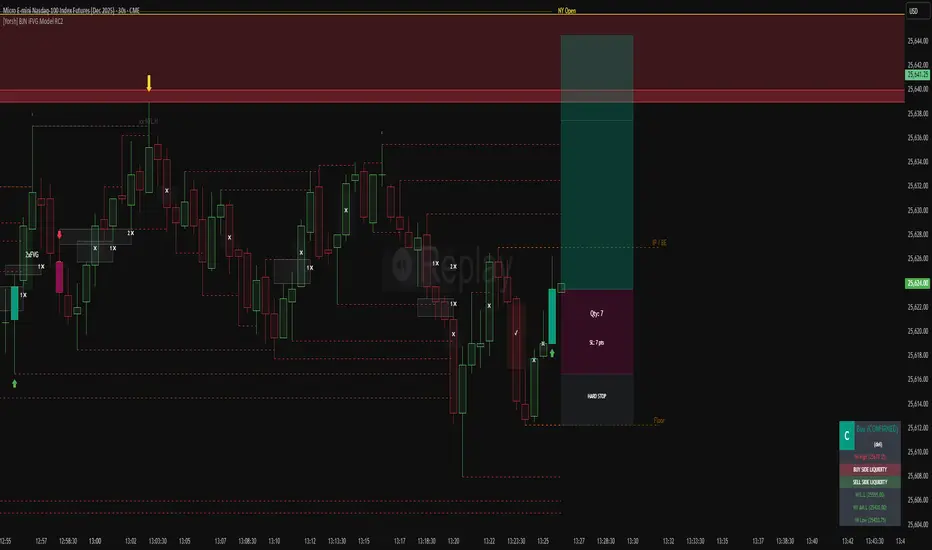
Integrated Position Sizer: When a trade is confirmed, a visual box appears showing your precise Entry, Stop Loss, Hard Stop, and Take Profit levels, along with a calculated Contract Quantity based on your risk tolerance.
3. The Ranking System (Quality Control)
Not all trades are created equal. This system grades every single confirmed setup in real-time based on confluence factors:
Grades: Ranges from A++ (Perfect Confluence) to C (Low Probability).
Confluence Check: Checks for Delivery, Sweeps (HTF/LTF), SMT, and Macro alignment at the exact moment of the trigger.
Live Status Panel: A dashboard on your chart displays the current live trade status (Armed, Triggered, Confirmed) and its Rank, so you never miss a beat.
Optimization & Performance
Trading on the 1-minute timeframe requires speed. This script has been rigorously optimized for high-frequency environments:
Smart Garbage Collection: The script manages its own memory, cleaning up old data arrays to prevent lag, ensuring the chart remains fluid even after days of data accumulation.
Tunnel Vision: Calculations are strictly focused on the relevant trading leg, ignoring historical noise to maximize execution speed.
Zero-Repaint: All historical analysis is strictly non-repainting to ensure backtesting reliability.
How to Use
Timeframes: Optimized for 1m, 2m, 3m, 4m, 5m execution.
Alerts: Configure the robust alert system to notify you only when setups meet your standards (e.g., "Alert only on Rank B+ or higher").
Strategy: Wait for the Status Panel to show a "CONFIRMED" signal. Use the on-screen Position Sizer to execute the trade with the displayed risk parameters.
Stop analyzing; start executing. Welcome to mechanical trading.
----------------------------------------------------------------------------------------------------------------
RISK DISCLAIMER:
The content, tools, and signals generated by this script are strictly for educational and informational purposes only. This script does not constitute financial advice, investment recommendations, or a solicitation to buy or sell any securities, futures, or other financial instruments.
Trading financial markets involves a high degree of risk and is not suitable for all investors. The "Position Sizer" and "Trade Setups" displayed are hypothetical simulations designed to demonstrate the mechanics of the BJN methodology; they do not guarantee future performance.
Use this tool at your own risk. The author assumes no responsibility or liability for any trading losses or damages incurred in connection with the use of this script. Always consult with a qualified financial advisor and practice proper risk management.

Demand & Supply (3 MTF) + SMC & Alerts by StockFusion 3.2Demand & Supply (3 MTF) + SMC & Alerts by StockFusion 3.2
**Overview**
Demand & Supply (3 MTF) + SMC & Alerts by StockFusion 3.2 is a multi–timeframe institutional-style trading tool that automatically detects high-quality Demand & Supply zones (3 TF), Smart Money Concepts (CHoCH & BOS), institutional volume footprints, Fair Value Gaps (FVG), and structural Premium/Discount levels. It is designed to give traders a clear HTF–MTF–LTF view, with smart alerts and a compact trend meter, so that execution can be done with more clarity and discipline.
**Description**
This indicator combines three core engines in one:
* **3× MTF Demand & Supply Zones**
* Auto-detection of RBR/DBR (DZ) and DBD/RBD (SZ) across TF-1 / TF-2 / TF-3.
* Manual / Normal / Conservative / Analysis modes for zone quality control (explosive/body ratios, ATR multipliers, volume filters).
* Dynamic zone removal on retest/mitigation (first & second-leg logic) with optional historical label retention.
* Multi-TF visibility controls (show HTF zones on LTF, LTF on HTF, etc.) and live “Nearest Zone Table” with Proximal/Distal & proximity %.
* **SMC (CHoCH, BOS, FVG, Premium/Discount)**
* Automatic CHoCH & BOS mapping with swing-based detection, visual lines and labels.
* FVG detection (bullish & bearish) with mitigation tracking, optional opacity reduction and mitigation alerts.
* Auto structure engine (HH/LL, BOS/CHoCH) with configurable lookback and line styles.
* Premium/Discount auto-fib levels (1.0/0.78/0.71/0.5/0.0) + optional “P / D” labels and 0.71 touch alerts when aligned with FVG & volume.
* **Institutional Volume, Trend Meter & Extras**
* Institutional “I/X” footprint detection with volume multipliers, significant & extreme volume spike markers + optional alerts.
* Trend Meter table for 3 higher timeframes using 50-period MAs (D/W/M by default) with quick visual up/down bias.
* 3-in-1 colored SMA/EMA pack, inside-bar detector with optional coloring and high/low lines for price action traders.
All key components are modular: you can toggle zones, SMC, institutional activity, FVG, fib structure, alerts, trend meter, and inside candles as per your trading style (intraday, swing, positional, or pure analysis).
**Disclaimer**
This indicator is for **educational and analytical purposes only** and does **not** constitute financial, investment, or trading advice. No buy/sell/hold recommendations are given, and no profitability or performance is guaranteed. Markets are risky; always do your own research, test on demo first, and consult your financial advisor if needed. By using this script, you accept that you are fully responsible for your own trading decisions and results.

LiqVision Institutional Suite v6.2 – Hybrid ModeLiqVision Institutional Suite v6.2 — Hybrid Mode (Lightning Edition)
Een ultra-geoptimaliseerde Smart Money-indicator gebaseerd op institutionele principes: Liquidity, Market Structure, Order Blocks, FVG’s en Model 1/2 setups.
Dit script combineert meerdere professionele SMC-concepten in één engine:
🔷 Functionaliteiten
1. Liquidity Engine
Automatische detectie van EQH, EQL en Liquidity Sweeps
Dynamische lijnprojectie met smart cleanup
Slimme sweep-detectie voor high-probability entries
2. Market Structure Engine
BOS & CHOCH detectie
Trend continuatie- en reversalsignalen
Swing-based pivot logic
3. Order Block Engine
Automatische OB-detectie met displacement filtering
Bullish & Bearish macro Order Blocks
HTF glow overlay (nieuw in v6.2)
4. FVG Engine
Major Fair Value Gap detection
Up/Down imbalance visual engine
HTF-based color restoration (v6.2 fix)
5. Model 1 & Model 2 Signal Engine
Trend continuation entries (Model 1)
Reversal setups gebaseerd op HTF liquidity & displacement (Model 2)
Auto-tapping logic geïntegreerd met OB/FVG
6. Hybrid Mode Rendering
Slimme shading afhankelijk van timeframe:
LTF → Hide OB/FVG
MTF → White overlays
HTF → Premium glow visuals
🔷 Alerts
Volledige alert-ondersteuning voor:
Model 1 Buy/Sell
Model 2 Buy/Sell
Liquidity Sweep
BOS Up/Down
CHOCH Up/Down
OB Tap
FVG Tap
Any alert() function call
Geschikt voor Telegram, Discord, bots en externe signal pipelines.
🔷 Gebruik
Voeg de indicator toe
Kies timeframe (1m–4h aanbevolen)
Activeer alerts via “Any alert() function call”
Volg Model 1/2 entries voor optimaal resultaat
⚡ DISCLAIMER
Dit script is uitsluitend bedoeld voor educatieve doeleinden. Geen financieel advies. Resultaten uit het verleden geven geen garantie voor de toekomst.

[Yorsh] BJN iFVG Model RC1 BJN iFVG Model - Mechanical Trading System
Description:
The BJN iFVG Model is not just an indicator; it is a full-scale, semi-automated trading architecture designed to mechanically execute the specific "BJN" Inverted FVG strategy.
Designed for precision traders operating on Lower Timeframes (1m to 5m), this script eliminates the cognitive load of manual analysis. It automates every single step of the mechanical model—from Higher Timeframe narrative building to tick-perfect structural validation and risk calculation.
This tool transforms your chart into a professional trading cockpit, split into three intelligent engines:
1. The Matrix (Context Engine)
Before looking for an entry, you must understand the narrative. The Matrix handles the heavy lifting of multi-timeframe analysis without cluttering your chart:
Real-Time Delivery State: Automatically detects if price is reacting from valid HTF PD Arrays (1H, 4H, Daily) to confirm a "Delivery" state.
Liquidity Sweeps: Tracks Fractals across three dimensions (1H, 15m, and Micro-Structure) to identify liquidity raids instantly.
Advanced SMT Divergence: A built-in, multi-mode SMT engine scans for correlation breaks (Pivot SMT, Adjacent Wick SMT, and FVG SMT) between NQ/ES (or custom tickers) in real-time.
Time & Macro Tracking: Automatically visualizes Killzones and highlights high-probability Macro windows.
2. The Executioner (Entry Engine)
Once the context is set, the Executioner handles the specific Inverted FVG (iFVG) entry model with strict mechanical rules:
Structural Integrity: Automatically identifies the Invalidation Point (IP), Floor/Ceiling, and Break-Even levels for every setup.
Hazard Detection: The script proactively scans the "Trading Leg" for opposing unmitigated FVGs (Hazards). If the path isn't clean, the trade is flagged or invalidated.
Composite Logic: Intelligently merges "noisy" price action into Composite FVGs to reduce false signals.
Integrated Position Sizer: When a trade is confirmed, a visual box appears showing your precise Entry, Stop Loss, Hard Stop, and Take Profit levels, along with a calculated Contract Quantity based on your risk tolerance.
3. The Ranking System (Quality Control)
Not all trades are created equal. This system grades every single confirmed setup in real-time based on confluence factors:
Grades: Ranges from A++ (Perfect Confluence) to C (Low Probability).
Confluence Check: Checks for Delivery, Sweeps (HTF/LTF), SMT, and Macro alignment at the exact moment of the trigger.
Live Status Panel: A dashboard on your chart displays the current live trade status (Armed, Triggered, Confirmed) and its Rank, so you never miss a beat.
Optimization & Performance
Trading on the 1-minute timeframe requires speed. This script has been rigorously optimized for high-frequency environments:
Smart Garbage Collection: The script manages its own memory, cleaning up old data arrays to prevent lag, ensuring the chart remains fluid even after days of data accumulation.
Tunnel Vision: Calculations are strictly focused on the relevant trading leg, ignoring historical noise to maximize execution speed.
Zero-Repaint: All historical analysis is strictly non-repainting to ensure backtesting reliability.
How to Use
Timeframes: Optimized for 1m, 2m, 3m, 4m, 5m execution.
Alerts: Configure the robust alert system to notify you only when setups meet your standards (e.g., "Alert only on Rank B+ or higher").
Strategy: Wait for the Status Panel to show a "CONFIRMED" signal. Use the on-screen Position Sizer to execute the trade with the displayed risk parameters.
Stop analyzing; start executing. Welcome to mechanical trading.
----------------------------------------------------------------------------------------------------------------
RISK DISCLAIMER:
The content, tools, and signals generated by this script are strictly for educational and informational purposes only. This script does not constitute financial advice, investment recommendations, or a solicitation to buy or sell any securities, futures, or other financial instruments.
Trading financial markets involves a high degree of risk and is not suitable for all investors. The "Position Sizer" and "Trade Setups" displayed are hypothetical simulations designed to demonstrate the mechanics of the BJN methodology; they do not guarantee future performance.
Use this tool at your own risk. The author assumes no responsibility or liability for any trading losses or damages incurred in connection with the use of this script. Always consult with a qualified financial advisor and practice proper risk management.
Binary Options Gold Scalping [TradingFinder] 1 & 5 Min Strategy🔵 Introduction
In binary options trading, price movements are often driven by the market’s tendency to reach key liquidity zones. These areas include Liquidity, Fair Value Gaps (FVGs), and Order Blocks (OBs), zones where a large number of pending orders are concentrated.
When price reaches one of these zones, it typically enters a Liquidity Sweep phase to collect available liquidity. After this process, the market often reacts sharply, either reversing direction or continuing its move with renewed momentum. Understanding this cycle forms the foundation of most smart money-based binary options strategies.
In this analytical approach, a Liquidity Sweep is usually seen as a False Breakout, often recognized through a distinctive candle confirmation pattern. The pattern appears when price briefly breaks a level to trigger stops, then quickly returns within range. This formation is one of the most reliable reversal signals for short-term trades and plays a central role in many binary options strategies.
After a liquidity sweep, price often returns to Fair Value Gap (FVG) or Order Block (OB) areas to restore balance in the market. These are zones where institutional orders are typically placed, and reactions around them can create high-probability trade setups. In binary options trading, this quick reaction following a sweep and retrace into an FVG or OB provides one of the best entry opportunities for short-term trades.
By combining the concepts of Liquidity Sweep, Fair Value Gap, and Order Block, traders can build a precise binary options strategy based on smart money behavior, allowing them to identify market reversals with greater confidence and enter at the optimal moment.
Bullish Setup :
Bearish Setup :
🔵 How to Use
This indicator is built on the Smart Money Concept (SMC) framework and serves as a core tool for accurately detecting Liquidity Sweeps, Order Blocks, and Fair Value Gaps in binary options trading.
Its logic is simple yet powerful : when price reaches high-interest liquidity zones and shows reversal signs, the indicator issues an entry signal immediately after a Candle Confirmation is complete.
Signals only activate when both the market structure and the candle confirmation pattern align, ensuring high accuracy in spotting genuine reversals.
🟣 Long Position
A bullish signal appears when the market, after a downward move, reaches sell-side liquidity zones where liquidity has built up below previous lows. In such conditions, a bullish Order Block or Fair Value Gap often exists in the same region, acting as a potential reversal point.
When the indicator detects the presence of liquidity, an imbalance zone (FVG), and a valid candle confirmation simultaneously, it triggers a green Call signal.
In a binary options strategy, the best entry moment is immediately after the candle confirmation closes, as this is when the probability of reversal is highest and the market tends to react strongly within the next few candles.
In the example below, after the liquidity sweep and candle confirmation, price quickly rallied, resulting in a Binary Win setup.
🟣 Short Position
A bearish signal occurs when price, after an upward move, reaches an area of buy-side liquidity and collects liquidity above recent highs. At this stage, the market is typically overbought and ready to reverse. If a bearish Order Block or Fair Value Gap exists in the same area and a candle confirmation pattern forms, the indicator displays a red Put signal.
This setup is highly accurate because multiple structural confirmations occur simultaneously : liquidity has been absorbed, price is rebalancing, and the confirmation candle has closed.
In binary options trading, this is the ideal moment to enter a Put (Sell) position, as the price reaction to the downside is usually quick and decisive.
In the example chart, the indicator generated a bearish signal right after the candle confirmation and completion of the liquidity sweep, price then dropped within minutes, resulting in another Binary Win.
🔵 Settings
Time Frame : Select the desired timeframe for analysis. If left blank, the indicator uses the chart’s current timeframe.
Swing Period : Defines how many candles are used to detect structural pivots (swing highs and lows). A higher value increases accuracy but reduces the number of signals.
Candle Pattern : Enables candle-based confirmation logic. When turned on, the indicator issues signals only if a valid reversal pattern is detected. You can also choose the confirmation filter strength, tighter filters show fewer but more precise signals.
🔵 Conclusion
A deep understanding of Liquidity Sweeps, Order Blocks, and Fair Value Gaps can make a decisive difference between ordinary and professional traders in the binary options market.
This indicator, combining smart money logic with candle confirmation, is one of the most precise tools for detecting true market reversals. When liquidity is collected and structural reversal signs emerge, the indicator automatically recognizes the price reaction and generates a reliable Call or Put signal.
Using this tool alongside market structure analysis and FVG detection allows traders to enter high-probability setups while filtering out false breakouts. For that reason, this binary options strategy is not only suitable for short-term trading but also valuable for understanding deeper smart-money behavior across timeframes.
Ultimately, success with this system comes down to two key principles: understanding the logic of the liquidity sweep and waiting for the candle confirmation to close. When these two conditions align, the indicator can pinpoint the best entry points with remarkable precision, helping you build a structured, intelligent, and profitable binary options strategy.

Prophet Model [TakingProphets]The Prophet Model — context pipeline (HTF PDA → Sweep → CISD → EPE) with dynamic risk
Purpose
Informational overlay for organizing institutional context in real time. It does not issue buy/sell signals and is not financial advice. Use it to structure analysis and checklist-driven execution—not to automate decisions.
What it does (modules at a glance)
Projects HTF PD Arrays (FVGs) onto your current chart and maintains only the nearest active array.
Validates directional bias using Candle Range Theory (CRT) on the same HTF.
Tracks Liquidity Sweeps (BSL/SSL) on HTF-aware pivots.
Confirms Change in State of Delivery (CISD) via displacement after a sweep.
Optionally refines entries with EPE when a local (internal) imbalance forms right after CISD.
Derives dynamic TP/BE/SL from measured displacement and recent extremes (not fixed distances).
Keeps a rules checklist (PDA tap → CRT → Sweep → CISD) and a relationships table (common HTF↔LTF pairings) to enforce process.
How it works (integration, not a mashup)
The modules are sequenced on one HTF time base so each step gates the next:
HTF PD Arrays (context zone). The model identifies valid HTF FVGs, filters tiny/weekend gaps, removes arrays that are invalidated by clean trades-through, and persists only the nearest PDA. This focuses attention on the institutional zone most likely to matter now.
CRT (directional gating). CRT on the same HTF establishes a provisional bias. No entries are implied; CRT simply permits or forbids the following steps. If CRT disagrees with the PDA context, the checklist remains incomplete.
Liquidity Sweep (event). The model tracks HTF-aware BSL/SSL pivots. A sweep only “counts” if it occurs in relation to the active PDA (tap/engagement). This prevents generic swing-high/low tags from triggering downstream logic.
CISD (confirmation). After a qualified sweep, the tool looks for displacement through the sequence open (the open of the impulsive leg beginning at or immediately after the sweep). Crossing that threshold confirms CISD, which marks a structural delivery shift consistent with the CRT bias.
EPE (refinement, optional). Immediately following CISD, the model scans for a fresh internal imbalance. If found quickly, it promotes that price area as the Easiest Point of Entry (EPE) and relabels the reference. If not, the CISD level remains primary.
Dynamic risk levels. TP/BE/SL are derived from the measured displacement around the CISD leg (e.g., BE ≈ 1× leg, TP ≈ 2.25× stretch; SL aligned to nearby structural extremes rather than a fixed pip offset). Levels update with structure and can display prices.
By chaining PDA → CRT → Sweep → CISD → (EPE) → Risk on a single HTF backbone, the tool creates a coherent workflow where later signals simply do not appear without earlier context. That’s why this is not a bundle of independent features: each module’s output is another module’s input.
Concepts & operational rules (high level)
HTF PD Arrays (FVGs)
Uses a standard three-candle gap definition on the chosen HTF, with filters for weekend/tiny gaps.
Inverse mitigation: if price trades cleanly through an array, the box is removed and internal state resets.
Nearest-PDA persistence: when multiple arrays exist, only the closest remains visible to reduce clutter.
Optional right-extension draws lingering influence X bars forward.
Candle Range Theory (CRT)
Bullish CRT: candle 2 wicks below candle 1’s low but closes back inside candle 1’s range, without taking its high.
Bearish CRT: candle 2 wicks above candle 1’s high but closes back inside candle 1’s range, without taking its low.
Role: bias validation paired to CISD when alignments match the active PDA.
Liquidity Sweeps (BSL/SSL)
Tracks candidate HTF pivots as buy-/sell-side liquidity.
A sweep registers when price takes a tracked pivot in the vicinity of the active PDA.
CISD (Change in State of Delivery)
Finds the sequence open for the impulsive leg that begins at/after the sweep.
Bearish path (after BSL sweep): CISD when close < sequence-open.
Bullish path (after SSL sweep): CISD when close > sequence-open.
On confirmation, the model plots a CISD line, checks the box in the Strategy Checklist, and triggers risk calc.
EPE (Easiest Point of Entry)
Within a short window after CISD, scans for a local imbalance; if present, promotes that level as EPE.
If no imbalance forms, CISD remains the operative reference.
Dynamic TP / BE / SL
Built from the measured leg around CISD (not fixed pip steps).
Approximate geometry: BE ≈ 1× leg, TP ≈ 2.25× leg; SL respects nearby structural extremes.
Labels and price markers are optional.
Architecture notes
Maps the current chart to a higher timeframe (e.g., 15s→M5, M1→M15, M5→H1, M15→H4, H1→D, H4→W, D→M).
Retrieves HTF OHLC/time with no lookahead so structures update intrabar until the HTF bar closes.
Periodic cleanup clears obsolete lines/labels/boxes to keep charts responsive.
Inputs (summary)
FVGs/PD Arrays: show/hide, colors, borders, label size, right-extension, nearest-only toggle.
CRT: enable/disable, label style.
Sweeps/CISD/EPE: enable/disable, line/label styles, EPE window.
Risk Levels (TP/BE/SL): enable each, price labels on/off, colors.
Tables/Checklist: strategy checklist on/off; relationships table (common HTF↔LTF pairings); text sizes and header colors.
Alerts (optional)
You may add alertconditions aligned with these events in your own workspace:
HTF PDA tap (bullish/bearish box)
CRT detected (bullish/bearish)
CISD confirmed (bullish/bearish)
EPE set/updated
Example messages:
“Prophet: CISD confirmed on {{ticker}} / {{interval}}”
“Prophet: EPE refined at {{close}} ({{time}})”
Notes & limitations
HTF values are provisional until the HTF bar closes; labels/levels can update while forming.
CISD/EPE are live conditions; they can form and later invalidate within the same HTF bar.
Liquidity relationships vary by market/regime; thin sessions and large gaps can affect clarity.
Educational tool only. No performance claims; no trade signals.
Originality & scope (for protected/invite-only publications)
A single HTF-synchronized engine sequences PDA → CRT → Sweep → CISD → (EPE) and withholds later steps unless prerequisites are met.
Nearest-PDA persistence and inverse-mitigation enforce focus on the most relevant institutional zone.
Displacement-based risk math ties TP/BE/SL to structure instead of static offsets.
Checklist + relationships table promote consistent, rules-first behavior and reduce discretionary drift.
Attribution: Concepts inspired by ICT (PD arrays/FVGs, CRT, sweeps, displacement, refined entries). Design, integration logic, and risk framework by TakingProphets.

Structure Pro+ 2.4 Structure Pro+ 2.4
Summary
Structure Pro+ 2.4 is a comprehensive, all-in-one indicator designed for traders who utilize Smart Money Concepts (SMC). It automates the detection of key market structure events, identifies high-probability trade signals, and incorporates time-based filters to focus on the most volatile trading sessions, helping you make informed decisions with precision and clarity.
This suite goes beyond simple lines on a chart by integrating Market Structure, Fair Value Gaps (FVGs), and institutional trading sessions into a single, powerful tool.
Core Features
📈 Automatic Market Structure
Break of Structure (BOS) & Change of Character (CHoCH): The indicator automatically identifies and labels significant breaks in market structure, allowing you to instantly recognize trend continuations (BOS) or potential reversals (CHoCH).
Customizable Pivot Detection: Fine-tune the sensitivity of the structure detection by adjusting the Left Bars and Right Bars settings to match your trading style and timeframe, from scalping to swing trading.
🎯 High-Probability Breakout Signals
Receive clear BUY and SELL signals based on a powerful confluence of events. A signal only appears when:
A BOS or CHoCH is confirmed.
The breakout move is validated by the creation of a recent Fair Value Gap (FVG), indicating strong momentum.
The signal occurs within a valid, high-volatility time session.
The breakout is confirmed on a closed candle to prevent fakeouts.
🔍 Key Liquidity & Imbalance Zones
Fair Value Gaps (FVGs): Automatically detects and displays FVG (Imbalance) zones on your chart, highlighting key areas of interest where the price may return.
Order Blocks (OBs): Optionally display the last order block before a structural break. The length of the OB box can be customized to keep your chart clean.
🕒 Time-Based Session Filters (Killzones)
Timing is everything. Structure Pro+ 2.4 provides fully customizable time filters to ensure you are only trading in optimal market conditions.
ICT Macro Sessions: Enable and customize standard ICT Macro "Killzone" sessions, which are displayed visually on your chart.
NASDAQ Open Session: A dedicated, customizable session filter for the high-volatility NASDAQ open.
Timezone Synchronization: Set your preferred timezone (America/New_York by default) to align all sessions perfectly, no matter where you are in the world.
⚙️ Full Customization & Alerts
Visuals: Take complete control over the look and feel of the indicator, including colors, line styles, and label sizes.
Alert System: A comprehensive alert system allows you to get notified for every key event:
Signal (BUY/SELL)
BOS or CHoCH
BOS/CHoCH with FVG Confluence
Start of a Macro Session
How to Use
Identify the Trend: Use the automatically plotted BOS and CHoCH labels to determine the current market bias on your chosen timeframe. An uptrend is defined by a series of bullish BOS, while a downtrend is defined by bearish BOS. A CHoCH signals a potential shift in this bias.
Wait for a Signal in a Valid Session: Be patient and wait for a BUY or SELL signal to appear on your chart. Ensure the signal occurs within one of the active, visually-drawn time sessions (Macros or NASDAQ Open) for the highest probability.
Confirm and Manage Risk: Use the signal as a primary point of confluence in your trading plan. For best results, combine it with your own analysis. Always practice proper risk management by setting a stop loss, typically below the low of the swing that caused a BUY signal or above the high of the swing that caused a SELL signal.
Disclaimer: This indicator is a tool designed to assist in trade analysis and should not be considered as financial advice. Trading involves substantial risk, and past performance is not indicative of future results. Always conduct your own research and risk assessment before entering any trade.

Inversion Fair Value Gap Signals [AlgoAlpha]🟠 OVERVIEW
This script is a custom signal tool called Inversion Fair Value Gap Signals (IFVG) , designed to detect, track, and visualize fair value gaps (FVGs) and their inversions directly on price charts. It identifies bullish and bearish imbalances, monitors when these zones are mitigated or rejected, and extends them until resolution or expiration. What makes this script original is the inclusion of inversion logic—when a gap is filled, the area flips into an opposite "inversion fair value gap," creating potential reversal or continuation zones that give traders additional context beyond classic FVG analysis.
🟠 CONCEPTS
The script builds on the Smart Money Concepts (SMC) principle of fair value gaps, where inefficiencies form when price moves too quickly in one direction. Detection requires a three-bar sequence: a strong up or down move that leaves untraded price between bar highs and lows. To refine reliability, the script adds an ATR-based size filter and prevents overlap between zones. Once created, gaps are tracked in arrays until mitigation (price closing back into the gap), expiration, or transformation into an inversion zone. Inversions act as polarity flips, where bullish gaps become bearish resistance and bearish gaps become bullish support. Lower-timeframe volume data is also displayed inside zones to highlight whether buying or selling pressure dominated during gap creation.
🟠 FEATURES
Automatic detection of bullish and bearish FVGs with ATR-based thresholding.
Inversion logic: mitigated gaps flip into opposite-colored IFVG zones.
Volume text overlay inside each zone showing up vs down volume.
Visual markers (△/▽ for FVG, ▲/▼ for IFVG) when price exits a zone without mitigation.
🟠 USAGE
Apply the indicator to any chart and enable/disable bullish or bearish FVG detection depending on your focus. Use the colored gap zones as areas of interest: bullish gaps suggest possible continuation to the upside until mitigated, while bearish gaps suggest continuation down. When a gap flips into an inversion zone, treat it as potential support/resistance—bullish IFVGs below price may act as demand, while bearish IFVGs above price may act as supply. Watch the embedded up/down volume data to gauge the strength of participants during gap formation. Use the △/▽ and ▲/▼ markers to spot when price rejects gaps or inversions without filling them, which can indicate strong trending momentum. For practical use, combine alerts with your trade plan to track when new gaps form, when old ones are resolved, or when key zones flip into inversions, helping you align entries, targets, or reversals with institutional order flow logic.

Silent Trigger Silent Trigger combines widely used concepts under one scoring engine. Each module adds weight only when its conditions are met:
1. Higher-Timeframe (HTF) context
• Requests 1H and the next HTF up (e.g., 4H/D) with request.security(...) on confirmed bars only.
• Uses RSI(14) and a MACD line (EMA12–EMA26 difference) for bias.
• By default HTF weights the score. There is an option to require HTF alignment if you prefer a hard filter.
2. Market regime
• ADX for trend strength.
• Bollinger Band width and a fractal-energy proxy to detect squeeze/coiling vs expansion.
3. Smart-money / Wyckoff structure
• High-volume narrow bars, absorption, spring/upthrust, and liquidity grabs past recent swing highs/lows.
4. Momentum & divergences
• RSI and MACD-line divergences (regular + hidden) and simple exhaustion checks.
5. Fair Value Gaps (FVG)
• 3-bar gap with mid-gap revisit confirmation.
6. Volume context
• Relative volume and a compact 10-bin rolling volume profile to locate HVN proximity.
7. Sessions / time filter
• Optional London/NY “kill zone” participation filter.
8. Correlation (optional)
• Simple BTC trend check for USD-quoted markets.
Pre-Move (yellow) logic:
Triggers only when the market is compressed (squeeze/low fractal energy), ADX is rising, the MACD histogram is near zero (pressure building), and there is a money-flow impulse (MFI slope and/or OBV Z-score spike).
The yellow diamond is plotted on the side of the expected move:
• Below for bullish reversals / Above for bullish breakouts.
• Above for bearish reversals / Below for bearish breakouts.
A built-in cooldown keeps yellows from spamming.
⸻
What appears on the chart
• Bull diamond (green): Total score ≥ your threshold and > bear score.
• Bear diamond (magenta): Mirror of the above.
• Pre-move (yellow): Early heads-up; use it with HTF context and structure.
All diamonds are intentionally tiny to minimize clutter.
⸻
Key settings
• Signal Mode & Min Probability – tighten/loosen confirmations.
• Use Higher TF in Scoring – soft weighting (default).
• Require HTF Alignment – optional hard gate.
• Module toggles – Smart Money, Wyckoff, FVG, Correlation, Sessions.
• Pre-Move – enable, cooldown bars, MFI levels, OBV Z-score threshold.
⸻
How to use (practical)
1. Choose a TF that matches your style (5–15m intraday, 1H–4H swing).
2. Read HTF bias first; trade in that direction unless structure clearly supports a reversal.
3. Treat yellow as “get ready.” Act only when a green/magenta prints with structure (S/R, FVG, HVN) and acceptable risk.
4. Place stops beyond the liquidity level or FVG midpoint; size positions conservatively.
⸻
Repainting & HTF policy
• No lookahead is used anywhere.
• request.security is called on confirmed bars; the HTF MACD line is computed inside the HTF context (single series), not by indexing a tuple.
• Signals are designed for bar-close confirmation. Intra-bar alerts can change until the bar closes.
⸻
Limitations (honest)
• Money-flow features depend on volume quality; thin/synthetic volume reduces reliability.
• Pre-moves can fail during unscheduled news shocks or when HTF trend is dominant.
• This is not financial advice. You are responsible for entries, exits, and risk.
⸻
Alerts
Built-in bull/bear alerts include direction and a probability bucket (Basic/Moderate/Strong/Extreme).
Pre-move yellows are primarily visual; you can still set an alert on their plot condition if desired.
⸻
Why this isn’t a “mashup”
• A single probability engine blends HTF bias, structure (liquidity/Wyckoff/FVG), regime, and volume into a score, rather than stacking unrelated indicators.
• A pre-move detector that requires compression + rising trend energy + money-flow impulse, and places the marker on the side of the expected move, with cooldown control.
• A lightweight rolling HVN check to bias continuation vs mean-reversion near key nodes.
⸻
Changelog (summary)
• Current release: pre-move module, HTF hard-gate option, tiny diamonds, clarified HTF/no-repaint policy, session filter tidy-up.

VG 1.0This script is an enhanced version of SMC Structures and FVG with an advanced JSON-based alert system designed for seamless integration with webhooks and external applications (such as a Swift iOS app).
What it does
It detects and plots on the chart:
Fair Value Gaps (FVG) — bullish and bearish.
Break of Structure (BOS) and Change of Character (CHOCH).
Key Fibonacci levels (0.786, 0.705, 0.618, 0.5, 0.382) based on the current structure.
Additionally, it generates custom alerts:
FVG Alerts:
When a new FVG is created (bullish or bearish).
When an existing FVG gets mitigated.
BOS & CHOCH Alerts:
Includes breakout direction (bullish or bearish).
Fibonacci Alerts:
When price touches a configured level, with adjustable tick tolerance.
Alerts can be:
Declarative (alertcondition) for manual setup inside TradingView.
Programmatic (alert() JSON) for automated webhook delivery to your system or mobile app.
Key Features
Optional close confirmation to filter out false signals.
Standardized JSON format for direct API or mobile app integration.
Webhook-ready for automated push notifications.
Full visual control with lines, boxes, and labels.
Configurable tick tolerance for Fibonacci “touch” detection.

Futures Trade Entry Indicator (MTF)Work in Progress with the help of Claude. Not ready for active trading. Public for help improving. This will be a multi-timeframe futures trading indicator with supply/demand zones, Fair Value Gaps (FVGs), and sophisticated entry/exit logic.I've created a comprehensive Pine Script v6 indicator that matches all your specifications! Here's what the script includes:
## **Key Features Implemented:**
### **🔄 Multi-Timeframe Logic**
- **1H Chart Data**: Detects Supply Zones, Demand Zones, and Fair Value Gaps
- **Current Timeframe**: Monitors for re-entry and confirmation signals
### **📊 Zone Detection**
- **Supply Zones**: Identified using pivot highs with configurable strength
- **Demand Zones**: Identified using pivot lows with touch validation
- **Fair Value Gaps**: Both bullish and bearish FVGs detected automatically
- **Auto-Expiry**: Zones expire after 24 hours (configurable)
### **⚡ Entry Logic**
- **Dual Confirmation Required**:
- ✅ Engulfing candle pattern (bullish/bearish)
- ✅ Market structure shift (HH→LL or LL→HH)
- **Zone Re-entry**: Price must be within identified zones/FVGs
### **🎯 Probability System**
- **Smart Scoring**: Based on zone age, strength, and risk/reward ratio
- **Color-Coded**: Green (High), Yellow (Medium), Red (Low)
- **Real-time Calculation**: Updates with each potential entry
### **🎨 Visual Elements**
- **Colored Zones**: Supply (red), Demand (green), FVGs (blue/orange)
- **Entry Labels**: 🟩 LONG / 🟥 SHORT markers
- **Probability Labels**: Display confidence levels
- **Confirmation Shapes**: Triangle indicators for pattern completion
### **⚙️ Manual Controls**
All the requested toggles are available in the settings panel:
- Show/Hide Supply Zones
- Show/Hide Demand Zones
- Show/Hide FVGs
- Show/Hide Labels
- Show/Hide Probability
- Zone strength and expiry settings
- Custom colors for all elements
### **🔔 Alert System**
- Entry opportunity alerts
- Includes probability assessment
- Ticker symbol identification
## **Usage Instructions:**
1. **Apply to 15m chart** for active trading signals
2. **Configure settings** based on your preferences
3. **Set up alerts** for automated notifications
4. **Monitor probability levels** for trade quality assessment
The script automatically handles the complex multi-timeframe analysis while keeping the interface clean and user-friendly. All zones update dynamically and expire appropriately to avoid clutter.
Would you like me to adjust any specific parameters or add additional features?

Order Blocks v2Order Blocks v2 – Smart OB Detection with Time & FVG Filters
Order Blocks v2 is an advanced tool designed to identify potential institutional footprints in the market by dynamically plotting bullish and bearish order blocks.
This indicator refines classic OB logic by combining:
Fractal-based break conditions
Time-level filtering (Power of 3)
Optional Fair Value Gap (FVG) confirmation
Real-time plotting and auto-invalidation
Perfect for traders using ICT, Smart Money, or algorithmic timing models like Hopplipka.
🧠 What the indicator does
Detects order blocks after break of bullish/bearish fractals
Supports 3-bar or 5-bar fractal structures
Allows OB detection based on close breaks or high/low breaks
Optionally confirms OBs only if followed by a Fair Value Gap within N candles
Filters OBs based on specific time levels (3, 7, 11, 14) — core anchors in many algorithmic models
Automatically deletes invalidated OBs once price closes through the zone
⚙️ How it works
The indicator:
Tracks local fractal highs/lows
Once a fractal is broken by price, it backtracks to identify the best OB candle (highest bullish or lowest bearish)
Validates the level by checking:
OB type logic (close or HL break)
Time stamp match with algorithmic time anchors (e.g. 3, 7, 11, 14 – known from the Power of 3 concept)
Optional FVG confirmation after OB
Plots OB zones as lines (body or wick-based) and removes them if invalidated by a candle close
This ensures traders see only valid, active levels — removing noise from broken or out-of-context zones.
🔧 Customization
Choose 3-bar or 5-bar fractals
OB detection type: close break or HL break
Enable/disable OBs only on times 3, 7, 11, 14 (Hopplipka style)
Optional: require nearby FVG for validation
Line style: solid, dashed, or dotted
Adjust OB length, width, color, and use body or wick for OB height
🚀 How to use it
Add the script to your chart
Choose your preferred OB detection mode and filters
Use plotted OB zones to:
Anticipate price rejections and reversals
Validate Smart Money or ICT-based entry zones
Align setups with algorithmic time sequences (3, 7, 11, 14)
Filter out invalid OBs automatically, keeping your chart clean
The tool is useful on any timeframe but performs best when combined with a liquidity-based or time-anchored trading model.
💡 What makes it original
Combines fractal logic with OB confirmation and time anchors
Implements time-based filtering inspired by Hopplipka’s interpretation of the "Power of 3"
Allows OB validation via optional FVG follow-up — rarely available in public indicators
Auto-cleans invalidated OBs to reduce clutter
Designed to reflect market structure logic used by institutions and algorithms
💬 Why it’s worth using
Order Blocks v2 simplifies one of the most nuanced parts of SMC: identifying clean and high-probability OBs.
It removes subjectivity, adds clear timing logic, and integrates optional confluence tools — like FVG.
For traders serious about algorithmic-level structure and clean setups, this tool delivers both logic and clarity.
⚠️ Important
This indicator:
Is not a signal generator or financial advice tool
Is intended for experienced traders using OB/SMC/time-based logic
Does not predict market direction — it provides visual structural levels only

H4 Swing Grade Checklist English V.1✅ H4 Swing Grade Checklist – Auto Grading for Smart Money Setups
This script helps manual traders assess the quality of a Smart Money swing trade setup by checking 7 key criteria. The system assigns a grade (A+, A, A−, or B) based on how many and which checklist items are met.
📋 Checklist Items (7 total):
✅ Sweep occurs within 4 candles
✅ MSS (strong break candle)
✅ Entry is placed outside the wick of the sweep
✅ FVG is fresh (not previously used)
✅ FVG overlaps Fibonacci 0.705 level
✅ FVG lies within Premium or Discount zone
✅ Entry is placed at 0.705 Fibonacci retracement
🏅 Grading Criteria:
A+ → All 7 checklist items are satisfied
A → Only missing #5 (FVG Overlap with 0.705)
A− → Only missing #4 (FVG Fresh)
B → Only missing #2 (MSS – clear break of structure)
– → Any other combinations / fewer than 6 conditions met
⚙️ Features:
Toggle visibility with one click
Fixed display in top-right or bottom-right of the chart
Color-coded grading logic (Green, Yellow, Orange, Blue)
Clear checklist feedback for trade journaling or evaluation
🚀 Ideal For:
ICT / Smart Money traders
Prop firm evaluations
Swing trade quality control

Ind JDV 2.2 PRO🛡️ Ind JDV 2.0 PRO – Chandelier Exit + FVG + EMA (Precise Entry)
Description:
Ind JDV 2.0 PRO is an advanced indicator that combines three powerful confirmations to find the best trading opportunities:
Chandelier Exit: Filters trade direction based on volatility breakouts controlled by ATR.
Fair Value Gap (FVG): Detects price inefficiency zones at their very first appearance.
EMA (Exponential Moving Average): Acts as a trend filter to ensure trading with the dominant market flow.
🔍 Key Features:
Marks only one precise signal on the candle where the FVG starts.
Confirms the trend using a 150-period EMA (fully adjustable).
Optionally draws Take Profit and Stop Loss target lines for clear visual guidance.
Background color changes (green or red) to reflect the active market trend.
Built-in automatic alerts for buy or sell opportunities.
Optimized code for maximum speed across all timeframes.
✅ Perfect for trading indices, forex, cryptocurrencies, and stocks.
✅ Compatible with all timeframes (5m, 15m, 1H, 4H, Daily).
✅ Fully customizable to fit scalping, intraday, or swing trading styles.
⚙️ Default Parameters:
ATR Period: 10
ATR Multiplier: 3.0
EMA Period: 150
FVG Lookback: 3 candles
Take Profit: 100 points
Stop Loss: 50 points
(All values are adjustable in settings.)
📈 How it works:
The indicator analyzes price structure.
Detects a valid Fair Value Gap (FVG) formation.
Confirms the breakout with a Chandelier Exit signal.
Verifies price alignment with the EMA trend.
Triggers a single entry signal (BUY or SELL) exactly on the first candle that meets all conditions.
🚀 Optimize your trading by focusing on high-probability zones, supported by solid confirmations and clean visual signals.
Add Ind JDV 2.0 PRO to your trading arsenal and take your strategy to the next level! 🔥

SMC Liquidity & Order Blocks🔹 1. Moving Averages for Trend Confirmation
Uses Exponential Moving Averages (EMA) to determine trend direction.
9-period EMA (blue) and 15-period EMA (red) are plotted.
🔹 2. Liquidity Zones (Swing Highs & Lows)
Identifies liquidity zones where price is likely to react.
Buy-Side Liquidity: Highest high over 20 periods (Green line).
Sell-Side Liquidity: Lowest low over 20 periods (Red line).
🔹 3. Order Block Detection
Detects bullish and bearish order blocks (key price zones of institutional activity).
Bullish Order Block (OB): Formed when the highest close over 5 bars exceeds the highest high.
Bearish Order Block (OB): Formed when the lowest close over 5 bars is lower than the lowest low.
Plotted using green (up-triangle) for bullish OB and red (down-triangle) for bearish OB.
🔹 4. Fair Value Gaps (FVG)
Detects price inefficiencies (gaps between candles).
FVG Up: When a candle's high is lower than a candle two bars ahead.
FVG Down: When a candle's low is higher than a candle two bars ahead.
Plotted using blue circles (FVG Up) and orange circles (FVG Down).

Reversal rehersal v1This indicator was designed to identify potential market reversal zones using a combination of RSI thresholds (shooting range/falling range), candlestick patterns, and Fair Value Gaps (FVGs). By combining all these elements into one indicator, it allow for outputting high probability buy/sell signals for use by scalpers on low timeframes like 1-15 mins, for quick but small profits.
Note: that this has been mainly tested on DE40 index on the 1 min timeframe, and need to be adjusted to whichever timeframe and symbol you intend to use. Refer to the backtester feature for checking if this indicator may work for you.
The indicator use RSI ranges from two timeframes to highlight where momentum is building up. During these areas, it will look for certain candlestick patterns (Sweeps as the primary one) and check for existance of fair value gaps to further enhance the hitrate of the signal.
The logic for FVG detection was based on ©pmk07's work with MTF FVG tiny indicator. Several major changes was implemented though and incorporated into this indicator. Among these are:
Automatically adjustments of FVG boxes when mitigated partially and options to extend/cull boxes for performance and clarity.
Backtesting Table (Experimental):
This indicator also features an optional simplified table to review historical theoretical performance of signals, including win rate, profit/loss, and trade statistics. This does not take commision or slippage into consideration.
Usage Notes:
Setup:
1. Add the indicator to your chart.
2. Decide if you want to use Long or Short (or both).
3. If you're scalping on ie. 1 min time frame, make sure to set FVG's to higher timeframes (ie. 5, 15, 60).
4. Enable the 'Show backtest results' and adjust the 'Signals' og 'Take profit' and 'Stop loss' values until you are satisfied with the results.
Use:
1. Setup an alert based on either of the 'BullishShooting range' or 'BearishFalling range' alerts. This will draw your attention to watch for the possible setups.
2. Verify if there's a significant imbalance prior to the signal before taking the trade. Otherwise this may invalidate the setup.
3. Once a signal is shown on the graph (either Green arrow up for buys/Red arrow down for sells) - you should enter a trade with the given 'Take profit' and 'Stop loss' values.
4. (optional) Setup an alert for either the Strong/Weak signals. Which corresponds to when one of the arrows are printed.
Important: This is the way I use it myself, but use at own risk and remember to combine with other indicators for further confluence. Remember this is no crystal ball and I do not guarantee profitable results. The indicator merely show signals with high probability setups for scalping.

Crodl Market StructureCrodl Market Structure | FVG | MFI | EMA
The Crodl Market Structure indicator is a powerful trading tool designed to help traders identify key price movements, trend direction, and potential liquidity zones. It combines Fair Value Gaps (FVGs), Money Flow Index (MFI) Trend Filters, and Exponential Moving Averages (EMAs) to provide a structured market view.
Features:
Exponential Moving Averages (EMAs) – Trend Confirmation
Tracks EMA 20, EMA 50, and EMA 200 to identify trend direction.
EMAs change color dynamically based on price action.
Helps traders determine uptrends, downtrends, and potential reversals.
Money Flow Index (MFI) – Trend Strength & Exhaustion
Uses MFI to detect overbought (80) and oversold (20) levels.
Confirms trend exhaustion and highlights potential reversals.
Works with EMAs to generate high-confidence entry signals.
Fair Value Gap (FVG) – Liquidity & Price Imbalance
Identifies Fair Value Gaps (price imbalances) based on 3 consecutive bullish or bearish candles.
Marks liquidity zones where price may return for mitigation.
Toggle ON/OFF to show/hide Fair Value Gaps on the chart.
Smart Buy & Sell Signals
🔺 Bullish Entry Signal: Price crosses above EMA 20 after oversold MFI & downtrend.
🔻 Bearish Entry Signal: Price crosses below EMA 20 after overbought MFI & uptrend.
Helps confirm trend continuation or reversal opportunities.
🔹 How to Use:
1️⃣ Trend Analysis – Check EMAs alignment to identify the overall trend.
2️⃣ Momentum Confirmation – Use MFI to spot trend exhaustion before price reverses.
3️⃣ Liquidity Gaps – Watch for Fair Value Gaps (FVGs) to anticipate price retracements.
🔹 Settings:
EMA Settings: Enable/Disable EMAs, adjust lengths (20, 50, 200).
MFI Trend Filter: Enable/Disable trend signals, customize MFI levels.
Fair Value Gaps: Show/Hide FVGs, adjust extension & colors.
