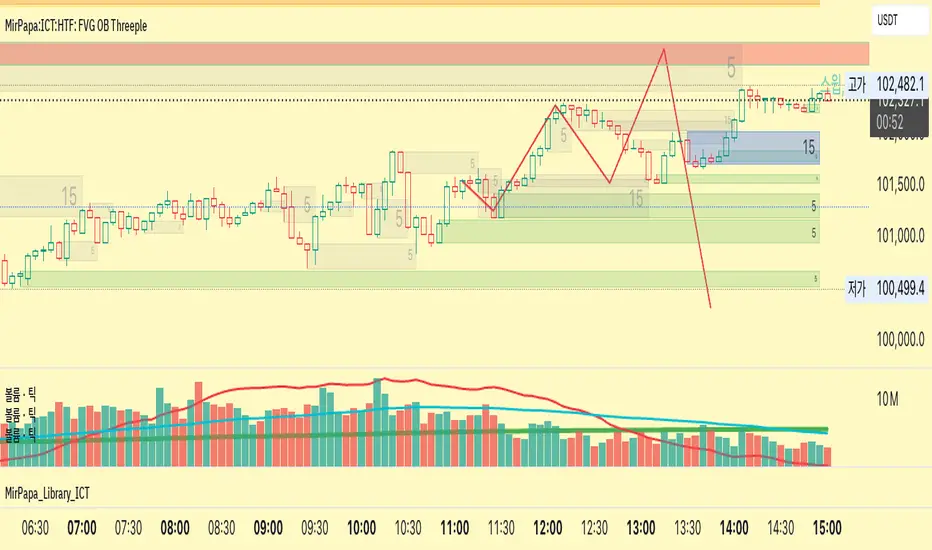
MirPapa:ICT:HTF: FVG OB Threeple# MirPapa:ICT:HTF: FVG OB (Fair Value Gap Order Block)
**Version:** Pine Script® v6
**Author:** © goodia
**License:** MPL-2.0 (Mozilla Public License 2.0)
---
## Overview
“FVG OB” (Fair Value Gap Order Block) identifies higher-timeframe candle ranges where a gap (imbalance) exists between two non-consecutive candles, signaling potential institutional order blocks. This module draws bullish or bearish FVG OB boxes on your lower-timeframe chart, extends them until price interacts a specified number of times, and then finalizes (recolors) the box.
---
## Inputs
- **Enable FVG OB Boxes** (`bool`)
Toggle drawing of HTF FVG OB boxes on the chart.
- **Enable FVG OB Midlines** (`bool`)
Toggle drawing of a midpoint line inside each FVG OB box.
- **FVG OB Close Count** (`int` 1–10)
Number of HTF closes beyond the FVG range required to finalize (recolor) the box.
- **FVG OB Bull Color** (`color`)
Fill & border color for bullish FVG OB boxes.
- **FVG OB Bear Color** (`color`)
Fill & border color for bearish FVG OB boxes.
- **FVG OB Box Transparency** (`int` 1–100)
Opacity level for FVG OB box fills (higher = more transparent).
---
## How It Works
1. **HTF Data Retrieval**
- The script uses `request.security()` (via `GetHTFrevised()`) to fetch HTF OHLC and historical values:
- `_htfHigh3` (high three bars ago) and `_htfLow1` (low one bar ago) for bullish FVG OB.
- `_htfLow3` (low three bars ago) and `_htfHigh1` (high one bar ago) for bearish FVG OB.
- It also tracks the HTF `bar_index` on the lower timeframe to align drawing.
2. **FVG OB Detection**
- **Bullish FVG OB**: Occurs when the HTF low of the previous bar (`low `) is strictly above the HTF high of three bars ago (`high `), creating a gap.
- **Bearish FVG OB**: Occurs when the HTF high of the previous bar (`high `) is strictly below the HTF low of three bars ago (`low `), creating a gap.
3. **Box Creation**
- On each new HTF bar (`ta.change(time(HTF)) != 0`), if a bullish or bearish FVG OB condition is met, the script calls `CreateBoxData()` with:
- **Bullish**: `bottom = HTF low `, `top = HTF high `, `_isBull = true`.
- **Bearish**: `bottom = HTF low `, `top = HTF high `, `_isBull = false`.
- Midline toggled by input.
- A `BoxData` struct is created and stored in either the Bull or Bear array.
4. **Box Extension & Finalization**
- On **every LTF bar**, `ProcessBoxDatas(...)` iterates over all active FVG OB boxes:
1. **Extend Right Edge**: `box.set_right(bar_index)` ensures the box follows the latest bar.
2. **Record Volume Delta**: Tracks buy/sell volume inside the box.
3. **Touch Stage Update**: `modBoxUpdateStage()` increments `_stage` when price touches its “basePoint” (for FVG OB, the basePrice is one side of the gap).
4. **Finalize**: `setBoxFinalize()` checks if the configured number of closes beyond the FVG gap (`FVG OB Close Count`) has occurred. If so:
- `_isActive := false`
- Border and background colors are changed to the “Box Close Color” (input).
- Finalized boxes remain on screen semi-transparent, indicating that the FVG OB zone has been tested.
5. **Midline (Optional)**
- If “Enable FVG OB Midlines” is checked, `ProcessBoxDatas()` also extends a horizontal midpoint line inside the box with `line.set_x2(bar_index)`.
---
## Usage Instructions
1. **Installation**
- Copy the FVG OB section of the Pine Script into TradingView’s Pine Editor (ensure the library import is included).
- Click “Add to Chart.”
2. **Configure Inputs**
- Choose a Higher Time Frame via the dropdown (e.g., “4시간” maps to a 4H timeframe).
- Toggle “Enable FVG OB Boxes” and “Enable FVG OB Midlines.”
- Select colors for bullish and bearish boxes and set transparency.
- Adjust “FVG OB Close Count” to control how many closes beyond the gap finalize the box.
3. **Interpretation**
- **Active FVG OB Boxes** extend to the right until price closes beyond the gap range the specified number of times.
- When finalized, each box changes to the “Box Close Color,” signaling that institutional orders in that gap have likely been filled.
Enjoy precise visualization of higher-timeframe Fair Value Gap Order Blocks on your lower-timeframe chart!
In den Scripts nach "fvg" suchen
MirPapa:ICT:HTF: FVG Threeple# MirPapa:ICT:FVG Double HTF
**Version:** Pine Script® v6
**Author:** © goodia
**License:** MPL-2.0 (Mozilla Public License 2.0)
---
## Overview
“MirPapa:ICT:FVG Double HTF” is a TradingView indicator that identifies and visualizes Fair Value Gaps (FVG) on two higher time frames (HighTF and MidTF) simultaneously. It can also draw FVG boxes on the current chart’s time frame. When “Overlap Mode” is enabled, the indicator displays only the intersection of HighTF and MidTF FVG areas.
---
## Key Features
- **HighTF FVG**
- Detects bullish and bearish FVGs on a user-selected upper time frame (e.g., 4H).
- Draws colored boxes around gap ranges, optionally with a midpoint line.
- Automatically extends boxes on every bar and finalizes (recolors) them after a specified number of closes beyond the gap.
- **MidTF FVG**
- Same as HighTF FVG but for a second, intermediate time frame (e.g., 1H).
- Runs in parallel to HighTF logic, with separate color and transparency settings.
- **CurrentTF FVG (Optional)**
- If enabled, draws FVG boxes using the chart’s own time frame.
- Behaves identically: extends until broken by price, then finalizes.
- **Overlap Mode**
- When enabled, hides all individual HighTF and MidTF boxes.
- Instead, computes and displays only their overlapping rectangle(s)—separate for bullish and bearish gaps.
---
## Inputs & Configuration
- **Common Inputs**
- **Enable High/Mid Overlap Mode** (`boolean`): Show only overlapping HighTF + MidTF FVG areas.
- **Box Close Color** (`color`): Color applied to any FVG box when it is finalized.
- **HighTF FVG Settings**
- **HighTF Label** (`dropdown`): Choose a Korean label (e.g., “4시간”) that maps to a Pine timeframe (e.g., “240”).
- **Enable HighTF FVG Boxes** (`boolean`): Toggle drawing of HighTF FVG boxes.
- **Enable HighTF FVG Midlines** (`boolean`): Toggle midpoint line inside each HighTF box.
- **HighTF FVG Close Count** (`integer` 1–10): Number of closes beyond the gap before finalizing the box.
- **HighTF FVG Bull Color** (`color`): Fill & border color for bullish HighTF gaps.
- **HighTF FVG Bear Color** (`color`): Fill & border color for bearish HighTF gaps.
- **HighTF Box Transparency** (`integer` 1–100): Opacity level for HighTF box fills.
- **MidTF FVG Settings**
- **MidTF Label** (`dropdown`): Choose a Korean label (e.g., “1시간”) mapped to a Pine timeframe.
- **Enable MidTF FVG Boxes** (`boolean`): Toggle drawing of MidTF FVG boxes.
- **Enable MidTF FVG Midlines** (`boolean`): Toggle midpoint line inside each MidTF box.
- **MidTF FVG Close Count** (`integer` 1–10): Number of closes beyond the gap before finalizing the box.
- **MidTF FVG Bull Color** (`color`): Fill & border color for bullish MidTF gaps.
- **MidTF FVG Bear Color** (`color`): Fill & border color for bearish MidTF gaps.
- **MidTF Box Transparency** (`integer` 1–100): Opacity level for MidTF box fills.
- **CurrentTF FVG Settings**
- **Enable CurrentTF FVG Boxes** (`boolean`): Draw FVG boxes on the chart’s own timeframe.
- **Enable CurrentTF FVG Midlines** (`boolean`): Toggle midpoint line inside each CurrentTF box.
- **CurrentTF FVG Close Count** (`integer` 1–10): Number of closes beyond the gap before finalizing the box.
- **CurrentTF FVG Bull Color** (`color`): Fill & border color for bullish CurrentTF gaps.
- **CurrentTF FVG Bear Color** (`color`): Fill & border color for bearish CurrentTF gaps.
- **CurrentTF Box Transparency** (`integer` 1–100): Opacity level for CurrentTF box fills.
---
## How It Works
1. **Time Frame Conversion**
Korean labels (e.g., “4시간”, “1시간”) are converted internally to Pine timeframe strings via `GetHtfFromLabel()`.
2. **Data Retrieval**
For each chosen TF (HighTF, MidTF, and optionally CurrentTF), the script fetches OHLC and historical values using `GetHTFrevised()`.
- Tracks `bar_index` from that TF to align box drawing on the chart’s base timeframe.
3. **Box Lifecycle**
- **Creation**: On each new TF bar, if a bullish gap (`low > high `) or bearish gap (`low > high `) is detected, `CreateBoxData()` registers a new `BoxData` struct and draws an initial box.
- **Extension**: On every chart bar, `ProcessBoxDatas()` extends each active box’s right edge and updates internal “touch stage” and volume.
- **Finalization**: After the specified number of closes beyond the gap, `setBoxFinalize()` disables the box and changes its border & fill to the “Box Close Color”.
4. **Overlap Mode**
- When enabled, HighTF and MidTF boxes are not drawn individually.
- Instead, at each bar, the script iterates over all active HighTF boxes and all active MidTF boxes, computes their intersection rectangle (if any), and draws only that overlapping area (distinct handling for bullish vs. bearish gaps).
---
## Installation & Usage
1. **Copy & Paste**
Copy the entire Pine Script code into TradingView’s Pine Editor.
Click “Add to Chart.”
2. **Configure Inputs**
- Choose your HighTF and MidTF via the dropdown menus.
- Enable or disable FVG boxes/midlines for each TF.
- Adjust colors, transparency, and “Close Count” settings to taste.
- Toggle “Overlap Mode” if you only want to see common areas between HighTF and MidTF gaps.
3. **Interpretation**
- **Active Boxes** extend to the right as new bars form. When price closes beyond a gap (per “Close Count”), the box is finalized and recolored to the close color.
- In **Overlap Mode**, you’ll see only the overlapping region between HighTF and MidTF gaps, updated on every bar.
Enjoy precise FVG visualization across multiple time frames!
NWOG with FVGThe New Week Opening Gap (NWOG) and Fair Value Gap (FVG) combined indicator is a trading tool designed to analyze price action and detect potential support, resistance, and trade entry opportunities based on two significant concepts:
New Week Opening Gap (NWOG): The price range between the high and low of the first candle of the new trading week.
Fair Value Gap (FVG): A price imbalance or gap between candlesticks, where price may retrace to fill the gap, indicating potential support or resistance zones.
When combined, these two concepts help traders identify key price levels (from the new week open) and price imbalances (from FVGs), which can act as powerful indicators for potential market reversals, retracements, or continuation trades.
1. New Week Opening Gap (NWOG):
Definition:
The New Week Opening Gap (NWOG) refers to the range between the high and low of the first candle in a new trading week (often, the Monday open in most markets).
Purpose:
NWOG serves as a significant reference point for market behavior throughout the week. Price action relative to this range helps traders identify:
Support and Resistance zones.
Bullish or Bearish sentiment depending on price’s relation to the opening gap levels.
Areas where the market may retrace or reverse before continuing in the primary trend.
How NWOG is Identified:
The high and low of the first candle of the new week are drawn on the chart, and these levels are used to assess the market's behavior relative to this range.
Trading Strategy Using NWOG:
Above the NWOG Range: If price is trading above the NWOG levels, it signals bullish sentiment.
Below the NWOG Range: If price is trading below the NWOG levels, it signals bearish sentiment.
Price Touching the NWOG Levels: If price approaches or breaks through the NWOG levels, it can indicate a potential retracement or reversal.
2. Fair Value Gap (FVG):
Definition:
A Fair Value Gap (FVG) occurs when there is a gap or imbalance between two consecutive candlesticks, where the high of one candle is lower than the low of the next candle (or vice versa), creating a zone that may act as a price imbalance.
Purpose:
FVGs represent an imbalance in price action, often indicating that the market moved too quickly and left behind a price region that was not fully traded.
FVGs can serve as areas where price is likely to retrace to fill the gap, as traders seek to correct the imbalance.
How FVG is Identified:
An FVG is detected if:
Bearish FVG: The high of one candle is less than the low of the next (gap up).
Bullish FVG: The low of one candle is greater than the high of the next (gap down).
The area between the gap is drawn as a shaded region, indicating the FVG zone.
Trading Strategy Using FVG:
Price Filling the FVG: Price is likely to retrace to fill the gap. A reversal candle in the FVG zone can indicate a trade setup.
Support and Resistance: FVG zones can act as support (in a bullish FVG) or resistance (in a bearish FVG) if the price retraces to them.
Combined Strategy: New Week Opening Gap (NWOG) and Fair Value Gap (FVG):
The combined use of NWOG and FVG helps traders pinpoint high-probability price action setups where:
The New Week Opening Gap (NWOG) acts as a major reference level for potential support or resistance.
Fair Value Gaps (FVG) represent market imbalances where price might retrace to, filling the gap before continuing its move.
Signal Logic:
Buy Signal:
Price touches or breaks above the NWOG range (indicating a bullish trend) and there is a bullish FVG present (gap indicating a support area).
Price retraces to fill the bullish FVG, offering a potential buy opportunity.
Sell Signal:
Price touches or breaks below the NWOG range (indicating a bearish trend) and there is a bearish FVG present (gap indicating a resistance area).
Price retraces to fill the bearish FVG, offering a potential sell opportunity.
Example:
Buy Setup:
Price breaks above the NWOG resistance level, and a bullish FVG (gap down) appears below. Traders can wait for price to pull back to fill the gap and then take a long position when confirmation occurs.
Sell Setup:
Price breaks below the NWOG support level, and a bearish FVG (gap up) appears above. Traders can wait for price to retrace and fill the gap before entering a short position.
Key Benefits of the Combined NWOG & FVG Indicator:
Combines Two Key Concepts:
NWOG provides context for the market's overall direction based on the start of the week.
FVG highlights areas where price imbalances exist and where price might retrace to, making it easier to spot entry points.
High-Probability Setups:
By combining these two strategies, the indicator helps traders spot high-probability trades based on major market levels (from NWOG) and price inefficiencies (from FVG).
Helps Identify Reversal and Continuation Opportunities:
FVGs act as potential support and resistance zones, and when combined with the context of the NWOG levels, it gives traders clearer guidance on where price might reverse or continue its trend.
Clear Visual Signals:
The indicator can plot the NWOG levels on the chart, and shade the FVG areas, providing a clean and easy-to-read chart with entry signals marked for buy and sell opportunities.
Conclusion:
The New Week Opening Gap (NWOG) and Fair Value Gap (FVG) combined indicator is a powerful tool for traders who use price action strategies. By incorporating the New Week's opening range and identifying gaps in price action, this indicator helps traders identify potential support and resistance zones, pinpoint entry opportunities, and increase the probability of successful trades.
This combined strategy enhances your analysis by adding layers of confirmation for trades based on significant market levels and price imbalances. Let me know if you'd like more details or modifications!

Fair Value Gap Oscillator | Flux Charts💎 GENERAL OVERVIEW
Introducing the new Fair Value Gap Oscillator (FVG Oscillator) indicator! This unique indicator identifies and tracks Fair Value Gaps (FVGs) in price action, presenting them in an oscillator format to reveal market momentum based on FVG strength. It highlights bullish and bearish FVGs while enabling traders to adjust detection sensitivity and apply volume and ATR-based filters for more precise setups. For more information about the process, check the "📌 HOW DOES IT WORK" section.
Features of the new FVG Oscillator:
Fully Customizable FVG Detection
An Oscillator Approach To FVGs
Divergence Markers For Potential Reversals
Alerts For Divergence Labels
Customizable Styling
📌 HOW DOES IT WORK?
Fair Value Gaps are price gaps within bars that indicate inefficiencies, often filled as the market retraces. The FVG Oscillator scans historical bars to identify these gaps, then filters them based on ATR or volume. Each FVG is marked as bullish or bearish according to the trend direction that preceded its formation.
An oscillator is calculated using recent FVGs with this formula :
1. The Oscillator starts as 0.
2. When a new FVG Appears, it contributes (FVG Width / ATR) to the oscillator of the corresponding type.
3. Each confirmed bar, the oscillator is recalculated as OSC = OSC * (1 - Decay Coefficient)
The oscillator aggregates and decays past FVGs, allowing recent FVG activity to dominate the signal. This approach emphasizes current market momentum, with oscillations moving bullish or bearish based on FVG intensity. Divergences are marked where FVG oscillations suggest potential reversals. Bullish Divergence conditions are as follows :
1. The current candlestick low must be the lowest of last 25 bars.
2. Net Oscillator (Shown in gray line by default) must be > 0.
3. The current Bullish FVG Oscillator value should be no more than 0.1 below the highest value from the last 25 bars.
Traders can use divergence signals to get an idea of potential reversals, and use the Net FVG Oscillator as a trend following marker.
🚩 UNIQUENESS
The Fair Value Gap Oscillator stands out by converting FVG activity into an oscillator format, providing a momentum-based visualization of FVGs that reveals market sentiment dynamically. Unlike traditional indicators that statically mark FVG zones, the oscillator decays older FVGs over time, showing only the most recent, relevant activity. This approach allows for real-time insight into market conditions and potential reversals based on oscillating FVG strength, making it both intuitive and powerful for momentum trading.
Another unique feature is the combination of customizable ATR and volume filters, letting traders adapt the indicator to match their strategy and market type. You can also set-up alerts for bullish & bearish divergences.
⚙️ SETTINGS
1. General Configuration
Decay Coefficient -> The decay coefficient for oscillators. Increasing this setting will result in oscillators giving the weight to recent FVGs, while decreasing it will distribute the weight equally to the past and recent FVGs.
2. Fair Value Gaps
Zone Invalidation -> Select between Wick & Close price for FVG Zone Invalidation.
Zone Filtering -> With "Average Range" selected, algorithm will find FVG zones in comparison with average range of last bars in the chart. With the "Volume Threshold" option, you may select a Volume Threshold % to spot FVGs with a larger total volume than average.
FVG Detection -> With the "Same Type" option, all 3 bars that formed the FVG should be the same type. (Bullish / Bearish). If the "All" option is selected, bar types may vary between Bullish / Bearish.
Detection Sensitivity -> You may select between Low, Normal or High FVG detection sensitivity. This will essentially determine the size of the spotted FVGs, with lower sensitivies resulting in spotting bigger FVGs, and higher sensitivies resulting in spotting all sizes of FVGs.
3. Style
Divergence Labels On -> You can switch divergence labels to show up on the chart or the oscillator plot.

RunRox - Advanced SMC⭐️ Introducing Our Advanced SMC Indicator: Elevate Your Smart Money Concept Trading
We are excited to present our innovative indicator, specifically designed for the Smart Money Concept (SMC). Our approach goes beyond the traditional SMC strategy by offering significant enhancements that can help you achieve stronger trading performance.
We employ a more sophisticated SMC structure, incorporating improved IDM (Inducement) logic, both internal and external structures, and four types of order blocks. This allows for deeper insights into market trends and a clearer understanding of how major market participants may be manipulating price action.
🟠 Indicator Features:
Structure
HTF Structure – Choose any timeframe and display its structure on your current chart.
CHoCH | BOS | IDM – Display any components from this structure.
Market Minor Structure – Swing and Minor structure.
BOS/CHoCH Breaking by (Body | Wick) – Choose the principle for building the structure, either by the candle body or by their wicks.
BOS/CHoCH Move if Swept – When liquidity is taken, decide whether to move the structure line higher or consider it a structural break.
Move CHoCH/BOS – Relocate key points on the chart if the structure becomes too large.
FVG Concept
HTF FVG – Choose any timeframe from which you want to display FVG on your current chart
Three Types of FVG – Classic FVG, Double FVG, Implied Imbalance
Reaction to FVG – Show the market’s reaction to FVG on the chart
Mitigation Method – Select the fill method that suits your approach (Touch/Midline/Complete)
Remove Filled FVG – Remove FVGs from the chart once they have been filled
Combine FVG – Merge several consecutive FVGs into one
Length FVG – Adjust the number of candles that define the FVG
OrderBlock Concept
HTF OrderBlock – Choose any timeframe from which you want to display orderblocks on your current chart
Swing and Minor Orderblocks – Display only the orderblocks you need, whether from the Swing or Minor structure
Four Types of Order Blocks – Advanced OB, Classic OB, BTS/STB zones, Extremum Candle
Block Based on – Decide whether to base the orderblock on candle highs/lows or candle open/close
Mitigation Method – Define when an orderblock is considered filled (Touch/Midline/Complete)
Remove Blocks Older – Remove older orderblocks from the chart
Hide Overlap – Disable overlapping orderblocks when they appear in the same area
Eat Young Blocks – Reduce the size of an orderblock until it fully forms
Hide Distant Blocks – Remove orderblocks that are too far from the current price
Previous Highs & Lows
Four Level Types – Day, Week, Month, Quarter
Style Customization – Choose line color, line style, and transparency
Fibonacci Retracements
10 Template Options – Ten different bases on which you can build your Fibonacci grid
Up to 7 Levels – Add up to seven Fibonacci levels for your convenience
Fibo Inversion – Option to invert the Fibonacci grid
Style Customization – Choose line colors, line styles, and transparency
Additional Functions
Premium & Discount Zones – A popular concept we’ve incorporated to help identify potential trading areas within premium or discount prices
Equal Highs & Lows – High-liquidity levels where market makers may seek liquidity
Color Candles – Automatically colors candles based on the current trend
Market Structure ZigZag – Offers a clear visual of the zigzag pattern on which the structure is built
Key Point Labels – Displays important swing high/low points directly on the chart
General Styling – Customize any chart element, including size, style, color, and transparency
Alert Customization – Over 16 types of alerts, easily configured in a few clicks. Receive only the notifications you need. Custom alerts are also available for developers.
Next, we will provide a detailed overview of all the indicator’s features, accompanied by chart examples.
📈 Structure
What Is IDM?
IDM, or the Institutional Distribution Model, is an advanced concept within SMC that focuses on how institutional players distribute their positions in the market. By analyzing IDM, traders can better anticipate price movements and potential turning points, thereby gaining a meaningful edge in their trading.
In our structure concept, IDM can form under specific conditions. The market does not always provide a high-liquidity point to work with, so we’ve adopted a flexible approach. We generate IDM when a certain type of liquidity appears during the impulse and BOS break, allowing for a potential future liquidity sweep.
Below, I will provide an example that illustrates when IDM forms as a liquidity magnet within the structure - and when it does not.
As shown in the example above, we focus on the initial impulse after the BOS. If liquidity forms during this impulse - liquidity that needs to be taken out during the structural move - we mark an IDM level as a price magnet. However, if this liquidity does not appear, we do not create an IDM. In that case, the same point might serve as an FVG or play a different role, depending on your trading approach.
This concept makes the structure more flexible and better able to respond immediately to market movements and key structural points.
Above is an example on the chart illustrating what the structure looks like both with and without IDM. As you can see, when the structural move includes pullbacks and consolidation, there is an opportunity to form an IDM as a price magnet. However, if the impulses are strong and lack pullbacks, FVG becomes the only magnet in that move. Depending on the chart, our indicator adapts to the current market conditions and highlights potential liquidity collection points.
📊 Swing and Minor Structure
In the new version of the indicator, the minor structure and the swing structure differ from each other.
Swing structure - In this structure, as mentioned earlier, the IDM concept remains a price magnet and is formed at certain points on the chart if the conditions allow. If these points do not appear, IDM might not form at all.
Minor structure - Here, we have completely removed IDM and only kept BOS and CHoCH for structure formation. We found that for a minor structure, this approach allows faster reactions to trend changes, depending on market movements.
By making these adjustments, we have resolved the main issue of the advanced structure, which was the large distance between BOS and CHoCH that sometimes resulted in a month-long consolidation between these levels. In this version, those problems no longer occur.
If, for some reason, your settings result in a larger swing structure, you can still work with the minor structure using the same POI as in the swing structure. OrderBlock and FVG remain the primary drivers of order flow.
Shown above is a screenshot of the main structure settings you can adjust. These settings are highly flexible and can be tailored to fit a wide range of trading preferences.
⚖️ FVG Concept
A new feature of our indicator is the FVG concept. We automatically detect three types of FVG at the moment, which will be explained below.
FVG - the standard Fair Value Gap
Double FVG - a double FVG, also referred to as BPR (Balanced Price Range)
Implied Imbalance - a type of imbalance that arises from buyer or seller demand
Below, we will look at examples of the FVG types we currently identify.
All price inefficiencies work in real time, immediately appearing on the chart and allowing traders to quickly respond to FVG reactions.
We have also enhanced this concept by displaying FVG reactions on the chart. If an FVG triggers a reaction and the price responds to that range, we highlight it on the chart, so you can recognize the reaction and make timely trading decisions. A screenshot below shows how this looks in practice.
Below is a screenshot illustrating the main settings of this concept, along with detailed descriptions.
📦 OrderBlock Concept
OrderBlocks provide an effective way to identify areas of interest and make informed decisions. We have dedicated significant effort to refining this section’s functionality and have achieved strong results in doing so.
Order Block Types
Advanced OrderBlock – A specialized type of order block generated by our internal algorithm. This can help traders aim for tighter entries and potentially more favorable risk-reward ratios within a narrow price range.
OrderBlock – The classic type, formed at the highs or lows of a structure when a BOS or CHoCH occurs. It can still be an effective entry method but typically spans a wider price range.
Extremum Candle – Based on liquidity grabs. The candle creating this order block must collect liquidity before making an impulsive move that breaks the BOS or CHoCH.
BTS / STB (Buy To Sell / Sell To Buy) – This concept may appear when market makers manipulate price to buy or sell an asset. It often covers a larger price range because it relies on a brief impulsive move to form.
Each type of order block has its own strengths and weaknesses. We provide traders with the flexibility to choose which types suit their trading style and preferences.
Above is an example of how you can apply OrderFlow alongside our structure and orderblocks, which can produce solid results when combined with the Smart Money concept.
In this demonstration, we have highlighted the Advanced Orderblock as an illustration.
Above is a screenshot of all the settings related to this section. They can be customized to suit your specific needs, ensuring you only see what is genuinely relevant on your chart.
📏 Previous Highs and Lows
You can select four levels to display on the chart as some of the most liquid zones:
Daily Highs and Lows
Weekly Highs and Lows
Monthly Highs and Lows
Quarterly Highs and Lows
This feature helps you identify important levels on lower timeframes and focus on these zones for potential trading opportunities. Below is an example of how it appears on the chart.
Below, you can see the settings available in this section.
📐 Fibonacci Levels
Likewise, a new section in our indicator is Fibonacci Levels, a well-known tool recognized as a reliable source of important levels on the chart. We have added this functionality with the option to choose how you want to generate these levels and which specific levels you want to display.
You can plot Fibonacci levels based on the Swing structure, Minor structure, previous or current day, month, and more. In total, there are 10 different options for constructing the Fibonacci grid.
Above, you can see an example of how it appears on the chart, and below you will find the settings available in this section.
🈹 Premium and Discount
Another useful feature for all traders is the Premium and Discount zones based on structure. This makes it easy to identify areas of interest—whether in a discount or premium zone, or in an equilibrium area.
Below, you can also see the settings available in this section.
✅ Additional Function
We have also separated a few functions into their own section:
Color Candles – Colors the candles according to the current trend.
Market Structure ZigZag – Visually highlights the zigzag used to form the structure.
Key Point Labels – Displays the points on the chart from which the structure is built.
Equal Highs & Lows – Identifies equal highs and lows as areas of potential liquidity for larger market players, as price often aims to sweep these zones.
Below are a few screenshots showing how these features appear on the chart.
Color Candles
Market Structure ZigZag and Key Point Labels
Equal Highs & Lows
Below, you can see a screenshot displaying all the settings available in this section.
🎨 General Styling
We have devoted considerable effort to providing flexible customization for each element on the chart, so you can design the exact look you want. That’s why we created an additional section where you can adjust any element’s size, style, and more.
Combined with extensive color and transparency options, this feature provides a flexible appearance for the indicator on any chart.
Below, you can see the settings available in this section
🔔 Alert Customization
You can configure over 16 types of reactions to various events on the chart. Additionally, you can set up alerts to trigger at specific fill levels and explore numerous other alert options, as shown in the screenshot below.
🟠 Usage Examples
We have also prepared several examples of how to use the indicator. These are standard entry models taken from the classic Smart Money concept.
First Example
In the screenshot above, the market displays a downward structure until a manipulation occurs, followed by a CHoCH break. This is a standard entry model featuring an entry at the nearest FVG, a stop-loss placed beyond the manipulation, and a target at the nearest liquidity zone—whether session-based or, as in our case, a gap (one of the FVG types) that price commonly revisits.
This is considered a more aggressive entry because we only waited for a single confirmation of the trend change—the CHoCH break—and then entered immediately afterward. While the WinRate might be lower in such trades, the Risk-Reward ratio is typically very high if you correctly identify the manipulation.
Second Example
This approach is more conservative and less risky, typically offering a higher WinRate but with a lower Risk-Reward ratio.
Here, we use the 4H FVG as our decision point (POI). With the indicator, we plot the 4-hour FVG on our current chart without needing to switch back and forth between timeframes.
Once price reaches our POI, we look for an entry model that includes three confirmations:
First Confirmation – A CHoCH break.
Second Confirmation – A manipulation.
Third Confirmation – A second BOS break.
We wait for all these confirmations before entering the trade, ensuring our stop-loss is well-protected since the remaining liquidity has been swept and the 4-hour FVG has been fully filled.
Our target is the full fill of a higher timeframe FVG or other high-liquidity levels below.
In a conservative setup, it is crucial to allow a complete OrderFlow to develop, including manipulations and clear breaks of lower levels. This approach helps protect the trade and often results in a higher WinRate.
🟠 Disclaimer
Past performance is not indicative of future results. To trade successfully, it is crucial to have a thorough understanding of the market context and the specific situation at hand. Always conduct your own research and analysis before making any trading decisions.
To gain access to the indicator, please review the author's instructions below this post

Quantum Trend FVG System [ReyTradez]1️⃣ INTRODUCTION
The Quantum Trend FVG System provides a complete, structured framework for algorithmic trend detection and Fair Value Gap detection, combining smoothed trend evaluation, multi-layered price-action logic, and ATR-based filtering to deliver clear, data-driven market structure insights for trend-following, swing, and intraday trading.
🔹It combines two powerful techniques:
Trend Detector System: Uses smoothed Moving Averages to identify long-term and short-term market trends, helping traders align their trades with the dominant market direction.
FVG Detector System: Identifies Fair Value Gaps and confirms only meaningful gaps by combining ATR-based filtering with the three same-candle technique, which requires three consecutive same-direction candles to validate each FVG, increasing the probability of high-quality trading opportunities.
The Quantum Trend FVG System is engineered with a clear purpose: to deliver accurate, real-time identification of significant Fair Value Gaps and trend conditions that support advanced price-action and SMC-based analysis. While an FVG or trend signal should not be used in complete isolation, these structural events are essential for understanding market imbalance, liquidity displacement, and potential points of reaction. The system is designed to provide consistent, high-quality detection, giving traders a refined and reliable framework for interpreting market structure and anticipating future movement.
2️⃣ TREND DETECTOR SYSTEM
The Trend Detector uses a dual-SMA engine to determine market direction. A user-friendly slider controls sensitivity to make trends more reactive or smoother.
🔹Features:
Colors candles based on bullish or bearish trend
Fills the background with a smooth gradient between SMAs
Confirms trend direction for breakout and continuation trades
3️⃣ FAIR VALUE GAPS (FVG) DETECTOR SYSTEM
Detects high-quality FVGs validated by three consecutive same-direction candles. Only meaningful gaps are displayed, reducing noise.
🔹Bullish FVG Conditions:
3 consecutive bullish candles
Current low > high of 2 candles ago
Passes ATR-based minimum size filter
🔹Bearish FVG Conditions:
3 consecutive bearish candles
Current high < low of 2 candles ago
Passes ATR-based minimum size filter
🔹ATR-Based Filtering (Integrated in FVGs):
Filters out small or insignificant gaps that may not be tradable
ATR period defines market volatility used for comparison
Minimum FVG size is set relative to ATR to ensure only meaningful gaps are considered
4️⃣ SETTINGS OVERVIEW
🔹Trend Detector Settings:
Enable Trend Detector — toggles the Trend Detector system on or off;
Trend Detector Sensitivity — adjusts the responsiveness of the trend detection (0 = lowest sensitivity, 10 = highest sensitivity).
🔹FVG Detector Settings:
Show FVGs — toggles the display of Fair Value Gaps on the chart;
Extend FVGs — controls how far FVG boxes extend into the future;
Number of historical FVGs — sets the maximum number of FVG boxes to display;
Bullish FVG color — selects the color for bullish FVGs;
Bearish FVG color — selects the color for bearish FVGs.
🔹ATR Filter Settings:
ATR Period — sets the number of bars used to calculate ATR;
Min FVG size factor — defines the minimum FVG size relative to ATR required for validity (e.g., 0.5 means the FVG must be at least 50% of the ATR).
5️⃣ TRADING EXAMPLES
🟢 Long Setup Example
A Bullish Trend + valid Bullish FVG confirmed by strong displacement.
🔴 Short Setup Example
A Bearish Trend + valid Bearish FVG confirmed by strong displacement.
6️⃣ CONCLUSION
The Quantum Trend FVG System is designed to automatically detect significant Fair Value Gaps while analyzing the prevailing market trend through its Trend Detector System. By combining smoothed trend analysis with ATR-filtered FVG Detector System, it highlights high-probability zones where price may react, making it easier for traders to identify structurally important areas without manually tracking them.
🔹Traders can now:
✅ Quickly identify market trends
✅ Spot high-probability Fair Value Gaps
✅ Filter minor gaps using ATR
✅ Visualize trend momentum with gradient fills
✅ Maintain a clean, readable chart with historical FVG limits
⚠️ This indicator is not intended to signal exact entry points or guarantee that an FVG will act as a perfect buying or selling zone; rather, it streamlines the identification process and supports the implementation of systematic, rules-based trading strategies, allowing traders to incorporate trend and FVG analysis into their workflow more efficiently.

Advanced FVG Detector Pro📊 Advanced FVG Detector Pro - Smart Money Analysis Tool
Overview
The Advanced FVG Detector Pro is a sophisticated Pine Script v6 indicator designed to identify and track Fair Value Gaps (FVGs) with institutional-grade precision. This tool goes beyond basic gap detection by incorporating volume analysis, smart money scoring, and adaptive filtering to help traders identify high-probability trading opportunities.
What are Fair Value Gaps?
Fair Value Gaps (FVGs) are price inefficiencies that occur when the market moves so quickly that it leaves behind an imbalance or "gap" in price action. These gaps often act as magnets for future price movement as the market seeks to fill these inefficiencies. Professional traders and institutions closely monitor FVGs as they represent areas of potential support, resistance, and high-probability trade setups.
🎯 Key Features
1. Smart Money Scoring System
Proprietary algorithm that rates each FVG on a 0-100 scale Combines gap size, volume strength, price location, and trend alignment Filter out low-quality setups by setting minimum score thresholdsFocus on institutional-grade opportunities with scores above 70
2. Advanced Volume Validation
Validates FVGs with volume analysis to reduce false signals Only displays gaps formed during significant volume periods Customizable volume multiplier for different market conditions
Visual volume strength indicators on chart
3. Flexible Mitigation Options
Full Fill: Traditional complete gap closure Midpoint Touch: More aggressive entry strategy
Partial Fill: Customizable percentage-based mitigation (10-90%) Choose the strategy that matches your trading style
4. ATR-Based Adaptive Filtering
Automatically adjusts to market volatility using Average True Range Works consistently across any instrument, timeframe, or volatility regime No manual recalibration needed when switching markets Filters out noise while capturing meaningful gaps
5. Real-Time Statistics Dashboard
Live tracking of total active FVGs Bullish vs Bearish gap count Mitigation rate percentage
Average Smart Money Score Toggle on/off based on preference
6. Professional Visual Design
Clean, customizable color schemes Optional midline display for precise entry planning
Labels showing gap type, score, and volume strength Automatic extension of active gaps
Mitigated gaps change color for easy identification
📈 How to Use
For Day Traders:
Use 5-15 minute timeframes
Set ATR Multiplier to 0.15-0.25
Enable volume validation
Focus on FVGs with scores above 65
For Swing Traders:
Use 1H-4H timeframes
Set ATR Multiplier to 0.5-1.0
Use "Midpoint Touch" mitigation
Focus on FVGs with scores above 70
For Position Traders:
Use Daily timeframe
Set ATR Multiplier to 0.75-1.5
Use "Full Fill" mitigation
Focus on FVGs with scores above 75
🔧 Customization Options
Detection Settings:
Minimum FVG size percentage filter
ATR-based size filtering
Maximum number of gaps to display
Smart Money Score minimum threshold
Volume Analysis:
Volume validation toggle
Volume multiplier adjustment
Volume moving average period
Visual volume strength background
Mitigation Control:
Choose mitigation type (Full/Midpoint/Partial)
Set partial fill percentage
Auto-remove mitigated gaps
Control how long mitigated gaps remain visible
Visual Customization:
Bullish/Bearish/Mitigated colors
Show/hide midlines
Show/hide labels
Box extension length
Statistics dashboard toggle
🎓 Trading Strategy Ideas
1. FVG Retest Strategy
Wait for price to create a high-score FVG (70+)
Enter on the first retest of the gap
Place stop loss beyond the gap
Target the opposite side of the gap or next FVG
2. Confluence Trading
Combine FVGs with support/resistance levels
Look for FVGs near key moving averages (20/50 EMA)
Higher probability when FVG aligns with trendlines
Use multiple timeframe analysis
3. Breakout Confirmation
FVGs often form during strong breakouts
High-volume FVGs confirm breakout strength
Enter on mitigation of breakout FVG
Trail stops as new FVGs form in trend direction
⚡ Performance Optimizations
Efficient memory management for smooth chart performance
Optimized calculations run only once per bar
Smart array management prevents memory leaks
Works smoothly even with 100+ active FVGs
🔔 Alert System
Customizable alerts for new bullish FVGs
Customizable alerts for new bearish FVGs
Mitigation alerts for active gaps
Frequency control to avoid alert spam
💡 Pro Tips
Multi-Timeframe Approach: Identify major FVGs on higher timeframes (Daily/4H) and use lower timeframes (15M/5M) for precise entries
Volume Confirmation: The highest probability setups occur when FVGs form with 2x+ average volume
Trend Alignment: Trade FVGs in the direction of the major trend for best results
Patience Pays: Wait for price to return to the FVG rather than chasing breakouts
Risk Management: Always use stop losses beyond the FVG boundaries
📚 Educational Value
This indicator is perfect for:
Learning to identify institutional order flow
Understanding market microstructure
Developing price action trading skills
Recognizing supply and demand imbalances
Improving entry and exit timing
⚠️ Disclaimer
This indicator is a tool for technical analysis and should not be used as the sole basis for trading decisions. Always combine with proper risk management, fundamental analysis, and your own trading plan. Past performance does not guarantee future results.
🔄 Updates & Support
Regular updates will include:
Additional filtering options
Enhanced multi-timeframe analysis
More customization features
Performance improvements
📊 Best Pairs/Markets
Works excellently on:
Forex pairs (EUR/USD, GBP/USD, etc.)
Cryptocurrency (BTC, ETH, etc.)
Stock indices (SPX, NQ, etc.)
Individual stocks
Commodities (Gold, Oil, etc.)
Version Information
Version: 1.0
Pine Script: Version 6
Type: Overlay Indicator
Max Boxes: 500
Max Lines: 500

Momentum-Based Fair Value Gaps [BackQuant]Momentum-Based Fair Value Gaps
A precision tool that detects Fair Value Gaps and color-codes each zone by momentum, so you can quickly tell which imbalances matter, which are likely to fill, and which may power continuation.
What is a Fair Value Gap
A Fair Value Gap is a 3-candle price imbalance that forms when the middle candle expands fast enough that it leaves a void between candle 1 and candle 3.
Bullish FVG : low > high . This marks a bullish imbalance left beneath price.
Bearish FVG : high < low . This marks a bearish imbalance left above price.
These zones often act as magnets for mean reversion or as fuel for trend continuation when price respects the gap boundary and runs.
Why add momentum
Not all gaps are equal. This script measures momentum with RSI on your chosen source and paints each FVG with a momentum heatmap. Strong-momentum gaps are more likely to hold or propel continuation. Weak-momentum gaps are more likely to fill.
Core Features
Auto FVG Detection with size filters in percent of price.
Momentum Heatmap per gap using RSI with smoothing. Multiple palettes: Gradient, Discrete, Simple, and scientific schemes like Viridis, Plasma, Inferno, Magma, Cividis, Turbo, Jet, plus Red-Green and Blue-White-Red.
Bull and Bear Modes with independent toggles.
Extend Until Filled : keep drawing live to the right until price fully fills the gap.
Auto Remove Filled for a clean chart.
Optional Labels showing the smoothed RSI value stored at the gap’s birth.
RSI-based Filters : only accept bullish gaps when RSI is oversold and bearish gaps when RSI is overbought.
Performance Controls : cap how many FVGs to keep on chart.
Alerts : new bullish or bearish FVG, filled FVG, and extreme RSI FVGs.
How it works
Source for Momentum : choose Returns, Close, or Volume.
Returns computes percent change over a short lookback to focus on impulse quality.
RSI and Smoothing : RSI length and a small SMA smooth the signal to stabilize the color coding.
Gap Scan : each bar checks for a 3-candle bullish or bearish imbalance that also clears your minimum size filter in percent of price.
Heatmap Color : the gap is painted at creation with a color from your palette based on the smoothed RSI value, preserving the momentum signature that formed it.
Lifecycle : if Extend Unfilled is on, the zone projects forward until price fully trades through the far edge. If Auto Remove is on, a filled gap is deleted immediately.
How to use it
Scan for structure : turn on both bullish and bearish FVGs. Start with a moderate Min FVG Size percent to reduce noise. You will see stacked clusters in trends and scattered singletons in chop.
Read the colors : brighter or stronger palette values imply stronger momentum at gap formation. Weakly colored gaps are lower conviction.
Decide bias : bullish FVGs below price suggest demand footprints. Bearish FVGs above price suggest supply footprints. Use the heatmap and RSI value to rank importance.
Choose your playbook :
Mean reversion : target partial or full fills of opposing FVGs that were created on weak momentum or that sit against higher timeframe context.
Trend continuation : look for price to respect the near edge of a strong-momentum FVG, then break away in the direction of the original impulse.
Manage risk : in continuation ideas, invalidation often sits beyond the opposite edge of the active FVG. In reversion ideas, invalidation sits beyond the gap that should attract price.
Two trade playbooks
Continuation - Buy the hold of a bullish FVG
Context uptrend.
A bullish FVG prints with strong RSI color.
Price revisits the top of the gap, holds, and rotates up. Enter on hold or first higher low inside or just above the gap.
Invalidation: below the gap bottom. Targets: prior swing, measured move, or next LV area.
Reversion - Fade a weak bearish FVG toward fill
Context range or fading trend.
A bearish FVG prints with weak RSI color near a completed move.
Price fails to accelerate lower and rotates back into the gap.
Enter toward mid-gap with confirmation.
Invalidation: above gap top. Target: opposite edge for a full fill, or the gap midline for partials.
Key settings
Max FVG Display : memory cap to keep charts fast. Try 30 to 60 on intraday.
Min FVG Size % : sets a quality floor. Start near 0.20 to 0.50 on liquid markets.
RSI Length and Smooth : 14 and 3 are balanced. Increase length for higher timeframe stability.
RSI Source :
Returns : most sensitive to true momentum bursts
Close : traditional.
Volume : uses raw volume impulses to judge footprint strength.
Filter by RSI Extremes : tighten rules so only the most stretched gaps print as signals.
Heatmap Style and Palette : pick a palette with good contrast for your background. Gradient for continuous feel, Discrete for quick zoning, Simple for binary, Palette for scientific schemes.
Extend Unfilled - Auto Remove : choose live projection and cleanup behavior to match your workflow.
Reading the chart
Bullish zones sit beneath price. Respect and hold of the upper boundary suggests demand. Strong green or warm palette tones indicate impulse quality.
Bearish zones sit above price. Respect and hold of the lower boundary suggests supply. Strong red or cool palette tones indicate impulse quality.
Stacking : multiple same-direction gaps stacked in a trend create ladders. Ladders often act as stepping stones for continuation.
Overlapping : opposing gaps overlapping in a small region usually mark a battle zone. Expect chop until one side is absorbed.
Workflow tips
Map higher timeframe trend first. Use lower timeframe FVGs for entries aligned with the higher timeframe bias.
Increase Min FVG Size percent and RSI length for noisy symbols.
Use labels when learning to correlate the RSI numbers with your palette colors.
Combine with VWAP or moving averages for confluence at FVG edges.
If you see repeated fills and refills of the same zone, treat that area as fair value and avoid chasing.
Alerts included
New Bullish FVG
New Bearish FVG
Bullish FVG Filled
Bearish FVG Filled
Extreme Oversold FVG - bullish
Extreme Overbought FVG - bearish
Practical defaults
RSI Length 14, Smooth 3, Source Returns.
Min FVG Size 0.25 percent on liquid majors.
Heatmap Style Gradient, Palette Viridis or Turbo for contrast.
Extend Unfilled on, Auto Remove on for a clean live map.
Notes
This tool does not predict the future. It maps imbalances and momentum so you can frame trades with clearer context, cleaner invalidation, and better ranking of which gaps matter. Use it with risk control and in combination with your broader process.

Innotrade FVGThe Innotrade FVG indicator is a professional-grade tool designed to automatically identify, display, and manage Fair Value Gaps (FVGs).
What makes this indicator unique is its full lifecycle management. Unlike basic FVG tools that permanently clutter your chart, our script intelligently tracks an FVG from its creation to its conclusion:
ACTIVE: A new FVG is identified and drawn.
MITIGATED: The FVG changes color the moment price touches it, providing a visual confirmation.
TAKEN: The FVG is automatically removed from the chart once price has passed completely through it, keeping your analysis clean and focused on relevant market data.
This dynamic approach ensures your charts remain clear and that you are always focused on active, relevant imbalances.
█ CORE CONCEPT: WHAT IS A FAIR VALUE GAP (FVG)?
A Fair Value Gap represents a market inefficiency or imbalance. It is a three-candle pattern that occurs when price moves with significant force in one direction, leaving a gap between the first candle's high and the third candle's low (for a bullish FVG) or the first candle's low and the third candle's high (for a bearish FVG).
These gaps often act as a "magnet" for price, meaning the market has a high probability of returning to this area to "rebalance" the price action before continuing its trend.
█ KEY FEATURES
Full FVG Lifecycle Management: Automatically tracks FVGs from Active -> Mitigated -> Taken, keeping your charts pristine.
Robust Multi-Timeframe (MTF) Analysis : Detect FVGs on higher timeframes (e.g., 4H) while viewing a lower timeframe chart (e.g., 15m), allowing for high-precision entries based on key market structure.
Customizable Mitigation Alerts: Create an alert to be notified the moment price enters an FVG, so you never miss a potential trading opportunity.
Clean and Clear Visuals: Fully customizable colors for bullish, bearish, and mitigated FVGs allow you to tailor the indicator to your charting theme.
Efficient and Reliable Code: Built to handle all timeframe contexts correctly, ensuring the indicator is reliable whether you are analyzing the current chart timeframe or a higher one.
█ HOW TO USE THE INDICATOR
The primary function of this indicator is to highlight key areas of interest where price may return.
Bullish FVG (Green Box): This is an area of potential support. Traders often look for price to retrace back down into this box as a potential entry point for a long position.
Bearish FVG (Red Box): This is an area of potential resistance. Traders often look for price to rally back up into this box as a potential entry point for a short position.
Mitigated FVG (Gray Box): This indicates that price has already returned to test the FVG area. The imbalance has been at least partially filled.
Example Strategy:
Set the indicator to find FVGs on the 1-hour timeframe.
Switch to your 5-minute chart for execution.
When a green Bullish FVG appears on your chart (from the 1H timeframe), set an alert for its mitigation.
When the alert triggers, look for a bullish confirmation signal on the 5-minute chart to enter a long trade.
█ SETTINGS EXPLAINED
General Settings
Show FVGs: A master switch to turn the visibility of all FVG drawings on or off.
Timeframe for FVG Detection: Choose the timeframe on which the indicator will look for FVGs. Leave this blank to use your chart's current timeframe.
Enable Alerts on FVG Mitigation: This must be enabled to allow TradingView's alert system to work with this indicator.
Style Settings
Bullish FVG Color: Sets the color for newly formed bullish FVGs.
Bearish FVG Color: Sets the color for newly formed bearish FVGs.
Mitigated FVG Color: Sets the color that an FVG will turn into after being touched by price.
Extend Boxes into the Future: When checked, FVG boxes will continue to extend to the right until they are mitigated or taken.
Label Color / Label Size: Customizes the "FVG" text that appears on newly formed gaps.

ICT FVG & Swing Detector Basic by Trader Riaz//@version=6
indicator("ICT FVG & Swing Detector Basic by Trader Riaz", overlay=true)
// Display toggles for Bullish FVGs
show_bull_fvg = input.bool(true, "Show Bullish FVGs?")
// Input settings for Bullish FVGs
fvg_bull_count = input.int(1, "Number of Bullish FVGs to show", minval=1)
// Color settings for Bullish FVGs
bullish_fvg_color = input.color(color.green, "Bullish FVG Color")
// Bullish FVG Extend Options
bull_fvg_extendGroup = "Bullish FVG Extend Options"
bull_fvg_extendOption = input.string("Default", "Bullish FVG Extend Option", options= , group=bull_fvg_extendGroup)
bull_fvg_extendCandles = input.int(8, "Bullish FVG Extend Candles (Limited Only)", minval=1, maxval=100, step=1, group=bull_fvg_extendGroup)
// Display toggles for Bearish FVGs
show_bear_fvg = input.bool(true, "Show Bearish FVGs?")
// Input settings for Bearish FVGs
fvg_bear_count = input.int(1, "Number of Bearish FVGs to show", minval=1)
// Color settings for Bearish FVGs
bearish_fvg_color = input.color(color.red, "Bearish FVG Color")
// Bearish FVG Extend Options
bear_fvg_extendGroup = "Bearish FVG Extend Options"
bear_fvg_extendOption = input.string("Default", "Bearish FVG Extend Option", options= , group=bear_fvg_extendGroup)
bear_fvg_extendCandles = input.int(8, "Bearish FVG Extend Candles (Limited Only)", minval=1, maxval=100, step=1, group=bear_fvg_extendGroup)
// Display toggles for Swing Highs
show_swing_high = input.bool(true, "Show Swing Highs?")
// Input settings for Swing Highs
swing_high_count = input.int(2, "Number of Swing Highs to show", minval=1)
// Color settings for Swing Highs
swing_high_color = input.color(color.green, "Swing High Line & Label Color")
// Swing High Extend Options
swing_high_extendGroup = "Swing High Extend Options"
swing_high_extendOption = input.string("Default", "Swing High Extend Option", options= , group=swing_high_extendGroup)
swing_high_extendCandles = input.int(8, "Swing High Extend Candles (Limited Only)", minval=1, maxval=100, step=1, group=swing_high_extendGroup)
// Display toggles for Swing Lows
show_swing_low = input.bool(true, "Show Swing Lows?")
// Input settings for Swing Lows
swing_low_count = input.int(2, "Number of Swing Lows to show", minval=1)
// Color settings for Swing Lows
swing_low_color = input.color(color.red, "Swing Low Line & Label Color")
// Swing Low Extend Options
swing_low_extendGroup = "Swing Low Extend Options"
swing_low_extendOption = input.string("Default", "Swing Low Extend Option", options= , group=swing_low_extendGroup)
swing_low_extendCandles = input.int(8, "Swing Low Extend Candles (Limited Only)", minval=1, maxval=100, step=1, group=swing_low_extendGroup)
// Target Settings
showNextTarget = input.bool(true, "Show Next Target")
nextTargetHighColor = input.color(color.red, "Next Target High Color")
nextTargetLowColor = input.color(color.red, "Next Target Low Color")
// === Time Calculation ===
// Calculate one bar duration in milliseconds
barDuration = time - time
// Define reasonable extension period (4 bars into future)
extensionPeriod = barDuration * 4
// Arrays to store values with timestamps
var bull_fvg_data = array.new(0)
var bear_fvg_data = array.new(0)
var swing_high_data = array.new(0)
var swing_low_data = array.new(0)
var bull_fvg_labels = array.new(0)
var bear_fvg_labels = array.new(0)
var swing_high_labels = array.new(0)
var swing_low_labels = array.new(0)
var bull_fvg_midlines = array.new(0)
var bear_fvg_midlines = array.new(0)
var bull_fvg_tops = array.new(0)
var bull_fvg_bottoms = array.new(0)
var bear_fvg_tops = array.new(0)
var bear_fvg_bottoms = array.new(0)
// Get the last bar index
last_bar = last_bar_index + 3
// Function to determine right boundary based on extend option
get_right_boundary(option, extend_candles, default_right) =>
if option == "None"
bar_index - 2
else if option == "Limited"
bar_index - 2 + extend_candles
else
default_right
// Bullish FVG Detection
if high < low and show_bull_fvg
right_bar = get_right_boundary(bull_fvg_extendOption, bull_fvg_extendCandles, last_bar)
new_box = box.new(left=bar_index-2,
top=low,
right=right_bar,
bottom=high ,
bgcolor=color.new(bullish_fvg_color, 90),
border_color=bullish_fvg_color)
bull_mid = (low + high ) / 2
new_midline = line.new(bar_index-2, bull_mid, right_bar, bull_mid,
color=color.new(bullish_fvg_color, 50),
style=line.style_dashed)
new_label = label.new(right_bar-1, bull_mid, "Bullish FVG",
color=color.new(bullish_fvg_color, 100),
textcolor=bullish_fvg_color,
style=label.style_none,
textalign=text.align_right,
size=size.small)
array.unshift(bull_fvg_data, new_box)
array.unshift(bull_fvg_midlines, new_midline)
array.unshift(bull_fvg_labels, new_label)
array.unshift(bull_fvg_tops, low)
array.unshift(bull_fvg_bottoms, high )
if array.size(bull_fvg_data) > fvg_bull_count
box.delete(array.pop(bull_fvg_data))
line.delete(array.pop(bull_fvg_midlines))
label.delete(array.pop(bull_fvg_labels))
array.pop(bull_fvg_tops)
array.pop(bull_fvg_bottoms)
// Bearish FVG Detection
if low > high and show_bear_fvg
right_bar = get_right_boundary(bear_fvg_extendOption, bear_fvg_extendCandles, last_bar)
new_box = box.new(left=bar_index-2,
top=low ,
right=right_bar,
bottom=high,
bgcolor=color.new(bearish_fvg_color, 90),
border_color=bearish_fvg_color)
bear_mid = (low + high) / 2
new_midline = line.new(bar_index-2, bear_mid, right_bar, bear_mid,
color=color.new(bearish_fvg_color, 50),
style=line.style_dashed)
new_label = label.new(right_bar-1, bear_mid, "Bearish FVG",
color=color.new(bearish_fvg_color, 100),
textcolor=bearish_fvg_color,
style=label.style_none,
textalign=text.align_right,
size=size.small)
array.unshift(bear_fvg_data, new_box)
array.unshift(bear_fvg_midlines, new_midline)
array.unshift(bear_fvg_labels, new_label)
array.unshift(bear_fvg_tops, low )
array.unshift(bear_fvg_bottoms, high)
if array.size(bear_fvg_data) > fvg_bear_count
box.delete(array.pop(bear_fvg_data))
line.delete(array.pop(bear_fvg_midlines))
label.delete(array.pop(bear_fvg_labels))
array.pop(bear_fvg_tops)
array.pop(bear_fvg_bottoms)
// Swing High Detection
is_swing_high = high < high and high > high
if is_swing_high and show_swing_high
right_bar = get_right_boundary(swing_high_extendOption, swing_high_extendCandles, last_bar + 3)
new_line = line.new(bar_index - 1, high , right_bar, high ,
color=swing_high_color)
new_label = label.new(right_bar, high , "Swing High",
color=color.new(color.white, 30),
style=label.style_label_left,
textcolor=swing_high_color,
size=size.tiny)
array.unshift(swing_high_data, new_line)
array.unshift(swing_high_labels, new_label)
if array.size(swing_high_data) > swing_high_count
line.delete(array.pop(swing_high_data))
label.delete(array.pop(swing_high_labels))
// Swing Low Detection
is_swing_low = low > low and low < low
if is_swing_low and show_swing_low
right_bar = get_right_boundary(swing_low_extendOption, swing_low_extendCandles, last_bar + 3)
new_line = line.new(bar_index -1, low , right_bar, low ,
color=swing_low_color)
new_label = label.new(right_bar, low , "Swing Low",
color=color.new(color.white, 30),
style=label.style_label_left,
textcolor=swing_low_color,
size=size.tiny)
array.unshift(swing_low_data, new_line)
array.unshift(swing_low_labels, new_label)
if array.size(swing_low_data) > swing_low_count
line.delete(array.pop(swing_low_data))
label.delete(array.pop(swing_low_labels))
// Clean up if toggles are turned off
if not show_bull_fvg and array.size(bull_fvg_data) > 0
for i = 0 to array.size(bull_fvg_data) - 1
box.delete(array.get(bull_fvg_data, i))
line.delete(array.get(bull_fvg_midlines, i))
label.delete(array.get(bull_fvg_labels, i))
array.clear(bull_fvg_data)
array.clear(bull_fvg_midlines)
array.clear(bull_fvg_labels)
array.clear(bull_fvg_tops)
array.clear(bull_fvg_bottoms)
if not show_bear_fvg and array.size(bear_fvg_data) > 0
for i = 0 to array.size(bear_fvg_data) - 1
box.delete(array.get(bear_fvg_data, i))
line.delete(array.get(bear_fvg_midlines, i))
label.delete(array.get(bear_fvg_labels, i))
array.clear(bear_fvg_data)
array.clear(bear_fvg_midlines)
array.clear(bear_fvg_labels)
array.clear(bear_fvg_tops)
array.clear(bear_fvg_bottoms)
// === Swing High/Low Detection ===
var float swingHighs = array.new()
var int swingHighTimes = array.new()
var float swingLows = array.new()
var int swingLowTimes = array.new()
var line swingHighLines = array.new()
var label swingHighLabels = array.new()
var line swingLowLines = array.new()
var label swingLowLabels = array.new()
isSwingHigh = high > high and high > high
isSwingLow = low < low and low < low
if isSwingHigh
array.unshift(swingHighs, high )
array.unshift(swingHighTimes, time )
if isSwingLow
array.unshift(swingLows, low )
array.unshift(swingLowTimes, time )
// === Next Target Detection ===
var line currentTargetLine = na
var label currentTargetLabel = na
if showNextTarget
if not na(currentTargetLine)
line.delete(currentTargetLine)
if not na(currentTargetLabel)
label.delete(currentTargetLabel)
priceRising = close > open
priceFalling = close < open
// Use slightly longer extension for targets
targetExtension = barDuration * 8
if priceRising and array.size(swingHighs) > 0
for i = 0 to array.size(swingHighs) - 1
target = array.get(swingHighs, i)
targetTime = array.get(swingHighTimes, i)
if target > close
currentTargetLine := line.new(
x1=targetTime, y1=target,
x2=time + targetExtension, y2=target,
color=nextTargetHighColor, width=2,
style=line.style_dashed,
xloc=xloc.bar_time)
currentTargetLabel := label.new(
x=time + targetExtension, y=target,
text="Potential Target", size=size.tiny,
style=label.style_label_left,
color=nextTargetHighColor,
textcolor=color.white,
xloc=xloc.bar_time)
break
else if priceFalling and array.size(swingLows) > 0
for i = 0 to array.size(swingLows) - 1
target = array.get(swingLows, i)
targetTime = array.get(swingLowTimes, i)
if target < close
currentTargetLine := line.new(
x1=targetTime, y1=target,
x2=time + targetExtension, y2=target,
color=nextTargetLowColor, width=2,
style=line.style_dashed,
xloc=xloc.bar_time)
currentTargetLabel := label.new(
x=time + targetExtension, y=target,
text="Potential Target", size=size.tiny,
style=label.style_label_left,
color=nextTargetLowColor,
textcolor=color.white,
xloc=xloc.bar_time)
break

MTF Order Block & FVG Finder (Public Ver.)═══════════════════════════════════════════════════════════════
🎯 OVERVIEW
═══════════════════════════════════════════════════════════════
The MTF Order Block & FVG Finder is a comprehensive institutional trading tool that identifies and visualizes Order Blocks (OB) and Fair Value Gaps (FVG) across multiple timeframes. This indicator helps traders spot key support and resistance zones where institutional players have placed significant orders.
═══════════════════════════════════════════════════════════════
✨ KEY FEATURES
═══════════════════════════════════════════════════════════════
📊 ORDER BLOCK DETECTION
• Multi-Timeframe Analysis: Monitor up to 3 different timeframes simultaneously
• Smart Engulfing Detection: Identifies bullish and bearish order blocks using engulfing patterns
• ATR-Based Filtering: Filter out insignificant order blocks using customizable ATR multiplier
• Dynamic Extension: Option to extend order blocks to the right edge of the chart
• Visual Differentiation: Distinct colors and transparency levels for each timeframe
• Auto-Invalidation: Order blocks automatically disappear when price closes beyond them
🔲 FAIR VALUE GAP (FVG) DETECTION
• 12 Timeframe Support: From 1-minute to weekly charts (1, 3, 5, 15, 30, 45, 60, 120, 180, 240, D, W)
• Dynamic Level Adjustment: FVG levels automatically update when price touches the gap
• Color Change System: Visual indication when FVG zones are tested by price
• Customizable Display: Full control over extension, labels, colors, and sizes
• Smart Management: FVGs are removed when fully filled by price action
🔔 ADVANCED ALERT SYSTEM
• Price Touch Alerts: Get notified when price reaches order block zones
• Separate Controls: Enable/disable alerts for bullish and bearish order blocks independently
• Tolerance Settings: Adjust alert sensitivity with percentage-based tolerance (0-1%)
• Detailed Messages: Alerts include current price, block range, and timeframe information
• Smart Triggering: Prevents duplicate alerts on the same bar
═══════════════════════════════════════════════════════════════
⚙️ SETTINGS GUIDE
═══════════════════════════════════════════════════════════════
🎨 ORDER BLOCK SETTINGS
• Primary Timeframe: Main timeframe for order block detection (default: current chart)
• Secondary Timeframe: Optional second timeframe with toggle on/off
• Tertiary Timeframe: Optional third timeframe with toggle on/off
• Extend to Right: Automatically extend order blocks to current price bar
• Filter Small Blocks: Enable ATR-based filtering to focus on significant levels
• ATR Period: Lookback period for ATR calculation (default: 100)
• Minimum OB Size: Threshold as multiple of ATR (default: 0.3× ATR)
📐 FVG SETTINGS
• Move Levels on Touch: Dynamically adjust FVG boundaries when price interacts
• Change Color on Touch: Visual feedback showing tested vs untested FVGs
• Extend to Right: Extend FVG boxes to current price bar
• Plot Labels: Display timeframe labels on FVG boxes
• Custom Colors: Separate colors for bullish, bearish, and tested FVGs
• Timeframe Selection: Choose which timeframes to display FVGs
🔔 ALERT SETTINGS
• Enable Price Touch Alerts: Master switch for all alerts
• Bullish OB Alerts: Notifications when price touches bullish order blocks
• Bearish OB Alerts: Notifications when price touches bearish order blocks
• Alert Tolerance: Fine-tune sensitivity (default: 0.1%)
═══════════════════════════════════════════════════════════════
🔍 HOW IT WORKS
═══════════════════════════════════════════════════════════════
📌 ORDER BLOCK LOGIC
An order block forms when a strong directional candle engulfs the previous candle:
BULLISH ORDER BLOCK:
✓ Current candle closes above its open (bullish candle)
✓ Previous candle closed below its open (bearish candle)
✓ Current candle's close is above previous candle's open
✓ Current candle's open is below previous candle's close
→ The previous bearish candle's body becomes the bullish order block
BEARISH ORDER BLOCK:
✓ Current candle closes below its open (bearish candle)
✓ Previous candle closed above its open (bullish candle)
✓ Current candle's close is below previous candle's open
✓ Current candle's open is above previous candle's close
→ The previous bullish candle's body becomes the bearish order block
INVALIDATION:
• Bullish OB: Invalidated when price closes below the block's low
• Bearish OB: Invalidated when price closes above the block's high
📌 FAIR VALUE GAP LOGIC
FVGs represent areas where price moved rapidly with minimal trading activity:
BULLISH FVG (Gap Up):
• Low of current candle > High of candle
• Creates unfilled space between these two candles
• Acts as potential support zone
BEARISH FVG (Gap Down):
• High of current candle < Low of candle
• Creates unfilled space between these two candles
• Acts as potential resistance zone
FVG MANAGEMENT:
• Gaps are "filled" when price fully retraces through them
• Optional: Adjust levels when partially filled
• Optional: Change color to show tested zones
═══════════════════════════════════════════════════════════════
💡 TRADING APPLICATIONS
═══════════════════════════════════════════════════════════════
📈 ENTRY STRATEGIES
• Use order blocks as high-probability entry zones
• Wait for price to return to OB/FVG before entering
• Combine with higher timeframe trend direction
• Look for confluence between OBs and FVGs
🛡️ RISK MANAGEMENT
• Place stop losses beyond order block boundaries
• Use multiple timeframe OBs for layered stop placement
• Smaller OBs (filtered by ATR) = tighter stops
• Larger OBs = more significant levels
🎯 TARGET SETTING
• Next order block or FVG as initial target
• Multiple timeframe analysis for swing targets
• Use FVG fills as profit-taking zones
• Higher timeframe OBs as major targets
✅ CONFIRMATION TECHNIQUES
• Wait for price reaction at order block levels
• Look for reversal candlestick patterns
• Combine with volume analysis
• Use lower timeframe for precise entries
═══════════════════════════════════════════════════════════════
🎓 BEST PRACTICES
═══════════════════════════════════════════════════════════════
1️⃣ START WITH HIGHER TIMEFRAMES
• Focus on 4H, Daily, or Weekly order blocks first
• These represent stronger institutional levels
• Use lower timeframes for entry refinement
2️⃣ USE ATR FILTER WISELY
• Enable filtering to reduce noise
• Adjust multiplier based on market volatility
• Higher volatility = higher multiplier needed
3️⃣ COMBINE MULTIPLE TIMEFRAMES
• Look for confluence zones (multiple OBs/FVGs aligning)
• Higher timeframe OB + lower timeframe FVG = strong zone
• Three timeframe alignment = highest probability setups
4️⃣ ALERT MANAGEMENT
• Enable alerts for hands-free monitoring
• Set appropriate tolerance based on asset volatility
• Crypto: 0.1-0.3% | Forex: 0.05-0.1% | Stocks: 0.1-0.2%
5️⃣ UNDERSTAND MARKET CONTEXT
• OBs work best in trending markets
• FVGs are powerful in range-bound conditions
• Always consider overall market structure
═══════════════════════════════════════════════════════════════
📊 TECHNICAL SPECIFICATIONS
═══════════════════════════════════════════════════════════════
• Pine Script™ Version: 6
• Indicator Type: Overlay
• Maximum Boxes: 500
• Maximum Labels: 500
• Dynamic Requests: Enabled
• License: Mozilla Public License 2.0
═══════════════════════════════════════════════════════════════
🎨 VISUAL CUSTOMIZATION
═══════════════════════════════════════════════════════════════
COLOR CODING:
• Primary TF: Darker/More opaque (70% transparency)
• Secondary TF: Medium opacity (80% transparency)
• Tertiary TF: Lighter/More transparent (90% transparency)
• Green: Bullish order blocks
• Red: Bearish order blocks
• Gray: Tested FVGs
LABEL SYSTEM:
• Timeframe labels clearly identify each OB/FVG
• Centered placement for easy identification
• Customizable label size and color
• Optional hide/show functionality
═══════════════════════════════════════════════════════════════
⚠️ IMPORTANT NOTES
═══════════════════════════════════════════════════════════════
• This indicator is for educational purposes only
• Not financial advice - always do your own research
• Past performance does not guarantee future results
• Practice proper risk management in all trades
• Combine with other analysis tools for best results
• Test settings on your preferred assets and timeframes

Smart Money Flow Index (SMFI) - Advanced SMC [PhenLabs]📊Smart Money Flow Index (SMFI)
Version: PineScript™v6
📌Description
The Smart Money Flow Index (SMFI) is an advanced Smart Money Concepts implementation that tracks institutional trading behavior through multi-dimensional analysis. This comprehensive indicator combines volume-validated Order Block detection, Fair Value Gap identification with auto-mitigation tracking, dynamic Liquidity Zone mapping, and Break of Structure/Change of Character detection into a unified system.
Unlike basic SMC indicators, SMFI employs a proprietary scoring algorithm that weighs five critical factors: Order Block strength (validated by volume), Fair Value Gap size and recency, proximity to Liquidity Zones, market structure alignment (BOS/CHoCH), and multi-timeframe confluence. This produces a Smart Money Score (0-100) where readings above 70 represent optimal institutional setup conditions.
🚀Points of Innovation
Volume-Validated Order Block Detection – Only displays Order Blocks when formation candle exceeds customizable volume multiplier (default 1.5x average), filtering weak zones and highlighting true institutional accumulation/distribution
Auto-Mitigation Tracking System – Fair Value Gaps and Order Blocks automatically update status when price mitigates them, with visual distinction between active and filled zones preventing trades on dead levels
Proprietary Smart Money Score Algorithm – Combines weighted factors (OB strength 25%, FVG proximity 20%, Liquidity 20%, Structure 20%, MTF 15%) into single 0-100 confidence rating updating in real-time
ATR-Based Adaptive Calculations – All distance measurements use 14-period Average True Range ensuring consistent function across any instrument, timeframe, or volatility regime without manual recalibration
Dynamic Age Filtering – Automatically removes liquidity levels and FVGs older than configurable thresholds preventing chart clutter while maintaining relevant levels
Multi-Timeframe Confluence Integration – Analyzes higher timeframe bias with customizable multipliers (2-10x) and incorporates HTF trend direction into Smart Money Score for institutional alignment
🔧Core Components
Order Block Engine – Detects institutional supply/demand zones using characteristic patterns (down-move-then-strong-up for bullish, up-move-then-strong-down for bearish) with minimum volume threshold validation, tracks mitigation when price closes through zones
Fair Value Gap Scanner – Identifies price imbalances where current candle's low/high leaves gap with two-candle-prior high/low, filters by minimum size percentage, monitors 50% fill for mitigation status
Liquidity Zone Mapper – Uses pivot high/low detection with configurable lookback to mark swing points where stop losses cluster, extends horizontal lines to visualize sweep targets, manages lifecycle through age-based removal
Market Structure Analyzer – Tracks pivot progression to identify trend through higher-highs/higher-lows (bullish) or lower-highs/lower-lows (bearish), detects Break of Structure and Change of Character for trend/reversal confirmation
Scoring Calculation Engine – Evaluates proximity to nearest Order Blocks using ATR-normalized distance, assesses FVG recency and distance, calculates liquidity proximity with age weighting, combines structure bias and MTF trend into smoothed final score
🔥Key Features
Customizable Display Limits – Control maximum Order Blocks (1-10), Liquidity Zones (1-10), and FVG age (10-200 bars) to maintain clean charts focused on most relevant institutional levels
Gradient Strength Visualization – All zones render with transparency-adjustable coloring where stronger/newer zones appear more solid and weaker/older zones fade progressively providing instant visual hierarchy
Educational Label System – Optional labels identify each zone type (Bullish OB, Bearish OB, Bullish FVG, Bearish FVG, BOS) with color-coded text helping traders learn SMC concepts through practical application
Real-Time Smart Money Score Dashboard – Top-right table displays current score (0-100) with color coding (green >70, yellow 30-70, red <30) plus trend arrow for at-a-glance confidence assessment
Comprehensive Alert Suite – Configurable notifications for Order Block formation, Fair Value Gap detection, Break of Structure events, Change of Character signals, and high Smart Money Score readings (>70)
Buy/Sell Signal Integration – Automatically plots triangle markers when Smart Money Score exceeds 70 with aligned market structure and fresh Order Block detection providing clear entry signals
🎨Visualization
Order Block Boxes – Shaded rectangles extend from formation bar spanning high-to-low of institutional candle, bullish zones in green, bearish in red, with customizable transparency (80-98%)
Fair Value Gap Zones – Rectangular areas marking imbalances, active FVGs display in bright colors with adjustable transparency, mitigated FVGs switch to gray preventing trades on filled zones
Liquidity Level Lines – Dashed horizontal lines extend from pivot creation points, swing highs in bearish color (short targets above), swing lows in bullish color (long targets below), opacity decreases with age
Structure Labels – "BOS" labels appear above/below price when Break of Structure confirmed, colored by direction (green bullish, red bearish), positioned at 1% beyond highs/lows for visibility
Educational Info Panel – Bottom-right table explains key terminology (OB, FVG, BOS, CHoCH) and score interpretation (>70 high probability) with semi-transparent background for readability
📖Usage Guidelines
General Settings
Show Order Blocks – Default: On, toggles visibility of institutional supply/demand zones, disable when focusing solely on FVGs or Liquidity
Show Fair Value Gaps – Default: On, controls FVG zone display including active and mitigated imbalances
Show Liquidity Zones – Default: On, manages liquidity line visibility, disable on lower timeframes to reduce clutter
Show Market Structure – Default: On, toggles BOS/CHoCH label display
Show Smart Money Score – Default: On, controls score dashboard visibility
Order Block Settings
OB Lookback Period – Default: 20, Range: 5-100, controls bars scanned for Order Block patterns, lower values detect recent activity, higher values find older blocks
Min Volume Multiplier – Default: 1.5, Range: 1.0-5.0, sets minimum volume threshold as multiple of 20-period average, higher values (2.0+) filter for strongest institutional candles
Max Order Blocks to Display – Default: 3, Range: 1-10, limits simultaneous Order Blocks shown, lower settings (1-3) maintain focus on most recent zones
Fair Value Gap Settings
Min FVG Size (%) – Default: 0.3, Range: 0.1-2.0, defines minimum gap size as percentage of close price, lower values detect micro-imbalances, higher values focus on significant gaps
Max FVG Age (bars) – Default: 50, Range: 10-200, removes FVGs older than specified bars, lower settings (10-30) for scalping, higher (100-200) for swing trading
Show FVG Mitigation – Default: On, displays filled FVGs in gray providing visual history, disable to show only active untouched imbalances
Liquidity Zone Settings
Liquidity Lookback – Default: 50, Range: 20-200, sets pivot detection period for swing highs/lows, lower values (20-50) mark shorter-term liquidity, higher (100-200) identify major swings
Max Liquidity Age (bars) – Default: 100, Range: 20-500, removes liquidity lines older than specified bars, adjust based on timeframe
Liquidity Sensitivity – Default: 0.5, Range: 0.1-1.0, controls pivot detection sensitivity, lower values mark only major swings, higher values identify minor swings
Max Liquidity Zones to Display – Default: 3, Range: 1-10, limits total liquidity levels shown maintaining chart clarity
Market Structure Settings
Pivot Length – Default: 5, Range: 3-15, defines bars to left/right for pivot validation, lower values (3-5) create sensitive structure breaks, higher (10-15) filter for major shifts
Min Structure Move (%) – Default: 1.0, Range: 0.1-5.0, sets minimum percentage move required between pivots to confirm structure change
Multi-Timeframe Settings
Enable MTF Analysis – Default: On, activates higher timeframe trend analysis incorporation into Smart Money Score
Higher Timeframe Multiplier – Default: 4, Range: 2-10, multiplies current timeframe to determine analysis timeframe (4x on 15min = 1hour)
Visual Settings
Bullish Color – Default: Green (#089981), sets color for bullish Order Blocks, FVGs, and structure elements
Bearish Color – Default: Red (#f23645), defines color for bearish elements
Neutral Color – Default: Gray (#787b86), controls color of mitigated zones and neutral elements
Show Educational Labels – Default: On, displays text labels on zones identifying type (OB, FVG, BOS), disable once familiar with patterns
Order Block Transparency – Default: 92, Range: 80-98, controls Order Block box transparency
FVG Transparency – Default: 92, Range: 80-98, sets Fair Value Gap zone transparency independently from Order Blocks
Alert Settings
Alert on Order Block Formation – Default: On, triggers notification when new volume-validated Order Block detected
Alert on FVG Formation – Default: On, sends alert when Fair Value Gap appears enabling quick response to imbalances
Alert on Break of Structure – Default: On, notifies when BOS or CHoCH confirmed
Alert on High Smart Money Score – Default: On, alerts when Smart Money Score crosses above 70 threshold indicating high-probability setup
✅Best Use Cases
Order Block Retest Entries – After Break of Structure, wait for price retrace into fresh bullish Order Block with Smart Money Score >70, enter long on zone reaction targeting next liquidity level
Fair Value Gap Retracement Trading – When price creates FVG during strong move then retraces, enter as price approaches unfilled gap expecting institutional orders to continue trend
Liquidity Sweep Reversals – Monitor price approaching swing high/low liquidity zones against prevailing Smart Money Score trend, after stop hunt sweep watch for rejection into premium Order Block/FVG
Multi-Timeframe Confluence Setups – Identify alignment when current timeframe Order Block coincides with higher timeframe FVG plus MTF analysis showing matching trend bias
Break of Structure Continuations – After BOS confirms trend direction, trade pullbacks to nearest Order Block or FVG in direction of structure break using Smart Money Score >70 as entry filter
Change of Character Reversal Plays – When CHoCH detected indicating potential reversal, look for Smart Money Score pivot with opposing Order Block formation then enter on structure confirmation
⚠️Limitations
Lagging Pivot Calculations – Pivot-based features (Liquidity Zones, Market Structure) require bars to right of pivot for confirmation, meaning these elements identify levels retrospectively with delay equal to lookback period
Whipsaw in Ranging Markets – During choppy conditions, Order Blocks fail frequently and structure breaks produce false signals as Smart Money Score fluctuates without clear institutional bias, best used in trending markets
Volume Data Dependency – Order Block volume validation requires accurate volume data which may be incomplete on Forex pairs or limited in crypto exchange feeds
Subjectivity in Scoring Weights – Proprietary 25-20-20-20-15 weighting reflects general institutional behavior but may not optimize for specific instruments or market regimes, user cannot adjust factor weights
Visual Complexity on Lower Timeframes – Sub-hour timeframes generate excessive zones creating cluttered charts, requires aggressive display limit reduction and higher minimum thresholds
No Fundamental Integration – Indicator analyzes purely technical price action and volume without incorporating economic events, news catalysts, or fundamental shifts that override technical levels
💡What Makes This Unique
Unified SMC Ecosystem – Unlike indicators displaying Order Blocks OR FVGs OR Liquidity separately, SMFI combines all three institutional concepts plus market structure into single cohesive system
Proprietary Confidence Scoring – Rather than manual setup assessment, automated Smart Money Score quantifies probability by weighting five institutional dimensions into actionable 0-100 rating
Volume-Filtered Quality – Eliminates weak Order Blocks forming without institutional volume confirmation, ensuring displayed zones represent genuine accumulation/distribution
Adaptive Lifecycle Management – Automatically updates mitigation status and removes aged zones preventing trades on dead levels through continuous validity and age monitoring
Educational Integration – Built-in tooltips, labeled zones, and reference panel make indicator functional for both learning Smart Money Concepts and executing strategies
🔬How It Works
Order Block Detection – Scans for patterns where strong directional move follows counter-move creating last down-candle before rally (bullish OB) or last up-candle before sell-off (bearish OB), validates formations only when candle exhibits volume exceeding configurable multiple (default 1.5x) of 20-bar average volume
Fair Value Gap Identification – Compares current candle’s high/low against two-candles-prior low/high to detect price imbalances, calculates gap size as percentage of close and filters micro-gaps below minimum threshold (default 0.3%), monitors whether subsequent price fills 50% triggering mitigation status
Liquidity Zone Mapping – Employs pivot detection using configurable lookback (default 50 bars) to identify swing highs/lows where retail stops cluster, extends horizontal reference lines from pivot creation and applies age-based filtering to remove stale zones
Market Structure Analysis – Tracks pivot progression using structure-specific lookback (default 5 bars) to determine trend, confirms uptrend when new pivot high exceeds previous by minimum move percentage, detects Break of Structure when price breaks recent pivot level, flags Change of Character for potential reversals
Multi-Timeframe Confluence – When enabled, requests security data from higher timeframe (current TF × HTF multiplier, default 4x), compares HTF close against HTF 20-period MA to determine bias, contributes ±50 points to score ensuring alignment with institutional positioning on superior timeframe
Smart Money Score Calculation – Evaluates Order Block component via ATR-normalized distance producing max 100-point contribution weighted at 25%, assesses FVG factor through age penalty and distance at 20% weight, calculates Liquidity proximity at 20%, incorporates structure bias (±50-100 points) at 20%, adds MTF component at 15%, applies 3-period smoothing to reduce volatility
Visual Rendering and Lifecycle – Draws Order Block boxes, Fair Value Gap rectangles with color coding (green/red active, gray mitigated), extends liquidity dashed lines with fade-by-age opacity, plots BOS labels, displays Smart Money Score dashboard, continuously updates checking mitigation conditions and removing elements exceeding age/display limits
💡Note:
The Smart Money Flow Index combines multiple Smart Money Concepts into unified institutional order flow analysis. For optimal results, use the Smart Money Score as confluence filter rather than standalone entry signal – scores above 70 indicate high-probability setups but should be combined with risk management, higher timeframe bias, and market regime understanding.

10x HTF Candles Dynamic with LTF FVG and Key LevelsPurpose
The 10x HTF Candles Dynamic Pine Script is a versatile, all-in-one trading tool designed for TradingView to empower traders with actionable insights across multiple timeframes. It combines advanced price action analysis, Fair Value Gap (FVG) detection, market structure evaluation, and key level visualization into a single, highly customizable interface. Built for day traders, swing traders, and scalpers, this script enhances decision-making by providing a clear, multi-dimensional view of market dynamics, liquidity zones, and trend biases. Its purpose is to streamline technical analysis, reduce chart clutter, and deliver real-time, visually intuitive data to support precise trading strategies.
What the Script Does
How the Script Works:
The script leverages Pine Script v5’s advanced features to deliver a robust and efficient trading tool. Below is a step-by-step explanation of its functionality:
1. Initialization and Configuration:
- Initializes with @version=5, enabling dynamic requests, and sets limits for bars (500), lines, labels, boxes, and polylines to manage resources.
- Defines user inputs for candle settings, timeframe selection, FVG parameters, DWM levels, market structure table, and visual preferences.
- Dynamically calculates 10 higher timeframes based on the current chart timeframe (e.g., 1m chart → 5m, 15m, 60m, etc.) or allows custom timeframes.
2. Data Acquisition:
- Fetches OHLC data for up to 10 timeframes using request.security, storing it in optimized TfData objects (arrays for open, high, low, close).
- Loops through enabled timeframes to minimize redundant code, improving processing speed.
3. Candlestick Rendering:
- Draws HTF candlesticks at user-defined offsets, with customizable bullish/bearish colors, wick colors, and widths.
- Calculates bar types (Inside, Normal, Outside) and optionally labels them above candles for pattern analysis.
4. FVG Detection and Visualization:
- Scans for FVGs by comparing candle highs and lows across three bars (e.g., low of candle 1 > high of candle 3 for bullish FVG).
- Detects IFVGs based on user-selected methods (wick, close, or midpoint) and highlights them with distinct colors.
- Draws FVG boxes with configurable borders, midpoint lines, and labels, tracking mitigation status.
- Limits FVG display to a user-defined maximum (1–200) to maintain chart clarity.
5. Horizontal Levels and DWM Lines:
- Computes Highs, Lows, Midpoints, and Quarter Points for each timeframe, drawing lines with customizable styles and extensions.
- Plots DWM open, close, high, low, and control point lines, with optional alerts for high/low breaks.
- Supports session-based opening price lines (e.g., 09:30 Market Open) with similar customization.
6. Market Structure and Bias:
Calculates trend bias by comparing the current close to the midpoint of the timeframe’s range (highest high to lowest low).
Updates a market structure table with timeframe, bias, and premium/discount status, using color-coded cells for quick interpretation.
7. Countdown Timers:
- Converts timeframe strings to seconds and calculates the time remaining until the next candle using timenow.
- Renders countdown labels with timeframe names (e.g., “1h\n(00:45)”) at user-defined positions.
8. Optimization and Cleanup:
- Uses VisualElements UDTs to manage lines, wicks, and labels, reducing memory usage.
- Deletes outdated drawings when limits are exceeded, ensuring a clean and responsive chart.
- Employs loops and arrays to streamline repetitive tasks, enhancing performance.
How to Use the Script:
This script is user-friendly yet powerful, suitable for traders of all experience levels. Follow these steps to maximize its potential:
1. Add to TradingView:
- Copy the script into TradingView’s Pine Editor.
- Click “Add to Chart” to apply it to your active chart.
2. Customize Settings:
- Candle Settings: Adjust the number of candles (1–10), starting position, group spacing, bullish/bearish colors, wick colors, and candle width.
- Timeframe Settings: Enable/disable up to 10 timeframes, choosing dynamic (auto-selected) or custom timeframes (e.g., 3m, 60m, D).
- FVG Settings: Toggle FVG detection, set detection methods (wick/close/midpoint), adjust thresholds, and customize colors, borders, and midpoint lines.
- DWM Settings: Enable daily/weekly/monthly lines (open, close, high, low, midpoint), set colors, and configure alerts for high/low breaks.
- Market Structure Table: Show/hide columns for timeframe, trend bias, and premium/discount, and adjust table position (top-left, bottom-right, etc.).
- Countdown Timers: Enable timers, adjust offsets, and customize text/background colors.
- Label Settings: Configure price label precision, transparency, and offsets for clarity.
3.Interpret Visuals:
- Candlesticks: Analyze HTF candles to gauge trend direction and momentum across timeframes.
- FVGs: Look for unmitigated FVGs (colored boxes) as potential support/resistance zones or trade setups.
- Key Levels: Use Highs, Lows, Midpoints, and Quarter Points to identify breakout or reversal areas.
4. Market Structure Table: Check trend bias and premium/discount status to align trades with market conditions.
- DWM Lines: Monitor daily/weekly/monthly levels for institutional reference points.
- Countdown Timers: Time entries/exits based on upcoming candle formations.
5. Integrate with Strategy:
- Combine script insights with your trading plan (e.g., use FVGs for entries, key levels for stops/targets).
- Set alerts for high/low breaks or liquidity zone approaches to stay proactive.
- Export table data or screenshot visuals for documentation and analysis.
6. Optimize Performance:
Limit the number of candles, FVGs, and lines to match your device’s capabilities.
Regularly review settings to focus on the most relevant timeframes and features.
Why the Script is Original
The 10x HTF Candles Dynamic script stands out in the TradingView community due to its innovative design, comprehensive functionality, and trader-centric approach. Here’s what makes it unique:
1. Seamless Multi-Timeframe Integration:
- Unlike single-timeframe indicators, this script synthesizes data from up to 10 timeframes, offering a holistic view of market structure.
- Dynamic timeframe selection adapts to the chart’s timeframe, ensuring relevance across all trading styles.
2 . Advanced FVG and IFVG Detection:
- Provides granular control over FVG detection with three IFVG methods (wick, close, midpoint), a rarity in most scripts.
- Tracks mitigation status and highlights unmitigated FVGs, enabling traders to capitalize on high-probability setups.
- Visualizes FVGs with boxes, midpoint lines, and labels, enhancing clarity and usability.
3. Sophisticated Market Structure Analysis:
-The bias calculation, introduced in recent updates (2 days ago), uses a robust algorithm to assess trend direction based on range midpoints.
- The market structure table, with premium/discount zones (added 20 hours ago), offers a unique summary of market conditions, unmatched by standard indicators.
4. Comprehensive DWM and Session Support:
- Integrates daily, weekly, and monthly levels alongside session-based opening prices, catering to institutional and retail traders alike.
- Customizable alerts for high/low breaks add actionable functionality.
5. Visual Hierarchy and Clarity:
- Scales line widths and transparency by timeframe, prioritizing higher timeframes for strategic focus.
- Countdown timers provide real-time context, a feature rarely seen in multi-timeframe scripts.
6.Performance Optimization:
- Recent updates introduced loops and UDTs to reduce code redundancy and boost processing speed.
- Automated cleanup mechanisms prevent chart clutter, ensuring smooth operation even on low-resource devices.
7. High Customizability:
- Offers extensive settings for visuals, timeframes, FVGs, DWM lines, and alerts, accommodating diverse trading preferences.
- Balances complexity with accessibility, making it approachable for beginners and powerful for advanced users.
8.Continuous Evolution:
- Regular updates (e.g., bias filter table, premium/discount feature, code optimization) demonstrate ongoing commitment to improvement.
- Closed-source protection (noted 20 hours ago) ensures intellectual integrity while allowing free use, fostering trust in the TradingView community.
Conclusion
The 10x HTF Candles Dynamic Pine Script is a groundbreaking tool that redefines multi-timeframe analysis on TradingView. By combining candlestick visualization, FVG detection, market structure insights, DWM levels, and countdown timers, it provides traders with a comprehensive, real-time view of market dynamics. Its advanced optimization, customization options, and continuous updates make it a standout choice for traders seeking precision, clarity, and efficiency. Whether you’re scalping intraday moves or swing trading weekly trends, this script equips you with the tools to master the markets with confidence.

Internal BOS X FVG Algorithms - 1 Visi TraderInternal BOS X FVG Algorithms,
This strategy is based on 2 momentum combinations:
• Internal Break of Structure was formed together with Fair Value Gap (FVG)
Formula of Internal BOS X FVG Algorithms:
1. Break (Internal BOS) X Bullish FVG = Zone for BUY Setup
2. Break (Internal BOS) X Bearish FVG = Zone for SELL Setup
// ----------- Add-ons Setting ----------- //
Setting for Internal BOS X FVG Algorithms:
---------
#1: Internal Break of Structure Settings,
• Internal Swing:
The number of left and right Swing Intervals that are checked when searching for Swing Points. More Values = Less Swing Points plotted to be potential Internal BOS and Less Values = More Swing Points plotted to be potential Internal BOS.
• Internal BOS Color:
You can change the color of dotted line and text for Internal BOS ("Break") according to your favorites layout.
#2: Fair Value Gap Settings,
• FVG Min. Range (In Pips):
Input minimum range of Fair Value Gap in Pips, more value = less zone results.
• FVG Max. Range (In Pips):
Input maximum range of Fair Value Gap in Pips, less value = less zone results.
• Extended Right - FVG:
You can change the value of extended fair value gap zone according to your best preferences.
#3: FVG Color Settings,
• Bullish FVG:
Change color FVG for Bullish Fair Value Gap Zone.
• Bearish FVG:
Change color FVG for Bearish Fair Value Gap Zone.
#4: Mode FVG,
• FVG Variations:
- Global FVG = All Variations of Fair Value Gap Category
- Specific FVG = Variation based on last of 2 FVG's Candles in same color
#5: Trading Session,
• Session Hours:
You can adjust the trading hour according to the best session and volatility of pair assets that you want to trades.
---------
How to Entry (Instructions):
1. Buy Positions = Internal BOS ("Break") form together with Bullish FVG, wait for pullback on FVG Zone and then you can open positions. Set Stop Loss (SL) below FVG Zone and set Take Profit (TP) in minimum 1:2 RR - if price hit 1:1 RR you can set Breakeven for managing the trading risk.
2. Sell Positions = Internal BOS ("Break") form together with Bearish FVG, wait for pullback on FVG Zone and then you can open positions. Set Stop Loss (SL) above FVG Zone and set Take Profit (TP) in minimum 1:2 RR - if price hit 1:1 RR you can set Breakeven for managing the trading risk.
*Notes:
The best pair asset for this strategy is on Gold (XAU/USD) at NY Sessions (19.00 - 22.00 GMT+7) - Timeframe M1 (1 Minute).
--------
Best Regards,
- 1 VISI TRADER
Trading for Prosperity!
--------
DISCLAIMER: No reselling or any other forms of use are authorized for our documents, script / strategy, and the information published with them. This informational planning script / strategy is strictly for individual use and educational purposes only. This is not financial or investment advice. Investments are always made at your own risk and are based on your personal judgement. I am not responsible for any losses you may incur. Please invest wisely.*

Inverse FVG with Quadrants [Modified]# Inverse FVG with Quadrants
*Modified version of original indicator by **tradeforopp**
## Overview
This advanced Fair Value Gap (FVG) indicator identifies both regular and inverse fair value gaps with precision, displaying them in a visually intuitive quadrant-based system. The enhanced version now features automatic timeframe selection that aligns higher timeframe FVGs with your current chart period for multi-timeframe analysis.
## Key Features
### 🔹 Fair Value Gap Detection
- **Regular FVGs**: Identifies traditional bullish and bearish fair value gaps
- **Inverse FVGs**: Automatically detects and displays inverse fair value gaps when price closes through a regular FVG
- **Quadrant Display**: Shows only the relevant half of each FVG for cleaner visual analysis (upper quadrant for bullish patterns, lower quadrant for bearish)
### 🔹 Smart Timeframe Management
- **Auto Timeframe Selection**: Automatically selects the appropriate higher timeframe based on your current chart:
- 1min → 15min
- 3min → 30min
- 5min → 1h
- 15min → 4h
- 1h → Daily
- 4h → Weekly
- **Manual Override**: Optional manual timeframe selection still available
### 🔹 Visual Customization
- Adjustable colors for both regular and inverse FVGs
- Optional box extension
- Customizable display limits to prevent chart clutter
- Session filtering capabilities
### 🔹 Trading Signals
- FVGs provide potential support/resistance zones and price targets
- Inverse FVGs offer confirmation of trend continuation or reversal
- Alert conditions for new FVG creation, regular FVG, and inverse FVG events
## How to Use
1. Apply the indicator to your chart
2. Enable "Auto Timeframe Selection" for multi-timeframe analysis (recommended)
3. Adjust displacement settings to filter for more significant FVGs
4. Use regular FVGs as potential zones where price may return to fill the gap
5. Watch for inverse FVGs as confirmation signals when price breaks through regular FVGs
This refined indicator combines powerful FVG analysis with automatic timeframe alignment to provide traders with clear, actionable insights across multiple timeframes. Perfect for both intraday traders and swing traders looking for high-probability entry and exit points.
Credits to @tradeforopp for creating the original version of this indicator. This is a modified version with enhanced features while preserving the core functionality.
## Tips
- Blue boxes (FVG+) indicate bullish fair value gaps (potential support)
- Red boxes (FVG-) indicate bearish fair value gaps (potential resistance)
- When price closes through an FVG, watch for the inverse FVG as a confirmation signal
- Use the dashed centerline as a potential target within each FVG

Fair Value Gap [LuxAlgo]Fair value gaps (FVG) highlight imbalances areas between market participants and have become popular amongst technical analysts. The following script aims to display fair value gaps alongside the percentage of filled gaps and the average duration (in bars) before gaps are filled.
Users can be alerted when an FVG is filled using the alerts built into this script.
🔶 USAGE
In practice, FVG's highlight areas of support (bullish FVG) and resistances (bearish FVG). Once a gap is filled, suggesting the end of the imbalance, we can expect the price to reverse.
This approach is more contrarian in nature, users wishing to use a more trend-following approach can use the identification of FVG as direct signals, going long with the identification of a bullish FVG, and short with a bearish FVG.
🔹 Mitigation
By default, the script highlights the areas of only unmitigated FVG's. Users can however highlight the mitigation level of mitigated FVG's, that is the lower extremity of bullish FVG's and the upper extremity of bearish FVG's.
The user can track the evolution of a mitigated FVG's using the "Dynamic" setting.
🔹 Threshold
The gap height can be used to determine the degree of imbalance between buying and selling market participants. Users can filter fair value gaps based on the gap height using the "Threshold %" setting. Using the "Auto" will make use of an automatic threshold, only keeping more volatile FVG's.
🔶 DETAILS
We use the following rules for detecting FVG's in this script:
Bullish FVG
low > high(t-2)
close(t-1) > high(t-2)
(low - high(t-2)) / high(t-2) > threshold
Upper Bullish FVG = low
Lower Bullish FVG = high(t-2)
Bearish FVG
high < low(t-2)
close(t-1) < low(t-2)
(low(t-2) - high) / high < -threshold
Upper Bearish FVG = low(t-2)
Lower Bearish FVG = high
🔶 SETTINGS
Threshold %: Threshold percentage used to filter our FVG's based on their height.
Auto Threshold: Use the cumulative mean of relative FVG heights as threshold.
Unmitigatted Levels: Extent the mitigation level of the number of unmitigated FVG's set by the user.
Mitigation Levels: Show the mitigation levels of mitigated FVG's.
Timeframe : Timeframe of the price data used to detect FVG's.

MTF OB & FVG detector w/ Alerts v2# MTF Order Blocks & Fair Value Gaps Detector with Alerts v2
## Overview
This indicator combines **Multi-Timeframe Order Blocks (OB)** and **Fair Value Gaps (FVG)** detection with integrated bounce alerts. It displays Order Blocks and Fair Value Gaps across multiple timeframes simultaneously and generates real-time alerts when price bounces from these critical zones.
## Key Features
### 🎯 Multi-Timeframe Order Blocks Detection
- **Volumetric Analysis**: Each Order Block displays total volume and dominant side percentage
- **Multiple Timeframes**: Supports 1min, 3min, 5min, 15min, and 60min timeframes
- **Smart Combining**: Automatically merges overlapping Order Blocks from different timeframes into powerful confluence zones
- **Dynamic Extension**: Order Blocks extend until broken, providing clear visual guidance
- **Volume Distribution**: Shows bullish vs bearish volume breakdown with percentage
### 📊 Fair Value Gaps (FVG) Detection
- **Lightweight Processing**: Works on current chart timeframe only for optimal performance
- **Volume Metrics**: Displays FVG volume and dominant side percentage
- **Mitigation Tracking**: Automatically tracks when FVGs are filled or broken
- **Customizable Mitigation Source**: Choose between close price or high/low wicks
### 🔔 Comprehensive Alert System
- **Bounce Alerts**: Get notified when price bounces from OB or FVG zones
- **New Formation Alerts**: Alerts when new Order Blocks or Fair Value Gaps form
- **Combined Zone Alerts**: Special alerts when multiple Order Blocks merge into strong confluence zones
- **Customizable Thresholds**: Set minimum number of combined OBs required for strong zone alerts
### 🎨 Visual Customization
- **Inverted Color Schemes**: Optional inverted colors for both OB and FVG
- OB: Choose between traditional (Bullish=Blue, Bearish=Red) or inverted (Bullish=Red, Bearish=Blue)
- FVG: Choose between Bullish=Orange/Bearish=Aqua or inverted
- **Clean Labels**: Shows timeframe, zone type, volume, and dominant percentage
- **Combined Tags**: Optional labels for merged zones
- **Adjustable Extension**: Control how far zones extend into the future
## How It Works
### Order Blocks
Order Blocks identify institutional trading zones where large players have placed significant orders. The indicator:
1. Detects swing highs/lows using configurable swing length
2. Identifies the last opposing candle before a strong move
3. Analyzes volume distribution (bullish vs bearish)
4. Tracks zone validity until price breaks through
5. Combines overlapping zones from multiple timeframes
### Fair Value Gaps
Fair Value Gaps represent price imbalances that often get filled. The indicator:
1. Identifies 3-candle patterns with gaps between candles
2. Filters gaps by size percentile to show only significant ones
3. Calculates volume distribution within the gap
4. Tracks mitigation when price returns to fill the gap
5. Extends gaps dynamically until filled
### Bounce Detection
The indicator detects bounces using a two-step process:
1. **Touch Phase**: Tracks when price enters a zone (touchedInside flag)
2. **Bounce Phase**: Confirms bounce when price exits the zone in the expected direction
- Bullish zones: Price closes above top after touching inside
- Bearish zones: Price closes below bottom after touching inside
## Settings Guide
### General Configuration
- **Show Historic Zones**: Display invalidated/broken zones
- **Zone Invalidation**: Choose between wick or close for break detection
- **Combine Overlapping Order Blocks**: Merge OBs from different timeframes
- **Swing Length**: Controls sensitivity (smaller = more OBs, larger = fewer OBs)
- **Zone Count**: Choose from High/Medium/Low/One per timeframe
- **Invert Colors OB**: Swap bullish/bearish color scheme
### Alert Settings
- **Enable Alerts**: Master switch for all alerts
- **Alert on Bullish/Bearish Bounce**: Choose which bounce directions to monitor
- **Alert on New OB Formation**: Get notified when new Order Blocks form
- **Alert on Combined OBs**: Alerts for strong confluence zones
- **Min OBs for Strong Zone Alert**: Threshold for combined zone alerts (default: 2)
### Fair Value Gaps
- **Show Fair Value Gaps**: Toggle FVG display
- **FVG Mitigation Source**: Choose close or high/low for mitigation detection
- **Bullish/Bearish FVG**: Enable/disable each type
- **Invert FVG Colors**: Swap FVG color scheme
### Multi-Timeframe
- **Show Lower Timeframes**: Display OBs from timeframes lower than chart
- **Individual Timeframe Toggles**: Enable/disable 1min, 3min, 5min, 15min, 60min
### Style
- **Text Color**: Customize label text color
- **Extend Zones**: Set extension length in bars (default: 40)
- **Show Tag**: Display combined indicator in merged zone labels
## Usage Tips
### For Day Trading
- Enable 1min, 3min, and 5min timeframes
- Use "High" zone count for more trading opportunities
- Watch for bounces from combined zones (highest probability)
### For Swing Trading
- Enable 15min, 60min, and higher timeframes
- Use "Medium" or "Low" zone count for major zones only
- Focus on combined zones with 3+ timeframes
### For Scalping
- Use current timeframe only (disable MTF)
- Enable both OB and FVG
- Set up alerts for quick bounce notifications
### Alert Setup
1. Click "Create Alert" in TradingView
2. Choose from available alert conditions:
- **Bullish Bounce (OB/FVG)**: Long entry opportunities
- **Bearish Bounce (OB/FVG)**: Short entry opportunities
- **New OB Formation**: Early zone identification
- **Strong Combined Zone**: High-probability confluence areas
3. Set alert frequency to "Once Per Bar Close" to avoid false signals
## Technical Details
### Performance Optimizations
- Maximum 100 boxes/labels for efficient rendering
- Lightweight FVG processing on current timeframe only
- Dynamic memory management with array size limits
- Selective rendering of active zones only
### Calculations
- **ATR Multiplier**: Zones exceeding 3.5x ATR are filtered out
- **Volume Percentage**: `max(bullVol, bearVol) / totalVolume × 100`
- **FVG Size Filter**: Uses 100th percentile of last 1000 gaps
- **Overlap Detection**: Uses intersection/union ratio for combining zones
## Credits & License
This indicator combines and enhances concepts from:
- "Volumized Order Blocks" methodology
- "Volumatic Fair Value Gaps" approach
**License**: Mozilla Public License 2.0 (MPL-2.0)
## Disclaimer
This indicator is provided for **educational and informational purposes only**. Trading involves substantial risk of loss and is not suitable for every investor. Past performance is not indicative of future results. Always do your own research and consult with a licensed financial advisor before making trading decisions.
## Version History
**v2 (Current)**
- Combined OB and FVG into single indicator
- Added comprehensive alert system
- Improved performance with lightweight FVG processing
- Enhanced bounce detection with touch-inside logic
- Added volume metrics to zone labels
- Implemented dynamic zone extension until broken
- Added combined zone detection with configurable thresholds
---
### Chart Examples
The indicator displays:
- **Red Zones** (Inverted): Bullish Order Blocks / Bearish FVGs
- **Blue Zones** (Inverted): Bearish Order Blocks / Bullish FVGs
- **Orange Zones** (Inverted): Bullish Fair Value Gaps
- **Aqua Zones** (Inverted): Bearish Fair Value Gaps
Each zone shows:
- Timeframe label (e.g., "5m", "15m", "1H")
- Zone type (OB or FVG)
- Total volume in millions (e.g., "12.5M")
- Dominant side percentage (e.g., "85%")
**Example Label**: ` 5m & 15m OB 45.2M (78%)`
- Combined zone from 5min and 15min timeframes
- Order Block type
- 45.2 million total volume
- 78% volume on dominant side
---
## Support & Updates
For issues, suggestions, or questions, please leave a comment on the indicator page.
**Author**: © rasukaru666
**Compatible with**: TradingView Pine Script v6

ICT First Presented FVG with Volume Imbalance [1st P. FVG + VI]The indicator identifies and highlights the first presented Fair Value Gap (FVG) occurringthe morning (09:30–10:00) and afternoon (13:30–14:00) session's first 30 minutes. It includes an optional feature to extend FVG zones when a volume imbalance (V.I.) is detected, providing additional context for areas of potential price inefficiency. This powerful combination helps traders identify significant market structure gaps that often act as support/resistance zones and potential price targets.
What is an FVG?
A Fair Value Gap, often abbreviated as FVG, is a price range on a chart where there is an inefficiency or imbalance in trading. This typically happens when price moves rapidly in one direction, leaving a gap between the wicks or bodies of three consecutive candles. For example, in a bullish move, if the low of the third candle is higher than the high of the first candle, the space between them is the FVG.
What is a Volume Imbalance?
A volume imbalance is a smaller, more precise inefficiency within price action, often visible as a "crack" or thin area in the price delivery. It represents a spot where the volume traded was not balanced between buyers and sellers, often seen as a thin wick or a gap between candle bodies.
FVG + Volume Imbalance:
When you have a fair value gap that contains a volume imbalance, it becomes a more significant area of interest. ICT teaches that you should not ignore a volume imbalance if it’s part of an FVG. In fact, you should use the volume imbalance in conjunction with the FVG to define your trading range more accurately
📊 Volume Imbalance Integration
Toggle Option: Enable/disable volume imbalance detection based on preference
Extended Boundaries: When enabled, FVG boundaries expand to include volume imbalance zones
Accurate Gap Sizing: Total gap calculation includes volume imbalance extensions
Multi-Scenario Support: Handles volume imbalances at start, end, or both sides of FVG formations
📈 Multiple Display Modes
Current Day: Shows only today's FVGs for clean chart analysis
Current Week: Displays all weekly FVGs for broader context
Forward Extension: Extends FVG boxes and CE, Upper/Lower Quadrant lines into the future
📊 Visualization
Bullish FVGs appear in semi-transparent blue or purple zones (depending on session).
Bearish FVGs appear in red or orange zones.
Optional dotted lines mark the CE (midpoint) of each FVG for additional reference.
Quadrant Division: Additional 25%/75% lines for large FVGs (configurable minimum gap size)
🎯 Smart Filtering
First Presentation Only: Only displays the initial FVG in each session, avoiding clutter
Minimum Gap Size: Configurable tick-based thresholds for AM and PM sessions
Core FVG Validation: Ensures only valid Fair Value Gaps are displayed
⚙️ Configuration Options
Display Settings
Show Mode: Current Day or Current Week view
Forward Extension: 1-500 bars projection
Day Labels: Toggle weekday labels in weekly mode
Text Color: Customizable label colors
Volume Imbalance Settings
Include Volume Imbalance: Master toggle for enhanced boundary calculation
Automatic Detection: Identifies imbalance scenarios without additional input
Session-Specific Settings
AM Session (09:30-10:00):
Enable/disable AM FVG detection
Customizable bullish/bearish colors
CE line visibility and coloring
Minimum gap size in ticks
PM Session (13:30-14:00):
Enable/disable PM FVG detection
Customizable bullish/bearish colors
CE line visibility and coloring
Minimum gap size in ticks
Quadrant Settings
Enable/Disable: Toggle quadrant line display
Minimum Gap: Tick threshold for quadrant activation
Line Style: Dotted, dashed, or solid
Color: Customizable quadrant line color
How It Works
FVG Boundary Calculation
Traditional FVG: High to Low (bullish) or Low to High (bearish)
Enhanced FVG: Extended boundaries to include volume imbalance zones when enabled
Total Gap Size: Calculated including any volume imbalance extensions
Volume Imbalance Detection
The indicator identifies volume imbalances by detecting bars where:
Bullish Imbalance: Current bar's body is completely above previous bar's body
Bearish Imbalance: Current bar's body is completely below previous bar's body
⚠️ Disclaimer
This script is a technical visualization tool only.
It does not provide financial advice, signals, or predictions. Always perform independent analysis and manage risk appropriately before making trading decisions.

Smart Fair Value Gaps (FVG) + MTF [Intelligent]This indicator elevates the standard Fair Value Gap (FVG) concept by introducing an intelligent classification system, advanced filtering, and integrated Multi-Timeframe (MTF) analysis. It is designed to move beyond simple FVG detection, providing traders with a deeper, more contextual understanding of market imbalances. By analyzing the characteristics of each FVG relative to recent historical data, the script helps to distinguish between high-momentum gaps and potential exhaustion points.
What is a Fair Value Gap (FVG)?
A Fair Value Gap, or price imbalance, is a three-candle pattern where the wick of the first candle does not overlap with the wick of the third candle. This creates an inefficient price delivery area that the market often seeks to revisit or "mitigate" in the future.
Bullish FVG: The space between the high of the first candle and the low of the third candle in a strong upward move.
Bearish FVG: The space between the low of the first candle and the high of the third candle in a strong downward move.
Key Features
Intelligent FVG Classification: This is the core of the indicator. Instead of treating all FVGs equally, it classifies them into four distinct types based on their size and the volume on which they formed, relative to a dynamic historical baseline.
🟡 Power FVG: High Size & High Volume Ratio. Indicates a gap formed with strong conviction and momentum, often a good continuation signal.
🟣 Exhaustion FVG: Low Size & High Volume Ratio. Suggests a high amount of effort (volume) for little price movement, which may indicate a trend is losing steam.
🟠 Absorption FVG: High Size & Low Volume Ratio. A significant price gap was created with relatively little volume, suggesting a lack of resistance and potential for price to move easily through that area.
🔵 Normal FVG: Any FVG that does not meet the criteria for the other classifications.
Multi-Timeframe (MTF) Analysis: Plot FVGs from a higher timeframe directly onto your current chart. These HTF zones often act as powerful areas of support or resistance and provide crucial context for lower-timeframe price action.
Advanced Filtering Suite: Gain complete control over which FVGs are displayed to reduce chart noise and focus on what matters.
Minimum Size Filter: Ignores insignificant micro-gaps by setting a minimum size requirement as a percentage of price.
EMA Trend Filter: Only display FVGs that align with the broader market trend (e.g., only show Bullish FVGs when price is above the 200 EMA).
Volume Filter: Qualify FVGs by requiring them to form on volume that is a specified multiple of its moving average, ensuring they are backed by significant market participation.
Comprehensive Customization: Tailor every aspect of the indicator to fit your personal trading style and chart aesthetic.
Mitigation Rules: Define precisely when an FVG is considered "mitigated" and no longer valid. Choose from a full fill, a 50% fill (Consequent Encroachment), or a simple wick touch.
Visuals & Data: Customize colors, borders, and box extensions. Toggle visuals for partial fills and the 50% CE line.
Data Labels: Display key information directly on the FVG boxes, including size in percentage and ticks, the volume of the FVG candle, and the volume ratio compared to the average.
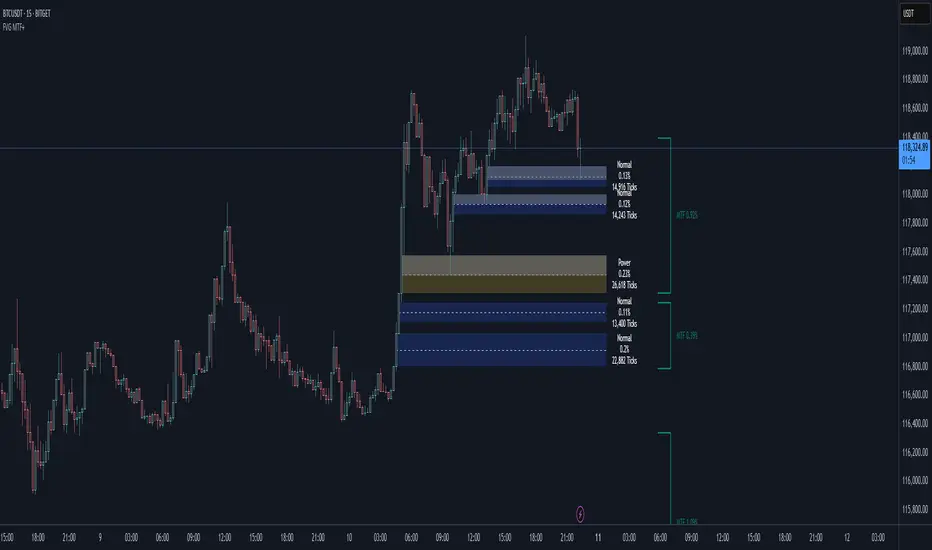
MMXM ICT [TradingFinder] Market Maker Model PO3 CHoCH/CSID + FVG🔵 Introduction
The MMXM Smart Money Reversal leverages key metrics such as SMT Divergence, Liquidity Sweep, HTF PD Array, Market Structure Shift (MSS) or (ChoCh), CISD, and Fair Value Gap (FVG) to identify critical turning points in the market. Designed for traders aiming to analyze the behavior of major market participants, this setup pinpoints strategic areas for making informed trading decisions.
The document introduces the MMXM model, a trading strategy that identifies market maker activity to predict price movements. The model operates across five distinct stages: original consolidation, price run, smart money reversal, accumulation/distribution, and completion. This systematic approach allows traders to differentiate between buyside and sellside curves, offering a structured framework for interpreting price action.
Market makers play a pivotal role in facilitating these movements by bridging liquidity gaps. They continuously quote bid (buy) and ask (sell) prices for assets, ensuring smooth trading conditions.
By maintaining liquidity, market makers prevent scenarios where buyers are left without sellers and vice versa, making their activity a cornerstone of the MMXM strategy.
SMT Divergence serves as the first signal of a potential trend reversal, arising from discrepancies between the movements of related assets or indices. This divergence is detected when two or more highly correlated assets or indices move in opposite directions, signaling a likely shift in market trends.
Liquidity Sweep occurs when the market targets liquidity in specific zones through false price movements. This process allows major market participants to execute their orders efficiently by collecting the necessary liquidity to enter or exit positions.
The HTF PD Array refers to premium and discount zones on higher timeframes. These zones highlight price levels where the market is in a premium (ideal for selling) or discount (ideal for buying). These areas are identified based on higher timeframe market behavior and guide traders toward lucrative opportunities.
Market Structure Shift (MSS), also referred to as ChoCh, indicates a change in market structure, often marked by breaking key support or resistance levels. This shift confirms the directional movement of the market, signaling the start of a new trend.
CISD (Change in State of Delivery) reflects a transition in price delivery mechanisms. Typically occurring after MSS, CISD confirms the continuation of price movement in the new direction.
Fair Value Gap (FVG) represents zones where price imbalance exists between buyers and sellers. These gaps often act as price targets for filling, offering traders opportunities for entry or exit.
By combining all these metrics, the Smart Money Reversal provides a comprehensive tool for analyzing market behavior and identifying key trading opportunities. It enables traders to anticipate the actions of major players and align their strategies accordingly.
MMBM :
MMSM :
🔵 How to Use
The Smart Money Reversal operates in two primary states: MMBM (Market Maker Buy Model) and MMSM (Market Maker Sell Model). Each state highlights critical structural changes in market trends, focusing on liquidity behavior and price reactions at key levels to offer precise and effective trading opportunities.
The MMXM model expands on this by identifying five distinct stages of market behavior: original consolidation, price run, smart money reversal, accumulation/distribution, and completion. These stages provide traders with a detailed roadmap for interpreting price action and anticipating market maker activity.
🟣 Market Maker Buy Model
In the MMBM state, the market transitions from a bearish trend to a bullish trend. Initially, SMT Divergence between related assets or indices reveals weaknesses in the bearish trend. Subsequently, a Liquidity Sweep collects liquidity from lower levels through false breakouts.
After this, the price reacts to discount zones identified in the HTF PD Array, where major market participants often execute buy orders. The market confirms the bullish trend with a Market Structure Shift (MSS) and a change in price delivery state (CISD). During this phase, an FVG emerges as a key trading opportunity. Traders can open long positions upon a pullback to this FVG zone, capitalizing on the bullish continuation.
🟣 Market Maker Sell Model
In the MMSM state, the market shifts from a bullish trend to a bearish trend. Here, SMT Divergence highlights weaknesses in the bullish trend. A Liquidity Sweep then gathers liquidity from higher levels.
The price reacts to premium zones identified in the HTF PD Array, where major sellers enter the market and reverse the price direction. A Market Structure Shift (MSS) and a change in delivery state (CISD) confirm the bearish trend. The FVG then acts as a target for the price. Traders can initiate short positions upon a pullback to this FVG zone, profiting from the bearish continuation.
Market makers actively bridge liquidity gaps throughout these stages, quoting continuous bid and ask prices for assets. This ensures that trades are executed seamlessly, even during periods of low market participation, and supports the structured progression of the MMXM model.
The price’s reaction to FVG zones in both states provides traders with opportunities to reduce risk and enhance precision. These pullbacks to FVG zones not only represent optimal entry points but also create avenues for maximizing returns with minimal risk.
🔵 Settings
Higher TimeFrame PD Array : Selects the timeframe for identifying premium/discount arrays on higher timeframes.
PD Array Period : Specifies the number of candles for identifying key swing points.
ATR Coefficient Threshold : Defines the threshold for acceptable volatility based on ATR.
Max Swing Back Method : Choose between analyzing all swings ("All") or a fixed number ("Custom").
Max Swing Back : Sets the maximum number of candles to consider for swing analysis (if "Custom" is selected).
Second Symbol for SMT : Specifies the second asset or index for detecting SMT divergence.
SMT Fractal Periods : Sets the number of candles required to identify SMT fractals.
FVG Validity Period : Defines the validity duration for FVG zones.
MSS Validity Period : Sets the validity duration for MSS zones.
FVG Filter : Activates filtering for FVG zones based on width.
FVG Filter Type : Selects the filtering level from "Very Aggressive" to "Very Defensive."
Mitigation Level FVG : Determines the level within the FVG zone (proximal, 50%, or distal) that price reacts to.
Demand FVG : Enables the display of demand FVG zones.
Supply FVG : Enables the display of supply FVG zones.
Zone Colors : Allows customization of colors for demand and supply FVG zones.
Bottom Line & Label : Enables or disables the SMT divergence line and label from the bottom.
Top Line & Label : Enables or disables the SMT divergence line and label from the top.
Show All HTF Levels : Displays all premium/discount levels on higher timeframes.
High/Low Levels : Activates the display of high/low levels.
Color Options : Customizes the colors for high/low lines and labels.
Show All MSS Levels : Enables display of all MSS zones.
High/Low MSS Levels : Activates the display of high/low MSS levels.
Color Options : Customizes the colors for MSS lines and labels.
🔵 Conclusion
The Smart Money Reversal model represents one of the most advanced tools for technical analysis, enabling traders to identify critical market turning points. By leveraging metrics such as SMT Divergence, Liquidity Sweep, HTF PD Array, MSS, CISD, and FVG, traders can predict future price movements with precision.
The price’s interaction with key zones such as PD Array and FVG, combined with pullbacks to imbalance areas, offers exceptional opportunities with favorable risk-to-reward ratios. This approach empowers traders to analyze the behavior of major market participants and adopt professional strategies for entry and exit.
By employing this analytical framework, traders can reduce errors, make more informed decisions, and capitalize on profitable opportunities. The Smart Money Reversal focuses on liquidity behavior and structural changes, making it an indispensable tool for financial market success.

Arjo FVG Filtering With Alerts [neo.|]Fair Value Gaps (Also known as FVGs or Imbalances) can be simply described as a three candle pattern, where the second candle's body isn't completely covered by the wicks or body of the second and third candle. These areas represent movements in the market where either buyers or sellers were not able to get involved due to price in the form of wicks not revisiting those levels, and instead moving away from them.
As a result, they can be seen as potential areas of continuation given that price may want to continue in it's direction after it revisits them and offers Fair Value, since previously it made sharp moves away from those areas.
However what is important to note, and what FVG Filtering aims to address, is that there are three notable types of FVGs as described by Arjo, which are Perfect FVGs denoted as FVGp on the indicator and chart below, Expansion (FVGe), and Reversal (FVGr). As the names imply, they each serve different purposes with the FVGp being the likeliest to hold on mitigation, expansion meaning price is likely to not retrace into the FVG and reversal being the least likely for the FVG to hold.
The indicator is the first that automatically determines which one of the three underlying FVG types any particular FVG is, that way you can quickly make informed decisions based on the type of FVG you see appear on the chart.
As you may notice, the type depends primarily on the third candle, which demonstrates the true strength of any particular FVG, and is how the filtering occurs on this indicator, which compares the sizes of the second and third candle's bodies, in order to classify the FVG candle sequence as one of the three aforementioned types.
Color Options:
FVG Colors: Change the color of any bullish or bearish FVG type to easily distinguish between them.
Mitigated FVG Color: Apply colors to mitigated FVGs in order to avoid using ones that are no longer valid.
Text Color: Change the color of the text within the FVG to your liking.
Further styling options:
How many FVGs you want to be displayed: Changes the amount of FVGs displayed on your chart by limiting each type of FVG to the number you select.
How far you want the FVGs to extend: Modify the amount of bars forward that the FVG stretches out after it's inception.
Table options:
Show table: Display a table that will give you insights on how many FVGs were created of each type and what % they represent of the total.
Table text color: Modify the color of the text within the table.
Table border color: Modify the color of the border of the table.
Alerts:
Freely set alerts for any type of FVG you would like to see.

Fair Value Gaps Mitigation Oscillator [LuxAlgo]The Fair Value Gaps Mitigation Oscillator is an oscillator based on the traditional Fair Value Gaps (FVGs) imbalances. The oscillator displays the current total un-mitigated values for the number of FVGs chosen by the user.
The indicator also displays each New FVG as a bar representing the current ratio of the New FVG in relation to the current un-mitigated total for its direction.
🔶 USAGE
When an FVG forms, it is often interpreted as strong market sentiment in the direction of the gap. For example, an upward FVG during an uptrend is typically seen as a confirmation of the strength and continuation of the trend, as it indicates that buyers are willing to purchase at higher prices without much resistance, suggesting strong demand and positive sentiment.
By analyzing the mitigation (or lack thereof), we can visualize the increase of directional strength in a trend. This is where the proposed oscillator is useful.
🔶 DETAILS
The oscillator's values are expressed as Percentages (%). Each FVG is allocated 100% of the total of its width with a max potential value of 100 and minimum potential value of 0.
Based on the "FVG Lookback" Input, the FVGs are scaled to fit within the range of +1 to -1. Using a higher "FVG Lookback" value will allow you to get indications of longer-term trends.
A higher value of the normalized bullish FVG areas suggest a stronger and cleaner uptrend, while lower values of the bearish the normalized bullish FVG areas suggest a stronger and cleaner downtrend.
+1 or -1 indicates that there is a Full Lookback of FVGs, and each one is fully un-mitigated, and the opposite direction of FVGs is entirely Mitigated.
When the price closes over/under or within an FVG it begins to get mitigated, when this happens the % of mitigation is subtracted from the total.
When a New FVG is formed, a Histogram bar is created representing the ratio of the current FVG's width to the total width off all un-mitigated FVGs.
The entire bar represents 100% of total un-mitigated FVG Width.
The filled area represents the current FVG's width relative to the whole.
A 50% hash mark is also displayed for reference.
🔶 SETTINGS
FVG Lookback - Determines the number of FVGs (Bullish and Bearish Pairs) to keep in memory for analysis.

Fair Value Gaps (Volumetric) | Flux Charts💎 GENERAL OVERVIEW
Introducing a brand new Fair Value Gaps (FVG) indicator, now with Volumetric Zones! You can now see the total volume of FVG zones, as well as their bullish & bearish volume ratio.
Features of the Volumetric FVG Indicator :
Render Bullish / Bearish FVG Zones
See Total Volume Of The FVG Zones
See The Ratio Of Bullish / Bearish Bar Volume Of FVG Zones
Combination Of Overlapping FVG Zones
Variety Of Zone Detection/ Sensitivity / Filtering / Invalidation Settings
High Customizability
🚩UNIQUENESS
The ability to render the total volume of FVGs as well as bullish / bearish volume ratio is what sets this FVG indicator apart from others. Also the ability to combine overlapping FVG zones will result in cleaner charts for traders.
⚙️SETTINGS
1. General Configuration
Zone Invalidation -> Select between Wick & Close price for FVG Zone Invalidation.
Zone Filtering -> With "Average Range" selected, algorithm will find FVG zones in comparison with average range of last bars in the chart. With the "Volume Threshold" option, you may select a Volume Threshold % to spot FVGs with a larger total volume than average.
FVG Detection -> With the "Same Type" option, all 3 bars that formed the FVG should be the same type. (Bullish / Bearish). If the "All" option is selected, bar types may vary between Bullish / Bearish.
Detection Sensitivity -> You may select between Low, Normal or High FVG detection sensitivity. This will essentially determine the size of the spotted FVGs, with lower sensitivities resulting in spotting bigger FVGs, and higher sensitivities resulting in spotting all sizes of FVGs.
Show Historic Zones -> If this option is on, the indicator will render invalidated FVG zones as well as current FVG zones. For a cleaner look at current FVG zones which are not invalidated yet, you can turn this option off.
