Dragon Flow Arrows (LITE)🚀 DRAGON FLOW ARROWS | Smart Trend Engine + Clean Reversal Arrows
A lightweight but highly-optimized trend system designed for clean charts, powerful visual signals, and no-noise directional flow. Built for traders who want simplicity, clarity, and professional-level momentum-filtered signals without over-complication.
🔥 Dragon Channel (Clean 3-Line Ribbon)
A smooth adaptive channel formed from ATR + EMA, giving you structural trend zones without clutter.
✅ Dragon Flow Gradient
A horizontal, color-shifted flow:
🟢 Bull flow → green glow
🔴 Bear flow → red glow
Automatic blend based on trend direction
Smooth visual transitions (no vertical stripes)
✅ Momentum-Filtered Arrows
BUY/SELL arrows only print when:
Price breaks outside the Dragon Channel
Momentum confirms (RSI + MACD filters)
Trend flips → one clean arrow per direction
✅ Smart Header Panel
At the top of your chart:
📌 Trend: Uptrend / Downtrend / Neutral
⚡ Impulse Strength: Weak / Normal / Strong
📊 How to Use
Entry:
- BUY Setup
Price moving above baseline
Dragon Flow turns bullish (cyan side)
Arrow appears below channel
- SELL Setup
Price breaks below baseline
Dragon Flow turns bearish (magenta side)
Arrow pops above channel
Exit / Filter:
Opposite arrow
Flow color shift
Trend panel flips
Works on Forex, Crypto, Stocks, Indices — all timeframes (just adjust the channel length).
Happy trading!
In den Scripts nach "forex" suchen

DDDDD : EMA Pack (Matched Colors + MTF)📌 DDDDD : EMA Pack (Matched Colors + MTF)
🔹 Concept
DDDDD : EMA Pack is a clean and minimal Exponential Moving Average (EMA) overlay designed for trend structure analysis and multi-timeframe context.
This indicator focuses on visual clarity, consistent color mapping, and optional MTF EMA projection, allowing traders to read market structure without clutter or signal noise.
It is not an entry or signal generator, but a trend and regime visualization tool.
🔹 Logic
The script plots a fixed set of EMAs commonly used to define short-term momentum, intermediate trend, and long-term bias:
EMA 5
EMA 10
EMA 25
EMA 50
EMA 75
EMA 200
Each EMA is calculated using the standard exponential moving average formula.
If a higher timeframe is selected, the EMA is calculated on that timeframe and projected onto the current chart using request.security().
🔹 Methodology
Users may select:
Source price (default: close)
EMA timeframe
Empty = current chart timeframe
Any higher timeframe = true MTF EMA projection
All EMA colors are manually matched and fixed to maintain visual consistency across markets and timeframes.
Line thickness is kept uniform to avoid visual hierarchy bias.
This design ensures the indicator remains purely structural, without repainting logic, smoothing tricks, or adaptive parameters.
🔹 How to Use
Use EMA alignment and spacing to assess:
Trend direction
Trend strength
Compression vs expansion
Higher-timeframe EMA projection can be used as:
Dynamic support/resistance
Trend filter
Regime context for lower-timeframe execution
This indicator works best when combined with:
Price action
Market structure
Separate entry/exit logic of your own system
⚠️ This indicator does not provide buy/sell signals and should not be used alone for trade execution.
🔹 Notes
No repainting beyond standard MTF behavior
No performance or profitability claims
Designed for discretionary and systematic traders
Suitable for stocks, crypto, forex, and indices

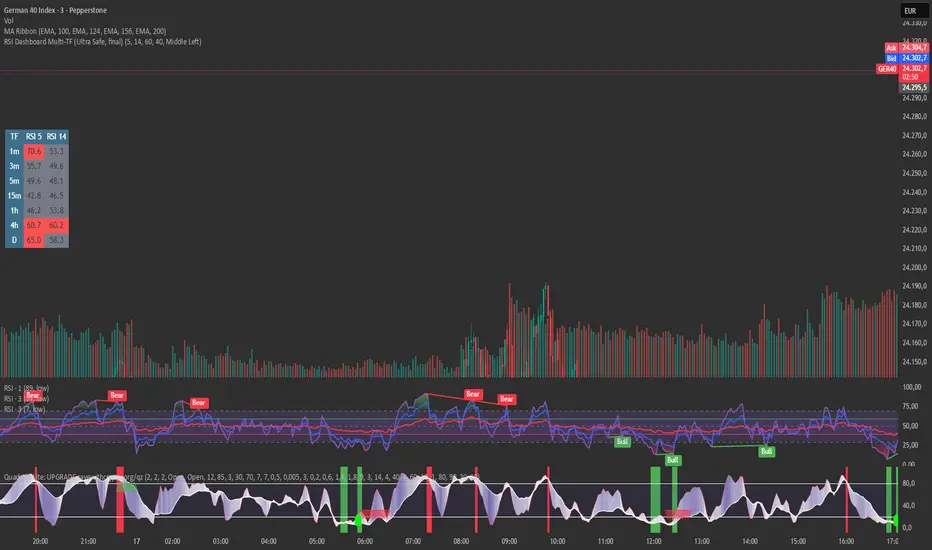
RSI Dashboard Multi-TF This script displays RSI values from multiple timeframes in a compact dashboard directly on the chart.
It is designed for traders who want to quickly identify whether the market is overbought, oversold, or neutral across different timeframes, without constantly switching chart intervals.
The dashboard shows the RSI simultaneously for the following timeframes:
- 1 minute
- 3 minutes
- 5 minutes
- 15 minutes
- 1 hour
- 4 hours
- Daily
Typical use cases:
- Scalping & intraday trading
- Multi-timeframe analysis at a glance
- Entry confirmation (e.g. pullbacks, breakouts)
- Avoiding trades against overbought or oversold market conditions
- Complementing EMA, VWAP, or price action strategies
⚙️ Notes
This dashboard is an analysis tool, not an automated trading system.
No repainting (uses request.security).
Suitable for indices, forex, crypto, and commodities.
This RSI dashboard provides a fast, clear, and visually clean market overview across multiple timeframes, making it an ideal tool for active traders who want to make efficient and well-structured trading decisions.
Advanced Multi-Level S/R ZonesAdvanced Multi-Level S/R Zones: The Comprehensive Guide
1. Introduction: The Evolution of Support & Resistance:
Support and Resistance (S/R) is the backbone of technical analysis. However, traditional methods of drawing these levels are often plagued by subjectivity. Two traders looking at the same chart will often draw two different lines. Furthermore, standard indicators often treat every price point equally, ignoring the critical context of Volume and Time.
The Advanced Multi-Level S/R Zones script represents a paradigm shift. It moves away from subjective line drawing and toward Quantitative Zoning. By utilizing statistical measures of variability (Standard Deviation, MAD, IQR) combined with Volume-Weighting and Time-Decay algorithms, this tool identifies where price is mathematically most likely to react. It treats S/R not as thin lines, but as dynamic zones of probability.
2. Core Logic and Mathematical Foundation:
To understand how to use this tool optimally, one must understand the "engine" under the hood. The script operates on four distinct pillars of logic:
A. Session-Based Data Collection:
The script does not look at every single tick. Instead, it aggregates data into "Sessions" (daily bars by default logic). It extracts the High, Low, and Total Volume for every session within the user-defined lookback period. This filters out intraday noise and focuses on the macro structure of the market.
B. Adaptive Statistical Variability:
Most Bollinger Band-style indicators use Standard Deviation (StdDev) to measure width. However, StdDev is heavily influenced by outliers (extreme wicks). This script offers a sophisticated Adaptive Method-Skewness Detection: The script calculates the skewness of the price distribution. Adaptive Selection: If the data is highly skewed (lots of outliers, typical in Crypto), it switches to MAD (Median Absolute Deviation). MAD is robust and ignores outliers. If the data is moderately skewed, it uses IQR (Interquartile Range). If the data is normal (Gaussian), it uses StdDev.
Benefit: This ensures the zone widths are accurate regardless of whether you are trading a stable Forex pair or a volatile Altcoin.
C. The Weighting Engine (Volume + Time)
Not all price history is equal. This script assigns a "Weight Score" to every session based on two factors:
Volume Weighting: Sessions with massive volume (institutional activity) are given higher importance. A high formed on low volume is less significant than a high formed on peak volume.
Time Decay: Recent price action is more relevant than price action from 50 bars ago. The script applies a decay factor (default 0.85). This means a session from yesterday has 100% impact, while a session from 10 days ago has significantly less influence on the zone calculation.
D. Clustering Algorithm
Once the data is weighted, the script runs a clustering algorithm. It looks for price levels where multiple session Highs (for Resistance) or Lows (for Support) congregate.
It requires a minimum number of points to form a zone (User Input: minPoints).
It merges nearby levels based on the Cluster Separation Factor.
This results in "Primary," "Secondary," and "Tertiary" zones based on the strength and quantity of data points in that cluster.
3. Detailed Features and Inputs Breakdown:
Group 1: Main Settings
Lookback Sessions (Default: 10): Defines how far back the script looks for pivots. A higher number (e.g., 50) creates long-term structural zones. A lower number (e.g., 5) creates short-term scalping zones.
Variability Method (Adaptive): As described above, leave this on "Adaptive" for the best results across different assets.
Zone Width Multiplier (Default: 0.75): Controls the vertical thickness of the zones. Increase this to 1.0 or 1.5 for highly volatile assets to ensure you catch the wicks.
Minimum Points per Zone: The strictness filter. If set to 3, a price level must be hit 3 times within the lookback to generate a zone. Higher numbers = fewer, but stronger zones.
Group 2: Weighting
Volume-Weighted Zones: Crucial for identifying "Smart Money" levels. Keep this TRUE.
Time Decay: Ensures the zones update dynamically. If price moves away from a level for a long time, the zone will fade in significance.
ATR-Normalized Zone Width: This is a dynamic volatility filter. If TRUE, the zone width expands and contracts based on the Average True Range. This is vital for maintaining accuracy during market breakouts or crashes.
Group 3: Zone Strength & Scoring
The script calculates a "Score" (0-100%) for every zone based on:
-Point Count: More hits = higher score.
-Touches: How many times price wicked into the zone recently.
-Intact Status: Has the zone been broken?
-Weight: Volume/Time weight of the constituent points.
-Track Zone Touches: Looks back n bars to see how often price respected this level.
-Touch Threshold: The sensitivity for counting a "touch."
Group 4: Visuals & Display
Extend Bars: How far to the right the boxes are drawn.
Show Labels: Displays the Score, Tier (Primary/Secondary), and Status (Retesting).
Detect Pivot Zones (Overlap): This is a killer feature. It detects where a Support Zone overlaps with a Resistance Zone.
Significance: These are "Flip Zones" (Old Resistance becomes New Support). They are colored differently (Orange by default) and represent high-probability entry areas.
Group 5: Signals & Alerts
Entry Signals: Plots Buy/Sell labels when price rejects a zone.
Detect Break & Retest: specifically looks for the "Break -> Pullback -> Bounce" pattern, labeled as "RETEST BUY/SELL".
Proximity Alert: Triggers when price gets within x% of a zone.
4. Understanding the Visuals (Interpreting the Chart)
When you load the script, you will see several visual elements. Here is how to read them:
The Boxes (Zones)
Red Shades: Resistance Zones.
Dark Red (Solid Border): Primary Resistance. The strongest wall.
Lighter Red (Dashed Border): Secondary/Tertiary. Weaker, but still relevant.
Green Shades: Support Zones.
Dark Green (Solid Border): Primary Support. The strongest floor.
Orange Boxes: Pivot Zones. These are areas where price has historically reacted as both support and resistance. These are the "Line in the Sand" for trend direction.
The Labels & Emojis
The script assigns emojis to zone strength:
🔥 (Fire): Score > 80%. A massive level. Expect a strong reaction.
⭐ (Star): Score > 60%. A solid structural level.
✓ (Check): Score > 40%. A standard level.
"⟳ RETESTING": Appears when a zone was broken, and price is currently pulling back to test it from the other side.
The Dashboard (Top Right)
A statistics table provides a "Head-Up Display" for the asset:
High/Low σ (Sigma): The variability of the highs and lows. If High σ is much larger than Low σ, it implies the tops are erratic (wicks) while bottoms are clean (flat).
Method: Shows which statistical method the Adaptive engine selected (e.g., "MAD (auto)").
ATR: Current volatility value used for normalization.
5. Strategies for Optimum Output
To get the most out of this script, you should not just blindly follow the lines. Use these specific strategies:
Strategy A: The "Zone Fade" (Range Trading)
This works best in sideways markets.
Identify a Primary Support (Green) and Primary Resistance (Red).
Wait for price to enter the zone.
Look for the "SUPPORT BOUNCE" or "RESISTANCE REJECTION" signal label.
Entry: Enter against the zone (Buy at support, Sell at resistance).
Stop Loss: Place just outside the zone width. Because the zones are calculated using volatility stats, a break of the zone usually means the trade is invalid.
Strategy B: The "Pivot Flip" (Trend Following)
This is the highest probability setup in trending markets.
Look for an Orange Pivot Zone.
Wait for price to break through a Resistance Zone cleanly.
Wait for the price to return to that zone (which may now turn Orange or act as Support).
Look for the "RETEST BUY" label.
Logic: Old resistance becoming new support is a classic sign of trend continuation. The script automates the detection of this exact geometric phenomenon.
Strategy C: The Volatility Squeeze
Look at the Dashboard. Compare High σ and Low σ.
If the values are dropping rapidly or becoming very small, the zones will contract (become narrow).
Narrow zones indicate a "Squeeze" or compression in price.
Prepare for a violent breakout. Do not fade (trade against) narrow zones; look to trade the breakout.
6. Optimization & Customization Guide
Different markets require different settings. Here is how to tune the script:
For Crypto & Volatile Stocks (Tesla, Nvidia)
Method: Set to Adaptive (Mandatory, as these assets have "Fat Tails").
Multiplier: Increase to 1.0 - 1.25. Crypto wicks are deep; you need wider zones to avoid getting stopped out prematurely.
Lookback: 20-30 sessions. Crypto has a long memory; short lookbacks generate too much noise.
For Forex (EURUSD, GBPJPY)
Method: You can force StdDev or IQR. Forex is more mean-reverting and Gaussian.
Multiplier: Decrease to 0.5 - 0.75. Forex levels are often very precise to the pip.
Volume Weighting: You may turn this OFF for Forex if your broker's volume data is unreliable (since Forex has no centralized volume), though tick volume often works fine.
For Scalping (1m - 15m Timeframes)
Lookback: Decrease to 5-10. You only care about the immediate session history.
Decay Factor: Decrease to 0.5. You want the script to forget about yesterday's price action very quickly.
Touch Lookback: Decrease to 20 bars.
For Swing Trading (4H - Daily Timeframes)
Lookback: Increase to 50.
Decay Factor: Increase to 0.95. Structural levels from weeks ago are still highly relevant.
Min Points: Increase to 3 or 4. Only show levels that have been tested multiple times.
7. Advantages Over Standard Tools:
Feature Standard S/R Indicator, Advanced Multi-Level S/R Calculation, Uses simple Pivots or Fractals, Uses Statistical Distributions (MAD/IQR). Zone Width Arbitrary or Fixed Adaptive based on Volatility & ATR.
Context Ignores Volume Volume Weighted (Smart Money tracking).
Time Relevance Old levels = New levels Time Decay (Recency bias applied).
Overlaps Usually ignores overlaps Detects Pivot Zones (Res/Sup Flip).
Scoring None 0-100% Strength Score per zone.
8. Conclusion:
The Advanced Multi-Level S/R Zones script is not just a drawing tool; it is a statistical analysis engine. By accounting for the skewness of data, the volume behind the moves, and the decay of time, it provides a strictly objective roadmap of the market structure.
For the optimum output, combine the Pivot Zone identification with the Retest Signals. This aligns you with the underlying flow of order blocks and prevents trading against the statistical probabilities of the market.

HaP D-RSIHaP D-RSI (HaP Dual RSI) This code shares the dual RSI structure and divergences of hakan çift rsi-most indicator as open source. It is designed for simple, understandable, and effective use.
()
HaP D-RSI is a comprehensive oscillator that powerfully enhances the classic Relative Strength Index (RSI) indicator. By adding a 9-period EMA on top of the standard RSI(14), it smooths the momentum for clearer readability, while dynamic area filling between the short RSI(10) and long RSI(14) visually emphasizes trend strength. Its strongest feature is the automatic detection of regular (normal) and hidden positive/negative divergences, marked with clear labels. This provides opportunities to catch both trend reversals and continuations early.The indicator operates in a separate panel and includes overbought/oversold levels (70/30/50). With multi-timeframe support, you can display RSI values from a higher timeframe on your current chart.Main FeaturesDual RSI Calculation: Short-period RSI(10) and long-period RSI(14) are calculated separately.
EMA Smoothing: A 9-period EMA is applied to RSI(14) to reduce noise and clarify signals.
Dynamic Area Filling: Dynamic colored filling between RSI(10) and RSI(14)-EMA (blue tones for bullish, red tones for bearish momentum).
Fixed-intensity area between RSI(10) and RSI(14) (emphasizes trend strength).
Overbought/Oversold Lines: Dashed lines at 70 (overbought), 30 (oversold), and 50 (midline).
Full Divergence Detection:Positive Divergence (pu): Price makes a lower low while RSI makes a higher low → Potential bullish reversal.
Hidden Positive Divergence (gpu): Trend continuation signal (buying opportunity after pullback).
Negative Divergence (nu): Price makes a higher high while RSI makes a lower high → Potential bearish reversal.
Hidden Negative Divergence (gnu): Bearish trend continuation signal.
Customizable Pivot Settings: Adjust divergence sensitivity with lookback left/right and distance range.
Multi-Timeframe Support: Ability to pull RSI data from a different timeframe.
Usage InstructionsAdd to Chart: When added, it opens a separate RSI panel.
Settings: Change the short RSI (default 10) and long RSI (default 14) periods as needed.
Adjust the EMA period (default 9) to suit your needs.
If the timeframe is left blank, it uses the current chart timeframe; otherwise, select a higher timeframe.
You can toggle divergence types (positive/negative, hidden/regular) on/off.
Increase pivot lookback values for stronger (fewer signals) divergences.
Signal InterpretationBuy Opportunity: When "pu" or "gpu" labels appear (especially around the 30 level).
Sell Opportunity: When "nu" or "gnu" labels appear (especially around the 70 level).
Area filling colors support momentum direction: Blue tones indicate bullish pressure, red tones indicate bearish pressure.
For best results, use in combination with support/resistance levels, volume, or trend filters (e.g., EMA).
Why Use This Indicator?Powerful Divergence Detection: Automatically and accurately captures both regular (reversal) and hidden (continuation) divergences – a feature missing in many standard RSI indicators.
Visual Clarity: Dynamic colored areas and labels ensure you don't miss signals.
Flexibility: Suitable for all markets (stocks, forex, crypto) and timeframes.
Early Warning System: Divergences often signal before price reversals, providing high-probability entries.
Add this indicator to your strategies to elevate your momentum-based trading.
This indicator is free. Feel free to leave comments with your feedback and improvement suggestions. If you like it, don't forget to add it to favorites and share! Happy trading!

Long-term KST (Know Sure Thing)Description
Long-term Know Sure Thing (KST) oscillator, specifically adapted for non-24h markets such as stocks, indices, ETFs and futures.
This version correctly scales the weekly ROC periods based on the actual trading week length and daily session duration of the instrument — making it accurate across different asset classes (European indices, US equities, crypto, etc.).
Key features:
• Fully customizable trading week (5 days for most stock markets, 7 days for crypto/24h markets)
• Customizable daily session length (8.5h for FTSE MIB/DAX, 6.5h for US equities, 24h for crypto/forex)
• Automatically adjusts bar count per week on any chart timeframe (including Weekly)
• Classic Martin Pring KST parameters (10/13/15/20 ROC weeks, 10/13/15/20 SMA weeks, 1-2-3-4 weighting)
• Includes signal line (SMA of KST) and visual fill between KST and signal (green/red)
What is the Long-term KST used for?
The KST (Know Sure Thing) is a momentum oscillator created by Martin Pring to detect major trend changes, confirm the primary trend direction, and identify significant reversals in medium- to long-term cycles (weeks to months).
Main practical uses:
• Major trend reversals: KST crossing above/below signal line
• Primary trend confirmation: KST above/below zero line
• Classic divergences: Price vs KST divergences often precede important tops/bottoms
• Cycle identification: Helps spot the end of multi-month corrections or the start of new bull/bear phases
• Trend-following filter: Stay long when KST > 0 and rising, stay short when KST < 0 and falling
It is especially powerful on major indices (FTSE MIB, DAX, SPX, NDX, RUT, CAC40, Nikkei…) because it captures institutional money flow with fewer, higher-quality signals compared to faster oscillators.
Best used on:
• Daily, 4H, Weekly charts
• European indices (FTSE MIB, DAX, IBEX…)
• US indices/ETFs (SPX, NDX, RUT…)
• Crypto pairs (set week_length=7, session_duration=24h)
Enjoy trading the big-picture momentum!

Global Sessions Pro NY/London/Tokyo - O/C/H/LGLOBAL SESSIONS PRO — NY / LONDON / TOKYO
Session Opens, Highs, Lows, Midpoints, Closes, Ranges & Killzones
OVERVIEW
Global Sessions Pro is a comprehensive session-mapping indicator designed for traders who rely on market structure, session context, and time-based behavior.
The indicator automatically plots New York, London, and Tokyo sessions, including:
• Session Open, High, Low, Midpoint, and Close
• Prior session levels projected forward
• Session range boxes
• Right-side labeled price levels (clearly identified)
• Stacked session summary labels (no overlap)
• Optional killzones and overlap windows
• Breakout alerts (prior or current session levels)
The script is fully timezone-aware, DST-safe, and works on any chart timeframe.
KEY FEATURES
SESSION MAPPING
For each session (NY / London / Tokyo), the indicator can display:
• Open
• High
• Low
• Midpoint (High + Low) / 2
• Close
Each level is drawn with its own horizontal line and optional right-side label, so there is never confusion about which line represents which level.
SESSION RANGE BOXES
Optional shaded boxes highlight the true session range as it develops in real time.
These are useful for visualizing:
• Compression vs expansion
• Relative session volatility
• Strength or weakness between sessions
Opacity and visibility are fully configurable.
RIGHT-SIDE LEVEL LABELS
Each session level can be labeled on the right edge of the chart, showing:
• Session name (NY / Lon / Tok)
• Level type (O / H / L / M / C)
• Optional price value
Examples:
NY H: 18234.25
Lon L: 18098.50
Tok M: 18142.75
This eliminates ambiguity when multiple session levels overlap or share similar colors.
SESSION SUMMARY LABELS (AUTO-STACKED)
At the top of each session range, an optional summary label displays:
• Session name
• Open / High / Low / Close
• Total range (points)
• Range in ticks
• ATR multiple
Summary labels are automatically stacked vertically using ATR-based or tick-based spacing, preventing overlap even when multiple sessions occur close together.
PRIOR SESSION LEVELS
The indicator can project prior session levels into the next session, including:
• Prior High and Low
• Optional prior Open, Close, and Midpoint
These levels are commonly used for:
• Support and resistance
• Liquidity sweeps
• Mean reversion
• Failed breakouts
Projection length is configurable and safely capped to comply with TradingView drawing limits.
KILLZONES AND SESSION OVERLAPS
Optional background shading highlights key institutional windows:
• London Open
• New York Open
• London / New York overlap
These zones help identify high-probability volatility windows and time-based trade filters.
All killzones respect the selected session timezone basis.
ALERTS
Built-in alerts are available for:
• Break of prior session high
• Break of prior session low
• Break of current session high
• Break of current session low
Alerts can be configured to trigger on wick or close.
Alert logic is written using precomputed crossover detection to ensure historical consistency and avoid missed or false alerts.
TIMEZONE AND SESSION HANDLING (IMPORTANT)
SESSION TIME BASIS OPTIONS
The indicator supports three session-time modes:
Market Local (DST-aware) – Recommended
• New York uses America/New_York
• London uses Europe/London
• Tokyo uses Asia/Tokyo
• Automatically adjusts for daylight saving time
UTC (Fixed)
• Sessions are interpreted strictly in UTC
• Best for crypto or non-DST workflows
• Requires manual adjustment during DST changes
Custom Timezone
• Define a single custom timezone for all sessions
This ensures sessions display correctly regardless of the chart’s timezone.
DEFAULT SESSION TIMES
(Default values assume Market Local (DST-aware) mode)
Tokyo: 09:00 – 15:00
London: 08:00 – 16:30
New York: 09:30 – 16:00
These defaults are optimized for cash and index trading.
FX traders may adjust session windows as needed.
BEST USE CASES
This indicator is particularly effective for:
• Index futures (ES, NQ, RTY, DAX, FTSE)
• Forex session-based strategies
• Time-based breakout systems
• Liquidity sweep and mean-reversion models
• London Open and New York Open trading
• Multi-session market context analysis
PERFORMANCE AND SAFETY NOTES
• All future-drawn objects are capped to comply with TradingView limits
• Crossover logic is evaluated every bar to prevent calculation drift
• Old session drawings are automatically culled to reduce chart clutter
• Works on all intraday and higher timeframes
RECOMMENDED SETTINGS
For most traders:
• Session Time Basis: Market Local (DST-aware)
• Show Open / High / Low / Midpoint: ON
• Prior Session Levels: ON
• Summary Labels: ON
• Killzones: ON
• Alerts: ON (Close-based)
FINAL NOTES
This indicator is designed to provide objective session structure without opinionated trade signals. It works best as a context layer combined with your own execution rules, confirmations, and risk management.
If you trade time, structure, and liquidity, this script provides the framework.

Long Short Trading System With TableSmart Trading System Pro is an advanced TradingView indicator designed for precision and clarity.
It combines Order Blocks, Liquidity Zones, EMA trend alignment, MACD, RSI, Volume, and ATR-based risk management to generate high-quality LONG / SHORT signals.
🔹 Clear trade direction
🔹 Smart entry, stop-loss & multi-level take-profit
🔹 Automatic risk/reward & leverage calculation
🔹 Clean visual dashboard for fast decision-making
Built for traders who value structure, confirmation, and risk control.
Best suited for crypto, forex, and indices on all timeframes.
Disclaimer:
This indicator is for educational and informational purposes only and does not constitute financial advice.
Trading involves risk, and past performance does not guarantee future results.
You are solely responsible for your trading decisions and outcomes.

SB A / A++ ALERT ENGINE (Alerts Only)SB A / A++ Alert Engine
Session-Based Level Rejection Strategy (Automation-Ready)
Overview
The SB A / A++ Alert Engine is a rules-based TradingView indicator designed to identify high-probability institutional-style reversal trades using Stacey Burke–inspired concepts such as previous day levels, session structure, opening ranges, and round numbers.
This tool is alerts-only by design, making it ideal for:
TradingView alerts
Webhook automation
Telegram / Discord signal delivery
External trade execution systems
It does not repaint and evaluates signals on confirmed bar close only.
---
Core Trading Idea
Price frequently reacts at important reference levels during active trading sessions.
This script looks for rejection + confirmation at those levels and grades setups based on confluence and candle quality.
Only A-grade and A++-grade setups are alerted.
---
What the Script Detects
📌 Key Levels (Confluence Engine)
Previous Day High / Low
Initial Balance (Mon–Tue range, active Wed–Fri)
Session Opening Range (first hour of London / NY)
Round Numbers (configurable tick spacing)
Each level touched contributes to confluence — without double-counting the same zone.
---
🕒 Session Control
Signals are only allowed during:
London Session
New York Session
Includes:
Session resets
Max alerts per session
Cooldown between signals
---
🔎 Candle Confirmation
Valid signals require clear rejection behavior, such as:
Bullish / Bearish Engulfing candle
Strong Pin Bar (wick ≥ 2× body)
---
🧠 Trade Grades
A Trade
Valid session
ATR percentile filter passed
≥ 1 level of confluence
Directional rejection
A++ Trade
All A-Trade rules
Strong confirmation candle (engulf or pin)
≥ 2 independent confluence zones
Grades are displayed visually and included in alert payloads.
---
📊 Volatility Filter (ATR Percentile)
Instead of fixed ATR thresholds, the script uses an ATR percentile rank, ensuring trades only trigger when volatility is above normal for that market.
This adapts automatically across:
Forex
Indices
Futures
Crypto
---
Visual Output
▲ Green / Lime triangles → LONG (A / A++)
▼ Orange / Red triangles → SHORT (A / A++)
Color intensity reflects trade grade
Optional session shading (if enabled)
---
Alerts & Automation
All alerts are webhook-ready and structured for automation.
Each alert includes:
Symbol
Timeframe
Direction (LONG / SHORT)
Trade grade (A or A++)
Confluence count
Entry price (close of signal bar)
Designed to integrate with:
Telegram bots
Trade execution bridges
Risk management engines
---
What This Script Is (and Is Not)
✅ IS
A high-quality signal engine
Non-repainting
Automation-friendly
Institutional level-based logic
❌ IS NOT
A scalping indicator
A prediction tool
A “trade every candle” system
This tool favors patience, structure, and quality over frequency.
---
Recommended Usage
Timeframes: M5 – M15
Best markets: FX majors, indices, liquid crypto
Combine with your own execution, risk, and trade management rules
---
⚠️ Disclaimer
This script is for educational and informational purposes only. It does not constitute financial advice. Always test on demo or paper trading before using live capital.

Multi-Fractal Trading Plan [Gemini] v22Multi-Fractal Trading Plan
The Multi-Fractal Trading Plan is a quantitative market structure engine designed to filter noise and generate actionable daily strategies. Unlike standard auto-trendline indicators that clutter charts with irrelevant data, this system utilizes Fractal Geometry to categorize market liquidity into three institutional layers: Minor (Intraday), Medium (Swing), and Major (Institutional).
This tool functions as a Strategic Advisor, not just a drawing tool. It calculates the delta between price and structural pivots in real-time, alerting you when price enters high-probability "Hot Zones" and generating a live trading plan on your dashboard.
Core Features
1. Three-Tier Fractal Engine The algorithm tracks 15 distinct fractal lengths simultaneously, aggregating them into a clean hierarchy:
Minor Structure (Thin Lines): Captures high-frequency volatility for scalping.
Medium Structure (Medium Lines): Identifies significant swing points and intermediate targets.
Major Structure (Thick Lines): Maps the "Institutional" defense lines where trend reversals and major breakouts occur.
2. The Strategic Dashboard A dynamic data panel in the bottom-right eliminates analysis paralysis:
Floor & Ceiling Targets: Displays the precise price levels of the nearest Support and Resistance.
AI Logic Output: The script analyzes market conditions to generate a specific command, such as "WATCH FOR BREAKOUT", "Near Lows (Look Long?)", or "WAIT (No Setup)".
3. "Hot Zone" Detection Never miss a critical test of structure.
Dynamic Alerting: When price trades within 1% (adjustable) of a Major Trend Line, the indicator’s labels turn Bright Yellow and flash a warning (e.g., "⚠️ WATCH: MAJOR RES").
Focus: This visual cue highlights the exact moment execution is required, reducing screen fatigue.
4. The Quant Web & Markers
Pivot Validation: Deep blue fractal markers (▲/▼) identify the exact candles responsible for the structure.
Inter-Timeframe Web: Faint dotted lines connect Minor pivots directly to Major pivots, visualizing the "hidden" elasticity between short-term noise and long-term trend anchors.
5. Enterprise Stability Engine Engineered to solve the "Vertical Line" and "1970 Epoch" glitches common in Pine Script trend indicators. This engine is optimized for Futures (NQ/ES), Forex, and Crypto, ensuring stability across all timeframes (including gaps on ETH/RTH charts).
Operational Guide
Consult the Dashboard: Before executing, check the "Strategy" output. If it says "WAIT", the market is in chop. If it says "WATCH FOR BOUNCE", prepare your entry criteria.
Monitor Hot Zones: A Yellow Label indicates price is testing a major liquidity level. This is your signal to watch for a rejection wick or a high-volume breakout.
Utilize the Web: Use the faint web lines to find "confluence" where a short-term pullback aligns with a long-term trend line.
Configuration
Show History: Toggles "Ghost Lines" (Blue) to display historical structure and broken trends.
Fractal Points: Toggles the geometric pivot markers.
Hot Zone %: Adjusts the sensitivity of the Yellow Warning system (Default: 1%).
Max Line Length: A noise filter that removes stale or "spiderweb" lines that are no longer statistically relevant.

Quant VWAP System 3.8 This is the lower-indicator companion to the "Quant VWAP System." While the main chart tells you where the price is, this oscillator tells you how statistically significant the move is.
It uses a Z-Score algorithm to normalize price action. This means it ignores dollar amounts and instead measures how many Standard Deviations (SD) the price is away from its mean (VWAP). This allows you to instantly spot "Overbought" or "Oversold" conditions on any asset (Bitcoin, Forex, or Stocks) without needing to guess.
Key Features:
1. Normalized Extremes (The "Kill Zones")
±2.0 SD: These dotted lines represent statistical extremes. When the signal line crosses above +2.0, the asset is mathematically expensive (Overbought). When it crosses below -2.0, it is mathematically cheap (Oversold).
The Logic: Price rarely sustains movement beyond 2 Standard Deviations without a reversion or a pause.
2. The Squeeze Radar (Yellow Dots)
Volatility Detection: A row of Yellow Dots appearing on the center line indicates a "Squeeze."
What it means: The Standard Deviation bands are compressing. Energy is building.
Warning: DO NOT trade Mean Reversion when you see Yellow Dots. A squeeze often leads to a violent breakout. Wait for the dots to disappear to confirm the direction of the explosion.
3. Momentum Coloring
Green Line: Z-Score is rising (Bullish Momentum).
Red Line: Z-Score is falling (Bearish Momentum).
This helps you spot divergences (e.g., Price makes a Higher High, but the Oscillator makes a Lower High = Exhaustion).
How to Trade with It
Strategy A: The "Zero Bounce" (Trend Continuation)
Scenario: You are in a Bull Trend.
Signal: The Oscillator line pulls back to the Zero Line (White), turns Green, and curls upward.
Meaning: Price has tested the average (VWAP) and buyers have stepped in. This is a high-probability entry for trend continuation.
Strategy B: The "Extreme Fade" (Reversion)
Scenario: The Oscillator pushes deep into the Red Zone (+2.0 SD).
Signal: The line turns Red and crosses back down below the +2.0 dotted line. A small Red Triangle will appear.
Meaning: The statistical extension has failed, and price is likely snapping back to the mean.
Strategy C: Squeeze Breakout
Scenario: Yellow Dots appear on the center line.
Action: Stop trading. Wait.
Signal: The dots disappear, and the line shoots aggressively through +1.0 SD (Long) or -1.0 SD (Short). Ride the momentum.

Witch-Fire ALMA signals: Dynamic Liquidity & Trend GlowThe Witch-Fire ALMA is a high-precision trend bias and liquidity mapping tool designed for price action traders and Smart Money practitioners. Unlike traditional indicators that clutter your chart with lagging signals, this script provides a "clean-yet-powerful" visual anchor to help you stay on the right side of the market while identifying key Points of Interest (POIs).
At its core, the script utilizes an optimized Arnaud Legoux Moving Average (ALMA). Known for its superior ability to balance smoothness and responsiveness, the ALMA effectively filters out market noise and "whipsaws" that often plague standard EMAs.
Key Features:
The Witch-Fire Glow: A neon-styled ALMA line that shifts between Bullish Green and Bearish Red. The white core provides surgical precision for price intersection, while the outer glow visualizes the strength and dominance of the current trend.
Scaled Liquidity Levels: Automatically maps Buy Side Liquidity (BSL) and Sell Side Liquidity (SSL). These levels are dynamic—they scale proportionally with your ALMA settings. This ensures that the liquidity zones you see are always relevant to the trend cycle you are analyzing.
Strategic Bias Background: A subtle background tint provides an instant psychological filter. Only look for Longs in the green zone and Shorts in the red zone to maintain a high-probability strike rate.
How to Trade with Witch-Fire:
Identify the Bias: Look at the Fire ALMA. If the "fire" is red and the price is below the line, your bias is strictly bearish.
Watch the Sweeps: Wait for the price to "sweep" (pierce with a wick) the horizontal SSL (Green) or BSL (Red) lines.
Execution: Look for a strong rejection candle (long wick, small body) at these levels that closes back towards the ALMA line.
Best Used On: 15m, 1H, and 4H timeframes. Works exceptionally well for Crypto, Forex, and Indices.

TRADING NAVIGATOR📘 TRADING NAVIGATOR OPERATIONS MANUAL
This manual is designed to turn the script into your complete trading plan.
1. The Golden Rule: Planetary Alignment
Success with this script is not about trading every signal, but waiting for the confluence. Golden Trick: Do not trade on low timeframes (15M) if the trend on the higher timeframe (4H or D) is contrary. The Master Signal: Enter when the RELIABILITY column marks "HIGH" on at least 3 consecutive timeframes.
2. How to open a LONG (Buy) position: Look for these exact conditions on the board: TREND: It should say "BULLISH" (Price above the 200 EMA). ACTION: It should be marked LONG. ENTRY: The price should be near or touching the value indicated in the SUPPORT column. RSI: Ideally between 35 and 45 (healthy pullback) or crossing above 30. Execution: Place your limit order at the ENTRY price on the chart. The TP and SL are your mandatory exit coordinates.
3. How to open a SHORT (Sell) position: Look for these exact conditions on the board: TREND: It should say "BEARISH" (Price below the 200 EMA). ACTION: It should be marked SHORT. ENTRY: The price should be near or touching the value indicated in the RESIST column. (Resistance). RSI: Ideally between 55 and 65 or crossing below 70. Execution: Limit order at the ENTRY price on the chart. Don't chase the price; let it rise to the resistance to enter.
4. Golden Tricks to Gain Consistency: The Volatility Filter: If the VOLAT column shows "HIGH," reduce your position size by half. High volatility means sharp movements that can hit your SL before reaching the TP. The Timeframe Jump: If you see a LONG position on the 15M chart but the trend on the D (Daily) chart is BEARISH, that trade is high risk (pure Scalping). If both are BULLISH, you have a "High Probability Trade." RSI as a sentinel: If the RSI is at 50, the market is indecisive. Wait for it to approach the extremes (30 or 70) so that the Navigator's ACTION has more rebound strength.
5. Recommended Markets:
The TRADING NAVIGATOR is a structure and volatility algorithm, so it works where there is liquidity: Market | Effectiveness | Why |
Cryptocurrencies | ⭐⭐⭐⭐⭐ ATR volatility is best exploited in BTC and ETH. |
Indices (Nasdaq/SP500) | ⭐⭐⭐⭐ Ideal for following the TREND column (EMA 200). |
Forex (Majors) | ⭐⭐⭐ Use it on high-volume pairs (EURUSD, GBPUSD). |
Gold / Oil | ⭐⭐⭐⭐ Very sensitive to the support and resistance levels calculated by the script. |
6. Risk Management (Psychology) | Accepts Stop Loss: The script calculates the SL at 2.0x ATR to give the price "breathing room". If it is touched, the structure has been broken. Don't move the Stop Loss. Partial Taking: When the price has moved 50% of the way to the Take Profit, move your Stop Loss to the ENTRY (Breakeven) price. This ensures that the trade can no longer result in losses.

SMA MAD Trend [Alpha Extract]A sophisticated trend identification system that combines Simple Moving Average with Mean Absolute Deviation methodology to create adaptive Super Trend-style bands with advanced strength filtering and gradient visualization. Utilizing ADX-based trend strength validation and slope analysis for signal quality enhancement, this indicator delivers institutional-grade trend detection with dynamic ATR-based ribbon visualization and comprehensive strength measurement. The system's dual-filter architecture eliminates false signals during weak or choppy market conditions while maintaining sensitivity to genuine trend establishment and reversal events.
🔶 Advanced SMA-MAD Band Construction
Implements innovative Mean Absolute Deviation calculation around Simple Moving Average baseline to create volatility-adaptive bands with ratcheting logic for trend persistence. The system calculates MAD by measuring absolute price deviations from the mean, then applies configurable multipliers to generate upper and lower bands that adjust to changing market conditions while preventing premature band violations.
// Core SMA-MAD Framework
SMA_Value = ta.sma(close, SMA_Length)
Mean = ta.sma(close, MAD_Length)
Abs_Deviation = abs(close - Mean)
MAD_Value = ta.sma(Abs_Deviation, MAD_Length)
// Adaptive Bands
Upper_Band = SMA_Value + MAD_Factor * MAD_Value
Lower_Band = SMA_Value - MAD_Factor * MAD_Value
🔶 Intelligent Dual-Filter System
Features comprehensive trend validation using ADX strength measurement and slope analysis to eliminate low-conviction signals during ranging or consolidating markets. The system calculates normalized slope strength using ATR scaling and combines with ADX threshold analysis, generating filtered trend states that distinguish genuine trends from temporary price fluctuations.
🔶 Dynamic Trend Strength Engine
Implements sophisticated strength calculation combining slope intensity and ADX readings to produce normalized 0-100% strength scores with gradient colour intensity modulation. The system normalizes slope by minimum threshold and ADX by configurable level, multiplying factors to create composite strength measurement that drives visual feedback intensity across all indicator elements.
🔶 Super Trend-Style Direction Logic
Utilizes classic Super Trend methodology adapted for SMA-MAD bands, where trend direction flips occur on opposite band violations with persistent state maintenance. The system tracks previous band levels with ratcheting behaviour that adjusts bands only when price movement or new calculations warrant changes, preventing oscillation during normal volatility.
🔶 ATR-Based Ribbon Visualization
Provides dynamic ribbon overlay using ATR-scaled width around the trend line with opacity modulation based on trend strength for intuitive conviction assessment. The system creates upper and lower ribbon bounds at configurable ATR multiples, filling the channel with gradient-adjusted transparency that increases during strong trends and fades during weak conditions.
🔶 Multi-Dimensional Visual Architecture
Provides complete chart integration through trend line overlay, ATR ribbon fills, candle colouring, background glow, and transition signal labels with configurable visibility toggles. The system enables traders to customize display density from minimal (trend line only) to comprehensive (all visual elements) while maintaining consistent colour scheme and strength-based intensity across components.
🔶 Slope Strength Validation
Calculates ATR-normalized slope over configurable lookback periods to measure trend line momentum and filter sideways price action. The system compares absolute slope against minimum threshold requirements, preventing trend signals when price movement relative to the trend line lacks sufficient directional conviction regardless of band position.
🔶 Signal Generation Framework
Generates trend change signals when filtered direction state transitions from bearish to bullish or vice versa, with label placement and alert integration. The system implements state persistence that maintains previous trend until both ADX and slope filters confirm directional change, reducing whipsaw signals while capturing genuine reversals with minimal lag.
🔶 Performance Optimization Framework
Utilizes efficient calculation methods with optimized variable management and configurable parameters for balance between responsiveness and stability. The system includes intelligent state tracking with NA handling for initial bars and smooth gradient calculations that maintain performance across extended historical periods and real-time updates.
This indicator delivers sophisticated trend identification through Mean Absolute Deviation methodology combined with dual-strength filtering for superior signal quality. Unlike traditional Super Trend indicators that rely solely on ATR bands, the SMA-MAD approach uses statistical deviation measurement while incorporating ADX strength and slope validation to eliminate false signals during choppy conditions. The system's gradient-based visual feedback, ATR ribbon visualization, comprehensive dashboard, and multi-dimensional filtering make it essential for traders seeking reliable trend-following approaches with clear conviction measurement across cryptocurrency, forex, and equity markets. The combination of adaptive bands, strength-based transparency, and intelligent filtering creates an institutional-grade trend system suitable for systematic trading strategies.

Gann Octave Pro - Angles & Time Cycles 🎯 Gann Octave Pro - Angles & Time Cycles
## Complete Gann Trading System - Price, Angles & Time in One Indicator
A professional-grade Gann analysis tool combining **Octave Price Levels**, **Gann Angles (1x1, 2x1, 1x2)**, and **Advanced Time Cycle Projections**. Perfect for traders seeking precision market timing through geometric confluence.
---
## 🌟 Key Features
### 📐 Octave Price Levels
- **5 Key Levels**: 0%, 25%, 50%, 75%, 100%
- **Color-Coded**: Green (support) → Blue (50% pivot) → Red (resistance) → Black (boundaries)
- **Dynamic Updates**: Auto-adjusts to swing structure
- **Trading Edge**: 50% level is the most powerful reversal zone
### 📏 Gann Angles
- **1x1 Angle** (Black) - Natural 45° trend line
- **2x1 Angle** (Red) - Steep acceleration zone
- **1x2 Angle** (Red) - Gradual support/resistance
- **Customizable Extension**: Fixed bars or % of swing length
### ⏰ Advanced Time Cycles
**Three Calculation Methods:**
1. **Angle-Level Confluence** ⭐ (Recommended)
- Calculates intersections of Gann angles with octave levels
- Most sophisticated timing system
- Based on price-time geometry
2. **Swing Duration** - Uses actual swing bar length
3. **Harmonic (Swing/8)** - Classic Gann harmonic division
**Cycle Visualization:**
- **Full Cycles** (Purple, solid) - Major turning points, labeled "◆ FC1 (176 bars) "
- **Sub-Cycles** (Blue, dotted) - Minor pivots, labeled "S1 "
- **Mid-Cycles** (Orange, dashed) - Half-cycle inflection points
- **Past Display**: Shows 4 complete past cycles for validation
- **Future Projection**: Projects 8 future cycles for anticipation
---
## 🎯 How to Use
### Quick Start
1. Apply to chart (works all timeframes/instruments)
2. Select period: Default 44 bars (adjust based on timeframe)
3. Choose cycle method: "Angle-Level Confluence" for best results
4. Observe past cycles to validate timing accuracy
### Trading Strategies
**Triple Confluence Setup** (Highest Probability)
- Price at octave level (especially 50%)
- Price touches Gann angle (1x1 most reliable)
- Time cycle arrives (full cycle preferred)
- **Entry**: On confluence | **Stop**: Below/above octave level | **Target**: Next level
**Cycle Anticipation**
- Enter 1-2 bars before cycle line if price at octave level
- Exit at next cycle or target octave level
- **Edge**: Anticipate cycles instead of reacting
**Angle Breakout + Cycle**
- Price breaks 1x1 angle + next cycle within 20 bars
- Hold through cycle, exit at 2x1 angle or next major level
---
## ⚙️ Customization
### Period Selection (88-Based)
11 harmonic options: 3, 6, 11, 22, **44**, 88, 176, 352, 704, 1408, 2816 bars
- **Intraday** (15m-1h): Period 3-4
- **Swing Trading** (4h-Daily): Period 4-5
- **Position Trading** (Daily-Weekly): Period 5-6
### Visual Controls
- **Colors**: Independent for all elements
- **Line Widths**: Separate controls (1-5) for levels, angles, cycles
- **Label Size**: Tiny/Small/Normal/Large (unified)
- **Label Position**: Top/Middle/Bottom
- **Show/Hide**: Toggle any component
### Alerts
- 50% octave level breakouts
- Customizable messages
---
## 💡 Pro Tips
1. **Validate First**: Observe 2-3 past cycles before trading
2. **Adjust to Volatility**: High volatility = lower period (22-44), Low = higher (88-176)
3. **Multiple Timeframes**: Apply on different timeframes for confirmation
4. **Respect 50% Level**: Most powerful reversal zone in Gann theory
5. **Focus on Full Cycles**: Highest probability setups (◆ FC markers)
6. **Combine with Price Action**: Indicator shows WHERE/WHEN, price action shows HOW
---
## 🚀 What Makes It Unique
✅ **Intelligent Confluence Cycles** - Unique angle-level intersection calculation
✅ **Historical Validation** - See past cycles to trust future projections
✅ **Professional Design** - Color-coded hierarchy, clean labels, no clutter
✅ **Complete Automation** - Everything updates in real-time
✅ **Three-Dimensional Analysis** - Price + Angles + Time = complete picture
---
## 📊 Best Markets
- Stock indices (S&P 500, NASDAQ, Dow)
- Forex majors (EUR/USD, GBP/USD, USD/JPY)
- Commodities (Gold, Silver, Oil)
- Crypto (BTC, ETH)
- Liquid stocks
✅ Complete Gann system (price + angles + time)
✅ 3 time cycle methods
✅ Auto swing detection
✅ 4 past + 8 future cycle projections
✅ Professional visualization
✅ Extensive customization
✅ Real-time alerts
✅ Works all markets/timeframes
---
## ⚠️ Disclaimer
This indicator is for educational purposes and applies W.D. Gann methodology principles. Not financial advice. Always use proper risk management, position sizing, and stop losses. Practice on paper before live trading. Past performance doesn't guarantee future results.
---
**The market moves in patterns of price and time. This indicator helps you see them.**
Trade with geometry. Trade with time. Trade with confidence.

Candles by Day of WeekCandles by Day of Week
Candles by Day of Week (INLINE) is a lightweight visual indicator that colors price candles based on the day of the week.
It helps traders quickly recognize weekly patterns, market behavior differences, and day-specific tendencies directly on the chart.
🔹 Key Features
Candle coloring for Monday through Sunday
Enable or disable each weekday individually
Custom color selection for every day
Day enable toggle and color input are combined in one line for cleaner settings
Uses barcolor() — no candle shifting or overlay issues
Compatible with all markets: Forex, Crypto, Stocks, Indices
Works on all timeframes
🔹 How It Works
The indicator detects the day of the week for each candle and applies the selected color if that day is enabled.
Disabled days keep the chart’s default candle colors unchanged.
This approach ensures:
No interference with price data
No displacement from the main chart
Full compatibility with other indicators
🔹 Practical Use
Analyze weekday-based market behavior
Spot recurring patterns or volatility by day
Improve discretionary and session-based strategies
Enhance chart readability and visual clarity
🔹 Notes
Saturday and Sunday candles are mainly relevant for Crypto markets
Forex traders may choose to disable weekend days
The indicator is purely visual and does not affect calculations or signals
🔹 Customization
All settings can be adjusted in the indicator’s Inputs:
Toggle individual days on or off
Select custom candle colors per day
Instantly adapt the indicator to your trading style
🔹 Disclaimer
This indicator is intended for visual analysis only and should be used as a supportive tool alongside other forms of technical analysis.
It does not provide buy or sell signals.

Elite Monday Range V3- ProfessionalElite Monday Range V3 - Advanced Institutional Bias & Analysis
Overview
The Elite Monday Range V3 is a high-performance decision-support tool designed for traders who utilize the "Weekly Open" and "Monday's Range" as their primary benchmark for the trading week. Unlike standard range indicators, this script employs an advanced Multi-Asset Analysis Engine to determine the weekly bias with institutional-grade precision.
It doesn't just draw lines; it analyzes Previous Week's Close (PWC), Monday's Candle Structures (Price Action), and Internal Liquidity to provide a definitive "Directional Bias" and "Confidence Score."
Key Features
Smart Multi-Asset Detection: Automatically detects if you are trading Forex, Crypto, or Indices and adjusts its internal logic and strategy suggestions accordingly.
Institutional Bias Engine: Calculates a Confidence Score (from -4 to +4) based on 4 critical criteria:
Price vs. Previous Week Close: Checks if the bulls or bears are maintaining momentum from the prior week.
Monday Candle Analysis: Automatically identifies Pin Bars (Liquidity Grabs) or Strong Engulfing movements.
Price vs. Monday Midpoint (Equilibrium): The ultimate pivot point for weekly trend direction.
Price vs. Weekly Open: Tracks the "true" opening sentiment.
Liquidity Hunt Signals (Judas Swing): Visual alerts for LIQ BUY and LIQ SELL when price sweeps Monday's extremes and returns inside the range—a classic sign of institutional manipulation before a trend.
Symmetric Expansion Levels: Projects +50%, +100%, -50%, and -100% extensions of the Monday range to identify high-probability Take Profit (TP) and reversal zones.
Dynamic Professional Dashboard: A sleek, real-time table on your chart that summarizes Asset Type, Weekly Bias, Candle Info, and the Confidence Score.
Force Overlay Technology: Ensures all lines and labels remain visible and crisp on the top layer, above candles and other indicators.
How to Trade with the Elite Dashboard
Check the "Net Weekly Bias": Look for STRONG BULL or STRONG BEAR.
Verify Confidence Score: A score of 3 or 4 (or -3/-4 for shorts) indicates high-probability conditions.
Identify Entry: If the Bias is "STRONG BULL," wait for a retest of the Monday Mid (MID) or Monday High (MON H).
Confirm with Liquidity: Look for a LIQ BUY signal near the Monday Low for the highest-quality "A+ Setup."
Target: Use the Expansion Levels (+50% / +100%) as your primary targets for the week.
Technical Settings
Lookback Weeks: Choose exactly how many historical weeks to display to keep your chart clean.
Customizable Colors: Fully adjustable colors for Monday ranges and expansion projections.
Line Width: User-defined thickness for professional visual clarity.

EMA and Dow Theory Strategies V2📘 Overview
This strategy is an advanced evolution of the original EMA × Dow Theory hybrid model. V2 introduces true swing‑based trend detection, gradient trend‑zones, higher‑timeframe swing overlays, and dynamic exit logic designed for intraday to short‑term trading across crypto, forex, stocks, and indices.
The system provides precise entries, adaptive exits, and highly visual guidance that helps traders understand trend structure at a glance.
🧠 Key Features
🔹 1. Dual‑EMA Trend Logic (Symbol + External Index)
Both the chart symbol and an external index (OTHERS.D) are evaluated using fast/slow EMAs to determine correlation‑based trend bias.
🔹 2. Dow Theory Swing Detection (Real‑time)
The script identifies swing highs/lows and updates trend direction when price breaks them. This creates a structural trend model that reacts faster than EMAs alone.
🔹 3. Gradient Trend Zones (Visual Trend Strength)
When trend is up or down, the area between price and the latest swing level is filled with a multi‑step gradient. This makes trend strength and distance-to-structure visually intuitive.
🔹 4. Higher‑Timeframe Swing Trend (htfTrend)
Swing highs/lows from a higher timeframe (e.g., 4H) are plotted to show macro structure. Used only for visual context, not for filtering entries.
🔹 5. RSI‑Based Entry Protection
RSI prevents entries during extreme overbought/oversold conditions.
🔹 6. Dynamic Exit System
Includes:
Custom stop‑loss (%)
Partial take‑profit (TP1/TP2/TP3)
Automatic scale‑out when trend color weakens
“Color‑change lockout” to prevent immediate re‑entry
Real‑time PnL tracking and labels
🔹 7. Alerts for All Key Events
Entry, stop‑loss, partial exits, and trend‑change exits all generate structured JSON alerts.
🔹 8. Visual PnL Labels & Equity Tracking
PnL for the latest trade is displayed directly on the chart, including scale‑out adjustments.
⚙️ Input Parameters
Parameter Description
Fast EMA / Slow EMA EMAs used for symbol trend detection
Index Fast / Slow EMA EMAs applied to external index
StopLoss (%) Custom stop‑loss threshold
Scale‑Out % Portion to exit when trend color weakens
RSI Period / Levels Overbought/oversold filters
Swing Detection Length Bars used to detect swing highs/lows
Stats Display Position of statistics table
🧭 About htfTrend (Higher Timeframe Trend)
The higher‑timeframe swing trend is displayed visually but not used for entry logic.
Why? Strict HTF filtering reduces trade frequency and often removes profitable setups. By keeping it visual‑only, traders retain flexibility while still benefiting from macro structure awareness.
Use it as a contextual guide, not a constraint.
📘 概要
本ストラテジーは、V1 を大幅に拡張した EMA × ダウ理論 × スイング構造 × 上位足トレンド可視化 の複合型モデルです。 短期〜デイトレード向けに最適化されており、仮想通貨・FX・株式・指数など幅広いアセットで利用できます。
V2 では、スイング構造の自動検出、グラデーションによるトレンド強度の可視化、上位足スイングライン、動的な利確/損切りロジック が追加され、視覚的にもロジック的にも大幅に強化されています。
🧠 主な機能
🔹 1. 銘柄+外部インデックスの EMA クロス判定
対象銘柄と OTHERS.D の EMA を比較し、相関を考慮したトレンド方向を判定します。
🔹 2. ダウ理論に基づくスイング高値・安値の自動検出
スイング更新によりトレンド方向を切り替える、構造ベースのトレンド判定を採用。
🔹 3. グラデーション背景によるトレンド強度の可視化
スイングラインから現在価格までを段階的に塗り分け、 「どれだけトレンドが伸びているか」を直感的に把握できます。
🔹 4. 上位足スイングトレンド(htfTrend)の表示
4H などの上位足でのスイング高値・安値を表示し、 大局的なトレンド構造を視覚的に把握できます(ロジックには未使用)。
🔹 5. RSI による過熱・売られすぎフィルター
極端な RSI 状態でのエントリーを防止。
🔹 6. 動的イグジットシステム
カスタム損切り(%)
TP1/TP2/TP3 の段階的利確
トレンド色の弱まりによる自動スケールアウト
色変化後の再エントリー制限(waitForColorChange)
リアルタイム PnL の追跡とラベル表示
🔹 7. アラート完備(JSON 形式)
エントリー、損切り、部分利確、トレンド反転などすべてに対応。
🔹 8. 損益ラベル・統計表示
直近トレードの損益をチャート上に表示し、視覚的に把握できます。
⚙️ 設定項目
設定項目名 説明
Fast / Slow EMA 銘柄の EMA 設定
Index Fast / Slow EMA 外部インデックスの EMA 設定
損切り(%) カスタム損切りライン
部分利確割合 トレンド弱化時のスケールアウト割合
RSI 期間・水準 過熱/売られすぎフィルター
スイング検出期間 スイング高値・安値の検出に使用
統計表示位置 テーブルの表示位置
🧭 上位足トレンド(htfTrend)について
上位足スイングの更新に基づくトレンド判定を表示しますが、 エントリー条件には使用していません。
理由: 上位足を厳密にロジックへ組み込むと、トレード機会が大幅に減るためです。
本ストラテジーでは、 「大局の把握は視覚で、エントリーは柔軟に」 という設計思想を採用しています。
→ 裁量で利確判断や逆張り回避に活用できます。

Trinity Swing Trading Buy and SellThis is a simple little Heiken Ashi MA + ADX & MACD trend-following trading system designed to capture medium- to longer-term moves while filtering out noise and weak trends. It combines modified Heiken Ashi candles (for smoother trend detection) with a moving average alignment, plus optional confirmation from ADX (trend strength) and MACD (momentum).
In practice, the indicator works well on higher timeframes (e.g., 1H, 4H, daily) where trends are more sustained. It performs best in trending markets and naturally avoids choppy/range-bound conditions thanks to the ADX filter (requiring ADX > 20 by default). All key components are fully customizable, so you can disable filters or adjust parameters to suit different instruments (stocks, forex, crypto, futures).
Default settings are:
16 HMA
8,17,9 MACD
15,20 ADX
Recommend to add an additional longer term EMA like 200 for long term trend confirmation.
Adjust inputs in the settings panel as needed:
Toggle MA, ADX, or MACD filters on/off.
Change MA type/length, MACD parameters, ADX threshold
- Use the visual blue diamonds (below bars) for long entries and purple diamonds (above bars) for short entries as confirmation of signals.
- Set alerts on the "Buy Alert" and "Sell Alert" conditions if you want real-time notifications.
This setup gives you a complete, rule-based system that avoids emotional trading and repetitive entries, making it suitable for both backtesting and live trading with proper risk management.

S_Sigma HTF Candles (UTC Draw / NY Labels)🕯️ S_Sigma HTF Candles (UTC Draw / NY Labels)
Multi-Timeframe Overlay with Session Labels & Imbalances
S_Sigma HTF Candles is a powerful, non-repainting overlay indicator that allows you to visualize up to 6 different Higher Timeframes (HTF) directly on your current chart.
Designed specifically for traders who need context without switching tabs, this tool draws accurate HTF candles using UTC time (standard for Crypto) while labeling them with New York Timezone data (standard for Stocks/Forex). It also detects Fair Value Gaps (FVG) and Volume Imbalances automatically.
🌟 Key Features
📊 6 Independent HTF Slots
Configure up to 6 different timeframes simultaneously (e.g., 15m, 1H, 4H, 1D, 1W). Each slot is customizable and can be toggled on/off independently.
🌍 UTC Drawing + NY Labels (The "Sigma" Edge)
Drawing: Candles are calculated strictly using UTC time to ensure wicks and bodies match exchange data (perfect for BTC/ETH).
Labels: Day of the Week (Mon/Tue/Wed) and Time labels are converted to America/New_York time. Never get confused by candle closes again.
#HTF Countdown Timer**
See exactly how much time is left until the Higher Timeframe candle closes. Essential for timing entries at the "Candle Close."
📈 Smart Imbalance Detection
FVG (Fair Value Gaps): Automatically highlights 3-candle reversal gaps.
VI (Volume Imbalance): Highlights wicks that pierce previous bodies.
🏗️ Custom Session Starts
Don't like the standard Daily candle? Force the Daily candle to open at 08:30 NY or 09:30 NY (Market Open) instead of Midnight UTC.
⚙️ Customization Options
Visuals: Full control over Bull/Bear colors, borders, wicks, and opacity.
Layout: Adjust padding, width, and spacing between timeframes to prevent overlap.
Trace Lines: Optional lines tracing the Open, High, Low, and Close of the forming HTF candle.
Labels: Toggle HTF names, Timers, and Day-of-Week labels on/off.
💡 How to Use
Add to Chart: The indicator draws candles to the right of the current price (offset) to keep your chart clean.
Check Alignment: Ensure the "Daily Name" matches your expected market session (NY Time).
Spot Entries: Look for price entering an FVG (Gray box) or hitting a HTF Support/Resistance level (Wick of the HTF candle).
Time Entries: Wait for the Timer to hit 00:00 for a confirmed candle close.
Perfect for: Smart Money Concepts (SMC), ICT, Wyckoff, and Multi-Timeframe Analysis.

ORB Breakout & RetestORB Breakout & Breakdown Indicator - Complete Opening Range Strategy
Description :
The ORB (Opening Range Breakout) Breakout & Retest Indicator is a simple tool designed to identify opening range breakouts and breakdowns with retest confirmation. This indicator works on ANY timeframe while automatically analyzing 1-minute price action to detect precise entry signals.
What makes this indicator unique:
- ✅ Multi-Timeframe ORB Analysis - Simultaneously tracks 5-min, 15-min, and 30-min opening ranges
- ✅ Smart Retest Logic - Filters false breakouts by requiring price to retest and confirm the level
- ✅ Works on Any Chart Timeframe - View on 5-min, 15-min, 1-hour, or daily charts while getting 1-minute precision
- ✅ Both Long & Short Signals - Detects bullish breakouts AND bearish breakdowns
- ✅ Customizable Alerts - Get notified when confirmed setups occur
- ✅ Clean Visual Display - Compact table showing all ORB levels and signal status
How it Works:
Opening Range Detection :
- 5-Min ORB: Captures high/low from 9:30-9:35 AM
- 15-Min ORB: Captures high/low from 9:30-9:45 AM
- 30-Min ORB: Captures high/low from 9:30-10:00 AM
Breakout Confirmation (3-Step Process) :
1. Initial Break - Price closes above ORB High (or below ORB Low for shorts)
2. Retest - Price pulls back to retest the broken level
3. Confirmation - Price breaks through again, confirming the trend
This retest requirement dramatically reduces false signals and helps you enter trades with better risk/reward.
Perfect For :
- Day traders looking for opening range strategies
- Scalpers who need precise entry signals
- Swing traders identifying strong intraday momentum
- Anyone trading stocks, futures, forex, or crypto during market hours
---
⚙️ Settings & Customization :
Display Options :
- ☑️ Show ORB High (Default: OFF) - Display the high of each opening range in the table
- ☑️ Show ORB Low (Default: OFF) - Display the low of each opening range in the table
- ☑️ Show Breakout+Retest (Default: ON) - Show bullish breakout confirmation status
- ☑️ Show Breakdown+Retest (Default: ON) - Show bearish breakdown confirmation status
Alert Options :
- ☑️ Enable 5-Min Alerts (Default: OFF) - Get alerts for 5-minute ORB confirmations
- ☑️ Enable 15-Min Alerts (Default: OFF) - Get alerts for 15-minute ORB confirmations
- ☑️ Enable 30-Min Alerts (Default: OFF) - Get alerts for 30-minute ORB confirmations
Visual Indicators :
- Green triangles (▲) below bars = Breakout confirmed (bullish)
- Red triangles (▼) above bars = Breakdown confirmed (bearish)
- Triangle sizes: Tiny (5-min), Small (15-min), Normal (30-min)
---
Table Legend:
Timeframe Row: Shows the three ORB periods being tracked
ORB High Row: (Optional) The highest price during each opening range period
ORB Low Row: (Optional) The lowest price during each opening range period
Breakout+Retest Row:
- 🟢 YES = Bullish setup confirmed (price broke high, retested, and confirmed)
- 🔴 NO = No confirmed bullish setup yet
- ⚪ N/A = Opening range not yet established
Breakdown+Retest Row:
- 🟢 YES = Bearish setup confirmed (price broke low, retested, and confirmed)
- 🔴 NO = No confirmed bearish setup yet
- ⚪ N/A = Opening range not yet established
How to Use :
1. Add to Chart - Works best on stocks, futures, and indices with regular market hours (9:30 AM EST open)
2. Choose Your Timeframe - View on any timeframe; indicator automatically analyzes 1-minute data
3. Monitor the Table - Watch for "YES" signals in Breakout or Breakdown rows
4. Set Alerts - Enable alerts for your preferred ORB timeframes
5. Plan Your Trade - Use ORB levels as entry points and initial stop-loss levels
Tips :
- Combine multiple timeframe confirmations for higher probability setups
- Use ORB High/Low levels as natural support/resistance zones
- The 5-min ORB gives faster signals; 30-min ORB gives stronger trends
- Best results typically occur in the first 1-2 hours after market open
- Works on all markets but optimized for regular trading hours (9:30 AM EST)
Key Features Summary :
✓ Multi-timeframe opening range tracking (5, 15, 30-minute)
✓ Retest confirmation logic to filter false breakouts
✓ Works on any chart timeframe with 1-minute precision
✓ Bullish and bearish signal detection
✓ Customizable visual display with toggle options
✓ Individual alerts for each timeframe and direction
✓ Clean, professional table interface
✓ No repainting - signals are final once confirmed
✓ Suitable for all experience levels

ITCP ATR BB RSI Stoch SignalsThis indicator generates BUY/SELL signals when price stretches outside Bollinger Bands during elevated volatility, confirmed by RSI, a Stochastic crossover, and a volume filter. To reduce counter-trend entries, it applies a macro trend filter using the Daily SMA 200: it looks for longs only above the SMA 200 and shorts only below it.
It tends to perform best in Forex, especially on liquid pairs, because market conditions (liquidity, continuous sessions, and relatively stable spreads on major pairs) often suit this confirmation-based approach. That said, it can be adapted to other markets (indices, commodities, or crypto) by tuning parameters such as Bollinger length/deviation, RSI/Stoch thresholds, and ATR settings (multipliers/factors) to fit the asset’s volatility.
It also plots ATR-based stop-loss reference levels (configurable smoothing) and includes webhook-ready alerts with a JSON payload (action, symbol, price, stop_loss, time, and interval) for external automation. The goal is to support rules-based execution and reduce impulsive trades: if conditions don’t align, there’s no signal.
If you manage to improve it, discover better settings, or build a more robust solution inspired by this, I’d really appreciate it if you share it back (even if it’s just feedback or an idea). I’m open to collaborating and iterating together to create stronger versions over time.

Razzere Cloned! V.8.1The foreign exchange market (forex, FX, or currency market) is a global decentralized or over-the-counter (OTC) market for the trading of currencies. This market determines foreign exchange rates for every currency. By trading volume, it is by far the largest market in the world, followed by the credit market.
The main participants are the larger international banks. Financial centres function as anchors of trading between a range of multiple types of buyers and sellers around the clock, with the exception of weekends. As currencies are always traded in pairs, the market does not set a currency's absolute value, but rather determines its relative value by setting the market price of one currency if paid for with another. Example: 1 USD is worth 1.1 Euros or 1.2 Swiss Francs etc. The market works through financial institutions and operates on several levels. Behind the scenes, banks turn to a smaller number of financial firms known as "dealers", who are involved in large quantities of trading. Most foreign exchange dealers are banks, so this behind-the-scenes market is sometimes called the "interbank market". Trades between dealers can be very large, involving hundreds of millions of dollars. Because of the sovereignty issue when involving two currencies, Forex has little supervisory entity regulating its actions. In a typical foreign exchange transaction, a party purchases some quantity of one currency by paying with some quantity of another currency.
