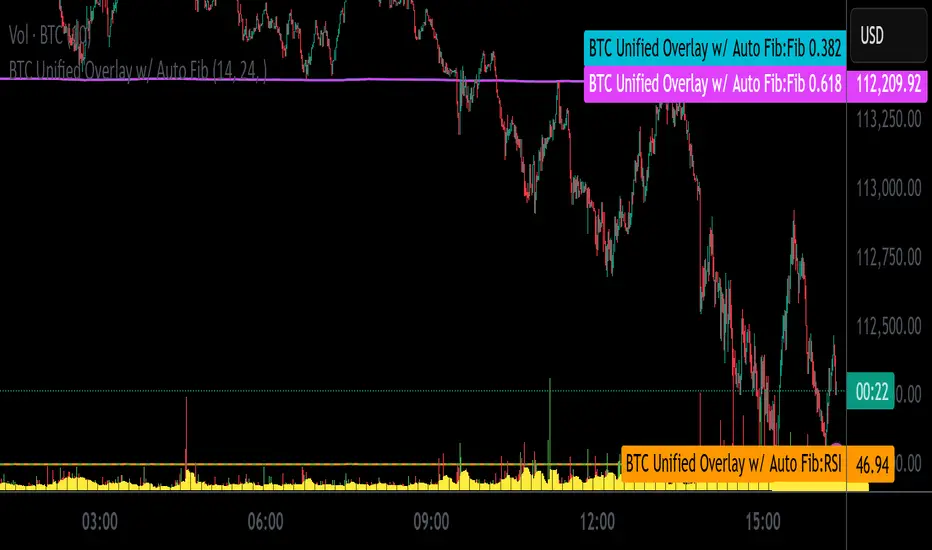
BTC Unified Overlay w/ Auto FibBTC Unified Overlay w/ Auto Fib, RSI, VWAP & Volume
This overlay combines essential indicators into one visual script designed for Bitcoin (BTCUSD) trading on lower timeframes:
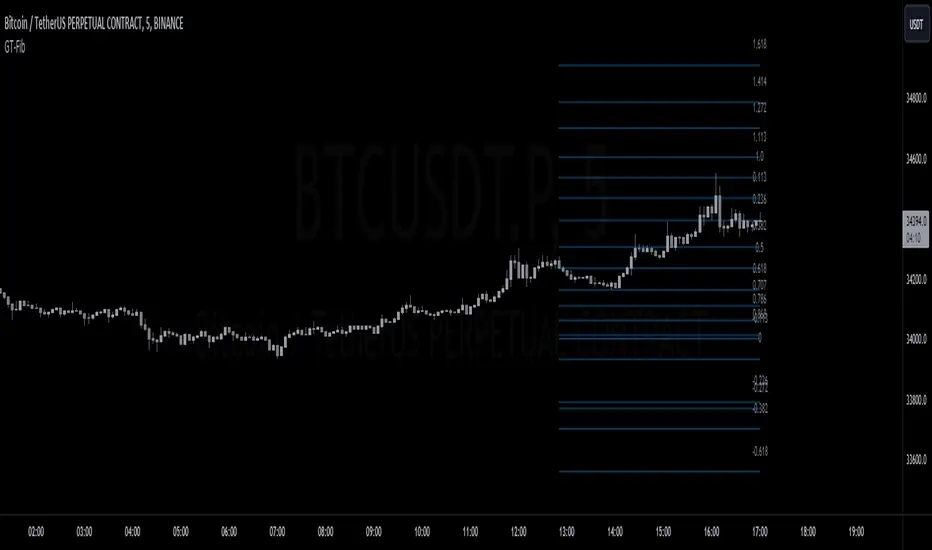
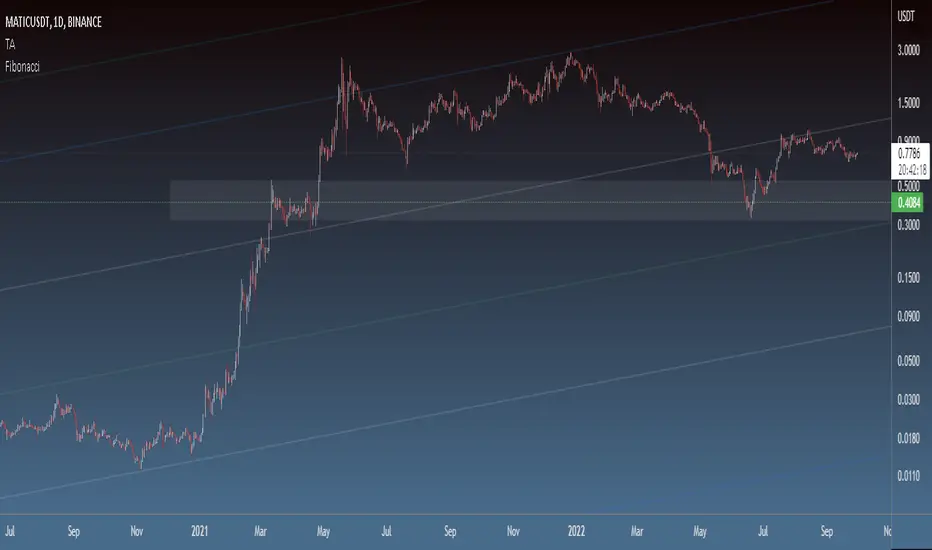
🔁 Auto Fibonacci Zones – Auto-detects 0.382 and 0.618 retracement levels using recent price swings
🎯 RSI(14) – Includes cluster and crossover tagging for overbought/oversold zones
📊 Volume Histogram with 10-bar Moving Average – Highlights breakout bars
📏 VWAP with ±1SD and ±2SD Bands – Shows dynamic fair value range
🟢 Breakout Signal Tagging – Detects high-volume breakout opportunities
Ideal for traders who want a unified, color-coded visualization of key momentum and structure indicators.
Script optimized for screenshot automation and compatible with external webhook pipelines.
Pine Script® Indikator