Intraday Macro & Flow Indicator# IntraMacroFlow Indicator
## Introduction
IntraMacroFlow is a volume and delta-based indicator that identifies significant price movements within trading sessions. It generates signals when volume spikes coincide with quality price movement, filtered by RSI to avoid overbought/oversold conditions.
> **Note:** This indicator provides multiple signals and should be combined with additional analysis methods such as support/resistance, trend direction, and price action patterns.
## Inputs
### Volume Settings
* **Volume Lookback Period** (14) - Number of bars for volume moving average calculation
* **Volume Threshold Multiplier** (1.5) - Required volume increase over average to generate signals
* **Delta Threshold** (0.3) - Required close-to-open movement relative to bar range (higher = stronger movement)
### Session Configuration
* **Use Dynamic Session Detection** (true) - Automatically determine session times
* **Highlight Market Open Period** (true) - Highlight first third of trading session
* **Highlight Mid-Session Period** (true) - Highlight middle portion of trading session
* **Detect Signals Throughout Whole Session** (true) - Find signals in entire session
* **Session Time** ("0930-1600") - Trading hours in HHMM-HHMM format
* **Session Type** ("Regular") - Select Regular, Extended, or Custom session
### Manual Session Settings
Used when dynamic detection is disabled:
* **Manual Session Open Hour** (9)
* **Manual Session Open Minute** (30)
* **Manual Session Open Duration** (60)
* **Manual Mid-Session Start Hour** (12)
* **Manual Mid-Session End Hour** (14)
## How It Works
The indicator analyzes each bar using three primary conditions:
1. **Volume Condition**: Current volume > Average volume × Threshold
2. **Delta Condition**: |Close-Open|/Range > Delta threshold
3. **Time Condition**: Bar falls within configured session times
When all conditions are met:
* Bullish signals appear when close > open and RSI < 70
* Bearish signals appear when close < open and RSI > 30
## Display Elements
### Shapes and Colors
* Green triangles below bars - Bullish signals
* Red triangles above bars - Bearish signals
* Blue background - Market open period
* Purple background - Mid-session period
* Bar coloring - Green (bullish), Red (bearish), or unchanged
### Information Panel
A dynamic label shows:
* Current volume relative to average (Vol)
* Delta value for current bar (Delta)
* RSI value (RSI)
* Session status (Active/Closed)
## Calculation Method
```
// Volume Condition
volumeMA = ta.sma(volume, lookbackPeriod)
volumeCondition = volume > volumeMA * volumeThreshold
// Delta Calculation (price movement quality)
priceRange = high - low
delta = math.abs(close - open) / priceRange
deltaCondition = delta > deltaThreshold
// Direction and RSI Filter
bullishBias = close > open and entrySignal and not (rsi > 70)
bearishBias = close < open and entrySignal and not (rsi < 30)
```
## Usage Recommendations
### Suitable Markets
* Equities during regular trading hours
* Futures markets
* Forex during active sessions
* Cryptocurrencies with defined volume patterns
### Recommended Timeframes
* 1-minute to 1-hour (optimal: 5 or 15-minute)
### Parameter Adjustments
* For fewer but stronger signals: increase Volume Threshold (2.0+) and Delta Threshold (0.4-0.6)
* For more signals: decrease Volume Threshold (1.2-1.5) and Delta Threshold (0.2-0.3)
### Usage Tips
* Combine with trend analysis for higher-probability entries
* Focus on signals occurring at session boundaries and mid-session
* Use opposite signals as potential exit points
* Configure alerts to receive notifications when signals occur
## Additional Notes
* RSI parameters are fixed at 14 periods with 70/30 thresholds
* The indicator handles overnight sessions correctly
* Fully compatible with TradingView alerts
* Customizable visual elements
## Release Notes
Initial release: This is a template indicator that should be customized to suit your specific trading strategies and preferences.
In den Scripts nach "entry" suchen

Money Flow Indicator (Chaikin Oscillator) with VWAPStrategy Overview
Entry Conditions:
Buy Entry:
The Chaikin Oscillator crosses above the signal line.
The current price is above the VWAP.
Sell Entry:
The Chaikin Oscillator crosses below the signal line.
The current price is below the VWAP.
Exit Conditions:
Profit Taking:
Take profit when a target profit is reached (e.g., a 2% increase from the entry price).
Stop Loss:
Set a stop loss, for example, at a 1% decline from the entry price.
Risk Management:
Manage risk by limiting each trade to no more than 1-2% of the account balance.
Calculate position size based on risk and trade accordingly.
Trend Confirmation:
Use other indicators (like moving averages) to confirm the overall trend and focus trades in the direction of the trend.
In an uptrend, prioritize buy entries; in a downtrend, prioritize sell entries.
Specific Trade Scenarios
Example 1: Buy Entry:
Enter a buy position when the Chaikin Oscillator crosses above the signal line and the price is above the VWAP.
Set a stop loss 1% below the entry price and a profit target 2% above the entry price.
Example 2: Sell Entry:
Enter a sell position when the Chaikin Oscillator crosses below the signal line and the price is below the VWAP.
Set a stop loss 1% above the entry price and a profit target 2% below the entry price.
Additional Considerations
Backtesting: Test this strategy with historical data to evaluate performance and make adjustments as needed.
Market Conditions: Pay attention to market volatility and economic indicators, adjusting the trading strategy flexibly.
Psychological Factors: Avoid emotional decisions and follow clear rules when trading.

Candlestick Pattern Detector - Vijay PrasadOverview:
This Pine Script v6 indicator is designed to detect and label key candlestick patterns on TradingView charts. It provides real-time visual markers for major bullish and bearish reversal signals, aiding traders in decision-making.
Usefulness:
✅ Saves time by automating candlestick pattern detection.
✅ Reduces manual chart analysis errors.
✅ Works across all markets & timeframes.
✅ Enhances trading strategies with accurate signals.
Candlestick Patterns Recognises:
Bullish Engulfing – A strong bullish reversal pattern.
Bearish Engulfing – Indicates a potential downtrend.
Hammer – Suggests a market bottom or reversal.
Shooting Star – A bearish reversal signal at the top of an uptrend.
Doji – Signals market indecision and possible trend change.
Key Functions:
Automated Pattern Visible
Identifies candlestick patterns dynamically and plots them on the chart.
Visual Labels for Patterns
Labels to indicate specific candlestick formations.
Labels appear only when a valid pattern is detected, avoiding unnecessary clutter.
Buy/Sell Signal
Plots buy signals at bullish patterns and sell signals at bearish patterns.
Helps traders recognize trend reversals and entry/exit points.
Bullish Engulfing Pattern (Green Label)
What it means: A bullish engulfing pattern typically signals a potential reversal from a downtrend to an uptrend. The current candle fully engulfs the previous candle, signaling strong buying interest.
Identifying Candlestick Patterns on the Chart
How to use it:
Entry: Look for a green label (bullish engulfing) at the bottom of the chart. When it appears, consider entering a long position (buy).
Confirmation: To increase reliability, wait for confirmation by observing if price moves above the high of the bullish engulfing candle.
Exit: Exit when the trend shows signs of reversing or take profit at predefined levels (e.g., resistance or a risk-to-reward ratio).
Bearish Engulfing Pattern (Red Label)
What it means: A bearish engulfing pattern is a signal of a potential reversal from an uptrend to a downtrend. The current candle fully engulfs the previous candle, signaling strong selling pressure.
How to use it:
Entry: Look for a red label (bearish engulfing) at the top of the chart. When it appears, consider entering a short position (sell).
Confirmation: Wait for the price to move below the low of the bearish engulfing candle to confirm the bearish trend.
Exit: Close the trade when the price reaches support levels or the trend shows signs of reversing.
Doji Pattern (Blue Circle)
What it means: A Doji candle signals market indecision. It represents a balance between buyers and sellers, often marking a potential reversal or consolidation point.
How to use it:
Entry: If the Doji appears after a strong trend (bullish or bearish), wait for the next candle to break above or below the Doji's high or low. This can signal a continuation or reversal.
Confirmation: You can look for additional indicators like moving averages, RSI, or MACD for confirmation before taking any action.
Exit: Exit when the price shows clear momentum in your entry direction.
Hammer Pattern (Orange Triangle)
What it means: The hammer pattern is a bullish reversal pattern that appears after a downtrend. It suggests that sellers pushed the price down during the session, but buyers managed to push the price back up.
How to use it:
Entry: When a hammer appears, consider entering a long position (buy). The price should move above the hammer's high for confirmation.
Confirmation: Look for strong volume and a follow-up bullish candle to confirm the reversal.
Exit: Set a target based on the next resistance level, or use a trailing stop to lock in profits.
Using Candlestick Patterns with Other Indicators
To increase your chances of success, combine candlestick patterns with other technical indicators.
Here are some ideas:
RSI (Relative Strength Index): Use RSI to check whether the market is overbought or oversold. A bullish engulfing in an oversold market could indicate a stronger buy signal, and a bearish engulfing in an overbought market could indicate a stronger sell signal.
Moving Averages (e.g., 50 EMA, 200 EMA): Confirm trend direction. If the candlestick pattern aligns with the direction of the moving averages, it can give a stronger signal.
MACD (Moving Average Convergence Divergence): Use MACD to confirm momentum and potential trend changes. If a candlestick pattern aligns with a MACD crossover, it strengthens the signal.
Volume: Look for higher-than-average volume when a pattern appears. This can give you additional confirmation that the market is reacting strongly.
Practice and Refine
It's important to practice using the candlestick patterns in a demo account or backtest them to see how they perform under different market conditions. Over time, you can adjust the settings and patterns to fit your trading style and preferences.

Multi-indicator Signal Builder [Skyrexio]Overview
Multi-Indicator Signal Builder is a versatile, all-in-one script designed to streamline your trading workflow by combining multiple popular technical indicators under a single roof. It features a single-entry, single-exit logic, intrabar stop-loss/take-profit handling, an optional time filter, a visually accessible condition table, and a built-in statistics label. Traders can choose any combination of 12+ indicators (RSI, Ultimate Oscillator, Bollinger %B, Moving Averages, ADX, Stochastic, MACD, PSAR, MFI, CCI, Heikin Ashi, and a “TV Screener” placeholder) to form entry or exit conditions. This script aims to simplify strategy creation and analysis, making it a powerful toolkit for technical traders.
Indicators Overview
1. RSI (Relative Strength Index)
Measures recent price changes to evaluate overbought or oversold conditions on a 0–100 scale.
2. Ultimate Oscillator (UO)
Uses weighted averages of three different timeframes, aiming to confirm price momentum while avoiding false divergences.
3. Bollinger %B
Expresses price relative to Bollinger Bands, indicating whether price is near the upper band (overbought) or lower band (oversold).
4. Moving Average (MA)
Smooths price data over a specified period. The script supports both SMA and EMA to help identify trend direction and potential crossovers.
5. ADX (Average Directional Index)
Gauges the strength of a trend (0–100). Higher ADX signals stronger momentum, while lower ADX indicates a weaker trend.
6. Stochastic
Compares a closing price to a price range over a given period to identify momentum shifts and potential reversals.
7. MACD (Moving Average Convergence/Divergence)
Tracks the difference between two EMAs plus a signal line, commonly used to spot momentum flips through crossovers.
8. PSAR (Parabolic SAR)
Plots a trailing stop-and-reverse dot that moves with the trend. Often used to signal potential reversals when price crosses PSAR.
9. MFI (Money Flow Index)
Similar to RSI but incorporates volume data. A reading above 80 can suggest overbought conditions, while below 20 may indicate oversold.
10. CCI (Commodity Channel Index)
Identifies cyclical trends or overbought/oversold levels by comparing current price to an average price over a set timeframe.
11. Heikin Ashi
A type of candlestick charting that filters out market noise. The script uses a streak-based approach (multiple consecutive bullish or bearish bars) to gauge mini-trends.
12. TV Screener
A placeholder condition designed to integrate external buy/sell logic (like a TradingView “Buy” or “Sell” rating). Users can override or reference external signals if desired.
Unique Features
1. Multi-Indicator Entry and Exit
You can selectively enable any subset of 12+ classic indicators, each with customizable parameters and conditions. A position opens only if all enabled entry conditions are met, and it closes only when all enabled exit conditions are satisfied, helping reduce false triggers.
2. Single-Entry / Single-Exit with Intrabar SL/TP
The script supports a single position at a time. Once a position is open, it monitors intrabar to see if the price hits your stop-loss or take-profit levels before the bar closes, making results more realistic for fast-moving markets.
3. Time Window Filter
Users may specify a start/end date range during which trades are allowed, making it convenient to focus on specific market cycles for backtesting or live trading.
4. Condition Table and Statistics
A table at the bottom of the chart lists all active entry/exit indicators. Upon each closed trade, an integrated statistics label displays net profit, total trades, win/loss count, average and median PnL, etc.
5. Seamless Alerts and Automation
Configure alerts in TradingView using “Any alert() function call.”
The script sends JSON alert messages you can route to your own webhook.
The indicator can be integrated with Skyrexio alert bots to automate execution on major cryptocurrency exchanges
6. Optional MA/PSAR Plots
For added visual clarity, optionally plot the chosen moving averages or PSAR on the chart to confirm signals without stacking multiple indicators.
Methodology
1. Multi-Indicator Entry Logic
When multiple entry indicators are enabled (e.g., RSI + Stochastic + MACD), the script requires all signals to align before generating an entry. Each indicator can be set for crossovers, crossunders, thresholds (above/below), etc. This “AND” logic aims to filter out low-confidence triggers.
2. Single-Entry Intrabar SL/TP
One Position At a Time: Once an entry signal triggers, a trade opens at the bar’s close.
Intrabar Checks: Stop-loss and take-profit levels (if enabled) are monitored on every tick. If either is reached, the position closes immediately, without waiting for the bar to end.
3. Exit Logic
All Conditions Must Agree: If the trade is still open (SL/TP not triggered), then all enabled exit indicators must confirm a closure before the script exits on the bar’s close.
4. Time Filter
Optional Trading Window: You can activate a date/time range to constrain entries and exits strictly to that interval.
Justification of Methodology
Indicator Confluence: Combining multiple tools (RSI, MACD, etc.) can reduce noise and false signals.
Intrabar SL/TP: Capturing real-time spikes or dips provides a more precise reflection of typical live trading scenarios.
Single-Entry Model: Straightforward for both manual and automated tracking (especially important in bridging to bots).
Custom Date Range: Helps refine backtesting for specific market conditions or to avoid known irregular data periods.
How to Use
1. Add the Script to Your Chart
In TradingView, open Indicators , search for “Multi-indicator Signal Builder”.
Click to add it to your chart.
2. Configure Inputs
Time Filter: Set a start and end date for trades.
Alerts Messages: Input any JSON or text payload needed by your external service or bot.
Entry Conditions: Enable and configure any indicators (e.g., RSI, MACD) for a confluence-based entry.
Close Conditions: Enable exit indicators, along with optional SL (negative %) and TP (positive %) levels.
3. Set Up Alerts
In TradingView, select “Create Alert” → Condition = “Any alert() function call” → choose this script.
Entry Alert: Triggers on the script’s entry signal.
Close Alert: Triggers on the script’s close signal (or if SL/TP is hit).
Skyrexio Alert Bots: You can route these alerts via webhook to Skyrexio alert bots to automate order execution on major crypto exchanges (or any other supported broker).
4. Visual Reference
A condition table at the bottom summarizes active signals.
Statistics Label updates automatically as trades are closed, showing PnL stats and distribution metrics.
Backtesting Guidelines
Symbol/Timeframe: Works on multiple assets and timeframes; always do thorough testing.
Realistic Costs: Adjust commissions and potential slippage to match typical exchange conditions.
Risk Management: If using the built-in stop-loss/take-profit, set percentages that reflect your personal risk tolerance.
Longer Test Horizons: Verify performance across diverse market cycles to gauge reliability.
Example of statistic calculation
Test Period: 2023-01-01 to 2025-12-31
Initial Capital: $1,000
Commission: 0.1%, Slippage ~5 ticks
Trade Count: 468 (varies by strategy conditions)
Win rate: 76% (varies by strategy conditions)
Net Profit: +96.17% (varies by strategy conditions)
Disclaimer
This indicator is provided strictly for informational and educational purposes .
It does not constitute financial or trading advice.
Past performance never guarantees future results.
Always test thoroughly in demo environments before using real capital.
Enjoy exploring the Multi-Indicator Signal Builder! Experiment with different indicator combinations and adjust parameters to align with your trading preferences, whether you trade manually or link your alerts to external automation services. Happy trading and stay safe!

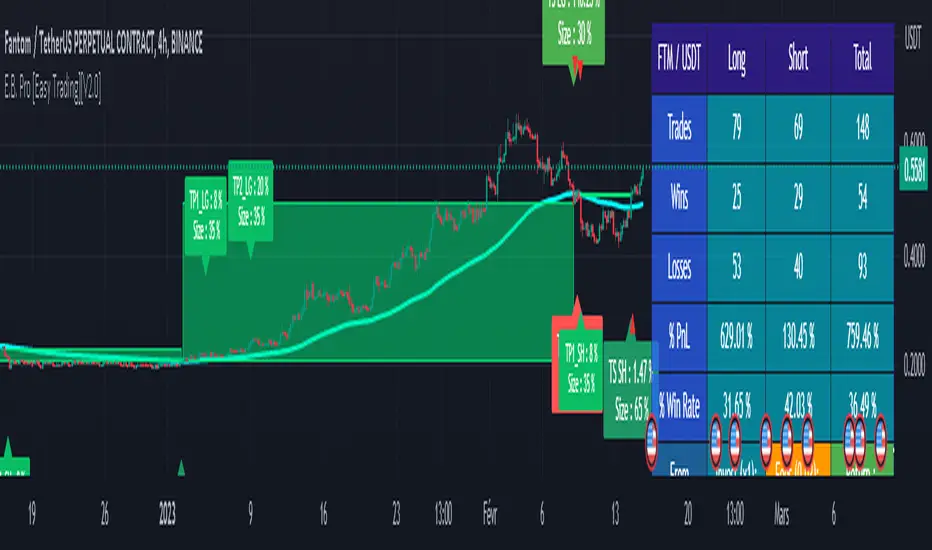
Trading IQ - Razor IQIntroducing TradingIQ's first dip buying/shorting all-in-one trading system: Razor IQ.
Razor IQ is an exclusive trading algorithm developed by TradingIQ, designed to trade upside/downside price dips of varying significance in trending markets. By integrating artificial intelligence and IQ Technology, Razor IQ analyzes historical and real-time price data to construct a dynamic trading system adaptable to various asset and timeframe combinations.
Philosophy of Razor IQ
Razor IQ operates on a single premise: Trends must retrace, and these retracements offer traders an opportunity to join in the overarching trend. At some point traders will enter against a trend in aggregate and traders in profitable positions entered during the trend will scale out. When occurring simultaneously, a trend will retrace against itself, offering an opportunity for traders not yet in the trend to join in the move and continue the trend.
Razor IQ is designed to work straight out of the box. In fact, its simplicity requires just a few user settings to manage output, making it incredibly straightforward to manage.
Long Limit Order Stop Loss and Minimum ATR TP/SL are the only settings that manage the performance of Razor IQ!
Traders don’t have to spend hours adjusting settings and trying to find what works best - Razor IQ handles this on its own.
Key Features of Razor IQ
Self-Learning Retracement Detection
Employs AI and IQ Technology to identify notable price dips in real-time.
AI-Generated Trading Signals
Provides retracement trading signals derived from self-learning algorithms.
Comprehensive Trading System
Offers clear entry and exit labels.
Performance Tracking
Records and presents trading performance data, easily accessible for user analysis.
Self-Learning Trading Exits
Razor IQ learns where to exit positions.
Long and Short Trading Capabilities
Supports both long and short positions to trade various market conditions.
How It Works
Razor IQ operates on a straightforward heuristic: go long during the retracement of significant upside price moves and go short during the retracement of significant downside price moves.
IQ Technology, TradingIQ's proprietary AI algorithm, defines what constitutes a “trend” and a “retracement” and what’s considered a tradable dip buying/shorting opportunity. For Razor IQ, this algorithm evaluates all historical trends and retracements, how much trends generally retrace and how long trends generally persist. For instance, the "dip" following an uptrend is measured and learned from, including the significance of the identified trend level (how long it has been active, how much price has increased, etc). By analyzing these patterns, Razor IQ adapts to identify and trade similar future retracements and trends.
In simple terms, Razor IQ clusters previous trend and retracement data in an attempt to trade similar price sequences when they repeat in the future. Using this knowledge, it determines the optimal, current price level where joining in the current trend (during a retracement) has a calculated chance of not stopping out before trend continuation.
For long positions, Razor IQ enters using a market order at the AI-identified long entry price point. If price closes beneath this level a market order will be placed and a long position entered. Of course, this is how the algorithm trades, users can elect to use a stop-limit order amongst other order types for position entry. After the position is entered TP1 is placed (identifiable on the price chart). TP1 has a twofold purpose:
Acts as a legitimate profit target to exit 50% of the position.
Once TP1 is achieved, a stop-loss order is immediately placed at breakeven, and a trailing stop loss controls the remainder of the trade. With this, so long as TP1 is achieved, the position will not endure a loss. So long as price continues to uptrend, Razor IQ will remain in the position.
For short positions, Razor IQ provides an AI-identified short entry level. If price closes above this level a market order will be placed and a short position entered. Again, this is how the algorithm trades, users can elect to use a stop-limit order amongst other order types for position entry. Upon entry Razor IQ implements a TP order and SL order (identifiable on the price chart).
Downtrends, in most markets, usually operate differently than uptrends. With uptrends, price usually increases at a modest pace with consistency over an extended period of time. Downtrends behave in an opposite manner - price decreases rapidly for a much shorter duration.
With this observation, the long dip entry heuristic differs slightly from the short dip entry heuristic.
The long dip entry heuristic specializes in identifying larger, long-term uptrends and entering on retracement of the uptrends. With a dedicated trailing stop loss, so long as the uptrend persists, Razor IQ will remain in the position.
The short dip entry heuristic specializes in identifying sharp, significant downside price moves, and entering short on upside volatility during these moves. A fixed stop loss and profit target are implemented for short positions - no trailing stop is used.
As a trading system, Razor IQ exits all TP orders using a limit order, with all stop losses exited as stop market orders.
What Classifies As a Tradable Dip?
For Razor IQ, tradable price dips are not manually set but are instead learned by the system. What qualifies as an exploitable price dip in one market might not hold the same significance in another. Razor IQ continuously analyzes historical and current trends (if one exists), how far price has moved during the trend, the duration of the trend, the raw-dollar price move of price dips during trends, and more, to determine which future price retracements offer a smart chance to join in any current price trend.
The image above illustrates the Razor Line Long Entry point.
The green line represents the Long Retracement Entry Point.
The blue upper line represents the first profit target for the trade.
The blue lower line represents the trailing stop loss start point for the long position.
The position is entered once price closes below the green line.
The green Razor Lazor long entry point will only appear during uptrends.
The image above shows a long position being entered after the Long Razor Lazor was closed beneath.
Green arrows indicate that the strategy entered a long position at the highlighted price level.
Blue arrows indicate that the strategy exited a position, whether at TP1, the initial stop loss, or at the trailing stop.
Blue lines above the entry price indicate the TP1 level for the current long trade. Blue lines below the current price indicate the initial stop loss price.
If price reaches TP1, a stop loss will be immediately placed at breakeven, and the in-built trailing stop will determine the future exit price.
A blue line (similar to the blue line shown for TP1) will trail price and correspond to the trailing stop price of the trade.
If the trailing stop is above the breakeven stop loss, then the trailing stop will be hit before the breakeven stop loss, which means the remainder of the trade will be exited at a profit.
If the breakeven stop loss is above the trailing stop, then the breakeven stop loss will be hit first. In this case, the remainder of the position will be exited at breakeven.
The image above shows the trailing stop price, represented by a blue line, and the breakeven stop loss price, represented by a pink line, used for the long position!
You can also hover over the trade labels to get more information about the trade—such as the entry price and exit price.
The image above exemplifies Razor IQ's output when a downtrend is active.
When a downtrend is active, Razor IQ will switch to "short mode". In short mode, Razor IQ will display a neon red line. This neon red line indicates the Razor Lazor short entry point. When price closes above the red Razor Lazor line a short position is entered.
The image above shows Razor IQ during an active short position.
The image above shows Razor IQ after completing a short trade.
Red arrows indicate that the strategy entered a short position at the highlighted price level.
Blue arrows indicate that the strategy exited a position, whether at the profit target or the fixed stop loss.
Blue lines indicate the profit target level for the current trade when below price. and blue lines above the current price indicate the stop loss level for the short trade.
Short traders do not utilize a trailing stop - only a fixed profit target and fixed stop loss are used.
You can also hover over the trade labels to get more information about the trade—such as the entry price and exit price.
Minimum Profit Target And Stop Loss
The Minimum ATR Profit Target and Minimum ATR Stop Loss setting control the minimum allowed profit target and stop loss distance. On most timeframes users won’t have to alter these settings; however, on very-low timeframes such as the 1-minute chart, users can increase these values so gross profits exceed commission.
After changing either setting, Razor IQ will retrain on historical data - accounting for the newly defined minimum profit target or stop loss.
AI Direction
The AI Direction setting controls the trade direction Razor IQ is allowed to take.
“Trade Longs” allows for long trades.
“Trade Shorts” allows for short trades.
Verifying Razor IQ’s Effectiveness
Razor IQ automatically tracks its performance and displays the profit factor for the long strategy and the short strategy it uses. This information can be found in the table located in the top-right corner of your chart showing.
This table shows the long strategy profit factor and the short strategy profit factor.
The image above shows the long strategy profit factor and the short strategy profit factor for Razor IQ.
A profit factor greater than 1 indicates a strategy profitably traded historical price data.
A profit factor less than 1 indicates a strategy unprofitably traded historical price data.
A profit factor equal to 1 indicates a strategy did not lose or gain money when trading historical price data.
Using Razor IQ
While Razor IQ is a full-fledged trading system with entries and exits - manual traders can certainly make use of its on chart indications and visualizations.
The hallmark feature of Razor IQ is its ability to signal an acceptable dip entry opportunity - for both uptrends and downtrends. Long entries are often signaled near the bottom of a retracement for an uptrend; short entries are often signaled near the top of a retracement for a downtrend.
Razor IQ will always operate on exact price levels; however, users can certainly take advantage of Razor IQ's trend identification mechanism and retracement identification mechanism to use as confluence with their personally crafted trading strategy.
Of course, every trend will reverse at some point, and a good dip buying/shorting strategy will often trade the reversal in expectation of the prior trend continuing (retracement). It's important not to aggressively filter retracement entries in hopes of avoiding an entry when a trend reversal finally occurs, as this will ultimately filter out good dip buying/shorting opportunities. This is a reality of any dip trading strategy - not just Razor IQ.
Of course, you can set alerts for all Razor IQ entry and exit signals, effectively following along its systematic conquest of price movement.
Bezahltes Script

ICSM (Impulse-Correction & SCOB Mapper) [WinWorld]DESCRIPTION
ICSM (Impulse-Correction SCOB Mapper) is the indicator that analyzes the price movement and identifies valid impulses, corrections and SCOBs. It is a powerful tool that can be used with any type of technical analysis because it's flexible, informative, easy to use and it does substantially improve trader's awareness of the most liquid zones of interest.
SETTINGS
General | Visuals
Colour theme — defines the colour theme of the ICSM.
SCOB | Visuals
Show SCOB — enables/disables SCOB;
Mark SCOB with — represents a list of style options for SCOB representation;
SCOB colour — defines the colour of the SCOB;
ICM | Visuals
Show ICM lines — enables/disables ICM (Impulse-Correction Mapper) lines;
Show IC trend — enables/disables visualization of impulse-correction trend via coloured divider at the bottom of the chart;
Line colour — defines the colour of the ICM lines;
Line style — defines the style of the ICM lines;
Alerts
ICM — enables/disables alert for breaking ICM lines;
SCOB — enables/disables alert for SCOB creation;
ICM+SCOB — enables/disables alert for SCOB occurance at the end of the single impulse/correction, which grabs ICM line's liquidity.
ICM+SCOB (same candle) — enables/disables alert for SCOB occurance at the candle, which grabs ICM line's liquidity.
IMPORTANT CONCEPTS
In order to fully understand what ICSM can do, let's do a quick overview of the most important concepts that this indicator is built on.
By ICM we mean the liquidity grabbing of Impulse-Correction Mapper's lines (ICM lines; represented as dashed horizontal lines on the chart ). Saying shortly, liquidity grabs of ICM lines posses great opportunities for finding great entries.
SCOB (Single Candle Order Block) builds up by 3 simple rules:
Previous candle's liquidity is grabbed;
Current candle closes inside previous candle;
Imbalance occurs on the next candle.
SCOB is a quite useful zone of interest, from which the price usually reverses. You can also use SCOB as POI* on HTF** or as entry zone on LTF***.
* POI — Point Of Interest
* HTF — Higher TimeFrame
* LTF — Lower TimeFrame
"ICM+SCOB" is a short name that we use for event, at which price first grabs the liquidity from ICM line and then creates a SCOB at the same impulse/correction movement ( on the same ICM line, that does the liquidity grab ). Usually the SCOB that occurs after this event represents a highly liquid zone of interest , which should be considered when choosing entry level.
"ICM+SCOB (same candle)" is basically the same as "ICM+SCOB" event but with one major difference — the candle, which grabs the liquidity of ICM line, is also the candle at which the SCOB occurs, making such SCOB an even better zone of interest than a regular SCOB from ICM+SCOB event.
BIGGEST ADVANTAGES
ICSM precisely identifies impulses and corrections. Huge load of indicators on the TradingView does only show the simplest zones of interests, while ICSM uses our team's signature algorithms to precisely identify true impulses and corrections in the market, allowing traders to see both local and global price direction better and at the same time providing traders with the most liquid zones of interest;
ICSM shows points of interest and liquidity. The indicator identifies the nearest points of interest and zones, where the liquidity is concentrated, allowing you to find great entry and exit points for your trades;
ICSM has SCOB (Single Candle Order Block) detection function. ICM is packed with the extremely useful in SMC trading SCOB detetction feature, which allows you find even more solid points of interest;
ICSM has super minimalistic design, which contains only the things you really need. Your chart will not be overloaded with unnecessary information. You will only see clear points of interest, liquidity and price movement.
WHY SHOULD YOU USE IT?
As was said above, ICSM allows you to see the most profitable points and zones of interest, which professional SMC traders consider as one of the best in the market, because they are historically the areas from which the price bounces the most, allowing the smartest traders to get quick an clean profits with low drawdown.
In the ICSM indicator these zones are SCOB and ICM line liquidity grabs. By using these zones of interest to find entry points, you increase the chance to open a trade at the most lucrative price and reduce trading risks.
Considering what was said above, this indicator can help traders reduce drawdown risks and increase potential profits simply by showing the most liquid zones of interest, which are perfect for opening a trading position.
Here are some of the examples of how you leverage ICSM in your trading process:
Example of the short trade:
Price shows overall short trend. Trend liquidity is being formed.
Price grabs liduiqity from three ICM lines in a row and then creates a long SCOB at the end of 3rd liquidity grab.
SCOB, which occured at the end of ICM line, represents much stronger zone of interest than a regular SCOB. In this case it represents a zone, which we will use to find an entry.
The entry for the trade will be SCOB candle's low, stop-loss target should be put above SCOB candle's high. Our take-profit target is trend liquidity. See the screenshot above for better understanding.
▼ Now let's see the long trade example. ▼
Example of the long trade:
Price creates trend liquidity by showing equal highs ( EQH ).
Price grabs liduiqity from four ICM lines in a row and then creates a long SCOB at the end of 4th liquidity grab.
Again: SCOB, which occured at the end of ICM line, represents much stronger zone of interest than a regular SCOB. In this case it represents a zone, which we will use to find an entry.
The entry for the trade will be SCOB candle's high, stop-loss target should be put below SCOB candle's low. Our take-profit target is EQH. See the screenshot above for better understanding.
ALERTS
ICSM provides simple and easy alert customization, allwoing to choose only the alerts you want to receive. You can choose from the following alert options:
ICM — impulse or correction liquidity grab;
SCOB — SCOB is formed, wether or not the liquidity is grabbed from the impulse or correction;
SCOB+ICM — SCOB is formed after grabbing the liquidity of the ICM line;
SCOB+ICM (same candle) — SCOB is formed in the liquidity area of the impulse or correction.
HOW CAN I GET THE MOST OUT OF IT?
ICSM displays only the first liquidity of an impulse or correction, which matches the IDM (Inducement) in the Advanced SMC strategy . This strategy is completely covered in the World Class SMC indicator and is available for free for PDF in three parts.
You can also ICSM with any other strategy, because ICSM is a very flexible indicator and will help anyone improve their trading by making one aware of the high-quality liquidity on the chart.
Let's see how you can leverage ICSM with our World Class SMC indicator and other different strategies:
Example of the long & short trades with World Class SMC.
Long (1-3):
Price reached previous OB-EXT . This is the first sign for the potential price reversal;
ICM+SCOB happened after price reached OB-EXT;
After that, you can need to look for an entry on LTF. If you don't know how to do it, you can refer to our education materials.
Short (4-6):
Price reached OB-IDM , which is also a great sign for a potential upcoming price reversal;
ICM+SCOB occured after liquidity grab of the previous SCOB. This fact does strengthen the probability of the potential upcoming price reversal;
Now you need to switch to LTF and find an entry there.
Example of the short trade with simple Fibonacci retracement strategy.
Price grabs the liquidity of the ICM lines three times in a row, forming SCOB after the 3rd grab;
Price performs correctional move down without testing the SCOB, leaving no entry opportunity by our initial strategy, so we can add another strategy — Fibonacci retracement from 0.618 level — to our analysis in order to find an entry ;
We use Fibonacci grid with our initial strategy to find the best POI, that will align with the trend direction and will eventually become our entry point.
SUMMARY
ICSM is a unique indicator that indentifies zones and points of interests with high-quiality liquidity and can be both a stand-alone tool and can be integrated into any other strategy to increase the efficiency of analysis, accuracy of trading entries and reduce trading risks.
If you want to learn the SMC strategies that our team uses in our products, you can refer to our educational materials.
We hope that you will find a great use of ICSM and it will help you improve your perfomance as a trader. Best of luck, traders!
— with love, WinWorld Team

RBS | Profitholders Thanks for source code author , I have modified this for especially Indian market.
RBS Indicator is Rang Breakout System, This is same "Opening Range Breakout" which is a common trading strategy. The indicator can analyze the market trend in the current session and give "Buy / Sell", "Take Profit" and "Stop Loss" signals. For more information about the analyzing process of the indicator, you can read "How Does It Work ?" section of the description.
Features of RBS indicator :
Buy & Sell Signals
Up To 3 Take Profit Signals
Stop-Loss Signals
Alerts for Buy / Sell, Take-Profit and Stop-Loss
Session Dashboard
Back testing Dashboard
HOW DOES IT WORK ?
This indicator works best in 15-minute timeframe. Need to change Chart time frame depends on symbols , The idea is that the trend of the current session can be forecasted by analyzing the market for a while after the session starts. However, each market has it's own dynamics and the algorithm will need fine-tuning to get the best performance possible. So, we've implemented a "Back testing Dashboard" that shows the past performance of the algorithm in the current ticker with your current settings. Always keep in mind that past performance does not guarantee future results. So this is for educational purpose.
Here are the steps of the algorithm explained briefly :
1. The algorithm follows and analyzes the first 15 minutes (can be adjusted) of the session.
2. Then, algorithm checks for breakouts of the opening range's high or low.
3. If a breakout happens in a bullish or a bearish direction, the algorithm will now check for retests of the breakout. Depending on the sensitivity setting, there must be 0 / 1 / 2 / 3 failed retests for the breakout to be considered as reliable.
4. If the breakout is reliable, the algorithm will give an entry signal.
5. After the position entry, algorithm will now wait for Take-Profit or Stop-Loss zones and signal if any of them occur.
If you wonder how does the indicator find Take-Profit & Stop-Loss zones, you can check the "Settings" section of the description.
UNIQUENESS
While there are indicators that show the opening range of the session, they come short with features like indicating breakouts, entries, and Take-Profit & Stop-Loss zones. We are also aware of that different stock markets have different dynamics, and tuning the algorithm for different markets is really important for better results, so we decided to make the algorithm fully customizable. Besides all that, our indicator contains a detailed back testing dashboard, so you can see past performance of the algorithm in the current ticker. While past performance does not yield any guarantee for future results, we believe that a back testing dashboard is necessary for tuning the algorithm. Another strength of this indicator is that there are multiple options for detection of Take-Profit and Stop-Loss zones, which the trader can select one of their liking.
⚙️SETTINGS
Keep in mind that best chart timeframe for this indicator to work is the 15-minute timeframe on Indian Market.
TP = Take-Profit
SL = Stop-Loss
EMA = Exponential Moving Average
OR = Opening Range
ATR = Average True Range
1. Algorithm
RBS Timeframe -> This setting determines the timeframe that the algorithm will analyze the market after a new session begins before giving any signals. It's important to experiment with this setting and find the best option that suits the current ticker for the best performance. More volatile stocks will often require this setting to be larger, while more stabilized stocks may have this setting shorter.
Sensitivity -> This setting determines how much failed retests are needed to take a position entry. Higher sensitivity means that less retests are needed to consider the breakout as reliable. If you think that the current ticker makes strong movements in a bullish & bearish direction after a breakout, you should set this setting higher. If you think the opposite, meaning that the ticker does not decide the trend right after a breakout, this setting show be lower.
(High = 0 Retests, Medium = 1 Retest, Low = 2 Retests, Lowest = 3 Retests)
Breakout Condition -> The condition for the algorithm to detect breakouts.
Close = Bar needs to close higher than the OR High Line in a bullish breakout, or lower than the OR Low Line in a bearish breakout. EMA = The EMA of the bar must be higher / lower than OR Lines instead of the close price.
TP Method -> The method for the algorithm to use when determining TP zones.
Dynamic = This TP method essentially tries to find the bar that price starts declining the current trend and going to the other direction, and puts a TP zone there. To achieve this, it uses an EMA line, and when the close price of a bar crosses the EMA line, It's a TP spot.
ATR = In this TP method, instead of a dynamic approach the TP zones are pre-determined using the ATR of the entry bar. This option is generally for traders who just want to know their TP spots beforehand while trading. Selecting this option will also show TP zones at the ORB Dashboard.
"Dynamic" option generally performs better, while the "ATR" method is safer to use.
EMA Length -> This setting determines the length of the EMA line used in "Dynamic TP method" and "EMA Breakout Condition". This is completely up to the trader's choice, though the default option should generally perform well. You might want to experiment with this setting and find the optimal length for the current ticker.
Stop-Loss -> Algorithm will place the Stop-Loss zone using setting.
Safer = The SL zone will be placed closer to the OR High for a bullish entry, and closer to the OR Low for a bearish entry.
Balanced = The SL zone will be placed in the center of OR High & OR Low
Risky = The SL zone will be placed closer to the OR Low for a bullish entry, and closer to the OR High for a bearish entry.
Adaptive SL -> This option only takes effect if the first TP zone is hit.
Enabled = After the 1st TP zone is hit, the SL zone will be moved to the entry price, essentially making the position risk-free.
Disabled = The SL zone will never change.
2. RBS Dashboard
RBS Dashboard shows the information about the current session.
3. RBS Back testing
RBS Back testing Dashboard allows you to see past performance of the algorithm in the current ticker with current settings.
Total amount of days that can be back tested depends on your TV subscription.
Back testing Exit Ratios -> You can select how much of percent your entry will be closed at any TP zone while back testing. For example, %90, %5, %5 means that %90 of the position will be closed at the first TP zone, %5 of it will be closed at the 2nd TP zone, and %5 of it will be closed at the last TP zone.

ORB Algo | Flux Charts💎 GENERAL OVERVIEW
Introducing our new ORB Algo indicator! ORB stands for "Opening Range Breakout" which is a common trading strategy. The indicator can analyze the market trend in the current session and give "Buy / Sell", "Take Profit" and "Stop Loss" signals. For more information about the analyzing process of the indicator, you can read "How Does It Work ?" section of the description.
Features of the new ORB Algo indicator :
Buy & Sell Signals
Up To 3 Take Profit Signals
Stop-Loss Signals
Alerts for Buy / Sell, Take-Profit and Stop-Loss
Customizable Algoritm
Session Dashboard
Backtesting Dashboard
📌 HOW DOES IT WORK ?
This indicator works best in 1-minute timeframe. The idea is that the trend of the current session can be forecasted by analyzing the market for a while after the session starts. However, each market has it's own dynamics and the algorithm will need fine-tuning to get the best performance possible. So, we've implemented a "Backtesting Dashboard" that shows the past performance of the algorithm in the current ticker with your current settings. Always keep in mind that past performance does not guarantee future results.
Here are the steps of the algorithm explained briefly :
1. The algorithm follows and analyzes the first 30 minutes (can be adjusted) of the session.
2. Then, algorithm checks for breakouts of the opening range's high or low.
3. If a breakout happens in a bullish or a bearish direction, the algorithm will now check for retests of the breakout. Depending on the sensitivity setting, there must be 0 / 1 / 2 / 3 failed retests for the breakout to be considered as reliable.
4. If the breakout is reliable, the algorithm will give an entry signal.
5. After the position entry, algorithm will now wait for Take-Profit or Stop-Loss zones and signal if any of them occur.
If you wonder how does the indicator find Take-Profit & Stop-Loss zones, you can check the "Settings" section of the description.
🚩UNIQUENESS
While there are indicators that show the opening range of the session, they come short with features like indicating breakouts, entries, and Take-Profit & Stop-Loss zones. We are also aware of that different stock markets have different dynamics, and tuning the algorithm for different markets is really important for better results, so we decided to make the algorithm fully customizable. Besides all that, our indicator contains a detailed backtesting dashboard, so you can see past performance of the algorithm in the current ticker. While past performance does not yield any guarantee for future results, we believe that a backtesting dashboard is necessary for tuning the algorithm. Another strength of this indicator is that there are multiple options for detection of Take-Profit and Stop-Loss zones, which the trader can select one of their liking.
⚙️SETTINGS
Keep in mind that best chart timeframe for this indicator to work is the 1-minute timeframe.
TP = Take-Profit
SL = Stop-Loss
EMA = Exponential Moving Average
OR = Opening Range
ATR = Average True Range
1. Algorithm
ORB Timeframe -> This setting determines the timeframe that the algorithm will analyze the market after a new session begins before giving any signals. It's important to experiment with this setting and find the best option that suits the current ticker for the best performance. More volatile stocks will often require this setting to be larger, while more stabilized stocks may have this setting shorter.
Sensitivity -> This setting determines how much failed retests are needed to take a position entry. Higher senstivity means that less retests are needed to consider the breakout as reliable. If you think that the current ticker makes strong movements in a bullish & bearish direction after a breakout, you should set this setting higher. If you think the opposite, meaning that the ticker does not decide the trend right after a breakout, this setting show be lower.
(High = 0 Retests, Medium = 1 Retest, Low = 2 Retests, Lowest = 3 Retests)
Breakout Condition -> The condition for the algorithm to detect breakouts.
Close = Bar needs to close higher than the OR High Line in a bullish breakout, or lower than the OR Low Line in a bearish breakout. EMA = The EMA of the bar must be higher / lower than OR Lines instead of the close price.
TP Method -> The method for the algorithm to use when determining TP zones.
Dynamic = This TP method essentially tries to find the bar that price starts declining the current trend and going to the other direction, and puts a TP zone there. To achieve this, it uses an EMA line, and when the close price of a bar crosses the EMA line, It's a TP spot.
ATR = In this TP method, instead of a dynamic approach the TP zones are pre-determined using the ATR of the entry bar. This option is generally for traders who just want to know their TP spots beforehand while trading. Selecting this option will also show TP zones at the ORB Dashboard.
"Dynamic" option generally performs better, while the "ATR" method is safer to use.
EMA Length -> This setting determines the length of the EMA line used in "Dynamic TP method" and "EMA Breakout Condition". This is completely up to the trader's choice, though the default option should generally perform well. You might want to experiment with this setting and find the optimal length for the current ticker.
Stop-Loss -> Algorithm will place the Stop-Loss zone using setting.
Safer = The SL zone will be placed closer to the OR High for a bullish entry, and closer to the OR Low for a bearish entry.
Balanced = The SL zone will be placed in the center of OR High & OR Low
Risky = The SL zone will be placed closer to the OR Low for a bullish entry, and closer to the OR High for a bearish entry.
Adaptive SL -> This option only takes effect if the first TP zone is hit.
Enabled = After the 1st TP zone is hit, the SL zone will be moved to the entry price, essentially making the position risk-free.
Disabled = The SL zone will never change.
2. ORB Dashboard
ORB Dashboard shows the information about the current session.
3. ORB Backtesting
ORB Backtesting Dashboard allows you to see past performance of the algorithm in the current ticker with current settings.
Total amount of days that can be backtested depends on your TV subscription.
Backtesting Exit Ratios -> You can select how much of percent your entry will be closed at any TP zone while backtesting. For example, %90, %5, %5 means that %90 of the position will be closed at the first TP zone, %5 of it will be closed at the 2nd TP zone, and %5 of it will be closed at the last TP zone.

Model Indicator |ASE|The purpose of this indicator is to allow the user to build their own model. Each feature works cohesively together and depending on the filters you enable, the model gives less and more specific entries. This benefits the trader because they have complete control over the kinds of trades they want to take, while maintaining its automatic form.
We want to be as customizable as possible while still meeting our users’ needs. We started this indicator to propel us into our ultimate project, the ASE Algo.
Features:
SMC Display
Current Structure:
Liquidity Levels:
Daily Premium Discount Array
SMT Divergence
Displacement Candles:
Entry Factors
FVG
Continuation FVGs
MTF FVGs
Order Blocks
MTF Order Blocks
Confluence Filters
MS Reversal
Liquidity Level Raid
Inducement
Daily Prem/Disc Array
Target Factors
Liquidity Level Targets
Current Structure Targets
Trade Management
Trade Overlay
Risk:Reward Target
Benefits & Examples:
In the image below the indicator signaled multiple entries based on two simple confluence filters, a MS reversal (CHoCH/MSS) and a Liquidity Raid. Going from left to right we can see a short entry at the highs with a supporting Order Block. Liquidity levels are taken before we see a double IDM right below the respected OB that leads to the next signaled entry. In the middle of the chart we see a long entry that leads right into a short entry showing the effectiveness of such a simple model.
In this supporting image we are showcasing the first implementation of the Trade Overlay feature. This feature displays the Entry and Stop Loss to make it more visible and adds a risk to reward target. Additionally displayed is the SMC Toolkit indicator showing us additional confirmation with our signaled entries playing right out of a higher timeframe FVG.
An additional entry feature is the MTF zone. Setups can form on all timeframes and subjecting yourself to only one may lead you to miss out on some perfect setups or a larger move. In the image below we are on the 1 minute timeframe. We can see the Initial Reversal Entry which played out beautifully and filled a higher timeframe SFVG. With the MTF zone we can see a 3 minute and 5 minute Zone which produces the rest of the trend reaching another higher timeframe SFVG after filling the previous one. Once again showing the benefit of the Toolkit indicator but the plotted entries from such a simple model.
In addition to the model indicators filtered out entry zone, we can use additional confluences to confirm these entries. In the image below we can see a short entry printed after a move out of the Std. Dev. vwap wave which shows over extension. Taking the entry we can have a tight stop loss at the vwap wave or the recent high where we have a liquidity level, targeting a lower liquidity level or higher timeframe FVG.
For this example we are only filtering based on MS Reversals (CHoCH/MSS) to get our entries. Because of this we need additional confirmation to be confident in taking the plotted entry. In the image below you can see a long signal printed, confirmation being the previous Failed Reversal.

Original Strategy - Backtest & Alerts [AlgoRider]█ OVERVIEW
This indicator simulates an efficient trading strategy developed by our team in a simple and effective way, the primary objective when designing it was to make its reading and use as simple as possible for TradingView users. The Backtesting feature has been designed to keep only the most essential information to obtain clear and precise results directly on the graph. The settings interface has also been designed for ergonomic and simplified use. The user is free to customize the parameters as he wishes and according to his trading profile by having the choice, for example, of using options to reduce the risk of loss, to increase the win rate, to optimize profits. Automation is made possible and facilitated thanks to preconfigured alert conditions.
█ CONCEPTS
How the strategy works :
When the price is close to its equilibrium (represented by an exponential moving average - EMA) and it starts to take an upward or downward direction the script will issue Long or Short entry orders. If the price turns and goes to the opposite direction, the script quickly cuts the position by issuing a Stop Loss order. When the price takes a real clear direction, this is where the script will be able to accumulate profits.
What makes this script unique is :
• That it is entirely developed by us, inspired by a strategy that is little known and little used in the trading world, in particular because it often involves a greater number of losing trades than winning trades.
• Its ease of reading and use. The backtesting feature was designed to clearly display the most important information in a data table directly on the chart. The user is not lost with dozens of superfluous data and can directly access the most essential information to see how the strategy has performed in the past.
• Its ease of configuration and customization. Once in the configuration window, again the user is not lost, because there is only one main parameter to modify, it is the length of the EMA, which will influence the timing of entries and exits trades. Then there are a few other non-mandatory parameters to fine-tune risk management and maximize profits. (Detailed description of the settings further down the page)
• Strategy automation made easy and fast thanks to several types of alerts which are differentiated for entries, for auto-exits and for Custom TP and SL. These alerts can be configured to send the messages by email or via Webhooks.
• The indicator has several custom options allowing its user to go further than the basic strategy. Several confirmations for entries are available as well as the possibility of adding or not a personalized TP and/or SL.
• There is no repaint, once an entry/exit symbol or drawing is displayed it doesn't change anymore. The Short, Long and auto-Exit signals appear only at the open of the candles, just after the signal was confirmed at the close of the previous candle. The custom TP and custom SL signals can appear when a candle is not yet finished, but once displayed they don't change.
█ HOW TO PROCEED
1 — Once the script is applied to your chart, it already works with its default settings. You can already see the performance of the strategy in the data table directly on the chart (in the top right corner by default).
2 — You can customize the strategy and influence the results/performance by modifying its parameters. 3 types of parameters are present and can be modified.
3 — This strategy is designed for the cryptocurrency market in priority, but you can also try it on other types of assets. It works on Futures but you can also try it on Spot market mainly for LONG trades.
4 — You can apply the script in every timeframe. We do not recommend using it below m30 because in most cases the statistics are unfavorable largely because of the fees. (This is not a financial advice but only for the use of the indicator)
█ FEATURES
Screenshot on BYBIT:EGLDUSDT Bybit Futures, H1, with default parameters, from 2022-01-01 to 2022-09-27, to show the settings window
• Settings For Backtesting
- Strategy : Choose from a drop-down list if the strategy should execute only Long trades or only Short trades or both. Default Both.
- Invest. : Choose the amount you want to invest in the simulation. Default 10000.
- Position : Choose the amount of the position (Size order) that will be used during the simulation. This will be the $ amount staked/involved for each trade entry.
Ex: If you put 20000 in position and 10000 in Invest. We consider that you use at least a leverage x2. Default 10000.
- Slipp. TP : Choose the amount in percentage of average slippage for Take Profits. This parameter makes it possible to predict a potential gap between the theoretical exit price for each TP (On the graph) and the real exit price on an exchange when implementing the strategy for real (slippage may be due to a time lag of a few seconds from execution time of the order on the exchange and/or due to the execution of a market order).
Ex: If a TP exit order of a Long trade, with entry $19000 (on BTCUSDT), is carried out in theory on the chart at $20000, in practice on the exchange the script have indeed sent an exit order at 20000 , but if the true exit price is 20050, the TP slippage is then +0.25%. Default 0.
- Slipp. SL : Choose the amount in percentage of average slippage for Stop Losses. This parameter makes it possible to predict a potential gap between the theoretical exit price for each SL (On the graph) and the real exit price on an exchange when implementing the strategy for real.
Ex: If an SL exit order of a Long trade, entry $19000 (on BTCUSDT), is carried out in theory on the chart at $18000, in practice on the exchange the script have indeed sent an exit order at 18000 $, but if the true exit price is 17950, the slippage SL is then +0.278% . Default 0.
- Fees % : Choose the percentage amount of fees applied to each trade to simulate the application of the strategy on the exchange of your choice. Applies to the entry and exit of each trade. Ex: For Binance Futures: 0.04; For Bybit futures: 0.06; For Ftx Futures: 0.075. Default 0.
- Cumulate Trades : If you check this, the Backtest will use 100% of the balance as Order Size (Position) for All or in the next X consecutive trades. Default not checked.
⚠️ Be Careful please, this option is available to show the full extent and possibilities of the algorithm when pushed to its limits thanks to the accumulation of profits (cumulative earnings), but it is a strategy that involves great risk. If a bad trade suffers a -50% loss, 50% of the account balance is lost, if the position is liquidated, the entire account balance is lost.
- All : If you check this All trades will be accumulated. Default not checked.
- Consecutive Trades : Choose the number of trades to accumulate. After X consecutive trades, the algorithm reassigns the initial order size to the current one and starts again for X consecutive trades. Minimum Value 2, Default 2.
• Settings To Optimize Performances and Risk Management
- (Main Parameter) EMA Length : Choose the length of the EMA. This value will determine the exponential moving average plot (blue line) that represents the equilibrium in this strategy. Depending on the positioning of the price around this equilibrium, the algorithm will decide to trigger Long or Short entry alerts, and exit alerts. Default 200.
- 1 - Confirm (After X Bar(s)) : If you check this, when the algorithm will detect an entry, it will wait for the number of bars you have entered to actually trigger the entry alert. Default not checked.
- Nb Bar : Enter here the number of bar you want, will be taken into account only if you check (1) Confirm (After X Bar(s)). Default 2.
- 2 - Confirm (Trend) : If you check this, when the algorithm will detect an entry, it will check that the trend is similar to the direction of the trade, if not, it will wait that the trade goes in the same direction as the trend to actually trigger the entry alert. Default not checked.
- OR/AND : This choice is taken into account only if you tick both confirmations. If you choose OR: The first of the 2 confirmations to be validated will trigger the entry alert. If you choose AND : once confirmation (1) is validated, the algorithm waits for confirmation (2) to be validated to actually trigger the entry alert. Default OR.
- Use TP / Use SL : If you check these, the algorithm will trigger personalized trade exit alerts when the price evolution has reached the amounts indicated since the trade entry. Default not Checked.
- % TP - SL : Indicate here the personalized amount in percentage that you want for your Take Profit and Stop Loss of each trade. Default 15-5.
• Settings For Appearances
- Small-size Data Table : If you check this, the data table will become smaller to free up more space on the chart to make it visually more pleasing. Default not checked.
Hide Table /
- Hide Labels / : You can check these to get a cleaner chart and focus only on what interests you in the indicator. Default not checked.
Hide Risk-Reward Areas
█ MAIN PARAMETERS TO USE
• In the default settings none of the box settings are checked. Basic strategy is made to be applied this way.
• The main parameter (the length of the EMA) is by default 200 because it is a known value that many traders rely on in many trading strategies. Moreover in this strategy it works in many cases and on different timeframes.
• To go further the user of the indicator is free to modify the parameters of the category "Leading Parameters - Risk Management" to reduce risks and to optimize profits.
• You can find below our recommendations for the EMA length value corresponding to the main timeframes.
m30 — EMA Length = 400 | 800
H1 — EMA Length = 200 | 400
H2 — EMA Length = 200 | 250
H4 — EMA Length = 100 | 200
D — EMA Length = 20 | 40
⚠️ We have chosen to recommend these settings because they will work in most cases, on most cryptoassets, but of course they will not work 100% of the time on all assets and will not always give positive results in the backtest, and they are not the most optimized parameters either. The user of the indicator is free to optimize the asset on which he wants to trade in his own way. Just as we do not give financial advice, we do not encourage to trade any asset in particular.
█ STATISTICS
The statistics presented below are an example of the results that the strategy can provide. (Reminder: These statistics are made over a past period and there is no guarantee that the same performance will reproduce in the future) .
For the demonstration we chose to apply the strategy on the Top 5 marketcap cryptos in September 2022. They are not the most favorable coins for this strategy but at least this way we don't take the most suitable assets to show wonderful and biased results. Likewise for the parameters used which are the default ones and which are not the most optimized parameters, much better results are possible. We chose Binance because it has the highest volumes and liquidity and the most historical data. We chose H1 because it is one of the most used timeframes.
BTC
Screenshot on BINANCE:BTCUSDTPERP Binance Futures, H1, with default parameters (EMA : 400), from 2022-01-01 to 2022-09-27
ETH
Screenshot on BINANCE:ETHUSDTPERP Binance Futures, H1, with default parameters (EMA : 400), from 2022-01-01 to 2022-09-27
BNB
Screenshot on BINANCE:BNBUSDTPERP Binance Futures, H1, with default parameters (EMA : 400), from 2022-01-01 to 2022-09-27
XRP
Screenshot on BINANCE:XRPUSDTPERP Binance Futures, H1, with default parameters (EMA : 200), from 2022-01-01 to 2022-09-27
ADA
Screenshot on BINANCE:ADAUSDTPERP Binance Futures, H1, with default parameters (EMA : 400), from 2022-01-01 to 2022-09-27
To show the potential of the indicator and push it to its limits, here is an example of the strategy applied for about 2 years (Up to the maximum of historical data available).
⚠️ It must be taken into account that during the period of this backtest the last Bullrun took place and it was a very favorable period for the strategy and for this altcoin (FTM), nothing ensures that it will happen again. ⚠️
FTM
Screenshot on BINANCE:FTMUSDTPERP Binance Futures, H4, with default parameters ( without cumulative earnings) and EMA : 400, start on 2020/12/03 to 2022/09/27
✅ All of the above statistics are verifiable by anyone using the indicator's backtesting system.
█ LIMITATIONS
• Despite the fact that we can see good performances when we backtest the strategy, we must take into account the fact that these are results performed in the past and that in no case does this guarantee that these same performances will be repeated again in the future.
• The automation of this strategy is made possible and is facilitated by alerts, but you must be aware of the fact that if you decide to put this strategy into practice in real life, you are solely responsible for the results that you will be able to obtain and you must be aware of the possibility at all times of partial or even total losses of your invested capital.
• Keep in mind that generating profits in trading is difficult. A strategy can perform very well at one time in the past during a period that is favorable to it, then from one day to the next it can give really bad results for several months or years.
• When backtesting a strategy, there are many factors to consider, not just trade entries to which you add a Take Profit and sometimes a Stop Loss. You must at least take into account the size of the position in relation to the capital you want to invest, the trading fees, the slippages (which can be really important depending on the exchange on which you are trading and depending on the asset you are trading), trading frequency, risk management, momentum, volumes and even more.
• This indicator has been optimized for crypto, you can try to use it on other type of assets but again, at your own risk.
The information published here on TradingView is not prohibited, doesn't constitute investment advice, and isn't created solely for qualified investors.
═════════════════════════════════════════════════════════════════════════
Important to note : our indicators with the same backtesting system are published in separate publications, because putting them together in a single script would considerably slow down the execution of the script. In addition each indicator, even when it is based on a simple technical indicator, has several options, parameters and entry/exit conditions specific to the underlying technical indicator. Finally, we want to keep the simplicity of use, configuration and understanding of our indicator by not mixing strategies that have nothing to do with each other.
RSI Strategy - Backtest [AlgoRider]█ OVERVIEW
Hello dear Tradingviewers !
We share with you this new indicator which simulates a trading strategy based solely on the well-known technical indicator RSI . We designed it for the sole educational and analytical purposes of showing novice traders and new investors that basing a trading strategy only on one such technical indicator is not necessarily a good thing to do. We do not recommend to apply this strategy for real.
Thanks to this indicator redesigned in our own way by incorporating our simple and easy-to-use Backtest functionality, you will be able to see and report on the performance and results that such a strategy has produced in the past.
The configuration window has also been designed to be easily readable and simple to use. Our goal is to make parameter customization as easy as possible.
█ HOW THE STRATEGY WORKS
• The script will trigger Long entries when the price crosses upwards the Oversold zone (Default 38.2) and Short entries when the price crosses downward the Overbought zone (Default 61.8).
• A Short signal ends a Long trade, a Long signal ends a Short trade.
• The script also allows setting up custom TP and SL.
• Several options allow you to reverse entry and exit conditions of trades. You can choose to reverse entries or/and exits (Ex: when the script detects a Long Entry, it will actually trigger a Short trade).
• You can also change the entry conditions of the strategy. Instead of entering oversold/overbought zone conditions, it will trigger entries when the Rsi changes direction and reverses (Ex: when the rsi has been going down for 5 candles, and the rsi starts going up) , regardless of the area in which the RSI is located.
• There is no repaint, once an entry/exit symbol or drawing is displayed it doesn't change anymore. The Short and Long signals appear at the open of the candles, just after the signal was confirmed at the close of the previous candle. The custom TP and custom SL signals can appear when a candle is not yet finished, but once displayed they don't change.
█ HOW TO PROCEED
1 — Once the script is applied to your chart, it already works with its default settings. You can already see the performance of the strategy in the data table directly on the chart (in the top right corner by default).
2 — You can customize the strategy and influence the results/performance by modifying its parameters. 4 types of parameters are present and can be modified.
3 — You can use this indicator in all types of markets.
4 — You can apply the script in every timeframe.
█ PARAMETERS
• Settings For Backtesting
- Strategy : Choose from a drop-down list if the strategy should execute only Long trades or only Short trades or both. Default Both.
- Invest. : Choose the amount you want to invest in the simulation. Default 10000.
- Position : Choose the amount of the position (Size order) that will be used during the simulation. This will be the $ amount staked/involved for each trade entry.
Ex: If you put 20000 in position and 10000 in Invest. We consider that you use at least a leverage x2. Default 10000.
- Slipp. TP : Choose the amount in percentage of average slippage for Take Profits. This parameter makes it possible to predict a potential gap between the theoretical exit price for each TP (On the graph) and the real exit price on an exchange when implementing the strategy for real (slippage may be due to a time lag of a few seconds from execution time of the order on the exchange and/or due to the execution of a market order).
Ex: If a TP exit order of a Long trade, with entry $19000 (on BTCUSDT ), is carried out in theory on the chart at $20000, in practice on the exchange the script have indeed sent an exit order at 20000 , but if the true exit price is 20050, the TP slippage is then +0.25%. Default 0.
- Slipp. SL : Choose the amount in percentage of average slippage for Stop Losses. This parameter makes it possible to predict a potential gap between the theoretical exit price for each SL (On the graph) and the real exit price on an exchange when implementing the strategy for real.
Ex: If an SL exit order of a Long trade, entry $19000 (on BTCUSDT ), is carried out in theory on the chart at $18000, in practice on the exchange the script have indeed sent an exit order at 18000 $, but if the true exit price is 17950, the slippage SL is then +0.278%. Default 0.
- Fees % : Choose the percentage amount of fees applied to each trade to simulate the application of the strategy on the exchange of your choice. Applies to the entry and exit of each trade. Ex: For Binance Futures: 0.04; For Bybit futures: 0.06; For Ftx Futures: 0.075. Default 0.
- Cumulate Trades : If you check this, the Backtest will use 100% of the balance as Order Size (Position) for All or in the next X consecutive trades. Default not checked.
⚠️ Be Careful please, this option is available to show the full extent and possibilities of the algorithm when pushed to its limits thanks to the accumulation of profits (cumulative earnings ), but it is a strategy that involves great risk. If a bad trade suffers a -50% loss, 50% of the account balance is lost, if the position is liquidated, the entire account balance is lost.
- All : If you check this All trades will be accumulated. Default not checked.
- Consecutive Trades : Choose the number of trades to accumulate. After X consecutive trades, the algorithm reassigns the initial order size to the current one and starts again for X consecutive trades. Minimum Value 2, Default 2.
• Change Entry & Exit conditions
- Rsi Turns Up/Down : Enable this option to change conditions for trade entries. For Long entries : It will start a Long trade when RSI turns up and the RSI was falling on the last X bar(s). For Short entries : It will start a Short trade when RSI turns down and the RSI was rising on the last X bar(s). Default not checked.
- After Falling/Rising Bars(s) : Choose the number of bars/candles since which the price was falling/rising. Default 5.
- Reverse Entries : Enable this option to reverse conditions for trade entries. When a Short signal appears, it will actually start a Long trade. When a Long signal appears, it will actually start a Short trade. Default not checked.
- Reverse Exits : Enable this option to reverse conditions for trade exits. Default not checked.
- Safety Stop Loss : Enable this option to quickly cut the trade when the price turns quickly. For a Long trade : if the price returns to the oversold zone, it ends the trade. For a Short trade : if the price returns to the overbought zone, it ends the trade. Mainly useful for basic strategy (overbought/oversold conditions). Default not checked.
• Settings To Optimize Performances and Risk Management
- Len RSI : The length of RSI . Default 14.
- Overbuy : You can change the limit value of the overbought zone of the RSI . Default 61.8.
- Oversell : You can change the limit value of the oversell zone of the RSI . Default 38.2.
- Use TP / Use SL : If you check these, the algorithm will trigger personalized trade exit signals when the price evolution has reached the amounts indicated since the trade entry. Default not Checked.
- % TP - SL : Indicate here the personalized amount in percentage that you want for your Take Profit and Stop Loss of each trade. Default 15-5.
• Settings For Appearances
- Small-size Data Table : If you check this, the data table will become smaller to free up more space on the chart to make it visually more pleasing. Default not checked.
Hide Table /
- Hide Labels / : You can check these to get a cleaner chart and focus only on what interests you in the indicator. Default not checked.
Hide Risk-Reward Areas
█ LIMITATIONS
• ⚠️ We repeat it once again, this strategy is not intended to be reproduced in real conditions, we have designed it for educational and analytical purposes only.
• Even if you see good performances when you backtest the strategy, you must take into account that these results are performed in the past and that in no case does this guarantee that these same performances will be repeated again in the future.
• When you run for real a trading strategy you must be aware of the fact that you are solely responsible for the results that you will be able to obtain and you must be aware of the possibility at all times of partial or even total losses of your invested capital.
• Keep in mind that generating profits in trading is difficult. A strategy can perform very well at one time in the past during a period that is favorable to it, then from one day to the next it can give really bad results for several months or years.
• When backtesting a trading strategy, there are many factors to consider, not just trade entries to which you add a Take Profit and sometimes a Stop Loss. You must at least take into account the size of the position in relation to the capital you want to invest, the trading fees, the slippages (which can be really important depending on the exchange on which you are trading and depending on the asset you are trading), trading frequency, risk management, momentum, volumes and even more.
The information published here on TradingView is not prohibited, doesn't constitute investment advice, and isn't created solely for qualified investors.
═════════════════════════════════════════════════════════════════════════
Important to note : our indicators with the same backtesting system are published in separate publications, because putting them together in a single script would considerably slow down the execution of the script. In addition each indicator, even when it is based on a simple technical indicator, has several options, parameters and entry/exit conditions specific to the underlying technical indicator. Finally, we want to keep the simplicity of use, configuration and understanding of our indicator by not mixing strategies that have nothing to do with each other.

TRENDsignalsindicator_MTF► DESCRIPTION
This indicator calculate works in 2 directions:
1) Calculate SMA & VWAP trends at a fixed value: so it values the price actions according the VWAP level to reach the perfect entrypoint
2) Set the value found at a different timeframe(4Hs if u use tradingview TF of 15 mins)
This combination is useful to identify the trend
To help the trader, I placed BUY/SELL signals on the second candle of the same color changed.
Furthermore, I placed:
- HH and LL of the day(green and red lines) and of the current Week(white lines): these lines help the traders to identify the relative supports and resistances
- line red and gray(with big arrows at the start of them): to identify others supports and resistance
► HOW TO USE IT:
1) Entry when a signal(buy/sell) appears or when candles change color: yellow is long, red is short
2) Evaluate where the candle is: for example, if you get a signal "buy", near the Weekly line LL, it's the perfect entry point. The same is if u get a "SELL" signal near the upper white line, it's the perfect moment to enter short.
3) Take profit: we suggest to take profit when RSI is overbought or oversold, that we've pointed thanks the following signals:
- colored circles
- small diamonds
- white circles
- Big white diamonds
► Legend:
BARCOLORS: Yellow is long and red is short moment
MINIARROW buy/sell alert u when the color of candls change
COLORED CIRCLES: indicates when Rsi is oversold or overbought. We identify them like good moment to take profit
BIG ARROW: Identify support and resistance level
SMALL DIAMOND: Use it Like TP. Possible small swing of price can happen
WHITE CIRCLE: Use it Like TP. Possible small swing of price can happen
BIG WHITE DIAMOND: Use it Like TP. Possible big swing of price can happen
So it's suggested to trade just near this supports and resistence using the right direction: when you have a reversal signal near one of the daily or weekly line, it's a good moment to entry
PLEASE COMMENT HERE BELOW ANY QUESTION ABOUT THIS STUDY

NDS RISK MANAGEMENT (V1.0)Here is a Risk Management Program that calculates stop loss and position sizing based on NDS analysis.
Inputs:
Entry: The First Symmetry Level T1.
Entry: The Second Symmetry Level T2.
Entry: The Node 1 Level
Entry: The Node 2 Level
Entry: The 86% Level
Target: The First Symmetry Level T1
Target: The Second Symmetry Level T2.
Target:
The Node 1 Level
Target: The Node 2 Level
Target: The 86% Level
Balance: Balance Amount
Risk Level: Percent that is risked of the Balance for one Trade
Output:
Risk Per Point
Stop Loss Price
Take Profit Price
Low Risk Entry Zone
Take Profit Zone
Disclaimer
The Following indicator/code IS NOT intended to be a formal investment advice or recommendation by the author, nor should be construed as such.
You declare to know the principles and risks of the financial markets. Therefore, you declare that you are aware of the financial risks involved in trading.
In this sense, the author can not be held responsible for errors, omissions, inappropriate investment, technical problems, events beyond his control, and, more generally, financial losses that you may realize, or results obtained in the practice of trading resulting from the markets.
Trading involves a high level of financial risk, and may not be appropriate because you may experience losses greater than your deposit. Leverage can be against you.
Do not trade with capital that you can not afford to lose. You must be aware and have a complete understanding of all the risks associated with the market and trading. We can not be held responsible for any loss you incur.
Trading also involves risks of gambling addiction.
سلب مسئولیت
این اندیکاتور /کد به منظور توصیه یا توصیه رسمی سرمایهگذاری توسط سازنده طراحی نشده است ، و همچنین نباید چنین تفسیر شود.
شما اعلام می کنید که از اصول و ریسک های بازارهای مالی مطلع هستید. بنابراین، شما اعلام میکنید که از ریسکهای مالی موجود در معاملات آگاه هستید.
در نتیجه، طراح در قبال اشتباهات، خطاها ، سرمایه گذاری نامناسب، مشکلات فنی، رویدادهای خارج از کنترل خود، و به طور کلی، خسارات مالی که ممکن است متحمل شوید هیچونگه مسیولیتی ندارد
معاملات دارای سطح بالایی از ریسک مالی است و ممکن است مناسب نباشد زیرا ممکن است زیان هایی بیشتر از سپرده خود داشته باشید. اهرم می تواند علیه شما باشد.
با سرمایه ای که نمی توانید از دست بدهید معامله نکنید. شما باید آگاه باشید و درک کاملی از تمام ریسک های مرتبط با بازار و معامله داشته باشید. ما نمی توانیم در قبال ضرر و زیان شما مسئولیتی داشته باشیم.
ترید یا معامله خطرات اعتیاد به قمار را نیز در بر دارد
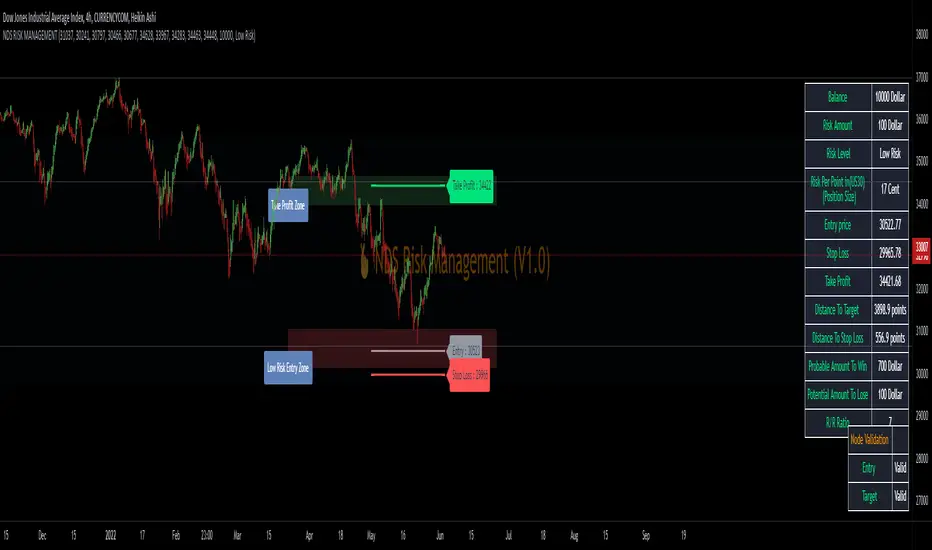
Rainbow Oscillator The Rainbow Oscillator is a technical indicator that shows prices in overbought or oversold areas. That allows you to catch the price reversal point.
---------------
FEATURES
---------------
.:: Dynamic levels ::.
The indicator levels are divided into several zones, which have a fibonacci ratio. Zones determine the overbought/oversold level. Blue and green level zones are better for buying, red and orange for selling. Dynamic levels are used as replacements for classic levels such as -100 and 100 for the CCI indicator or 30 and 70 for the RSI indicator. Dynamic levels work much better than static levels, as they are more adaptive to the current market situation.
.:: Composite oscillator (3 in 1) ::.
The main signal line of the indicator includes all three oscillators RSI, CCI, Stoch in different ratios. In the settings, you can change the proportions or completely remove one of the oscillators by setting its weight to 0
.:: CCI + RSI + Stoch ratio setting ::.
Each of the oscillators has its own weight in the calculation formula: w2 * cci ( + w1 * ( rsi - 50) + (1 - w2 - w1) * ( stoch - 50), this allows you to create the resulting oscillator from all indicators, depending on the weight of each of them. Each weight value must be between 0 and 1 so that the sum of all weights does not exceed 1.
.:: Smoothing levels and lines of the oscillator ::.
Smoothing the oscillator readings allows you to filter out the noise and get more accurate data. Level offset allows you to customize the support for inputs.
.:: Market Flat ::.
Dynamic creation of levels allows you to find in the price reversal zone, even when the price is in a flat
.:: Sources ::.
You can change the data source for the indicator to the number of longs and shorts for the selected asset. For example, BTCUSDLONGS / BTCUSDSHORTS is perfect for Bitcoin, then the oscillator will work on this data and will not use the quote price.
.:: Trend Detection ::.
The main line of the oscillator has 2 colors - green and red. Red means downtrend, green means uptrend. Trend reversal points are most often found in overbought and oversold zones.
.:: Alerts ::.
Alerts inside for next events: Buy (blue point) Sell (red point) and TrendReversal (change line color)
----------------
TRADING
—-------------
There are several possible entry points for the indicator, let's consider them all.
1) Trend reversal.
Long entry: The indicator line is in the green zone below 0 (oversold), while the line changes color from red (downward) to green (upward)
Short entry: The indicator line is in the red zone above the 0 (overbought) mark, while the line changes color from green to red.
2) Red and blue dots.
Long entry: Blue dot
Short Entry: Red Dot
I prefer to use the first trading method.
----------------
SETTINGS
----------------
.:: Trend Filter (checkbox) ::.
Use trend confirmation for red/blue dots. When enabled, the blue dot requires an uptrend, red dot requires downtrend confirmation before appearing.
.:: Use long/shorts (checkbox) ::.
Change formula to use longs and shorts positions as data source (instead of quote price)
.:: RSI weight / CCI weight / Stoch weight ::.
Weight control coefficients for RSI and CCI indicators, respectively. When you set RSI Weight = 0, equalize the combo of CCI and Stoch , when RSI Weight is zero and CCI Weight is equal to the oscillator value will be plotted
only from Stoch . Intermediate values have a high degree of measurement of each of the three oscillators in percentage terms from 0 to 100. The calculation uses the formula: w2 * cci ( + w1 * ( rsi - 50) + (1 - w2 - w1) * ( stoch - 50),
where w1 is RSI Weight and w2 is CCI Weight, Stoch weight is calculated on the fly as (1 - w2 - w1), so the sum of w1 + w2 should not exceed 1, in this case Stoch will work as opposed to CCI and RSI .
.:: Oscillograph fast and slow periods ::.
The fast period is the period for the moving average used to smooth CCI, RSI and Stoch. The slow period is the same. The fast period must always be less than the slow period.
.:: Oscillograph samples period::.
The period of smoothing the total values of indicators - creates a fast and slow main lines of the oscillator.
.:: Oscillograph samples count::.
How many times smoothing applied to source data.
.:: Oscillator samples type ::.
Smoothing line type e.g. EMA, SMA, RMA …
.:: Level period ::.
Periodically moving averages used to form the levels (zone) of the Rainbow Oscillator indicator
.:: Level offset ::.
Additional setting for shifting levels from zero points. Can be useful for absorbing levels and filtering input signals. The default is 0.
.:: Level redundant ::.
It characterizes the severity of the state at each iteration of the level of the disease. If set to 1 - the levels will not decrease when the oscillator values fall. If it has a value of 0.99 - the levels are reduced by 0.01
each has an oscillator in 1% of cases and is pressed to 0 by more aggressive ones.
.:: Level smooth samples ::.
setting allows you to set the number of strokes per level. Measuring the number of averages with the definition of the type of moving averages
.:: Level MA Type ::.
Type of moving average, average for the formation of a smoothing overbought and oversold zone

Trending Bar SRTrending Bar SR is a simple script define a Bar called "Trending Bar".
Depend on direction of Trending Bar, if Trending Bar is UpTrend then this indicator plot Bar's Low Price as Support and if Trending Bar is DownTrend then it plot Bar's High Price as Resistance.
Beside, this indicaor also plot 4 levels retracement of Trending Bar for trading.
1. Define Trending Bar
1.1 Uptrend Bar
+ Close Price higher than previous High Price
+ Body greater than sum of shadows (up and down)
+ Color: A green dot is plotted at bottom chart.
1.2 Downtrend Bar
+ Close Price lower than previous Low Price
+ Body greater than sum of shadows (up and down)
+ Color: A red dot is plotted at bottom chart.
2. Retracement Level
+ Trending Bar Retracement 0.5 is called Equerium.
+ Trending Bar Retracement 0.618 is called Perfect Entry.
+ Trending Bar Retracement 0.705 is called Optimal Entry.
+ Trending Bar Retracement 0.79 is called Max Entry.
3. Trading
+ When Price crossed Equerium, consider open position at Perfect Entry, Optimal Entry with stoploss place at Max Entry.
+ If place order at Max Entry, stoploss can place at Support or Resistance.

BloodSwing Indicator-SWING TRADING STRATEGY FOR PASSIVE TRADERS-
A Multi-timeframe Strategy
This swing trading strategy uses three moving averages pegged to the 4H timeframe, to enter and exit the market on the 1H timeframe.
The 200 EMA (4H timeframe) is used to identify areas of support. If this moving average shows signs of support (shown as green circles under candles), the 18 and 22 moving average (4hour timeframe) crossover is used to enter the market, but on the 1 hour chart (for more accuracy) and only after an increase in volume on the 1 hour timeframe has been detected.
Manually this strategy is explained as follows:
1. Look for candle support on 200 MA (4H Timeframe)
2. On the 1H chart, look for the crossover of 18 and 22 ma (4H Timeframe)
3. As soon as you see volume increase on 1H, enter.
4. Exit on cross under of 18 and 22 ma (4H Timeframe)
5. Stop Loss below 200EMA support candle low.
Signals:
- Support signals are shown as green circles under the candles
- Long, Close, Stop signals are shown as labels and can be toggled on and off.
Extras (In option menu):
MA Deviation:
A standard deviation measure used on the 200 EMA in order to provide some range for support signals to be considered valid.
Use volume expansion for entry:
As an option (on by default), you can disable volume increase as a condition for entry.
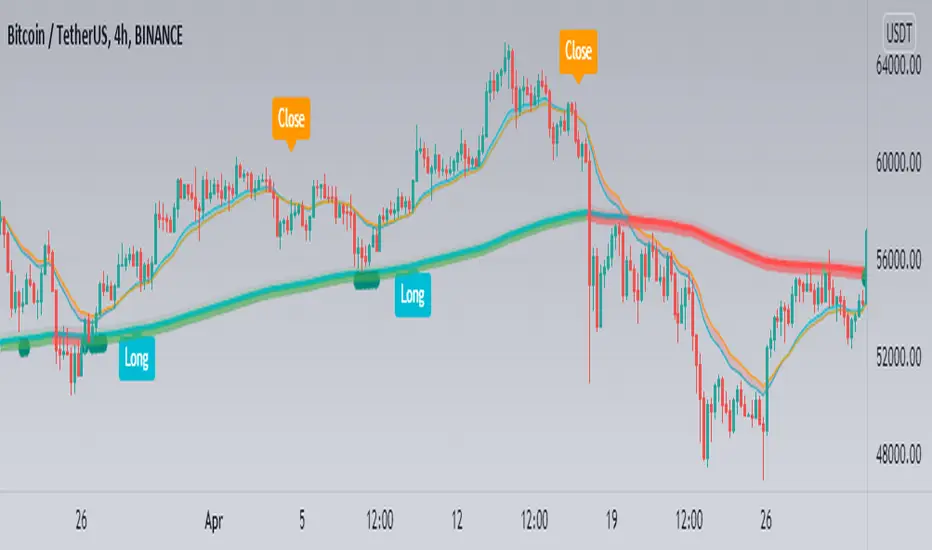
KV Box v1.0 - Buy / Sell signalKV BOX is a trading indicator. It combines Darvas box theory (developed by Nicolas Darvas), breakout strategy, multi-timeframe trading and ALMA (Arnaud Legoux Moving Averages). This indicator helps identify BUY signals when the price is in the entry zone and SELL when the price breaks out of the uptrend.
---
How to use?
KV BOX can be used in both SPOT and FUTURE (Long/Short) trading
BUY (LONG):
• Entry: When the BUY signal appears.
• Stop loss: LOWER than LOW of first and second candlestick IN THE BOX WHERE BUY SIGNAL APPEARS of 1H, 4H, 1D timeframe.
• Take profit: When the SELL signal appears.
SELL (SHORT):
• Entry: When the SELL signal appears.
• Stop loss: HIGHER than the HIGH of first and second candlestick IN THE BOX WHERE SELL SIGNAL APPEARS of 1H, 4H, 1D timeframe.
• Take profit: When a BUY signal appears.
---
Attention:
KV BOX is only displayed on 1H, 4H and 1D timeframe. 1H for short-term trades (a few days), 4H for mid-term trades (a few weeks), 1D for long-term trades (weeks to months).
---
Options setting:
- Kelvin box on: KV BOX activates
- ALMA mode on: KV BOX activation according to Arnaud Legoux Moving Average (ALMA) method
- Pinbar indicator: activate the indicator when the pinbar candlestick appears
- Supertrend: trend continuation or reversal indicator
============================
KV BOX là 1 chỉ báo mua / bán kết hợp giữa nguyên lý hộp Darvas, phương pháp phá vỡ (break out), giao dịch đa khung thời gian và đường trung bình ALMA (Arnaud Legoux Moving Averages). Chỉ báo này giúp xác định tín hiệu mua khi giá ở vùng entry và bán khi giá phá vỡ khỏi trend tăng (up trend).
---
Cách sử dụng:
KV box có thể dùng trong giao dịch SPOT và FUTURE (Long/Short).
Mua khi có tín hiệu BUY, bán khi có tín hiệu SELL.
MUA:
• Entry: Khi có tín hiệu BUY.
• Cắt lỗ: thấp hơn giá thấp nhất cùa 2 nến đầu tiên trong hộp xuất hiện tín hiệu BUY của khung 1H, 4H, 1D.
• Chốt lời: Khi có tín hiệu SELL xuất hiện.
BÁN:
• Entry: Khi có tín hiệu SELL.
• Cắt lỗ: cao hơn giá cao nhất của 2 nến đầu tiên trong hộp xuất hiện tín hiệu SELL cùa khung 1H, 4H, 1D.
• Chốt lời: Khi có tín hiệu BUY xuất hiện.
---
Chú ý:
KV BOX chỉ hiển thị trên khung 1H, 4H và 1D. 1H cho giao dịch ngắn hạn (vài ngày), 4H cho giao dịch trung hạn (vài tuần), 1D cho giao dịch dài hạn (vài tuần đến vài tháng).
---
Tùy chọn setting:
- Kelvin box on: kích hoạt KV BOX
- ALMA method on: kích hoạt KV box theo phương pháp Arnaud Legoux Moving Averages (ALMA)
- Pinbar indicator: kích hoạt chỉ báo khi xuất hiện nến pinbar đảo chiều
- Supertrend: chỉ báo xu hướng tiếp diễn hoặc đảo chiều

Trend Trigger 15 SecThe following are printed:
The FAST ma is a HULL smoothed transparent line that closely hugs the price bars. This is the trigger line. (default 9/3 length)
The MIDLINE ma is a HULL smoothed solid thick line that tries to show the short term trend and is used to confirm bias. (default 100 length)
The SLOWEST ma is a HULL smoothed transparent thicker line that tries to show the long term trend. It is not used in any calculation and only for visual aide. (default 200 length)
Every GREEN or RED tag that prints, will display the percentage change over the last 12 bars.
Every tag is the trigger that confirms:
1)The CLOSE is above the MIDLINE ma
2)The FAST ma is climbing (GREEN) or falling (RED)
3)RSI is climbing/falling and confirms direction with the FAST ma. The RSI has a length of 5 that is smoothed with a 7 period HULL.
4)The tag text will change from white to purple if the (very fast) RSI is above/equal to 85 or below/equal to 15.
5)The close is above either the last or second to last bar's close.
6)The percentage of change (of close) over the last 12 bars is more than 0.25% or less than -0.25%
Each trigger will print a stop line and targets at = 0.5x stop value, 1x stop value, 1.5x stop value, 2x stop value. These lines continue to print until the FAST ma changes direction. I use a formatted gamma box to easily overlay and extend those lines when needed.
_______________________________________________________________________________________________________________________________________________________________________________________________________________
Here is an example of the use of a gamma box to draw an actual entry. I draw set it up so that, while holding control; click on the 1st target line, then move far right and click in space so the 2nd target line ALIGNS with the pointer.
EXAMPLE:
imgur.com
GAMA BOX SETTINGS:
imgur.com
__________________________________________________________________________________________________________________________________________________________________________________________________________________
The LONG position stop value is calculated by determining the lowest low of the last 12 bars - 0.1*wma(atr(20),20).
The SHORT position stop value is calculated by determining the highest high of the last 12 bars + 0.1*wma(atr(20),20).
These calculations find the low of the last 3 minutes, extend it by a small amount, and then draws the stops and targets.
There is always a running tag that prints ahead of the current bar. It displays the percentage change in the current direction of the FAST ma. It also shows the RSI value which will turn purple if RSI is >=85 or <=15.
The circle and flag below the tag helps visually confirm the trend direction of the FAST and MIDLINE mas.
The circle colors in diction of the MIDLINE ma
The flag colors in the direction of the FAST ma.
When they are both RED, both lines confirm a SHORT entry.
When they are both GREEN, both lines confirm a LONG entry.
If you enable the PM signal, position entries will fire before 09h30m30s (coded begin time).
If you enable "backtest", prior days will show tags/targets/stops including PM times.
There is a single alarm option. It will fire for either a LONG or SHORT entry.
The alarm is listed as "SIGNAL".
Once it is armed, the alarm will show as active in the "Alerts" column, which will read: {{ticker}} {{plot_3}}% @ {{close}}
This will print (when fired):
The ticker,
The percentage of change over the last 12 bars. If the value is negative than the entry is trending DOWN, if this value is positive; than the entry is trending UP)
The price at which the alarm fired.

Altered True Strength Indicator (TSI) Reupload-
Altered TSI provides a slightly more volatile signal that demonstrates extremities in price action with greater success than standard TSI. In addition, I added bull/bear cross indicators (green/red) to make it easier to notice the crosses to save time when the market is moving fast (I couldn't find a regular TSI script with this addition). Finally, the signal also has overextension parameters (red and green lines)
I think this is best used on Intraday time frames as the signals respond to volatility very well and using Heikin Ashi candles, trend is more visual. In this particular example, I am showing SPY on the 3m time chart (my favorite short time frame) and the signal alone provided many opportunities for trades when using simple divergences and countering overextension direction when short term (blue) signal crosses either
In the first example (purple lines), SPY ramps but it was a dull signal given the signal strength flatlining- we would be looking for a short entry. When the signal fires, it provides a clean $1.50 move down in spy.
In the second example (orange), the blue signal provides a nice V shape (rebound signal) in which we are looking for a long entry. 390.50 is a strong SPY support in confluence with 2nd std dev VWAP extension, but disregarding that bull signal fires resulting in a 2 dollar move upwards. Exit is provided when blue line crosses green overextension.
In the third example (white), we are searching for a short entry at 392.5 resistance in confluence with divergently higher highs. Bear cross signal when fired and a significant cross is visible provides a $2.50 move to the downside with a potential exit provided when blue line crosses red overextension line in confluence with previous LOD area.
In the fourth example (green), we watch as the blue line provides a V pattern, we are searching for a long entry. If you didn't take a riskier long at 2nd std dev VWAP overextension with V recovery on blue line at red overextension for a ride to vwap, then you are looking for a secondary entry long as you wouldn't take the trade at resistance (vwap). Bullishly divergent lows provide this entry and the signal does not bear cross at all (but looking for significant crosses is more important even if the signal were to make a minor bear cross). Bullishly divergent double bottom provides a long entry to end of day with a nice clean signal for a $5.00 move until eod or when signal crosses overextension range.
Ideally, close to the money options or SPY/SPXS/SPXL are best used in the intraday time frame.
Again, this is not a standalone indicator but it's best used in conjunction with other indicators/trading strategies
Any questions feel free to comment

Binary Option Turbo M1 by MercalonaAuto risk
You are diving into a high-risk investment. We are not responsible for losses, the only certainty is that they will come, the most important thing is to manage them. Test this script on a demo account, and use the backtest. Make sure you are familiar with it before using real money. Use all your experience and other assistance for better accuracy. Do not risk more than 5% per day. Try to use a maximum of 1-2%.
Recommendations
It is highly recommended whenever trying to make entries in stronger areas
Try to make entries when the graph is in trend and with good movements. It is better to lose an entry than to lose money.
Check if the chart is already with good accuracy before making your entry. At least 65%.
Try to make entries when the payout is above 75%. This will help you with risk / return.
About the Script
This script was developed to identify good entry areas quickly and safely. We recommend using in binary option, where the next candle is successful. Although it can also be used in other markets, using a larger timeframe, such as 1h or 4h.
How it works?
This script is based on trends, up and down, where up trend, we look for "CAL" entries in retractions, and down trends, the entries will be "PUT". Always operate in favor of the trend for better accuracy. A session filter is also displayed. The Filter is based on the New York and London session. In these periods there is a greater market volatility, where it is recommended to operate and avoid losses. In addition, there is also a (no trend) filter. Where it shows whether the chart is volatile or not, even during open market sessions.
What is the final result?
This script will show good entries areas. These areas are represented with lines. The lines closest to the current price are thinner lines. And the lines far from price are thicker. The thick lines represent stronger areas and are resistant to price. This means that there is a greater possibility of reversal when prices touch these lines.
Settings (mode)
There are 2 configuration modes:
1. MODERATELY
2. AGGRESSIVE
Using the "MODERATELY" mode, the signals are rarer, here we expect the price to hit the best areas indicated. To place the entry. Here we expect greater accuracy.
In "AGGRESSIVE" mode, we don't expect good entries. Whenever the price hits entry areas it will be considered an entry. In this case, the accuracy is less, since the areas do not have a great potential for reversion.
Settings (Length)
Here the number of bars can be configured for the calculation of support and resistance areas. A low amount may not be enough to check for good areas. And a very large area can be confused with areas that really matter. Try to check the best quantity for the chart you want to trade.
Settings (Win Rate Limit)
Place the limit of analyzed signals in this field. It is restricted to the “Win Rate Max Bars” field, which will be explained below. If the configured limit is not reached, the cause is that there were not enough signals within the configured bar limit. ATTENTION: Understand that a high value will cause a slow calculation of the script.
Settings (Win Rate Max Bars)
This is information is used to limit the number of bars in the “Win Rate” calculation. ATTENTION: Understand that a high value will cause a slow calculation of the script.
Settings (Sessions)
There are 2 other configurations. New York session and London session. You can see how it works reading below.
Indicator “Stars of Recommendation”
The indicator has 3 stars of recommendation.
NO TRADE (There is no positive point to take chances)
In Session (At least 1 open market, this is a positive point to take chances)
In Trend (There is a good probability of assertiveness when it is on trend)
More than one identified area. (Generally, when there is more than one area, the more distant areas become stronger and stronger. This is a positive point when the price reaches them.)
Good luck ❤️
Please feedback us.
We hope this helps you!

autoTrend V4AutoTrend v4
Made for private access only.
One of the hardest things to do as a new trader is reading charts/ identifying trends. With AutoTrend, we make it easy to do just that & so much more!
The main features of AutoTrend are built-in clean buy/sell signals, trend identifier, volume spike detector & S/R lines. All of these features combined to give out clean entry/ exit points that you can be confident with taking.
AutoTrend offers extensive trend identifiers with adaptive volatility lines changing with the direction of the market enabling users to cherrypick entry points in any market condition.
How AutoTrend gives out signals is by detecting volume spikes and using our volatility cloud to give out signals. If the alert is in the green cloud, then the alert is a good entry; if it's in the red cloud, then it is not suggested that you take the signal.
We also developed a MA line to determine whether an entry is a solid entry. If the line is showing green, it means that the ticker is bullish thus making confirming the entry is a good entry. AutoTrend will only alert when these conditions are met, in which that a ticker is moving above a MA and is in the green cloud. The MA will change color accoridngly.
AutoTrend works best in time frames starting at 15min and above; anything below should be taken with caution.
Users can utilize TradingView built-in Heikin Ashi for better and easier identification of trends for any entry.
Disclaimer: AutoTrend is not a professional trading service. Anything that is stated above in or on any of our sites is to be taken for educational purposes only. AutoTrend team & staff are not liable for any losses or losses in any form. Any content that we provide on any of our sites should not be taken as financial advice. Past results are not indicative of future performances.
You can access AutoTrend on our Discord link below or DM me. :)
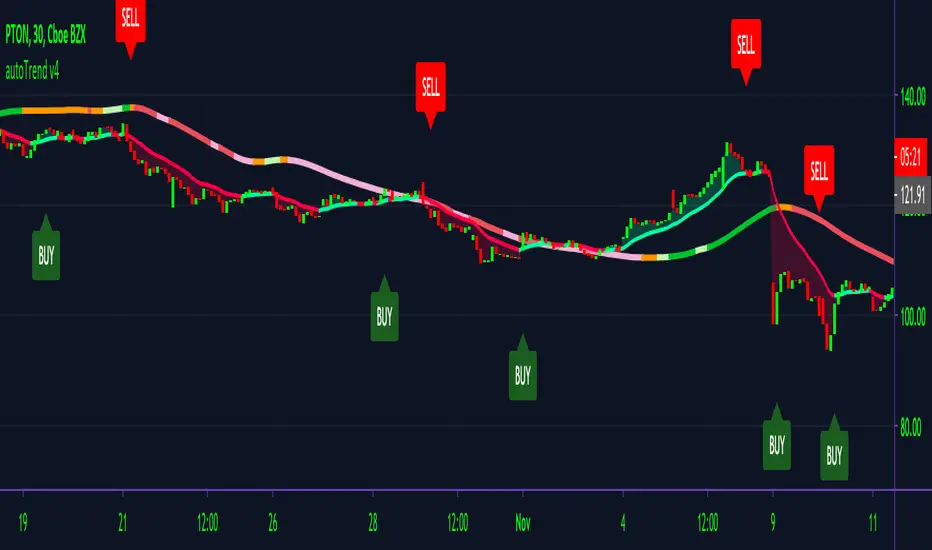
Alpha Trader v3.0Alpha Trader is a trend following strategy which identifies good time to take profit and allow trader to ride the trend with multiple re-entry points.
Features
Entry and Exit signals
Multiple Re-Entry points
Built in Risk Management
Position sizing for every entry
Alerts with Stop Loss and Position size
Strategy has built-in risk management with dynamic trailing Stop Loss and Position sizing. You just need to specify what percentage of your capital you are willing to risk on new position and re-entries.
Strategy will evaluate the maximum position you should take for specific signal.
Position and stop Loss levels are visible on alerts and when you hover over the markers on your chart.
You can set alerts for below scenarios. Alerts contain stop loss and Max position advised on a specific trade entry.
1.New Long Entry
2.New Short Entry
3.Long Re-Entry
4.Short Re-Entry
5.Long Take Profit
6.Short Take Profit
Usage
You can enter into a new position with New Long Entry/New Short Entry. Position size and Stop loss are visible on alert and signal marker on the chart. Please set your alerts on bar close.
You can take profit on Long take profit/ Short take profit signal.You can chose to close any % of your position.
You can re-enter into a position and increase your existing position on Long Re-Entry/Short Re-Entry signal. Position size and New stop loss levels are indicated on alerts or when you hover over the signal marker.
Position size can be greater than 100% with leverage. For e.g. if strategy suggest 200% as position size, you can take this position with 5x leverage and 40% of your capital. But, downside risk for every entry would be limited to your preferences.
This strategy works best on 4 hour and Daily time frames.
For Access : Contact me on TradingView.

Cyatophilum Levels [ALERTSETUP]Cyatophilum Levels - Version 1.0 - Alert setup
This indicator allows you to build your own strategy based on Fibonacci levels, and create automated alerts for long & short entries and exits.
This study also has a backtest version. See my previous script.
The Fibonacci levels are printed automatically in real time and without repainting on the chart.
You configure your own strategy in the indicator parameters. You can choose to go long or to go short, or both, on which Fib levels to enter Long/Short, and on which Fib levels to exit (up to 2 entry levels and exit levels).
Detailed Guide:
This is a guide that can be useful if you do not understand the strategy or an indicator parameter. Instructions on how to get access are at the bottom.
To configure your strategy, you need to open the indicator settings. You can either right-click on the indicator and click "settings", or click the settings button near the indicator's name.
You should know that the Fibonnaci levels are calculated from the support and resistance levels, which are calculated using the last swing high and swing low. This behavior can be tweaked in the settings with the first 2 parameters:
· Noise reduction
Dropdown menu. Options are "NONE", "SMALL", "MEDIUM", "HUGE". Used to get a smoother level behavior. The higher it is, the less often the support and resistance levels will move. Can be useful to cut off fakeouts.
· Swings lookback
This is the number of historical bars used to calculate the last swing high and swing low.
In TradingView, we usually wait bar close to validate a signal (trade entry or exit), in order to avoid repainting. But since this indicator is purely based on price action, there is an option called Alert Type if you want to receive intra-bar alerts or not.
· Entry Alert Type
2 options : "Once Per Bar Close", "Once Per Bar". These correspond to the alerts options. You must use the same alert type in the indicator settings and in the alert options. When using "Once Per Bar", the candle high and low are used for the cross conditions, otherwise, candle close is used.
· Exit Alert Type
Same but for exit alerts.
The long trades setup can be configured independantly from the short trade setup, but the parameters are the same.
■ Go Long/Short
Check this box to enable/disable long/short trades.
· Long/Short Entry Condition
Dropdown menu from which you can pick the condition for your entry. Options available are "Cross Over","Cross Under" and "Just Cross".
· Long/Short Entry 1
Dropdown menu from which you can pick the level for your entry n°1. Options available are "Support","FIB 23", "FIB 38", "FIB 50","FIB 61","FIB 78" and "Resistance".
· Long/Short Entry 2
Additional FIB level entry.
· Long/Short Exit 1
Dropdown menu from which you can pick the level for your exit. Options available are "Support","FIB 23", "FIB 38", "FIB 50","FIB 61","FIB 78" and "Resistance".
· Long/Short Exit 2
Additional FIB level exit.
■ Trend Filter
Optionnal Tilson T3 TrendLine to make the strategy go long only when price is above T3 (green) and short only when price is below (red). The length in bars is configurable.
· Configuration Panel
It should appear on the left of the chart. This panel displays the whole indicator settings in a compact and easy-to-read way. You can replicate a strategy from just this info panel. Can be turned off if needed.
· Graphic options
A red/green background corresponding to the strategy position (short/long) can be turned off.
The Fib levels labels can be turned off all at once.
Risk management:
Place your secondary exit one or two levels above/below your entry to act as a stop loss.
Availabe alerts:
To create an alert, right-click on the indicator and click "Add alert".
The LONG alerts corresponds to the green labels on chart, while the SHORT are in red.
Select one of the following signals in order to create your strategy:
· LONG/SHORT ENTRY : Alert to enter a long/short. Make sure to select "Once Per Bar" or "Once Per Bar Close" according to the "Entry Alert Type" parameter.
· LONG/SHORT EXIT : Alert to exit a long/short. Make sure to select "Once Per Bar" or "Once Per Bar Close" according to the "Exit Alert Type" parameter.
Default settings are set for 15m.
Use the link below to obtain access to this indicator
